Abstract
Background: High-dose ionizing radiation (IR) (>0.5 Gy) is an established risk factor for cognitive impairments, but this cannot be concluded for low-to-moderate IR exposure (<0.5 Gy) in adulthood as study results are inconsistent. The objectives are to summarize relevant epidemiological studies of low-to-moderate IR exposure in adulthood and to assess the risk of non-cancerous CNS diseases. Methods: A systematic literature search of four electronic databases was performed to retrieve relevant epidemiological studies published from 2000 to 2022. Pooled standardized mortality ratios, relative risks, and excess relative risks (ERR) were estimated with a random effect model. Results: Forty-five publications were included in the systematic review, including thirty-three in the quantitative meta-analysis. The following sources of IR-exposure were considered: atomic bomb, occupational, environmental, and medical exposure. Increased dose-risk relationships were found for cerebrovascular diseases incidence and mortality (ERRpooled per 100 mGy = 0.04; 95% CI: 0.03–0.05; ERRpooled at 100 mGy = 0.01; 95% CI: −0.00–0.02, respectively) and for Parkinson’s disease (ERRpooled at 100 mGy = 0.11; 95% CI: 0.06–0.16); Conclusions: Our findings suggest that adult low-to-moderate IR exposure may have effects on non-cancerous CNS diseases. Further research addressing inherent variation issues is encouraged.
1. Introduction
Recent decades have seen an increase in the exposure of the overall population to ionizing radiation (IR), especially due to the widespread use of medical imaging procedures in economically developed countries [1]. Nowadays, the average annual effective IR-dose is estimated to be around 3.0 millisievert (mSv) per person, including 20% from medical exposure [2]. The latter tends to have increased from year to year due to the use of new technological imaging from around 0.3 mSv in 1993 to 0.6 mSv in 2021 [2].
The adverse health effects following exposure to IR have been the subject of a large amount of scientific research, mainly focusing on carcinogenic risks [3]. However, several epidemiological studies have highlighted the non-cancerous detrimental impact of high or moderate IR doses on the central nervous system (CNS) [4,5,6], and radiation-induced cognitive injury is becoming an increasingly important research subject [7,8]. Non-cancerous CNS disorders are a large and complex group of diseases, including mental and behavioral disorders, diseases of the CNS, and trauma, and they have multifactorial origins. The Institute for Health Metrics and Evaluation estimates that in 2019, 970 million people suffered from a mental disorder and 2.7 billion people had neurological disorders [9]. In addition to the negative consequences of these pathologies on individual well-being, these disorders cost several trillion U.S. dollars each year in the global economy.
Neurodevelopmental effects of high doses of IR exposure during childhood are well established, but the extent to which these effects exist in the low-to-moderate-dose range is unclear [10]. For this reason, most studies have investigated the impact of low-to-moderate IR doses (<0.5 Gy) on cognitive functions, when exposure occurred in utero or during childhood, but findings remain inconsistent, particularly in view of the large number of assessment tools and scales available to assess neurocognitive disorders [10]. In contrast, few studies have considered these outcomes when exposure occurred in adulthood [11]. It has been suggested that low-dose IR exposure during adulthood could enhance the incidence of certain neurodegenerative diseases, such as Parkinson’s disease [12] and cerebrovascular diseases [13].
A relevant point is that experimental studies in rodents can help detect cognitive effects that may occur after IR exposure (doses ≤ 1 Gy) in adulthood, although the translation of data from animal experiments to humans is challenging. Some forms of memory and social interaction can be impaired after acute [14,15,16,17,18] or chronic [19] exposures in adult rodents. Moreover, internal acute or chronic exposure to uranium, using different routes of exposure, can also have a deleterious impact on certain forms of memory [20,21,22,23], and an effect of the enriched form of uranium is more deleterious compared with depleted uranium [22]. Furthermore, few hours after low-dose (<0.1 Gy) brain IR exposure, the downregulation of molecular neural pathways associated with cognitive decline and Alzheimer’s disease has been observed in adult mice [24]. Altogether, these experimental data suggest that low-to-moderate doses of IR in adulthood can impact neurocognitive functions in rodents under certain conditions and highlight the need to investigate further the potential effects of this type of exposure, particularly in humans.
Thus, the objectives of the present systematic review are to (1) identify pertinent studies, synthesize their results, and draw evidence-based conclusions from epidemiological studies carried out on the risk of non-cancerous CNS diseases (e.g., cerebrovascular, neurological, and psychiatric diseases, such as neurodegenerative, mental, and behavioral disorders), in adults exposed to low-to-moderate doses of IR (<0.5 Gy), and (2) to provide a quantitative summary of the overall risk estimate using meta-analysis.
2. Methods
This literature review and synthesis were guided by the Preferred Reporting Items for Systematic Review and Meta-Analyses (PRISMA) guidelines (Table S1), and the protocol was recorded in the PROSPERO database (registration number: CRD42021283245).
2.1. Data Source and Search
An online literature search was conducted in May 2022 in PubMed, Scopus, Web of Science, and Google Scholar databases. A first query included a combination of outcome, exposure, and population keywords: (neuro * OR nervous OR cognit * OR Parkinson OR Alzheimer OR brain OR cerebro * OR dementia OR schizophrenia OR cerebrovascular) AND (ionizing radiation OR medical radiation OR cosmic radiation OR nuclear OR radon OR background radiation) AND (patient * OR human OR worker OR cohort OR epidemiolog *). Subsequently, additional queries were used to complete this previous one in order to identify studies without the keywords in the title or abstracts: cosmic radiation AND mortality OR incidence; (nuclear worker OR nuclear facility OR nuclear industry) AND mortality OR incidence; ionizing radiation AND mortality OR incidence. Subsequently, additional articles were searched from the references cited by relevant publications and international reports. Duplicates from the different databases were removed.
For the selection process, we proceeded as follows: (1) the articles obtained through the queries were screened on title; (2) the abstracts of the selected articles were read, and a further selection was performed; (3) the articles were selected on the full-text screening. The selection was carried out by two independent investigators (J.L. and C.B.), whereas a third investigator (M.-O.B.) made a decision in the case of disagreement.
2.2. Inclusion and Exclusion Criteria
Eligible studies were cohort, case–control, and cross-sectional studies, published in English from January 2000 to May 2022. The publication period criterion allows for the inclusion of studies whose radiation exposure reflects the improvement in radiation protection regulations and the decrease in doses received by medical professionals [25]. Furthermore, older good-quality studies are regularly updated and would be found as their last updated publication. All the studies focused on external (e.g., gamma rays, X-rays, cosmic rays) or internal (e.g., uranium, plutonium, radon) exposures to low-to-moderate doses of IR (mean: 0.5 Gy) occurring during adulthood or adolescence (at least 16 years old) as companies involved in some of the studies included in this work allowed for work at 16 or older. Incidence and/or mortality of three categories of non-cancerous CNS diseases, identified with the International Classification of Diseases (ICD), Revision 9/10 [26], were studied in this work: diseases of the nervous system (ICD-9: 320–389/ICD-10: G00–G99), cerebrovascular diseases (ICD-9: 430–438/ICD-10: I60–I69), and mental and behavioral disorders (ICD-9: 290–319/ICD-10: F00–F99). Studies that did not report an ICD classification but referred to “diseases of the nervous system”, “cerebrovascular diseases”, and “mental and behavioral disorders” to describe their outcomes of interest were also investigated and classified in the groups mentioned above, respectively. The definitions of the ICD codes are provided in the Supplementary Materials (Table S2).
Conference abstracts, reports, meta-analyses, letters, and ecological studies were excluded, as well as studies where exposure information was based on self-reports or questionnaires about IR exposure (e.g., “How many dental X-rays have you been exposed to in your lifetime?”). However, the references of these excluded studies were checked to retrieve potential studies that met the inclusion criteria of the present review. In the case of publications on overlapping populations or study updates, only data from the most complete study were considered.
2.3. Quality Assessment of Individual Studies
The Newcastle Ottawa Scale (NOS) was used for quality assessment of the epidemiological studies included in this review [27], which is usually used in systematic review process. This evaluation is based on eight items, which are categorized into three groups: selection of study groups, comparability of groups, and ascertainment of exposure or outcome of interest, for case–control or cohort studies. Stars are attributed to each item depending on the quality, and a score (0 to 9) is obtained by adding the stars of each item. A study with an average NOS score of at least 6 stars out of 9 is considered as having good quality.
2.4. Statistical Analysis
Estimates of measures of risk such as relative risk (RR), hazard ratio (HR), odds ratio (OR), or standardized mortality ratio (SMR) and measures of risk by unit of dose such as excess relative risk (ERR) were extracted from each study when available. Meta-analyses for each outcome were performed if at least a sufficient number (at least 3) of studies were available.
We calculated pooled SMR (SMRpooled) and pooled RR estimates (RRpooled) and their 95% confidence interval (CI) using the DerSimonian and Laird random-effects model [28] to account for within- and between-study heterogeneities.
An alternative DerSimonian and Lair-based model proposed by Richardson et al. (2020) was used to estimate the pooled effect of ERRs [29]. This method for meta-analysis of published results from linear relative risk models uses a parametric transformation of published results to improve on the normal approximation used to assess confidence intervals. This approach provides less biased summary estimates with better confidence-interval coverage than the summary obtained using the more classical approach to meta-analysis.
Heterogeneity across studies was tested using Cochran’s Q test at p < 0.1 and quantified using I2 statistics. The latter reflects the proportion of total variance estimated to be attributable to between-study heterogeneity. Heterogeneity was considered as null, low, moderate, and high for I2 values < 25, 25–50, 50–75, and >75%, respectively. In the case of heterogeneity, sensitivity analyses in which the pooled result was calculated by excluding each study and each group of workers in turn were performed. Sensitivity analyses were also performed, removing studies that did not mention ICD coding in the outcome definition. Publication and selection biases were assessed and tested using the Egger test. Statistical significance was defined by p < 0.05.
Statistical analyses were conducted with the R 3.6.3 software (R Foundation for Statistical Computing, Vienna, Austria) using the metafor and Metaan packages.
3. Results
From the 14,474 articles retrieved, 2063 were excluded as being duplicates and 12,411 were screened based on the title, which led to the review of 556 abstracts. Finally, 198 articles were read in full, of which 38 were selected. Briefly, full texts were excluded because of overlaps (58 studies), outcome not in the scope of the review (72 studies), study design not meeting inclusion criteria (24 studies), or for other reasons (6 studies, for a combination of several exclusion criteria). Seven additional articles were identified from bibliographic references of the retrieve articles, thus leading to forty-five articles finally included in the systematic review. Of those, 33 presented quantitative results that could be included in the meta-analyses (Figure 1). The characteristics and NOS score assessments of the 45 articles included in the present review are detailed in Table 1. There were forty cohort studies, one case–control study, and four cross-sectional studies. Most of the studies investigated non-cancerous CNS diseases in relation to occupationally exposed workers (forty-two studies), while others addressed environmental exposure (one study), evacuees from Chernobyl (one study), or patients exposed for medical purposes (one study).
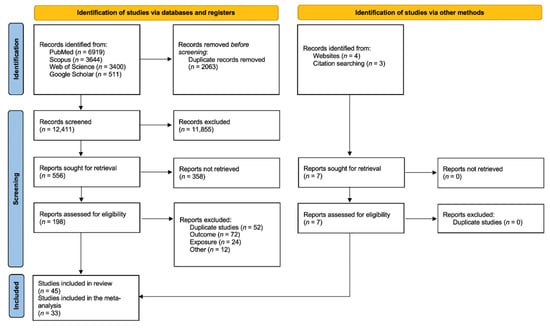
Figure 1.
Preferred Reporting Items for Systematic Reviews and Meta-Analyses 2020 flow diagram for new systematic reviews which included searches of databases, registers, and other sources.

Table 1.
Characteristics of the included studies.
3.1. Diseases of the Nervous System (ICD-10: G00–G99)
Key findings of the 21 studies focusing on diseases of the nervous system can be found in Table 2.
Table 2.
Key findings of the included studies on diseases of the nervous system.
3.1.1. Nuclear Workers and Uranium Miners
Out of the 21 studies that considered this outcome, 13 were on nuclear workers and uranium miners. The majority of them did not report any statistically significant results, whether the authors compared the mortality of workers to that of an external reference population (SMR) or they assessed dose–response relationships (ERR) [33,35,36,39,42,44,46].
In a cohort of 4977 U.S. mound workers potentially exposed to external or internal (polonium-210, plutonium isotopes, or tritium) radiation (mean dose from external radiation: 26.1 mSv; max: 939.1 mSv; mean lung dose from external and internal radiation combined: 100.1 mSv; max: 17.5 Sv; mean liver dose from external and internal radiation: 34.6 mSv; max: 2.3 Sv), the mortality due to diseases of the nervous system was not different from that of the general population, regardless of the radiation status of the workers or the type of radionuclides for those with intakes, but a positive trend was suggested as SMRs increased with increasing categories of occupational cumulative dose primarily due to photons (p = 0.03) [42]. In a cohort of 26,328 Los Alamos National Laboratory workers exposed to a combination of photons, neutrons, tritium, and plutonium (among which 17,053 workers were monitored for a combination of external and internal sources for plutonium; brain radiation absorbed dose: mean: 11.6 mGy; max: 760 mGy), Boice et al. (2021) reported among the whole cohort a non-significant SMR for nervous system diseases compared with national rates based on 815 deaths, but a borderline significant increase in mortality due to Parkinson’s disease was observed (SMR = 1.16; 95% CI: 1.00, 1.34; ndeaths = 193), and a positive dose–response relationship was suggested (ERR at 100 mGy = 0.16; 95% CI: −0.07, 0.40; ndeaths = 273) [33]. In a cohort of 22,377 Mayak workers exposed to chronic IR (mean cumulative dose from external gamma rays absorbed in the brain: 0.46 Gy (max: 8.01 Gy) for men and 0.36 Gy (max: 6.14 Gy) for women), a statistically significant linear association was found between the incidence of Parkinson’s disease and cumulative gamma dose after adjusting for sex and attained age (ERR per Gy = 1.02; 95% CI: 0.59, 1.63; ndiseases = 300) [12]. A significant decrease in mortality was reported among 53,698 U.S. nuclear power plant industry workers (mean cumulative dose: 25.7 mSv) compared with the U.S. general population (SMR= 0.50; 95% CI: 0.31, 0.77; ndeaths = 20), whereas a positive and statistically significant, but highly imprecise, dose–response relationship was observed (ERR per Sv= 46.8; 95% CI: 1.51, 242; ndeath = 20) [49]. Later, Boice et al. (2021) also reported a significant decrease in mortality from diseases of the nervous system compared with national rates in 135,193 U.S. nuclear power workers (mean dose to the brain: 33.2 mGy; max: 0.83 Gy) (SMR = 0.82, 95% CI: 0.76, 0.89; ndeaths = 673), and the authors observed a positive non-significant dose–response relationship for Parkinson’s disease mortality (ERR at 100 mGy = 0.24; 95% CI: −0.02, 0.50; ndeaths = 140) [32].
In studies on uranium miner, miller, or processing workers, inconsistent results were observed, as a significantly increased mortality from diseases of the nervous system was observed in 2,930 uranium miners and millers of Grants (New Mexico) potentially exposed to radon, radon decay products, uranium dust and mill products (exposure assessment: NA) compared with the general U.S. population (SMR= 1.60; 95% CI: 1.01, 2.39; ndeaths = 23) [47], while a significantly decreased mortality was found in 16,236 male Eldorado uranium workers exposed to gamma rays (dose: 52.2 mSv) or/and radon decay products (100.2 WLM) compared with the general Canadian male population (SMR = 0.66; 95% CI: 0.51, 0.85; ndeaths = 61) [45] and in 35,204 male underground uranium miners of the WISMUT AG exposed to radon (mean: 364 WLM) or/and crystalline silica (mean: 7.6 mg/m3 years) compared to the general male population in Eastern Germany (SMR = 0.73; 95% CI: 0.62, 0.85; ndeaths = 163) [34].
3.1.2. Nuclear Weapons Test Participants
Concerning nuclear weapons test participants, a significant decrease in mortality from diseases of the nervous system was observed among 114,270 male U.S. military participants in atmospheric tests in Nevada and the Pacific from 1945 to 1962 (mean NuTRIS film badge gamma radiation dose: 6 mSv; max: 908 mSv) compared to the general male population of the U.S. (SMR = 0.84; 95% CI: 0.81, 0.88; ndeaths = 1871) [53]. The 10,983 male Australian participants in the British nuclear tests conducted in Australia between 1952 and 1957 (mean radiation exposure: 2.8 mSv; max > 50 mSv) showed similar mortality to that of the general male population for diseases of the nervous system (SMR = 1.02; 95% CI: 0.78, 1.32; ndeaths = 59), but showed a non-significantly higher mortality for motor neuron disease (SMR = 1.24; 95% CI: 0.71, 2.02; ndeaths = 16) [54].
3.1.3. Chernobyl Cleanup Workers
Rahu et al. (2014) reported an increased risk of diseases of the nervous system in a cohort of 3680 Estonian Chernobyl cleanup workers recruited between 1986 and 1991 to the Chernobyl area by the Soviet authorities for decontamination, building, and other related activities compared to a population-based cohort of 7631 unexposed Estonian men (RR = 1.13, 95% CI: 1.06, 1.21) [70]. However, the accuracy of the diagnosis and the representativeness of the unexposed cohort are an issue of this study.
3.1.4. Medical Workers
In a cohort of 109,019 U.S. medical and associated radiation workers exposed to X- and gamma rays (mean cumulative absorbed dose to the brain: 18.9 mGy; max: 1.08 Gy), monitored between 1965 and 1994 and followed-up until 2016, a significant decrease in mortality from diseases of the nervous system (SMR = 0.72; 95% CI: 0.65, 0.78; ndeaths = 471) was found, but not for mortality from Parkinson’s disease (SMR= 0.82; 95% CI: 0.66, 1.02; ndeaths = 84) when compared with the general population, and a non-significant positive dose response for Parkinson’s disease was found (ERR at 100 mGy = 0.17; 95% CI: −0.20, 0.54; ndeaths = 87) [58]. Furthermore, no significant increase in mortality from diseases of the nervous system nor for Alzheimer’s disease was found among 34,912 U.S. male radiologists (exposure assessment: NA) when compared to 47,497 male psychiatrists or to the general population (including both men and women) [62], and no increased risk of mortality from diseases of the nervous system was shown in 41,486 male U.S. physicians who had performed fluoroscopy-guided interventional procedures (FGIP) (exposure assessment: NA) compared to 46,846 male psychiatrists [61]. However, mortality due to degenerative diseases of the nervous system (ICD-9: 331.1–337.9/ICD-10: G31–G32) appeared higher in U.S. radiologists (exposure assessment: NA) compared to the general population (SMR = 1.50; 95% CI: 1.09, 1.90; ndeaths = 53) and compared to psychiatrists (RR = 1.39; 95% CI: 0.96, 2.01) even if it was not statistically significant in the latter case [62]. An increased risk of mortality from diseases of the nervous system was found in a cohort of 27,011 medical X-ray workers employed between 1950 and 1980 (average radiation exposure for the workers employed until 1969: 551 mGy; employed between 1970 and 1980: 82 mGy) in China compared to a group of 25,782 non-exposed medical specialists (RR = 2.10; 95% CI: 1.20, 3.10) [64]. On the other hand, a significant decrease in mortality from disease of the nervous system was reported among male diagnostic medical radiation workers (exposure assessment: NA) in South Korea compared with the general population (SMR = 0.54; 95% CI: 0.33, 0.88; ndeaths = 16) [60].
3.1.5. Overall Meta-Analyses among Occupational Studies
An overall SMR was calculated based on the 16 articles presented above. A decrease in mortality due to nervous system diseases was found (SMRpooled = 0.86; 95% CI: 0.79, 0.93), with high heterogeneity between studies (Q = 65.23, p < 0.0001) and no publication bias (p = 0.91), but with a high percentage of variation across studies that is due to heterogeneity rather than chance (I2 = 77.02%) (Figure 2). Sensitivity analyses where studies or different workers groups were excluded one by one were conducted with persistent heterogeneity each time, as well as sensitivity analyses in which studies that did not report ICD codes were removed.
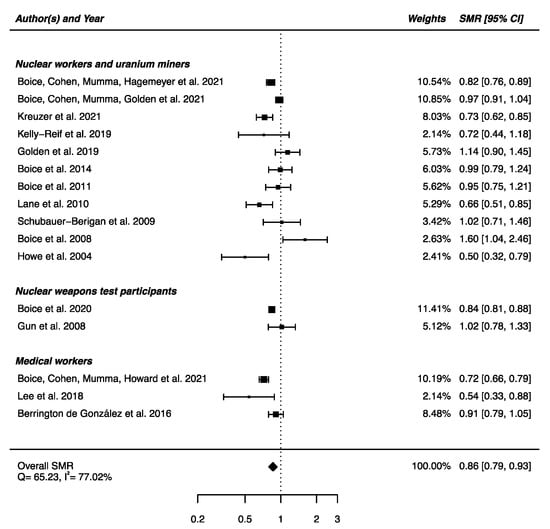
Figure 2.
Standardized mortality ratio (SMR) and 95% confidence interval (CI) for mortality from diseases of the nervous system in IR-exposed populations compared with general populations as reference.
Regarding internal comparison, a RRpooled was computed from three studies (all including medical radiation workers [61,62,64]), showing no increased risk of death due to nervous system diseases in IR-exposed people compared to unexposed controls (RRpooled = 1.17; 95% CI: 0.85, 1.61), with high heterogeneity (Q = 9.38, p = 0.009), I2 = 78.67%, and no suspected publication bias (p = 0.21) (Figure 3).
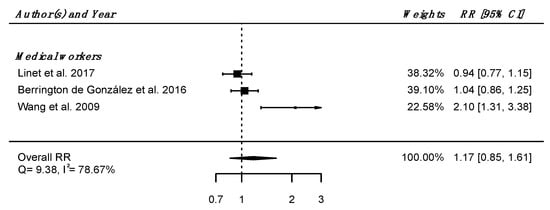
Figure 3.
Relative risk (RR) and 95% confidence interval (CI) for mortality from diseases of the nervous system and sense organs in the reviewed studies among IR exposed populations compared with unexposed controls.
Regarding the three studies reporting SMR for Parkinson’s disease [32,33,58] a SMRpooled was computed, showing no significant overall difference in mortality from Parkinson’s disease between the IR-exposed populations presented above and the general populations (SMRpooled = 0.96; 95% CI: 0.78, 1.18), with moderate heterogeneity (Q = 8.64, p = 0.013), I2 = 78.86% and no publication bias (p = 0.34) (Figure 4).
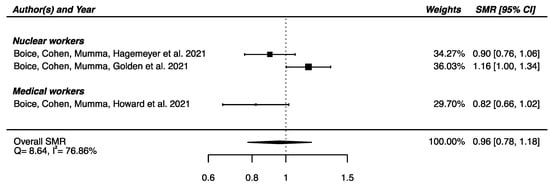
Figure 4.
Standardized mortality ratio (SMR) and 95% confidence interval (CI) for mortality from Parkinson’s disease in IR-exposed populations compared with general populations as reference.
A pooled ERR at 100 mGy from four studies assessing the dose–response relationship between IR exposure and Parkinson’s disease mortality [32,33,58] and incidence [12] was calculated, showing a significant positive ERR (ERRpooled at 100 mGy = 0.11; 95% CI: 0.06, 0.16) with no heterogeneity (Q = 1.37, p = 0.71), I2 = 0.00%, and no publication bias (p = 0.13) (Figure 5). A sensitivity analysis was conducted by performing a meta-analysis containing only mortality data [32,33,58], and the result was consistent with the one presented above (ERRpooled at 100 mGy = 0.19; 95% CI: 0.04, 0.36). It is noted that the ERR in each of the four studies were individually adjusted on sex and age, with a 10-year lag (Table 2).
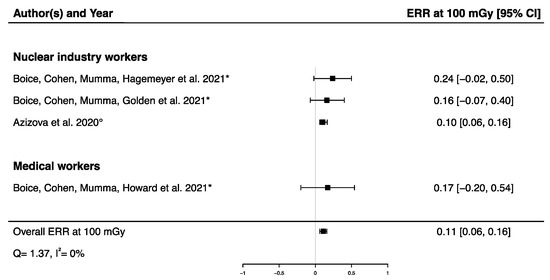
Figure 5.
Excess relative risk (ERR) at 100 mGy and 95% confidence interval (CI) for morbidity and mortality from Parkinson’s disease in relation to IR exposure (° incidence; * mortality).
3.2. Cerebrovascular Diseases (ICD-10: I60–I69)
Key findings of the 39 studies focusing on cerebrovascular diseases can be found in (Table 3).
Table 3.
Key findings of the included studies on cerebrovascular diseases.
3.2.1. Nuclear Workers and Uranium Miners
Of the 39 studies retrieved that investigated cerebrovascular diseases, 20 focused on nuclear industry workers, of which 5 reported no difference in the mortality of IR-exposed workers compared to the mortality in the reference population [36,37,38,46,47] and 8 reported a decreased mortality compared to general population [32,33,35,40,42,44,45,49], whereas Kreuzer et al. (2021) reported a higher mortality in a cohort of male underground miners compared to the general population (SMR = 1.33; 95% CI: 1.26, 1.41; ndeaths = 1335) [34]. When using internal comparison, Gillies et al. (2017) reported a significant positive dose–response relationship for mortality due to cerebrovascular diseases in the international pooled study of radiation workers from the U.K., U.S., and France comprising 308,297 workers (INWORKS cohort) (mean dose: 0.025 Sv) (ERR per Sv = 0.49; 90% CI: 0.11, 0.92; ndeaths = 4399) [39]. A significant positive dose–response relationship for mortality due to cerebrovascular diseases was also found in the last update of the U.K. cohort within the INWORKS analyses composed of 166,812 nuclear workers (median dose: 3.1 mSv) (ERR per Sv = 0.57; 95% CI: 0.00, 1.31; ndeaths = 3219) [31]. Boice et al. (2021) did not find a statistically significant relationship between cumulative dose and mortality from cerebrovascular diseases among the Los Alamos National Laboratory cohort (ERR at 100 mGy = −0.11; 95% CI: −0.35, 0.12; ndeaths = 871) [33]. Azizova et al. (2014) did not report significant associations between external (mean total dose (95% percentile) from external gamma rays: 0.54 Gy (2.21Gy) for men and 0.44 (1.87 Gy) for women) (ERR per Gy = 0.05; 95% CI: −0.03, 0.16; ndeaths = 632) nor internal (mean total absorbed alpha-particles dose (95% percentile) to the liver from incorporated plutonium: 0.23 Gy (0.89 Gy) for men and 0.44 Gy (1.25 Gy) for women) (ERR per Gy = 0.17; 95% CI: NA, 0.56; ndeaths = 1650) radiation exposure and mortality from cerebrovascular diseases among a cohort of 22,377 Russian Federation Mayak nuclear workers [41]. However, in the last update of the latter cohort, significant positive dose–response relationships were found between external (ERR per Gy = 0.39; 95% CI: 0.31, 0.48) and internal (ERR per Gy = 0.32; 95% CI: 0.16, 0.51) radiation exposure and the incidence of cerebrovascular diseases [30].
In studies on uranium miners, the five retrieved studies yielded dose–response analysis results, and only the French cohort consisting of 5400 workers reported an association between cumulative radon decay products exposure (mean: 35.1 WLM) and cerebrovascular diseases mortality (ERR per 100 WLM = 0.42; 95% CI: 0.04, 1.04; ndeaths = 105) [38], whereas the others did not [34,40,45,48].
3.2.2. Nuclear Weapons Test Participants
Regarding nuclear weapons test series, a higher risk of mortality for cerebrovascular diseases was found in 21,357 servicemen and male civilians who participated in the U.K.’s atmospheric nuclear weapon tests and experimental programs compared with 22,312 controls (RR = 1.12; 95% CI: 1.03, 1.21), but mortality in this cohort was not significantly different than in the general population (SMR = 0.91; 95% CI: 0.85, 0.97; ndeaths = 816) [52]. Decreased mortality due to cerebrovascular diseases was reported among U.S. military participants compared to the general population (SMR = 0.86; 95% CI: 0.83, 0.89; ndeaths = 3161) [53] and among Australian participants to the British nuclear test in Australia compared with the general population (SMR = 0.86; 95% CI: 0.76, 0.98; ndeaths = 243) [54].
3.2.3. Chernobyl Cleanup Workers
An increased risk of acute (RR = 1.40; 95% CI: 1.30, 1.50) and chronic (RR = 1.23; 95% CI: 1.00, 1.50) cerebrovascular diseases was shown in 198 Ukrainian Chernobyl liquidators (mean external dose exposure: 456 mSv) compared to 42 controls exposed to <50 mSv [65]. Among 957 evacuees from the 30 km zone of Chernobyl aged 18–60 years at the time of the accident, a significantly increased risk of cerebrovascular diseases was reported in those with a thyroid 131I dose of 0.31–0.75 Gy compared to those with a dose below 0.30 Gy (RR = 2.16; 95% CI: 1.45, 3.22) [66]. A statistically significant dose–response relationship was reported between external gamma doses and the incidence of cerebrovascular diseases among 53,772 male Russian Chernobyl emergency workers who arrived in the zone of the Chernobyl accident within the first year after it (26 April 1986–26 April 1987) and who were followed from 1986 to 2012 (mean external whole body dose: 0.161 Gy; max: 1.42 Gy) (ERR per Gy = 0.45; 95% CI: 0.28, 0.62; ndiseases = 23,264) [67], whereas the risk of cerebrovascular diseases in an Estonian cohort of Chernobyl cleanup workers was not statistically different from an unexposed comparison cohort of 7631 men (RR = 1.05; 95% CI: 0.91, 1.20) [70].
3.2.4. Flight Attendants
A pooled cohort of 93,771 crew members from 10 countries (exposure assessment: NA) reported a decrease in cerebrovascular diseases mortality among the cockpit crew (SMR = 0.50; 95% CI: 0.41, 0.62; ndeaths = 132) and female cabin crew (SMR = 0.47; 95% CI: 0.33, 0.67; ndeaths = 45) but not among male cabin crew (SMR = 0.77; 95% CI: 0.53, 1.09; ndeaths = 45) compared to that of the general population [55]. Along with the results presented above, Yong et al. showed a decrease in cerebrovascular diseases mortality among 5964 U.S commercial cockpit crew members (pilots and flight engineers) (mean annual cosmic radiation dose: 1.4 mSv (max: 2.8 mSv)) (SMR = 0.61: 95% CI: 0.50, 0.74; ndeaths = 108) compared to the general population [56].
3.2.5. Medical Workers
A decrease in mortality due to cerebrovascular diseases was reported in U.S. medical and associated radiation workers (SMR = 0.62; 95% CI: 0.57, 0.68; ndeaths = 462) [58], in 80,837 Korean diagnostic medical radiation workers (exposure assessment: NA) (SMR = 0.37; 95% CI: 0.29, 0.49; ndeaths = 55; for men only) [60], in U.S. physicians likely to have performed FGIP (exposure assessment: NA) (SMR = 0.42; 95% CI: 0.36, 0.49; ndeaths = 173) [61], and among 43,763 U.S. radiologists (exposure assessment: NA) (SMR = 0.52; 95% CI: 0.45, 0.60; ndeaths = 242) [62], all compared to general populations. However, when physicians likely to have performed FGIP were compared to psychiatrists, no difference in mortality risk was observed (RR = 0.91; 95% CI: 0.75, 1.09) [61]. Additionally, using an internal comparison, Berrington de González et al. (2016) found a significant decrease in mortality from cerebrovascular diseases in U.S. female radiologists compared to female psychiatrists (RR = 0.28; 95% CI: 0.08, 0.92), but a higher risk of mortality from cerebrovascular diseases among male radiologists compared with male psychiatrists in the category of graduates before 1940 (RR = 1.49; 95% CI: 1.11, 2.01) [62]. An increased mortality risk due to cerebrovascular diseases was also observed among X-ray workers in China compared to non-exposed medical specialists (RR = 1.40; 95% CI: 1.20, 1.50) [64]. Furthermore, Rajaraman et al. (2016) observed a 34% increase in stroke incidence in technologists who performed FGIP procedures (exposure assessment: NA) compared to those who never performed these procedures (HR = 1.34; 95% CI: 1.10, 1.64), but no impact on stroke mortality was reported (HR = 1.22; 95% CI: 0.85, 1.73) [63]. However, no significant dose–response relationships between occupational IR exposure and cerebrovascular diseases mortality among U.S. medical radiation (ERR at 100 mGy = 0.04; 95% CI: −0.16, 0.23; ndeaths = 462) [58], nor between occupational IR exposure and cerebrovascular disease incidence among 11,500 Korean diagnostic medical radiation workers (mean cumulative heart dose: 10.2 mGy) (ERR at 100 mGy = 3.10; 95% CI: −0.75, 11.59; ndiseases = 109), were reported [59].
3.2.6. Medical Patients
In the only available study on patients, there was no significantly increased risk of cerebrovascular diseases mortality among a cohort of 77,275 tuberculosis patients in Canada and Massachusetts according to X-ray fluoroscopic diagnostic repeated exposures (ERR per Gy = 0.441; 95% CI: −0.119, 1.090; ndeaths = 1561 for cumulative doses restricted to 0–0.5 Gy) [73].
3.2.7. Atomic Bomb Survivors
A statistically significant positive dose–response relationship was found between weighted colon doses (radiation doses from 0 to >3 Gy, 86% received <0.2 Gy) and death from stroke in the 86,611 Life Span Study cohort members (ERR per Gy = 0.09; 95% CI: 0.01, 0.17; ndeaths = 9622) [51].
3.2.8. Environmental Radiation
Only one study among those included in this review focused on indoor radon exposure, and it found a slight but significant association with indoor radon level towards an increased incidence of stroke among a South Korean cohort of 28,557 selected inhabitants based on demographic criteria and aged over 40 years (OR = 1.004; 95% CI: 1.001, 1.007) [57].
3.2.9. Overall Meta-Analyses
From the 23 studies reporting SMRs, an SMRpooled was computed showing a statistically significant lower mortality from cerebrovascular diseases in IR-exposed populations compared with general populations (SMRpooled = 0.70; 95% CI: 0.62, 0.80), with high heterogeneity (Q = 672.95, p < 0.0001), I2 = 96.73%, and a publication bias (p = 0.03), suggesting that small studies with negative results were published less often (Figure 6). Sensitivity analyses where studies or different worker groups were excluded one by one resulted in no change in heterogeneity, as well as sensitivity analyses in which studies that did not report ICD codes were removed.
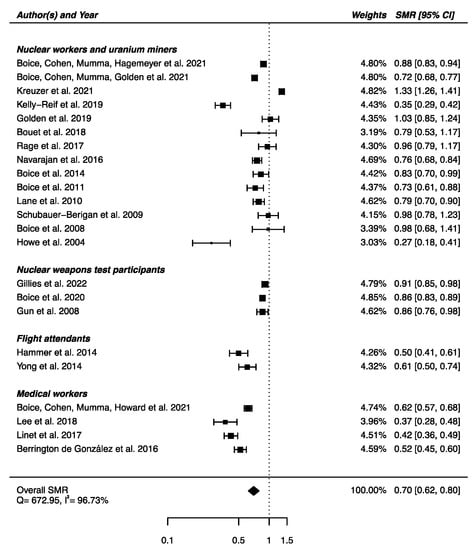
Figure 6.
Standardized mortality ratio (SMR) and 95% confidence interval (CI) for mortality from cerebrovascular diseases in IR exposed populations compared with general populations as reference.
The meta-analysis performed on the four studies with available RRs (one on nuclear weapons test participants [52] and the others on medical workers [61,62,64]) yielded a non-significant higher risk of death from cerebrovascular diseases in IR-exposed populations compared with that of unexposed controls (RRpooled = 1.14; 95% CI: 0.97, 1.33), showing heterogeneity (Q = 18.27, p = 0.0004), I2 = 83.58%, and no suspected publication bias (p = 0.69) (Figure 7).
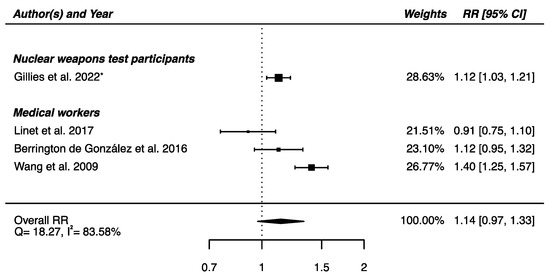
Figure 7.
Relative risk (RR) and 95% confidence interval (CI) for mortality from cerebrovascular diseases in the reviewed studies among IR exposed populations compared with unexposed controls. * 90% CI.
A pooled ERR per 100 WLM from three studies assessing the dose–response relationship between radon exposure and death from cerebrovascular diseases [38,40,43] was calculated showing a non-significant ERR (ERRpooled per 100 WLM = 0.12; 95% CI: −0.11, 0.36), with moderate heterogeneity (Q = 4.24, p = 0.12), I2 = 52.87%, and no publication bias (p = 0.09) (Figure 8).
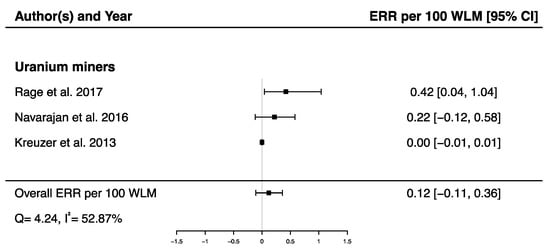
Figure 8.
Excess relative risk (ERR) per 100 WLM and 95% confidence interval (CI) for mortality from cerebrovascular diseases in relation to IR exposure.
Pooled dose–response relationships between IR and mortality [33,39,41,43,45,51,58,73] or incidence [30,59,67] from cerebrovascular diseases were computed. A positive but non-significant ERR was found for mortality (ERRpooled at Gy = 0.01; 95% CI: −0.00, 0.02; Q = 16.00, (p = 0.03), I2 = 56.23%, no publication bias (p = 0.84) (Figure 9), whereas a statistically significant ERR was obtained for morbidity (ERRpooled per 100 mGy = 0.04; 95% CI: 0.03, 0.05; Q = 2.06 (p = 0.36), I2 = 3.12%, publication bias (p = 0.02)) (Figure 10). However, the estimated ERR at 100 mGy for mortality from cerebrovascular diseases became significant in sensitivity analyses where studies that did not report ICD codes were removed (i.e., the Eldorado uranium workers cohort study [45]) (ERRpooled at 100 mGy = 0.13; 95% CI: 0.03, 0.22).
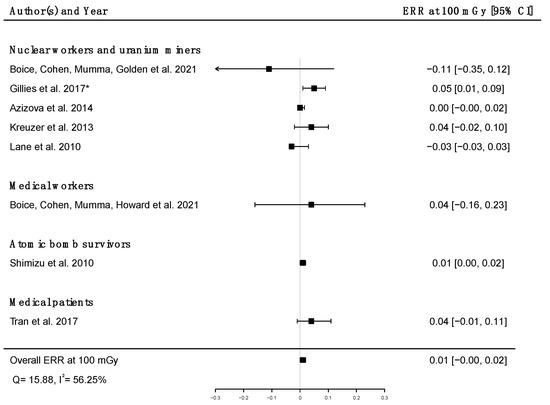
Figure 9.
Excess relative risk (ERR) at 100 mGy and 95% confidence interval (CI) for mortality from cerebrovascular diseases in relation to IR exposure; * 90%CI.
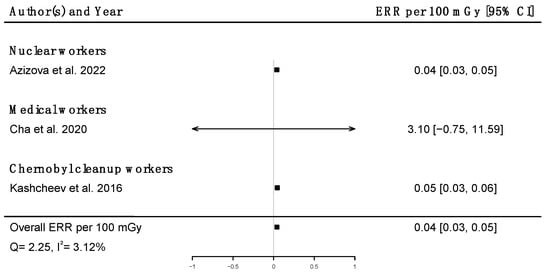
Figure 10.
Excess relative risk (ERR) per 100 mGy and 95% confidence interval (CI) for morbidity from cerebrovascular diseases in relation to IR exposure.
3.3. Mental and Behavioral Disorders (ICD-10: F00–F99)
Key findings of the 22 studies focusing on mental and behavioral disorders can be found in Table 4.
Table 4.
Key findings of the included studies on mental and behavioral disorders.
3.3.1. Nuclear Workers and Uranium Miners
Nuclear industry workers were the subject of 12 studies out of the 22 dealing with mental and behavioral disorders. Six of them reported no statistical difference in mortality [33,36,42,44,46,47] compared with general populations. Decreases in deaths due to mental and behavioral disorders were reported among U.S. nuclear power plant workers (SMR = 0.77; 95% CI: 0.70, 0.85; ndeaths = 425) [32], among underground miners (SMR = 0.81; 95% CI: 0.70, 0.94; ndeaths = 191) [34], and among Eldorado uranium workers (SMR = 0.44; 95% 0.29, 0.63; ndeaths = 29) [45] compared with general populations, whereas an increase was reported among 16,434 male uranium miners in the Czech Republic (exposure assessment: NA) (SMR = 1.88; 95% CI: 1.05, 2.71; ndeaths = 20) compared to the general population [35]. On the other hand, a statistically significant positive dose–response relationship was found between brain dose and death from mental and behavioral disorders in the INWORKS cohort (ERR per Sv = 1.30; 90% CI: 0.23, 2.72; ndeaths = 705) [39]. Additionally, an increased risk of death from dementia was found in a nested case–control study within a pooled cohort of 67,976 female nuclear workers occupationally exposed to IR, including 91 cases and 910 controls of which 14 cases and 154 controls were monitored for radiation (max annual radiation dose: 49.9 mSv) (OR = 2.09; 95% CI: 1.02, 4.29) [50].
3.3.2. Nuclear Weapons Test Participants
Among U.S. military participants in nuclear weapons test series, a significant decrease in mortality due to mental and behavioral disorders was reported as compared with the general population (SMR = 0.92; 95% CI: 0.87, 0.98; ndeaths = 1021) [53].
3.3.3. Chernobyl Cleanup Workers
A statistically significant dose-dependent increase in the level of mental disorders (as assessed by the Brief Psychiatric Rating Scale (BPRS) [74]) was found among 326 Ukrainian cleanup workers exposed to dose under 500 mSv [69]. Higher risks of organic psychoses and non-psychotic organic brain damages were found among 198 Ukrainian Chernobyl liquidators who intervened in 1986–1987, relative to 42 internal controls exposed to doses < 50 mSv (RR = 3.15; 95% CI: 2.60, 3.70 and RR = 1.99; 95% CI: 1.60, 2.50, respectively) [65]. Regarding schizophrenia spectrum disorders, the incidence increased dramatically among 100 Chernobyl exclusion zone personnel with acute radiation sickness as compared to the general Ukrainian population in 1990, just after the disaster (5.4/10,000 vs. 1.1/10,000, respectively) [72].
Furthermore, a statistically significant increased frequency of mild cognitive disorders was observed among 196 men workers involved in the Chernobyl “Shelter Object” (total irradiation mean: 19.9 mSv; max: 56.7 mSv) between baseline (T0) and after completion of their period of work on-site (T1) (3.6% vs. 11.2% (p < 0.01), respectively). Nevertheless, this increase was not found in workers who had already been exposed to IR before this task [68]. Loganovsky et al. (2013) found a higher level of depression assessed by the self-rating depression scale [75] in 219 people with post-traumatic stress disorder (PTSD) affected by the Chernobyl disaster, whether they were diagnosed with acute radiation sickness (mean and standard deviations: 52.3 ± 12.9) or not (58.6 ± 12.6), compared with 28 war veterans (47.8 ± 12.6) and a group of 22 healthy unexposed people (39.6 ± 7.3) [71]. On the other hand, no increase in the incidence of mental and behavioral disorders was found in Estonian Chernobyl clean-up workers compared to a cohort of unexposed men (RR = 1.00; 95% CI: 0.94, 1.07) but was found for mental disorders due to alcohol (RR = 1.21; 95% CI: 1.06, 1.39) [70].
3.3.4. Medical Workers
Among medical workers, a lower risk of mortality due to mental and behavioral disorders was reported among U.S. medical radiation workers (SMR = 0.58; 95% CI: 0.51, 0.66; ndeaths = 246) compared with the general population [58]. Furthermore, a lower risk of mortality was reported among U.S. physicians likely to have performed FGIP compared with psychiatrists (RR = 0.55; 95% CI: 0.35, 0.84) [61], whereas a non-significant higher risk was shown among male radiologists compared to psychiatrists (RR = 1.30; 95% CI: 0.60, 2.80) [62]. In this latter study, a decreased mortality was shown among male radiologists compared with national rates (SMR = 0.51; 95% CI: 0.38, 0.64, ndeaths = 60) [62].
3.3.5. Overall Meta-Analysis
Out of the 22 studies included in this section, 13 had available SMRs to be integrated in a meta-analysis, showing a statistically significant lower mortality from mental and behavioral disorders between the IR-exposed populations presented above and the general populations (SMRpooled = 0.86; 95% CI: 0.74, 0.99, Q = 103.72 (p < 0.0001), I2 = 88.43%, no publication bias (p = 0.97) (Figure 11). Sensitivity analyses where studies or different workers groups were excluded one by one resulted in no change in heterogeneity, as well as sensitivity analyses in which studies that did not report ICD codes were removed.
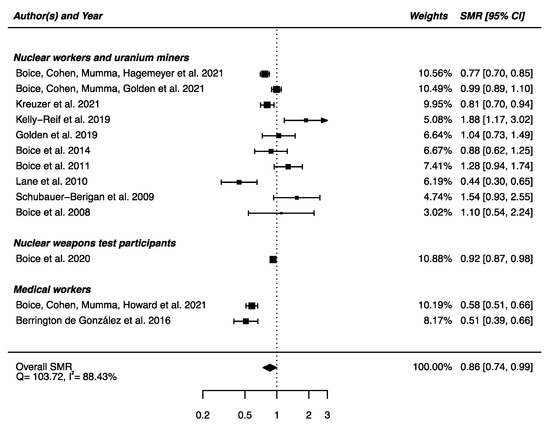
Figure 11.
Standardized mortality ratio (SMR) and 95% confidence interval (CI) for mortality from mental and behavioral disorders in IR exposed populations compared with general populations as reference.
4. Discussion
The risk of non-cancerous CNS diseases after exposure to low-to-moderate doses of IR in adulthood was analyzed based on 45 studies. Meta-analyses show reduced mortality due to nervous system diseases, cerebrovascular diseases, and mental and behavioral disorders in radiation workers compared to general populations and suggest a higher risk of cerebrovascular diseases and Parkinson’s disease that may be dose-dependent in people exposed during adulthood (radiation workers, A-bomb survivors). For cerebrovascular diseases, a significant dose-risk relationship is reported for incidence, but it was non-significant for mortality. These findings are consistent with the previous meta-analysis by Little et al. (2012), who found a significant positive relationship between cumulative IR dose and cerebrovascular diseases, studying mortality and morbidity outcomes together [13]. We conducted separate analyses for mortality and incidence outcomes because mortality analyses are often based on the underlying cause-of-death, and it has been shown that cerebrovascular diseases could be poorly captured when using only underlying causes of death [76].
In the present study, the decreases in mortality found in radiation workers when compared to general population rates for nervous system diseases, cerebrovascular diseases, and mental and behavioral diseases can be explained by the healthy-worker effect [77], meaning that worker populations usually present a better health condition than the general population. The calculation of relative risks using a control occupational group that is supposed to be more comparable to the exposed group (except for exposure) allows the healthy-worker effect to be avoided. This can be observed with the pooled analysis of the results of one study on nuclear weapons test participants [52] and three studies of medical radiation workers compared to groups of unexposed populations [61,62,64] that yields nonsignificantly increased relative risks of mortality from nervous or cerebrovascular diseases. Internal dose–risk analyses are even more informative for investigating the impact of IR exposure on the risk of non-cancerous CNS diseases.
Most of the studies included in this review dealt with occupational exposure, mainly among nuclear workers and uranium miners, who are subject to different types of exposure depending on their activities. For example, uranium miners are repeatedly exposed to a mix of radon gas and its progenies, external gamma rays, and uranium dusts [78], and cycle nuclear workers are exposed to external gamma rays, possibly combined with tritium, uranium, or plutonium, depending on their activity [79,80]. However, external exposures are more commonly reported in studies, although internal contamination was often mentioned among nuclear workers. Due to the low rate of workers monitored for internal exposure, or the fact that only the status “exposed to internal contamination” was known [39], few studies performed separate exposure-based, adjusted, or sensitivity analyses to disentangle the share of risk attributable to each type of exposure [30,36,41,42,44], which did not allow specific meta-analyses for internal exposures in this work. Nevertheless, some studies have addressed the issue of co-exposure by treating it as a confounding factor [41], and it did not significantly change the result (ERR per Gy = 0.05; 95% CI: −0.03, 0.16 vs. ERR per Gy = > 0; 95% CI: −0.10, 0.16). In addition, differences in results between studies may be related to the characteristics of the exposure such as brief or prolonged; the type of radiation field (e.g., external low-LET photons vs. high-LET alpha particles); or possible biases in dosimetry [32].
Furthermore, exposure to IR in the occupational setting is often accompanied by co-exposure to other health risk factors (e.g., chemical substances, pesticides, heavy metals, nitro compounds, non-ionizing radiations, air pollution, tobacco use, etc.) that may confound and/or modify the relationship between IR exposure and a health outcome. For example, medical radiation workers are predominantly exposed to X-rays, but can possibly be exposed to chemicals or drugs (such as hydroquinone, aldehydes, acetic acid, ammonia, etc.) [61,81]. Nevertheless, research on the health effects of co-exposures to two or more risk factors (exposome) is a very dynamic area of research, and synergies or antagonisms following co-exposure to different environmental agents have been shown [82,83]. However, the interaction of various factors and associated health outcomes are poorly characterized to date. In the present work, few studies have considered co-exposures, with limited evidence on their impact on the dose–response relationship.
A high number of risk factors for non-cancerous CNS diseases have been identified in the scientific literature, with varying degrees of evidence depending on the outcome [84,85]. Several risk factors have been considered in the dose–response analyses by each study separately. However, socio-economic factors (often used in occupational studies to control for possible confounding factors that are not available on an individual basis and may influence mortality and disease occurrence) were included in only half of the studies that report dose–response analyses in the present work (Table 2, Table 3 and Table 4). In order to take risk factors into account as much as possible, we performed our meta-analysis on adjusted estimates even if the estimates were not systematically adjusted on the same risk factors, as is usually recommended in meta-analysis methodology.
Finally, mental and behavioral disorders are known to be influenced by individual characteristics, but also by the socio-economic and environmental circumstances in which people live [86]. Indeed, specific disorders such as Alzheimer’s disease and dementia spectrum disorders are known to be influenced by environmental and/or genetic factors [87,88]. It is therefore important to highlight that disasters (natural and human-made) can inflict psychological damage on the affected populations. It has been reported that a major health impact of the Chernobyl nuclear power plant accident was the fear about potential upcoming health problems [89]. Furthermore, the Hiroshima and Nagasaki bombings have had long-lasting effects on mental health, such as post-traumatic stress, depression, anxiety, and somatization. However, there were few well-designed studies (i.e., evaluation of exposure, confounding factors) on mental health following the Chernobyl catastrophe. It appears very difficult to determine which part of mental health disorders is due to radiation directly, and which is due to the psychological consequence of having experienced such a disaster [90]. In a broader sense, when studying non-cancerous CNS diseases, such as cognitive disorders, many factors such as exposure time vulnerability, mechanism, and susceptibility factors are important to consider [11].
One major limitation of this systematic review was related to the definition of outcomes. Although most of the studies are based on the ICD coding, whether for causes of death or diagnostics (which still ensures a certain homogeneity and reliability in our analyses), the fact remains that classification errors may have been made during coding. For example, the rules of the ICD lead to the selection of suicide as the initial cause of death, even if the physician has indicated another sequence (e.g., depression leading to suicide) [91]. Thus, the number of deaths due to depression may have been underestimated in these studies. In Russia, a high degree of inconsistency across the region was found for mental and behavioral disorders, diseases of the nervous system, and certain cardiovascular diseases, suggesting differences in coding practices [92]. Then, analyses could be performed on broad categories, as the level of consistency improves when causes of death are grouped into broader diagnostic categories, but could not be performed for subcategories, when the classification bias might be higher. Finally, 10 studies did not even mention ICD coding, which has occasionally made it difficult to classify the outcomes of these studies within the causes of disease/death used in this work, possibly leading to a classification bias. Sensitivity analyses performed by removing the studies without ICD codes showed no change in the results, except the positive dose–response relationship for cerebrovascular diseases, which became significant.
Heterogeneity seems unavoidable because of different populations, various types of radiation exposure, and chronical or acute exposure. Sensitivity analyses in which the pooled SMR was calculated excluding each study one at a time and each group (e.g., aircrews, nuclear workers, medical workers, etc.) revealed no substantial alteration of the aggregate SMR for the three studied outcomes. Nevertheless, we used random effects models to calculate our estimates (SMR, RR, and ERR), which account for potential heterogeneity between and within studies.
The consideration of bioindicators and biomarkers in epidemiological studies could be very informative in improving the accuracy of the outcomes and the reconstruction of actual IR exposure of participants. In the long run, this could also help to better understand the mechanisms of these neurodegenerative disorders. For example, Borghini et al. (2017) have shown that the expression profiles of circulating brain miR-134 (a brain-specific miRNA that has been shown to be dysregulated in pathologies such as Alzheimer disease, bipolar disorder, and glioblastomas [93]) and miR-2392 were significantly downregulated in interventional cardiologists compared with controls [94]. Complementary studies are needed to confirm these findings and to further explore the potential of circulating miRNAs to be used clinically as novel biomarkers to identify early, disease-related perturbations caused by long-term radiation exposure.
According to this work, the effects of low doses of IR on non-cancerous CNS diseases cannot be excluded. Compared to the 2.7 billion people who had neurological disorders in 2019 [9], the estimated increased risk of 17% would result in a significant public health impact. In addition, due to the fact that human populations are increasingly exposed to IR from various sources (e.g., cosmic rays, environmental radionuclides), along with the continued growth and evolution of IR imaging technologies, the resulting dose in the general population is increasing. Moreover, in a context where exposure to IR is steadily increasing in some groups of workers (e.g., medical radiation workers), new studies avoiding the biases mentioned in this work are justified: the use of precise dosimetry, an indisputable definition of the outcomes, and adjusted dose–response calculations are encouraged. To our knowledge, this work is the first systematic review and meta-analysis of the literature assessing the risk of non-cancerous CNS diseases and mortality in populations exposed to IR during adulthood only. We included a broad range of endpoints, resulting in a large number of studies covered. All included studies met the previously defined criteria according to the PRISMA recommendations, allowing robust and exhaustive analysis while maintaining a focus on the main research question. The quality score between 4 and 9 on the Newcastle Ottawa scale for all studies included in this review provides a good quality rating for this work.
5. Conclusions
The present review and meta-analyses did not suggest higher risk of mortality due to non-cancerous CNS diseases after adult IR-exposure compared with unexposed controls. However, some of the studies reviewed had low statistical power to detect an effect and inadequate dosimetry, if any. Furthermore, a significant positive excess relative risk was found for cerebrovascular disease morbidity and for Parkinson’s disease. Nevertheless, we caution against drawing firm conclusions due to methodological issues, including uncertainties related to the classification of the diseases, dosimetry assessment, and potential confusion bias. Further studies, ideally large-scale studies with individual dose reconstruction and collection of information on potential confounding factors, will be essential to expand our knowledge of the risk of non-cancerous CNS diseases following exposure to low-dose IR.
Supplementary Materials
The following supporting information can be downloaded at https://www.mdpi.com/article/10.3390/brainsci12080984/s1, Table S1: Preferred Reporting Items for Systematic Reviews and Meta-analyses (PRISMA) 2020 checklist; Table S2: List of causes of deaths studied and corresponding codes according to the International Classification of Diseases (ICD). Ref. [95] is cited in Supplementary Materials.
Author Contributions
J.L., K.L., M.-O.B. and C.B. designed the study; J.L. and C.B. conducted the systematic research and independently performed the selection of studies according to the PRISMA guidelines; disagreements have been discussed and resolved by M.-O.B.; J.L. performed the qualitative and quantitative syntheses of the studies; J.L., K.L., D.K.; C.D.; M.-O.B. and C.B. drafted the initial report and take responsibility for the integrity of the data and the accuracy of the data analysis. All authors have read and agreed to the published version of the manuscript.
Funding
This research received no external funding.
Institutional Review Board Statement
Not applicable.
Informed Consent Statement
Not applicable.
Data Availability Statement
Not applicable.
Acknowledgments
The authors are grateful to all the authors of the studies included in this work. The authors would like to thank Eric Blanchardon and Cécile Challenton de Vathaire for their contribution.
Conflicts of Interest
The authors declare no conflict of interest.
References
- Ruano-Ravina, A.; Wakeford, R. The Increasing Exposure of the Global Population to Ionizing Radiation. Epidemiology 2020, 31, 155–159. [Google Scholar] [CrossRef] [PubMed]
- UNSCEAR. Sources and Effects of Ionizing Radiation, United Nations Scientific Committee on the Effects of Atomic Radiation (UNSCEAR) 2008 Report, Volume I. United Nations. 2010. Available online: https://www.un-ilibrary.org/content/books/9789210582520 (accessed on 23 November 2021).
- UNSCEAR. Effects of Ionizing Radiation, United Nations Scientific Committee on the Effects of Atomic Radiation (UNSCEAR) 2006 Report, Volume I. United Nations. 2008. Available online: https://www.un-ilibrary.org/content/books/9789210582513 (accessed on 23 November 2021).
- Cramer, C.K.; McKee, N.; Case, L.D.; Chan, M.D.; Cummings, T.L.; Lesser, G.J.; Shaw, E.G.; Rapp, S.R. Mild cognitive impairment in long-term brain tumor survivors following brain irradiation. J. Neuro-Oncol. 2019, 141, 235–244. [Google Scholar] [CrossRef]
- Huang, A.J.; Kornguth, D.; Kornguth, S. Cognitive Decline Secondary to Therapeutic Brain Radiation—Similarities and Differences to Traumatic Brain Injury. Brain Sci. 2019, 9, 97. [Google Scholar] [CrossRef] [PubMed]
- Huang, R.; Zhou, Y.; Hu, S.; Ren, G.; Cui, F.; Zhou, P.-K. Radiotherapy Exposure in Cancer Patients and Subsequent Risk of Stroke: A Systematic Review and Meta-Analysis. Front. Neurol. 2019, 10, 233. [Google Scholar] [CrossRef]
- Stupp, R.; Taillibert, S.; Kanner, A.A.; Read, W.; Steinberg, D.M.; Lhermitte, B.; Toms, S.; Idbaih, A.; Ahluwalia, M.S.; Fink, K.; et al. Effect of Tumor-Treating Fields Plus Maintenance Temozolomide vs Maintenance Temozolomide Alone on Survival in Patients with Glioblastoma. JAMA 2017, 318, 2306–2316. [Google Scholar] [CrossRef]
- Yamamoto, M.; Serizawa, T.; Shuto, T.; Akabane, A.; Higuchi, Y.; Kawagishi, J.; Yamanaka, K.; Sato, Y.; Jokura, H.; Yomo, S.; et al. Stereotactic radiosurgery for patients with multiple brain metastases (JLGK0901): A multi-institutional prospective observational study. Lancet Oncol. 2014, 15, 387–395. [Google Scholar] [CrossRef]
- Global Health Data Exchange. 2019. Available online: http://ghdx.healthdata.org/gbd-results-tool (accessed on 23 May 2022).
- Pasqual, E.; de Basea, M.B.; López-Vicente, M.; Thierry-Chef, I.; Cardis, E. Neurodevelopmental effects of low dose ionizing radiation exposure: A systematic review of the epidemiological evidence. Environ. Int. 2020, 136, 105371. [Google Scholar] [CrossRef]
- Pasqual, E.; Boussin, F.; Bazyka, D.; Nordenskjold, A.; Yamada, M.; Ozasa, K.; Pazzaglia, S.; Roy, L.; Thierry-Chef, I.; de Vathaire, F.; et al. Cognitive effects of low dose of ionizing radiation—Lessons learned and research gaps from epidemiological and biological studies. Environ. Int. 2021, 147, 106295. [Google Scholar] [CrossRef] [PubMed]
- Azizova, T.V.; Bannikova, M.V.; Grigoryeva, E.S.; Rybkina, V.L.; Hamada, N. Occupational exposure to chronic ionizing radiation increases risk of Parkinson’s disease incidence in Russian Mayak workers. Int. J. Epidemiol. 2020, 49, 435–447. [Google Scholar] [CrossRef]
- Little, M.P.; Azizova, T.V.; Bazyka, D.; Bouffler, S.D.; Cardis, E.; Chekin, S.; Chumak, V.V.; Cucinotta, F.A.; De Vathaire, F.; Hall, P.; et al. Systematic Review and Meta-analysis of Circulatory Disease from Exposure to Low-Level Ionizing Radiation and Estimates of Potential Population Mortality Risks. Environ. Health Perspect. 2012, 120, 1503–1511. [Google Scholar] [CrossRef]
- Achanta, P.; Fuss, M.; Martinez, J.L. Ionizing radiation impairs the formation of trace fear memories and reduces hippocampal neurogenesis. Behav. Neurosci. 2009, 123, 1036–1045. [Google Scholar] [CrossRef] [PubMed]
- Bellone, J.A.; Rudobeck, E.; Hartman, R.E.; Szücs, A.; Vlkolinský, R. A Single Low Dose of Proton Radiation Induces Long-Term Behavioral and Electrophysiological Changes in Mice. Radiat. Res. 2015, 184, 193–202. [Google Scholar] [CrossRef] [PubMed]
- Parihar, V.K.; Allen, B.D.; Caressi, C.; Kwok, S.; Chu, E.; Tran, K.K.; Chmielewski, N.N.; Giedzinski, E.; Acharya, M.M.; Britten, R.A.; et al. Cosmic radiation exposure and persistent cognitive dysfunction. Sci. Rep. 2016, 6, 34774. [Google Scholar] [CrossRef]
- Parihar, V.K.; Allen, B.D.; Tran, K.K.; Chmielewski, N.N.; Craver, B.M.; Martirosian, V.; Morganti, J.M.; Rosi, S.; Vlkolinsky, R.; Acharya, M.M.; et al. Targeted Overexpression of Mitochondrial Catalase Prevents Radiation-Induced Cognitive Dysfunction. Antioxid. Redox Signal. 2015, 22, 78–91. [Google Scholar] [CrossRef] [PubMed]
- Raber, J.; Rosi, S.; Chakraborti, A.; Fishman, K.; Dayger, C.; Davis, M.J.; Villasana, L.; Fike, J.R. Effects of56Fe-Particle Cranial Radiation on Hippocampus-Dependent Cognition Depend on the Salience of the Environmental Stimuli. Radiat. Res. 2011, 176, 521–526. [Google Scholar] [CrossRef]
- Acharya, M.M.; Baulch, J.E.; Klein, P.; Baddour, A.A.D.; Apodaca, L.A.; Kramár, E.A.; Alikhani, L.; Garcia, C.; Angulo, M.C.; Batra, R.S.; et al. New concerns for neurocognitive function during deep space exposures to chronic, low dose-rate, neutron radiation. eNeuro 2019, 6, ENEURO.0094-19.2019. [Google Scholar] [CrossRef]
- Barber, D.; Hancock, S.; McNally, A.; Hinckley, J.; Binder, E.; Zimmerman, K.; Ehrich, M.; Jortner, B. Neurological effects of acute uranium exposure with and without stress. NeuroToxicology 2007, 28, 1110–1119. [Google Scholar] [CrossRef]
- Houpert, P.; Bizot, J.C.; Bussy, C.; Dhieux, B.; Lestaevel, P.; Gourmelon, P.; Paquet, F. Comparison of the effects of enriched uranium and 137-cesium on the behaviour of rats after chronic exposure. Int. J. Radiat. Biol. 2007, 83, 99–104. [Google Scholar] [CrossRef]
- Houpert, P.; Lestaevel, P.; Bussy, C.; Paquet, F.; Gourmelon, P. Enriched but Not Depleted Uranium Affects Central Nervous System in Long-Term Exposed Rat. NeuroToxicology 2005, 26, 1015–1020. [Google Scholar] [CrossRef]
- Monleau, M.; Bussy, C.; Lestaevel, P.; Houpert, P.; Paquet, F.; Chazel, V. Bioaccumulation and behavioural effects of depleted uranium in rats exposed to repeated inhalations. Neurosci. Lett. 2005, 390, 31–36. [Google Scholar] [CrossRef]
- Lowe, X.; Bhattacharya, S.; Marchetti, F.; Wyrobek, A. Early brain response to low-dose radiation exposure involves molecular networks and pathways associated with cognitive functions, advanced aging and Alzheimer’s. Radiat. Res. 2009, 11, 47. [Google Scholar] [CrossRef] [PubMed]
- Linet, M.S.; Kim, K.P.; Miller, D.L.; Kleinerman, R.A.; Simon, S.L.; de Gonzalez, A.B. Historical Review of Occupational Exposures and Cancer Risks in Medical Radiation Workers. Radiat. Res. 2010, 174, 793–808. [Google Scholar] [CrossRef]
- ICD-10; International Statistical Classification of Diseases and Related Health Problems: Tenth Revision. World Health Organization: Geneva, Switzerland, 2004. Available online: https://apps.who.int/iris/handle/10665/42980 (accessed on 21 July 2022).
- Wells, G.; Shea, B.; O’Connell, D.; Peterson, J.; Welch, V.; Losos, M.; Tugwell, P. The Newcastle-Ottawa Scale (NOS) for assessing the quality of nonrandomised studies in meta-analyses. 2013. Available online: http://www.ohri.ca/programs/clinical_epidemiology/oxford.asp (accessed on 4 March 2021).
- DerSimonian, R.; Laird, N. Meta-analysis in clinical trials. Control Clin. Trials 1986, 7, 177–188. [Google Scholar] [CrossRef]
- Richardson, D.B.; Abalo, K.; Bernier, M.-O.; Rage, E.; Leuraud, K.; Laurier, D.; Keil, A.P.; Little, M.P. Meta-analysis of published excess relative risk estimates. Radiat. Environ. Biophys. 2020, 59, 1–11. [Google Scholar] [CrossRef] [PubMed]
- Azizova, T.V.; Moseeva, M.B.; Grigoryeva, E.S.; Hamada, N. Incidence risks for cerebrovascular diseases and types of stroke in a cohort of Mayak PA workers. Radiat. Environ. Biophys. 2022, 61, 5–16. [Google Scholar] [CrossRef]
- Hinksman, C.A.; Haylock, R.G.E.; Gillies, M. Cerebrovascular Disease Mortality after occupational Radiation Exposure among the UK National Registry for Radiation Workers Cohort. Radiat. Res. 2022, 197, 459–470. [Google Scholar] [CrossRef]
- Boice, J.D.; Cohen, S.S.; Mumma, M.T.; Hagemeyer, D.A.; Chen, H.; Golden, A.P.; Yoder, R.C.; Dauer, L.T. Mortality from leukemia, cancer and heart disease among U.S. nuclear power plant workers, 1957–2011. Int. J. Radiat. Biol. 2022, 98, 657–678. [Google Scholar] [CrossRef]
- Boice, J.D.; Cohen, S.S.; Mumma, M.T.; Golden, A.P.; Howard, S.C.; Girardi, D.J.; Ellis, E.D.; Bellamy, M.B.; Dauer, L.T.; Samuels, C.; et al. Mortality among workers at the Los Alamos National Laboratory, 1943–2017. Int. J. Radiat. Biol. 2021, 98, 722–749. [Google Scholar] [CrossRef]
- Kreuzer, M.; Deffner, V.; Schnelzer, M.; Fenske, N. Mortality in Underground Miners in a Former Uranium Ore Mine. Dtsch. Ärztebl. Int. 2021, 118, 41–48. [Google Scholar] [CrossRef]
- Kelly-Reif, K.; Sandler, D.P.; Shore, D.; Schubauer-Berigan, M.; Troester, M.A.; Nylander-French, L.; Richardson, D.B. Mortality and cancer incidence among underground uranium miners in the Czech Republic 1977–1992. Occup. Environ. Med. 2019, 76, 511–518. [Google Scholar] [CrossRef]
- Golden, A.P.; Ellis, E.D.; Cohen, S.S.; Mumma, M.T.; Leggett, R.W.; Wallace, P.W.; Girardi, D.; Watkins, J.P.; Shore, R.E.; Boice, J.D. Updated mortality analysis of the Mallinckrodt uranium processing workers, 1942–2012. Int. J. Radiat. Biol. 2019, 98, 701–721. [Google Scholar] [CrossRef] [PubMed]
- Bouet, S.; Samson, E.; Jovanovic, I.; Laurier, D.; Laurent, O. First mortality analysis in the French cohort of uranium millers (F-Millers), period 1968–2013. Int. Arch. Occup. Environ. Health 2018, 91, 23–33. [Google Scholar] [CrossRef] [PubMed]
- Rage, E.; Caër-Lorho, S.; Laurier, D. Low radon exposure and mortality among Jouac uranium miners: An update of the French cohort (1946–2007). J. Radiol. Prot. 2017, 38, 92–108. [Google Scholar] [CrossRef]
- Gillies, M.; Richardson, D.B.; Cardis, E.; Daniels, R.; O’Hagan, J.A.; Haylock, R.; Laurier, D.; Leuraud, K.; Moissonnier, M.; Schubauer-Berigan, M.; et al. Mortality from Circulatory Diseases and other Non-Cancer Outcomes among Nuclear Workers in France, the United Kingdom and the United States (INWORKS). Radiat. Res. 2017, 188, 276–290. [Google Scholar] [CrossRef] [PubMed]
- Navaranjan, G.; Berriault, C.; Do, M.; Villeneuve, P.J.; Demers, P.A. Cancer incidence and mortality from exposure to radon progeny among Ontario uranium miners. Occup. Environ. Med. 2016, 73, 838–845. [Google Scholar] [CrossRef]
- Azizova, T.V.; Haylock, R.G.E.; Moseeva, M.B.; Bannikova, M.V.; Grigoryeva, E.S. Cerebrovascular Diseases Incidence and Mortality in an Extended Mayak Worker Cohort 1948–1982. Radiat. Res. 2014, 182, 529–544. [Google Scholar] [CrossRef]
- Boice, J.D.; Cohen, S.S.; Mumma, M.T.; Ellis, E.D.; Cragle, D.L.; Eckerman, K.F.; Wallace, P.W.; Chadda, B.; Sonderman, J.S.; Wiggs, L.D.; et al. Mortality Among Mound Workers Exposed to Polonium-210 and Other Sources of Radiation, 1944–1979. Radiat. Res. 2014, 181, 208–228. [Google Scholar] [CrossRef]
- Kreuzer, M.; Dufey, F.; Sogl, M.; Schnelzer, M.; Walsh, L. External gamma radiation and mortality from cardiovascular diseases in the German WISMUT uranium miners cohort study, 1946–2008. Radiat. Environ. Biophys. 2013, 52, 37–46. [Google Scholar] [CrossRef]
- Boice, J.D.; Cohen, S.S.; Mumma, M.T.; Ellis, E.D.; Eckerman, K.F.; Leggett, R.W.; Boecker, B.B.; Brill, A.B.; Henderson, B.E. Updated Mortality Analysis of Radiation Workers at Rocketdyne (Atomics International), 1948–2008. Radiat. Res. 2011, 176, 244–258. [Google Scholar] [CrossRef]
- Lane, R.S.D.; Frost, S.E.; Howe, G.R.; Zablotska, L.B. Mortality (1950–1999) and Cancer Incidence (1969–1999) in the Cohort of Eldorado Uranium Workers. Radiat. Res. 2010, 174, 773–786. [Google Scholar] [CrossRef]
- Schubauer-Berigan, M.K.; Daniels, R.D.; Pinkerton, L.E. Radon Exposure and Mortality Among White and American Indian Uranium Miners: An Update of the Colorado Plateau Cohort. Am. J. Epidemiol. 2009, 169, 718–730. [Google Scholar] [CrossRef]
- Boice, J.D.B.; Cohen, S.; Mumma, M.T.; Chadda, B.; Blot, W.J. A cohort study of uranium millers and miners of Grants, New Mexico, 1979–2005. J. Radiol. Prot. 2008, 28, 303–325. [Google Scholar] [CrossRef]
- Villeneuve, P.J.; Lane, R.S.D.; Morrison, H.I. Coronary heart disease mortality and radon exposure in the Newfoundland fluorspar miners’ cohort, 1950–2001. Radiat. Environ. Biophys. 2007, 46, 291–296. [Google Scholar] [CrossRef]
- Howe, G.R.; Zablotska, L.B.; Fix, J.J.; Egel, J.; Buchanan, J. Analysis of the Mortality Experience amongst U.S. Nuclear Power Industry Workers after Chronic Low-Dose Exposure to Ionizing Radiation. Radiat. Res. 2004, 162, 517–526. [Google Scholar] [CrossRef]
- Sibley, R.F.; Moscato, B.S.; Wilkinson, G.S.; Ms, N.N. Nested case-control study of external ionizing radiation dose and mortality from dementia within a pooled cohort of female nuclear weapons workers. Am. J. Ind. Med. 2003, 44, 351–358. [Google Scholar] [CrossRef]
- Shimizu, Y.; Kodama, K.; Nishi, N.; Kasagi, F.; Suyama, A.; Soda, M.; Grant, E.J.; Sugiyama, H.; Sakata, R.; Moriwaki, H.; et al. Radiation exposure and circulatory disease risk: Hiroshima and Nagasaki atomic bomb survivor data, 1950–2003. BMJ 2010, 340, b5349. [Google Scholar] [CrossRef]
- Gillies, M.; Haylock, R. Mortality and cancer incidence 1952–2017 in United Kingdom participants in the United Kingdom’s atmospheric nuclear weapon tests and experimental programmes. J. Radiol. Prot. 2022, 42. [Google Scholar] [CrossRef]
- Boice, J.D.; Cohen, S.S.; Mumma, M.T.; Chen, H.; Golden, A.P.; Beck, H.L.; Till, J.E. Mortality among U.S. military participants at eight aboveground nuclear weapons test series. Int. J. Radiat. Biol. 2020, 98, 679–700. [Google Scholar] [CrossRef]
- Gun, R.T.; Parsons, J.; Crouch, P.; Ryan, P.; Hiller, J.E. Mortality and cancer incidence of Australian participants in the British nuclear tests in Australia. Occup. Environ. Med. 2008, 65, 843–848. [Google Scholar] [CrossRef]
- Hammer, G.P.; Auvinen, A.; De Stavola, B.L.; Grajewski, B.; Gundestrup, M.; Haldorsen, T.; Hammar, N.; Lagorio, S.; Linnersjö, A.; Pinkerton, L.; et al. Mortality from cancer and other causes in commercial airline crews: A joint analysis of cohorts from 10 countries. Occup. Environ. Med. 2014, 71, 313–322. [Google Scholar] [CrossRef]
- Yong, L.C.; Pinkerton, L.E.; Yiin, J.H.; Anderson, J.; Deddens, J.A. Mortality among a cohort of U.S. commercial airline cockpit crew. Am. J. Ind. Med. 2014, 57, 906–914. [Google Scholar] [CrossRef] [PubMed]
- Kim, S.H.; Park, J.M.; Kim, H. The prevalence of stroke according to indoor radon concentration in South Koreans. Medicine 2020, 99, e18859. [Google Scholar] [CrossRef] [PubMed]
- Boice, J.D.; Cohen, S.S.; Mumma, M.T.; Howard, S.C.; Yoder, R.C.; Dauer, L.T. Mortality among Medical Radiation Workers in the United States, 1965–2016. Int. J. Radiat. Biol. 2022, 1–25. [Google Scholar] [CrossRef] [PubMed]
- Cha, E.S.; Zaablotska, L.B.; Bang, Y.J.; Lee, W.J. Occupational radiation exposure and morbidity of circulatory disease among diagnostic medical radiation workers in South Korea. Occup. Environ. Med. 2020, 77, 752–760. [Google Scholar] [CrossRef]
- Lee, W.J.; Ko, S.; Bang, Y.J.; Cha, E.S.; Lee, K.-M. Mortality among diagnostic medical radiation workers in South Korea, 1996–2015. Occup. Environ. Med. 2018, 75, 739–741. [Google Scholar] [CrossRef]
- Linet, M.S.; Kitahara, C.M.; Ntowe, E.; Kleinerman, R.A.; Gilbert, E.S.; Naito, N.; Lipner, R.S.; Miller, D.L.; De Gonzalez, A.B.; For the Multi-Specialty Occupational Health Group Mortality in U.S. Physicians Likely to Perform Fluoroscopy-guided Interventional Procedures Compared with Psychiatrists, 1979 to 2008. Radiology 2017, 284, 482–494. [Google Scholar] [CrossRef]
- Berrington de González, A.B.; Ntowe, E.; Kitahara, C.M.; Gilbert, E.; Miller, D.L.; Kleinerman, R.A.; Linet, M.S. Long-term Mortality in 43 763 U.S. Radiologists Compared with 64 990 U.S. Psychiatrists. Radiology 2016, 281, 847–857. [Google Scholar] [CrossRef]
- Rajaraman, P.; Doody, M.M.; Yu, C.L.; Preston, D.L.; Miller, J.S.; Sigurdson, A.J.; Freedman, D.M.; Alexander, B.H.; Little, M.P.; Miller, D.L.; et al. Incidence and mortality risks for circulatory diseases in US radiologic technologists who worked with fluoroscopically guided interventional procedures, 1994–2008. Occup. Environ. Med. 2016, 73, 21–27. [Google Scholar] [CrossRef]
- Wang, J.X.; Zhao, Y.C.; Jia, W.H.; Li, B.X.; Zhang, L.A.; Wang, Z.Q.; Fan, Y.G.; Zhang, J.Y. Non-cancer disease mortality and risk analysis among medical X-ray workers in China. Int. J. Low Radiat. 2009, 6, 294–311. [Google Scholar] [CrossRef]
- Loganovsky, K.N.; Masiuk, S.V.; Buzunov, V.A.; Marazziti, D.; Voychulene, Y.S. Radiation Risk Analysis of Neuropsychiatric Disorders in Ukrainian Chornobyl Catastrophe Liquidators. Front. Psychiatry 2020, 11, 553420. [Google Scholar] [CrossRef]
- Buzunov, V.O.; Kapustynska, O.A. Epidemiological studies of cerebrovascular disease of the population evacuated from the 30-km zone of the ChNPP at the age of 18–60 years. Analysis of the influence of internal ionizing radiation on the thyroid gland 131I. Probl. Radiac. Med. Radiobiol. 2018, 23, 96–106. [Google Scholar] [CrossRef]
- Kashcheev, V.; Chekin, S.Y.; Maksioutov, M.; Tumanov, K.; Menyaylo, A.; Kochergina, E.; Kashcheeva, P.; Gorsky, A.; Shchukina, N.; Karpenko, S.; et al. Radiation-epidemiological Study of Cerebrovascular Diseases in the Cohort of Russian Recovery Operation Workers of the Chernobyl Accident. Health Phys. 2016, 111, 192–197. [Google Scholar] [CrossRef]
- Loganovsky, K.; Perchuk, I.; Marazziti, N. Workers on transformation of the shelter object of the Chernobyl nuclear power plant into an ecologically-safe system show qEEG abnormalities and cognitive dysfunctions: A follow-up study. World J. Biol. Psychiatry 2016, 11, 47. [Google Scholar] [CrossRef]
- Bazyka, D.; Loganovsky, K.; Ilyenko, I.; Chumak, S.; Bomko, M. Gene expression, telomere and cognitive deficit analysis as a function of Chornobyl radiation dose and age: From in utero to adulthood. Probl. Radiatsiinoi Medytsyny Ta Radiobiolohii 2015, 20, 283–310. [Google Scholar] [CrossRef]
- Rahu, K.; Bromet, E.J.; Hakulinen, T.; Auvinen, A.; Uusküla, A.; Rahu, M. Non-cancer morbidity among Estonian Chernobyl cleanup workers: A register-based cohort study. BMJ Open 2014, 4, e004516. [Google Scholar] [CrossRef]
- Loganovsky, K.N.; Zdanevich, N.A. Cerebral basis of posttraumatic stress disorder following the Chernobyl disaster. CNS Spectrums 2013, 18, 95–102. [Google Scholar] [CrossRef]
- Loganovsky, K.N.; Loganovskaja, T.K. Schizophrenia spectrum disorders in persons exposed to ionizing radiation as a result of the Chernobyl accident. Schizophr. Bull. 2000, 26, 751–773. [Google Scholar] [CrossRef][Green Version]
- Tran, V.; Zablotska, L.B.; Brenner, A.V.; Little, M.P. Radiation-associated circulatory disease mortality in a pooled analysis of 77,275 patients from the Massachusetts and Canadian tuberculosis fluoroscopy cohorts. Sci. Rep. 2017, 7, 44147. [Google Scholar] [CrossRef]
- Overall, J.E.; Gorham, D.R. The Brief Psychiatric Rating Scale. Psychol. Rep. 2016, 10, 799–812. [Google Scholar] [CrossRef]
- Zung, W.W.K. A Self-Rating Depression Scale. Arch. Gen. Psychiatry 1965, 12, 63–70. [Google Scholar] [CrossRef]
- Redelings, M.D.; Sorvillo, F.; Simon, P. A Comparison of Underlying Cause and Multiple Causes of Death: US Vital Statistics, 2000–2001. Epidemiology 2006, 17, 100–103. [Google Scholar] [CrossRef] [PubMed]
- Li, C.-Y.; Sung, F.-C. A review of the healthy worker effect in occupational epidemiology. Occup. Med. 1999, 49, 225–229. [Google Scholar] [CrossRef] [PubMed]
- Duport, P. Is the radon risk overestimated? Neglected doses in the estimation of the risk of lung cancer in uranium underground miners. Radiat. Prot. Dosim. 2002, 98, 329–338. [Google Scholar] [CrossRef]
- Sokolnikov, M.; Preston, D.; Gilbert, E.; Schonfeld, S.; Koshurnikova, N. Radiation Effects on Mortality from Solid Cancers Other than Lung, Liver, and Bone Cancer in the Mayak Worker Cohort: 1948–2008. PLoS ONE 2015, 10, e0117784. [Google Scholar] [CrossRef]
- Thierry-Chef, I.; Richardson, D.B.; Daniels, R.D.; Gillies, M.; Hamra, G.B.; Haylock, R.; Kesminiene, A.; Laurier, D.; Leuraud, K.; Moissonnier, M.; et al. Dose Estimation for a Study of Nuclear Workers in France, the United Kingdom and the United States of America: Methods for the International Nuclear Workers Study (INWORKS). Radiat. Res. 2015, 183, 632–642. [Google Scholar] [CrossRef]
- Scobbie, E.; Dabill, D.W.; Groves, J.A. Chemical pollutants in X-ray film processing departments. Ann. Occup. Hyg. 1996, 40, 423–435. [Google Scholar] [CrossRef]
- Lin, H.; Guo, Y.; Ruan, Z.; Yang, Y.; Chen, Y.; Zheng, Y.; Cummings-Vaughn, L.A.; Rigdon, S.E.; Vaughn, M.G.; Sun, S.; et al. Ambient PM2.5 and O3 and their combined effects on prevalence of presbyopia among the elderly: A cross-sectional study in six low- and middle-income countries. Sci. Total Environ. 2019, 655, 168–173. [Google Scholar] [CrossRef]
- Pirani, M.; Best, N.; Blangiardo, M.; Liverani, S.; Atkinson, R.W.; Fuller, G.W. Analysing the health effects of simultaneous exposure to physical and chemical properties of airborne particles. Environ. Int. 2015, 79, 56–64. [Google Scholar] [CrossRef]
- Brown, R.C.; Lockwood, A.H.; Sonawane, B.R. Neurodegenerative Diseases: An Overview of Environmental Risk Factors. Environ. Health Perspect. 2005, 113, 1250–1256. [Google Scholar] [CrossRef]
- Hankey, G.J. Stroke. Lancet 2017, 389, 641–654. [Google Scholar] [CrossRef]
- WHO. Risks to Mental Health: An Overview of Vulnerabilities and Risk Factors. 16 October 2012. Available online: https://www.who.int/publications/m/item/risks-to-mental-health (accessed on 21 November 2021).
- McKenzie, J.A.; Spielman, L.J.; Pointer, C.B.; Lowry, J.R.; Bajwa, E.; Lee, C.W.; Klegeris, A. Neuroinflammation as a Common Mechanism Associated with the Modifiable Risk Factors for Alzheimer’s and Parkinson’s Diseases. Curr. Aging Sci. 2017, 10, 158–176. [Google Scholar] [CrossRef] [PubMed]
- Power, M.C.; Adar, S.D.; Yanosky, J.D.; Weuve, J. Exposure to air pollution as a potential contributor to cognitive function, cognitive decline, brain imaging, and dementia: A systematic review of epidemiologic research. NeuroToxicology 2016, 56, 235–253. [Google Scholar] [CrossRef]
- Bromet, E.; Havenaar, J.; Guey, L. A 25 Year Retrospective Review of the Psychological Consequences of the Chernobyl Accident. Clin. Oncol. 2011, 23, 297–305. [Google Scholar] [CrossRef] [PubMed]
- Collett, G.; Craenen, K.; Young, W.; Gilhooly, M.; Anderson, R.M. The psychological consequences of (perceived) ionizing radiation exposure: A review on its role in radiation-induced cognitive dysfunction. Int. J. Radiat. Biol. 2020, 96, 1104–1118. [Google Scholar] [CrossRef] [PubMed]
- Aouba, A.; Péquignot, F.; Camelin, L.; Jougla, E. Évaluation de la qualité et amélioration de la connaissance des données de mortalité par suicide en France métropolitaine, 2006. BEH 2011, 47, 497–500. [Google Scholar]
- Danilova, I.; Shkolnikov, V.M.; Jdanov, D.A.; Meslé, F.; Vallin, J. Identifying potential differences in cause-of-death coding practices across Russian regions. Popul. Health Metr. 2016, 14, 8. [Google Scholar] [CrossRef] [PubMed]
- Pan, J.-Y.; Zhang, F.; Sun, C.-C.; Li, S.-J.; Li, G.; Gong, F.-Y.; Bo, T.; He, J.; Hua, R.-X.; Hu, W.-D.; et al. miR-134: A Human Cancer Suppressor? Mol. Ther.—Nucleic Acids 2017, 6, 140–149. [Google Scholar] [CrossRef]
- Borghini, A.; Vecoli, C.; Mercuri, A.; Carpeggiani, C.; Piccaluga, E.; Guagliumi, G.; Picano, E.; Andreassi, M.G. Low-Dose Exposure to Ionizing Radiation Deregulates the Brain-Specific MicroRNA-134 in Interventional Cardiologists. Circulation 2017, 136, 2516–2518. [Google Scholar] [CrossRef]
- Page, M.J.; McKenzie, J.E.; Bossuyt, P.M.; Boutron, I.; Hoffmann, T.C.; Mulrow, C.D.; Shamseer, L.; Tetzlaff, J.M.; Akl, E.A.; Brennan, S.E.; et al. The PRISMA 2020 statement: An updated guideline for reporting systematic reviews. BMJ 2021, 372, n71. [Google Scholar] [CrossRef]


Publisher’s Note: MDPI stays neutral with regard to jurisdictional claims in published maps and institutional affiliations. |
© 2022 by the authors. Licensee MDPI, Basel, Switzerland. This article is an open access article distributed under the terms and conditions of the Creative Commons Attribution (CC BY) license (https://creativecommons.org/licenses/by/4.0/).