
Inhibitory Control and Brain–Heart Interaction: An HRV-EEG Study

 , ,
, ,  and
and
Abstract
1. Introduction
2. Materials and Methods
2.1. Subjects
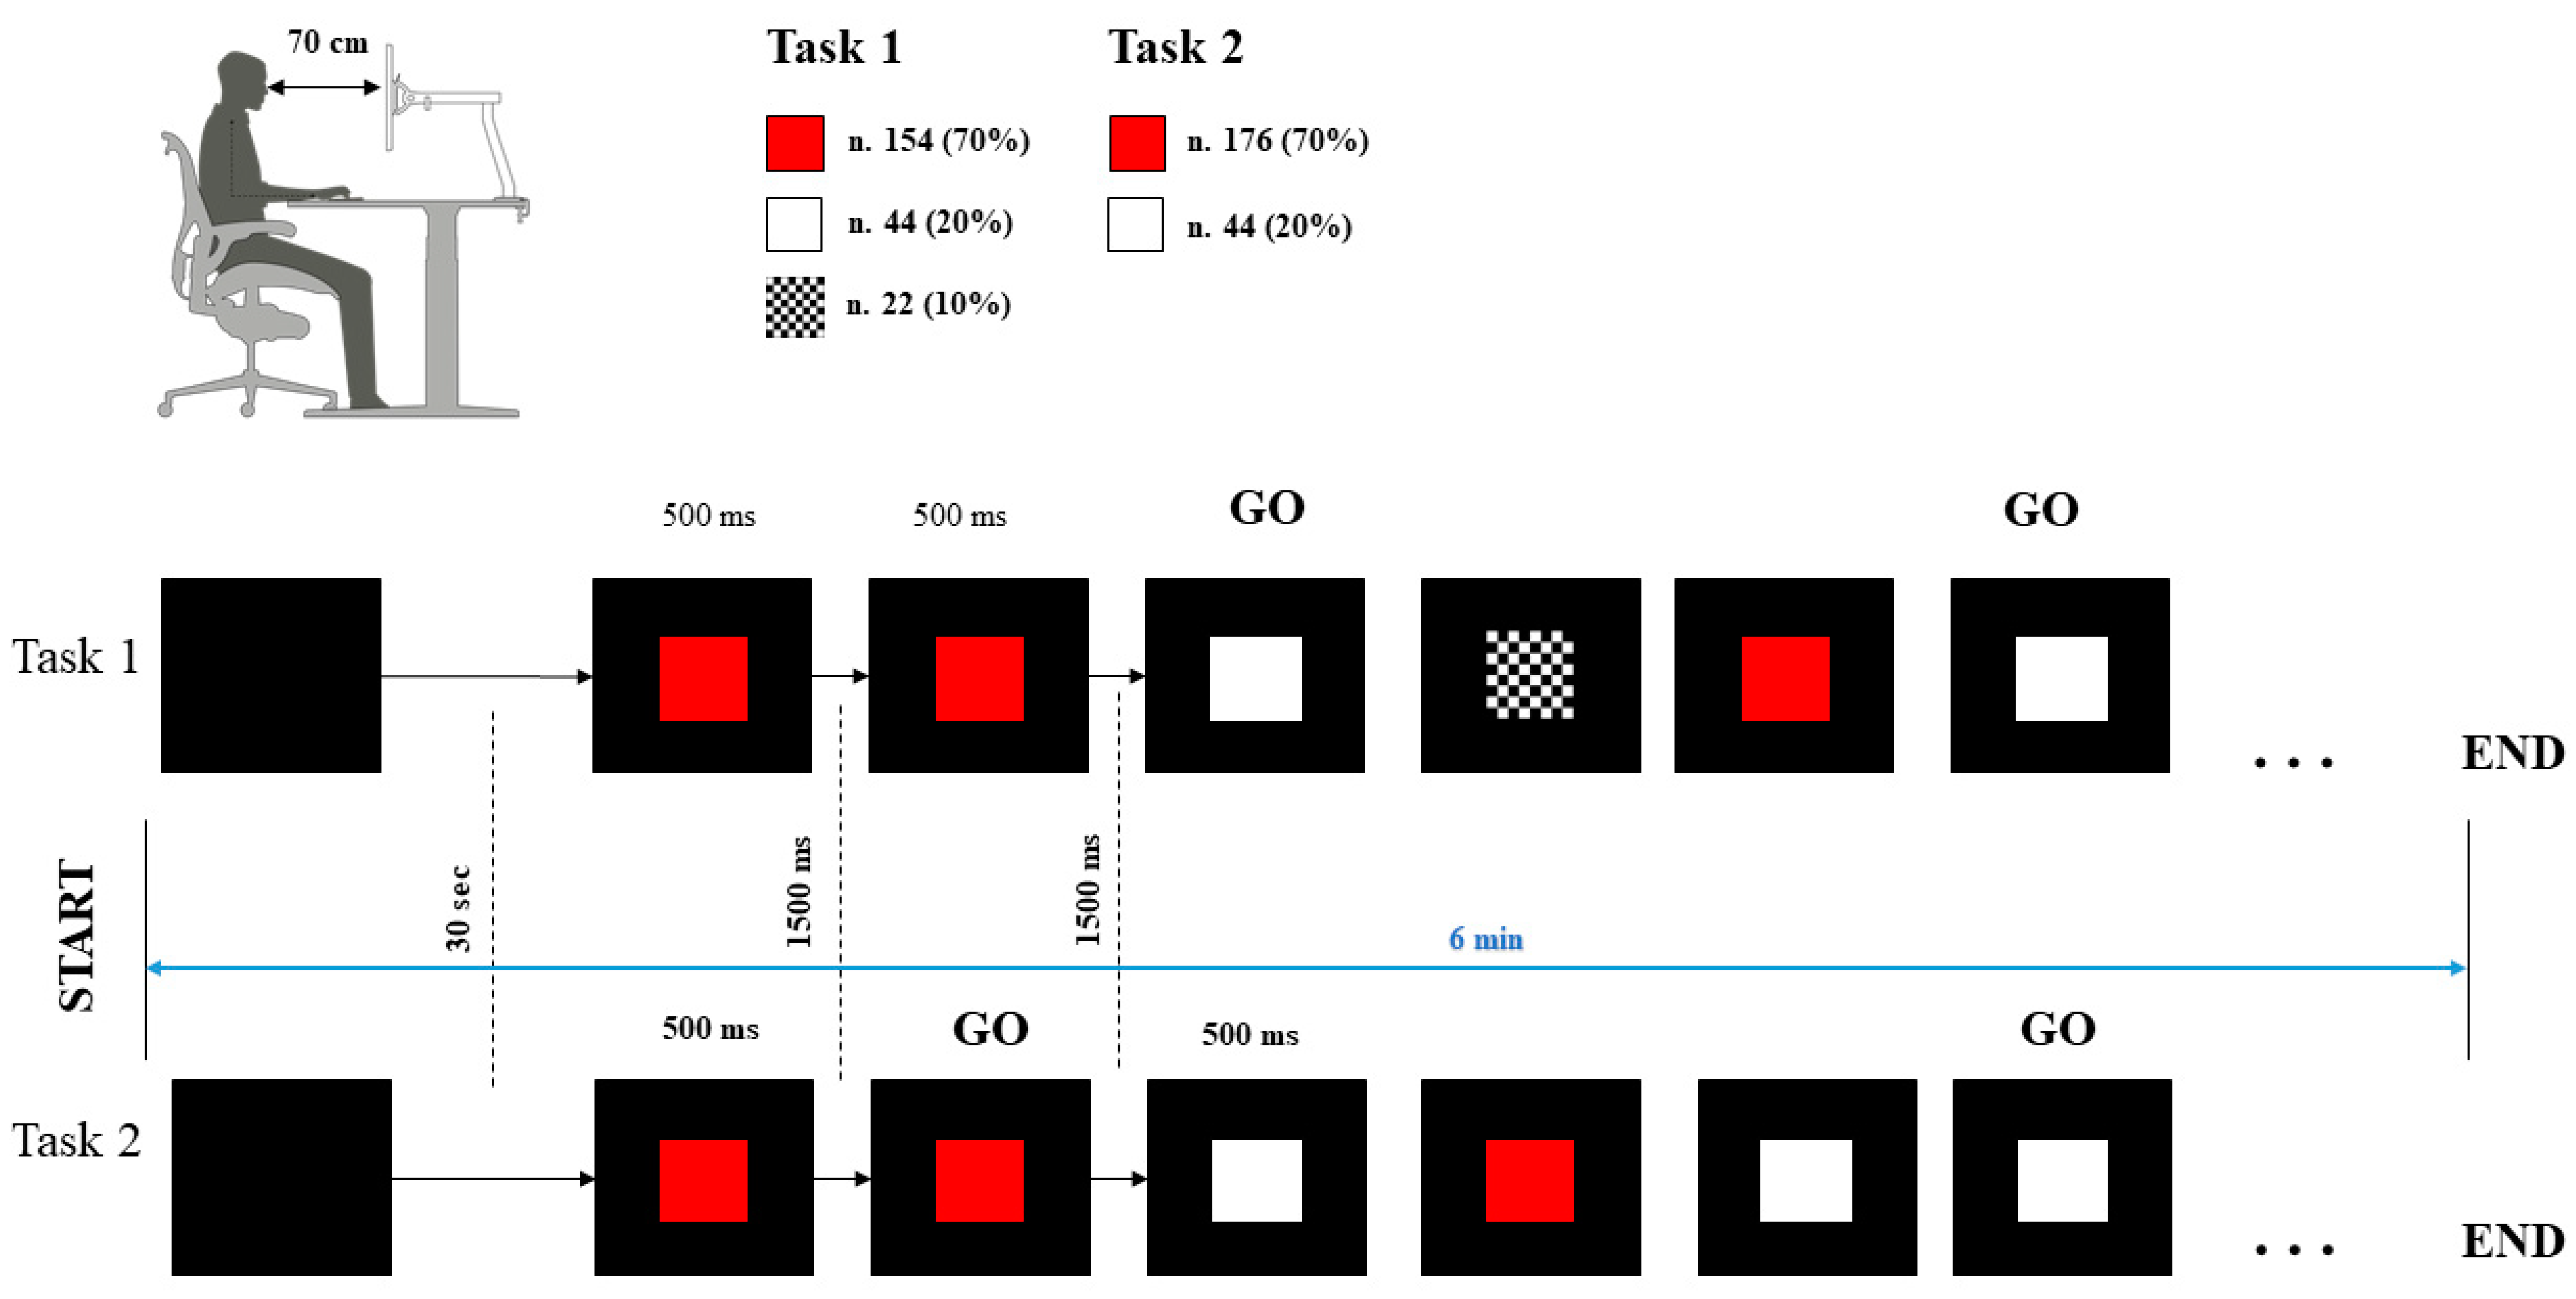
2.2. Procedure
2.3. Data Acquisition
2.4. Data Analysis
2.5. Statistical Analysis
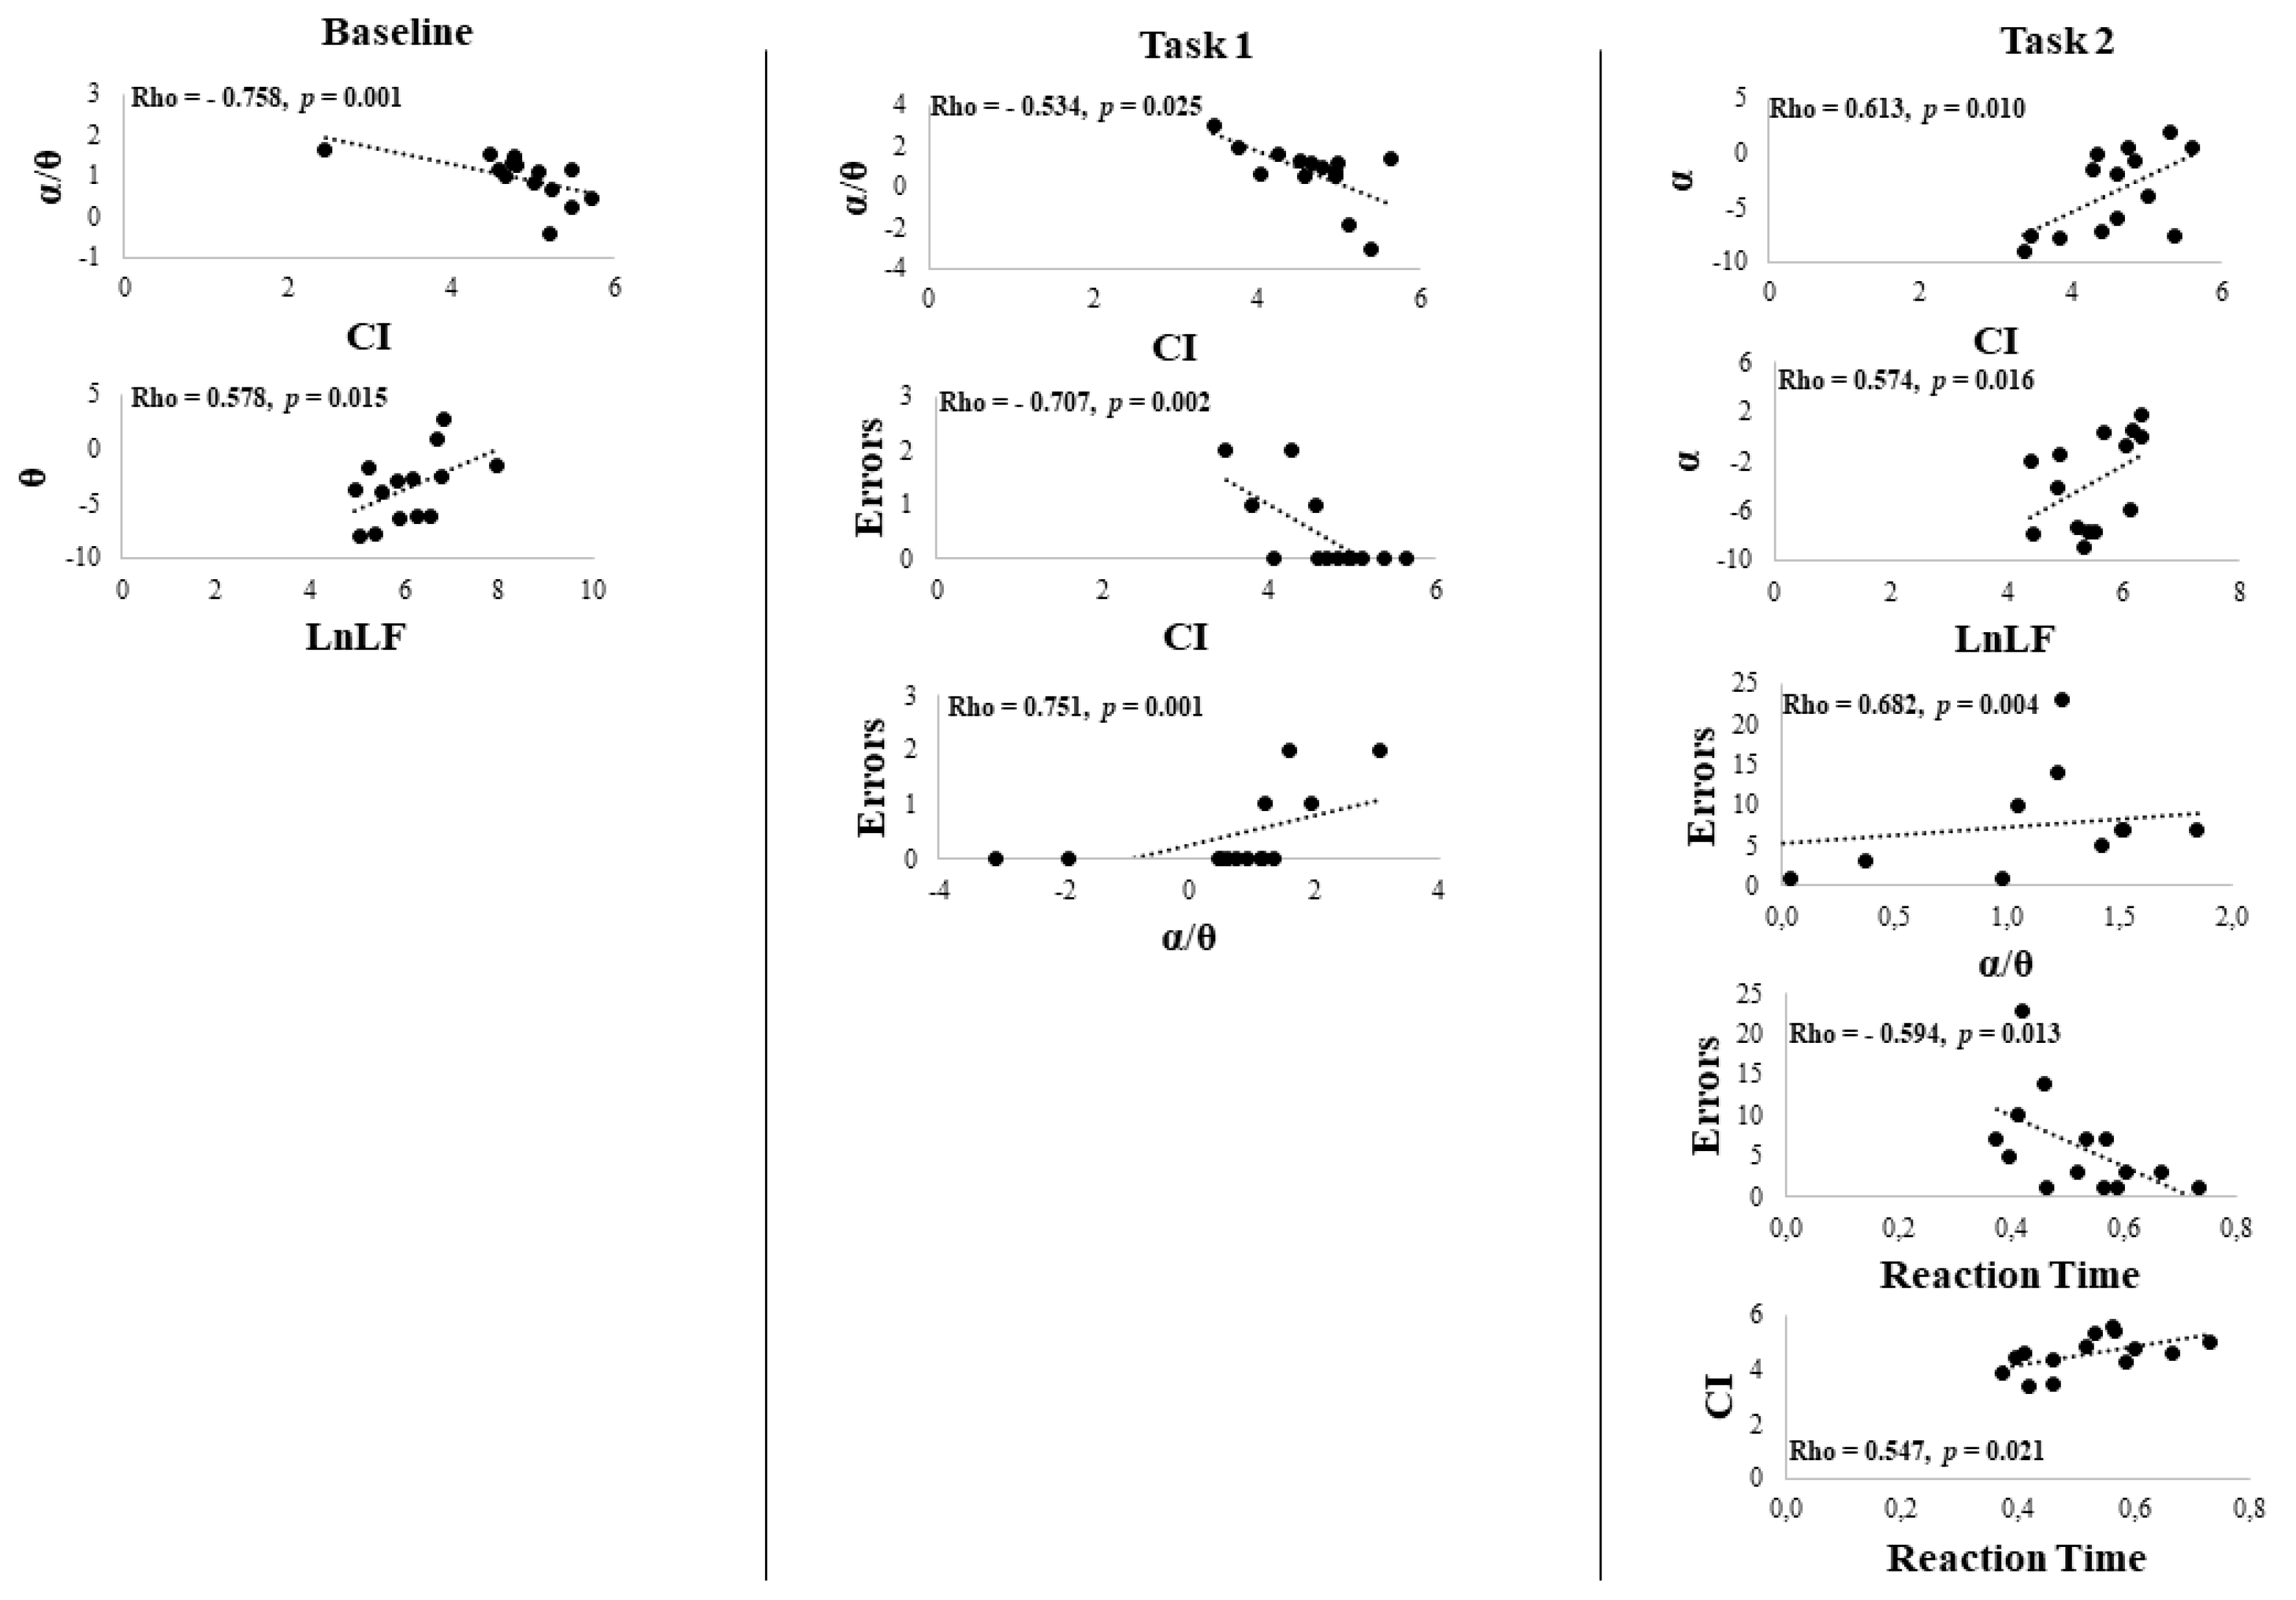
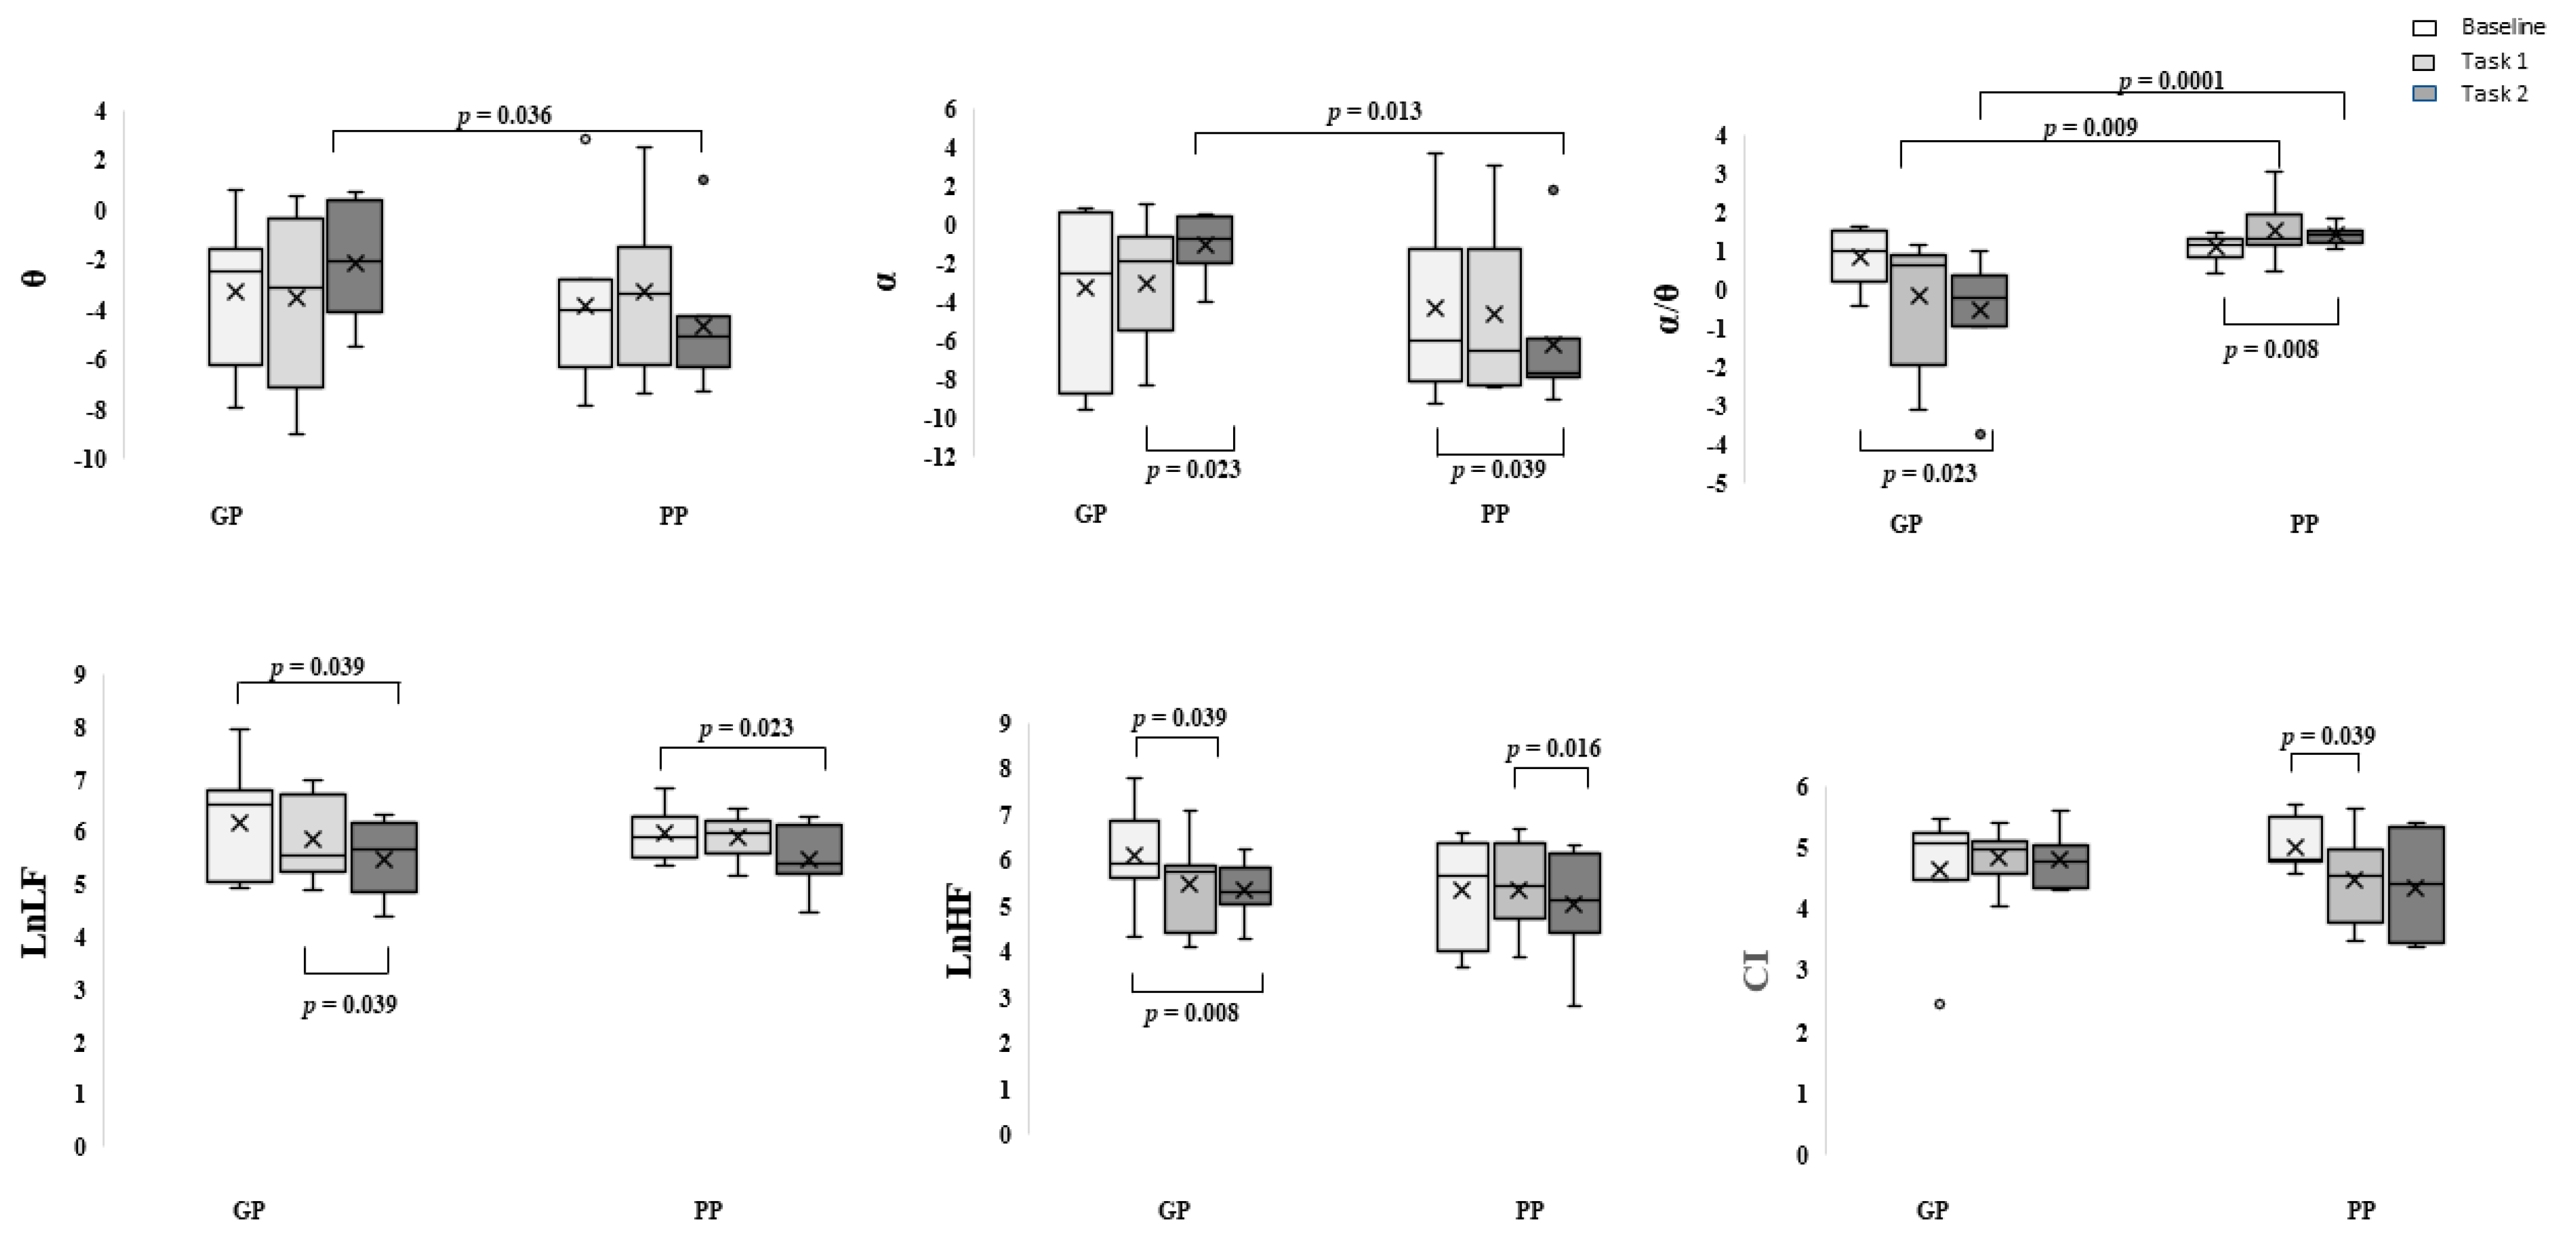
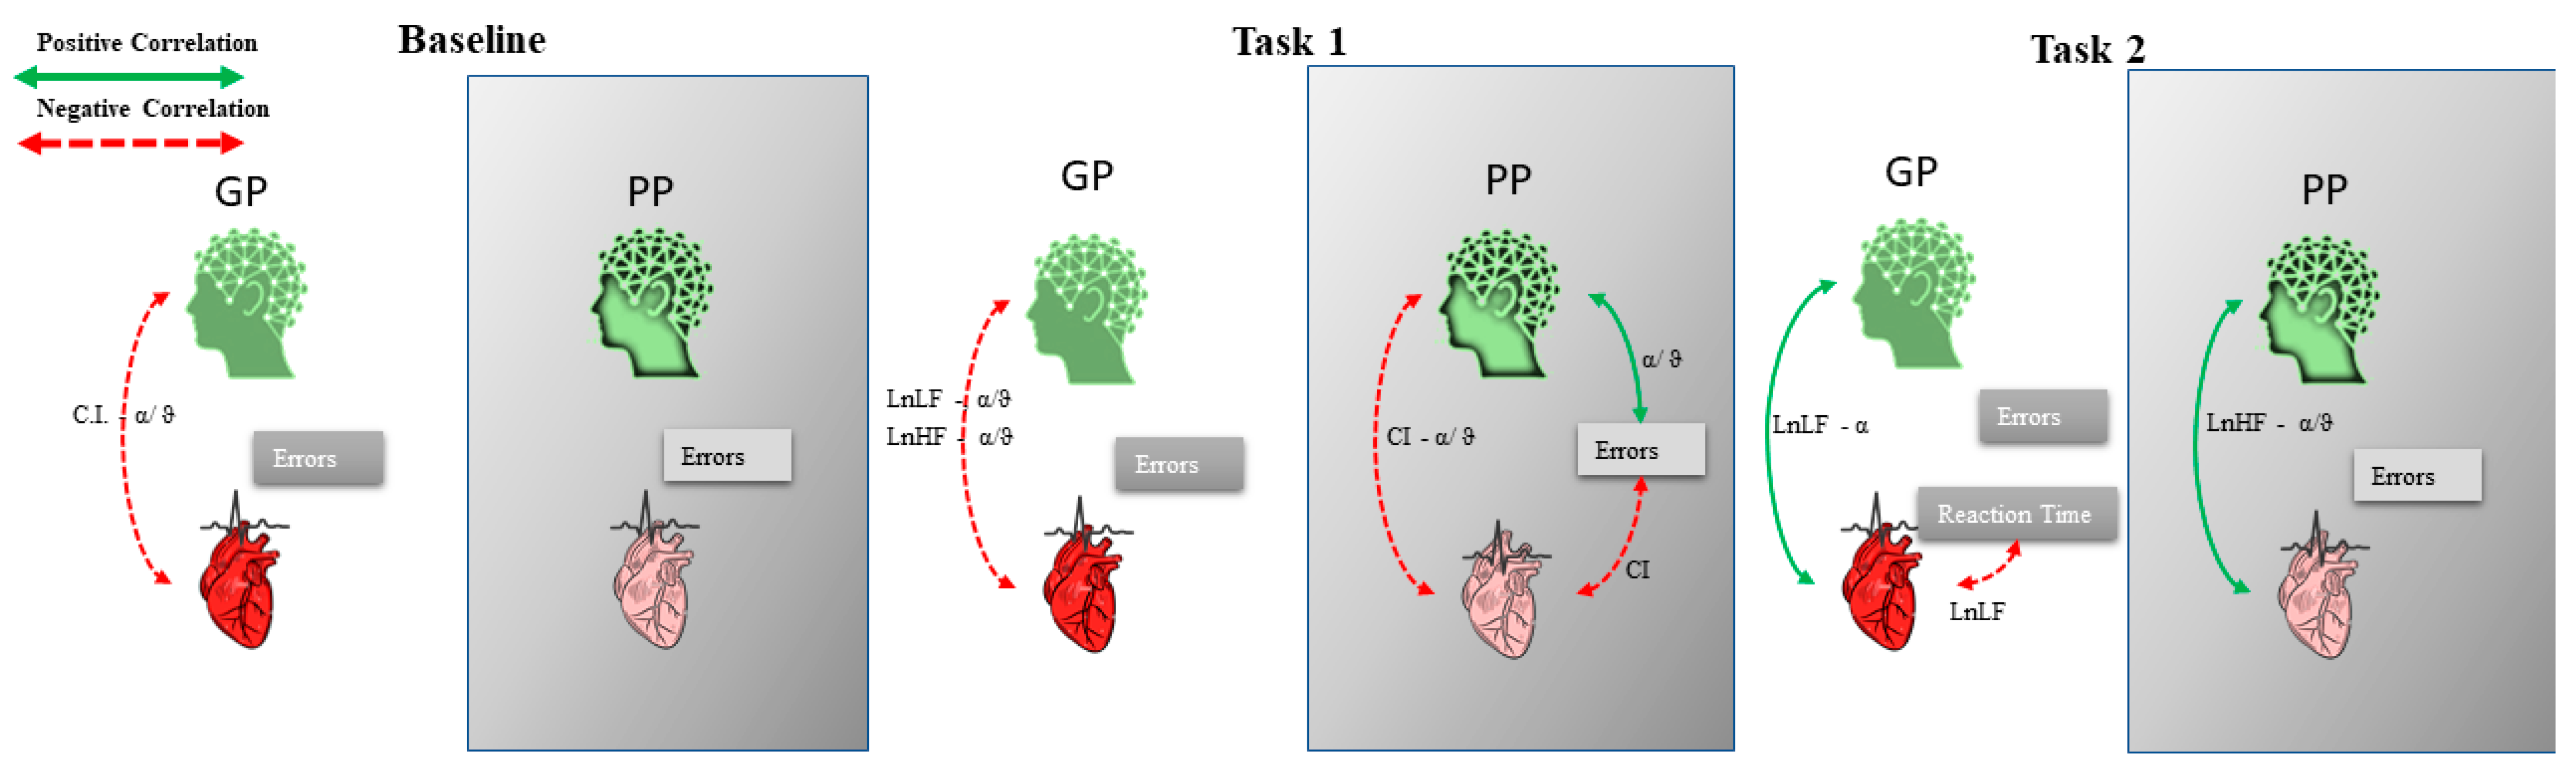
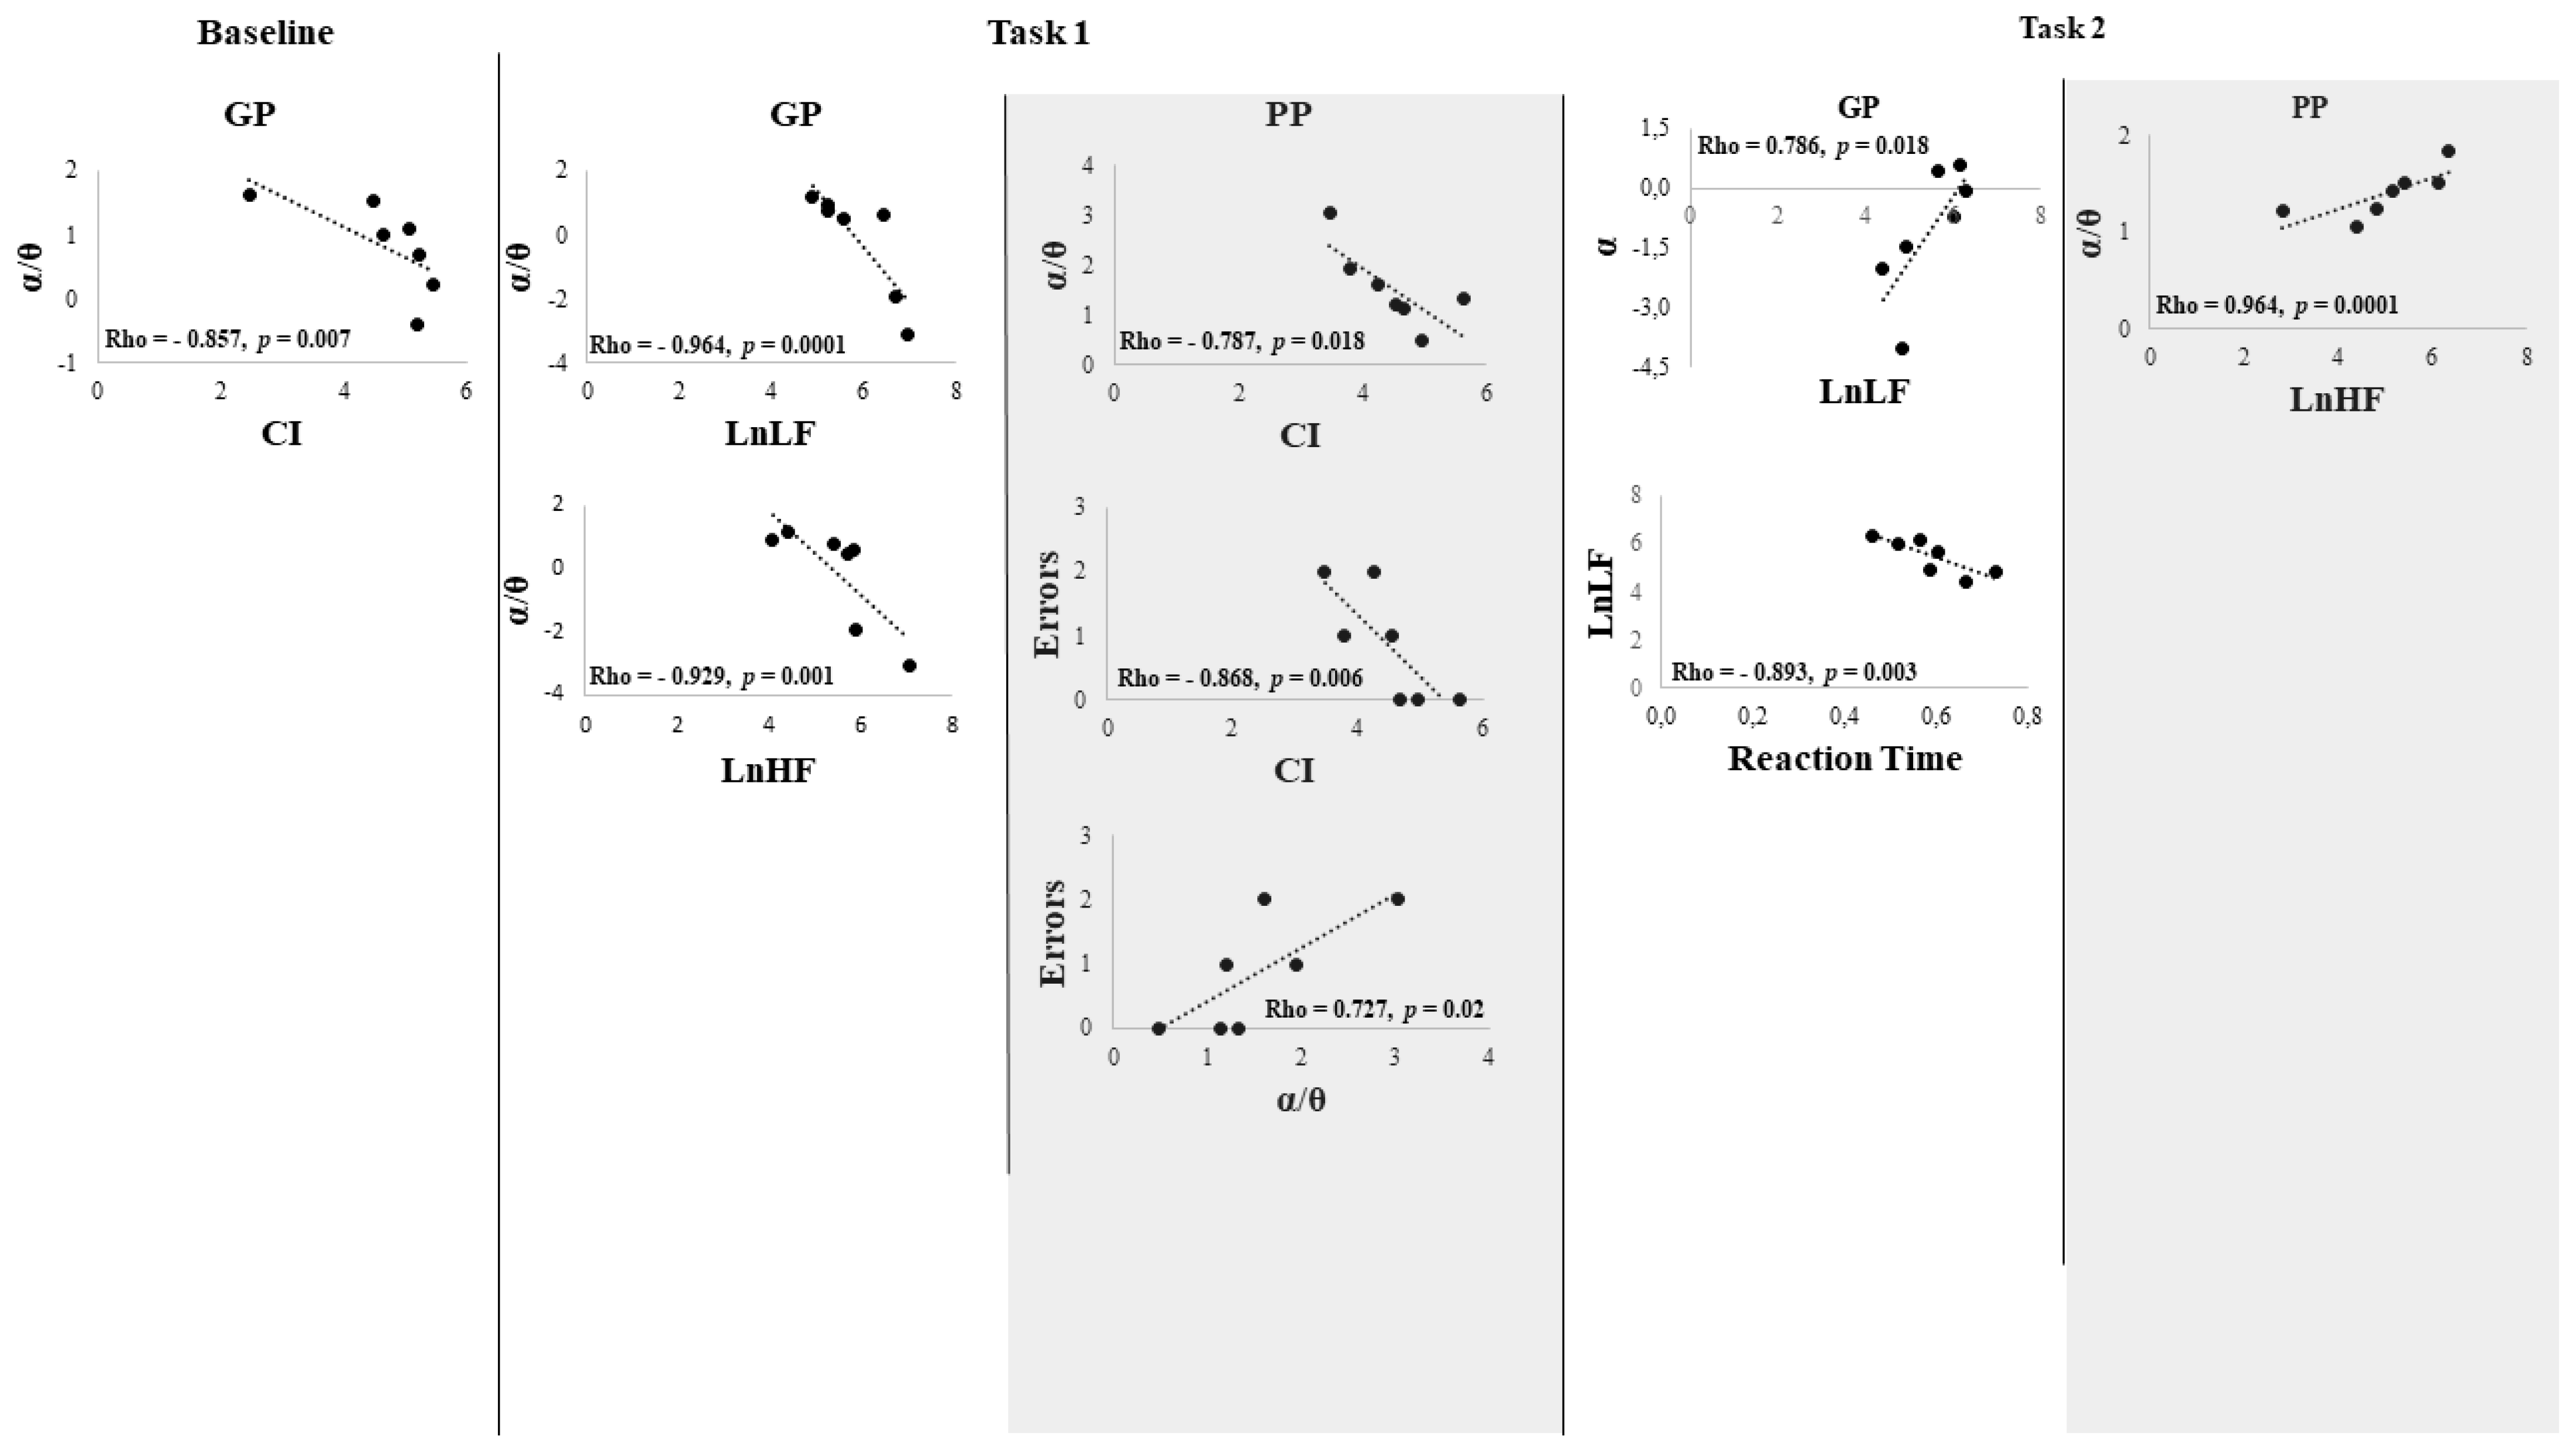
3. Results
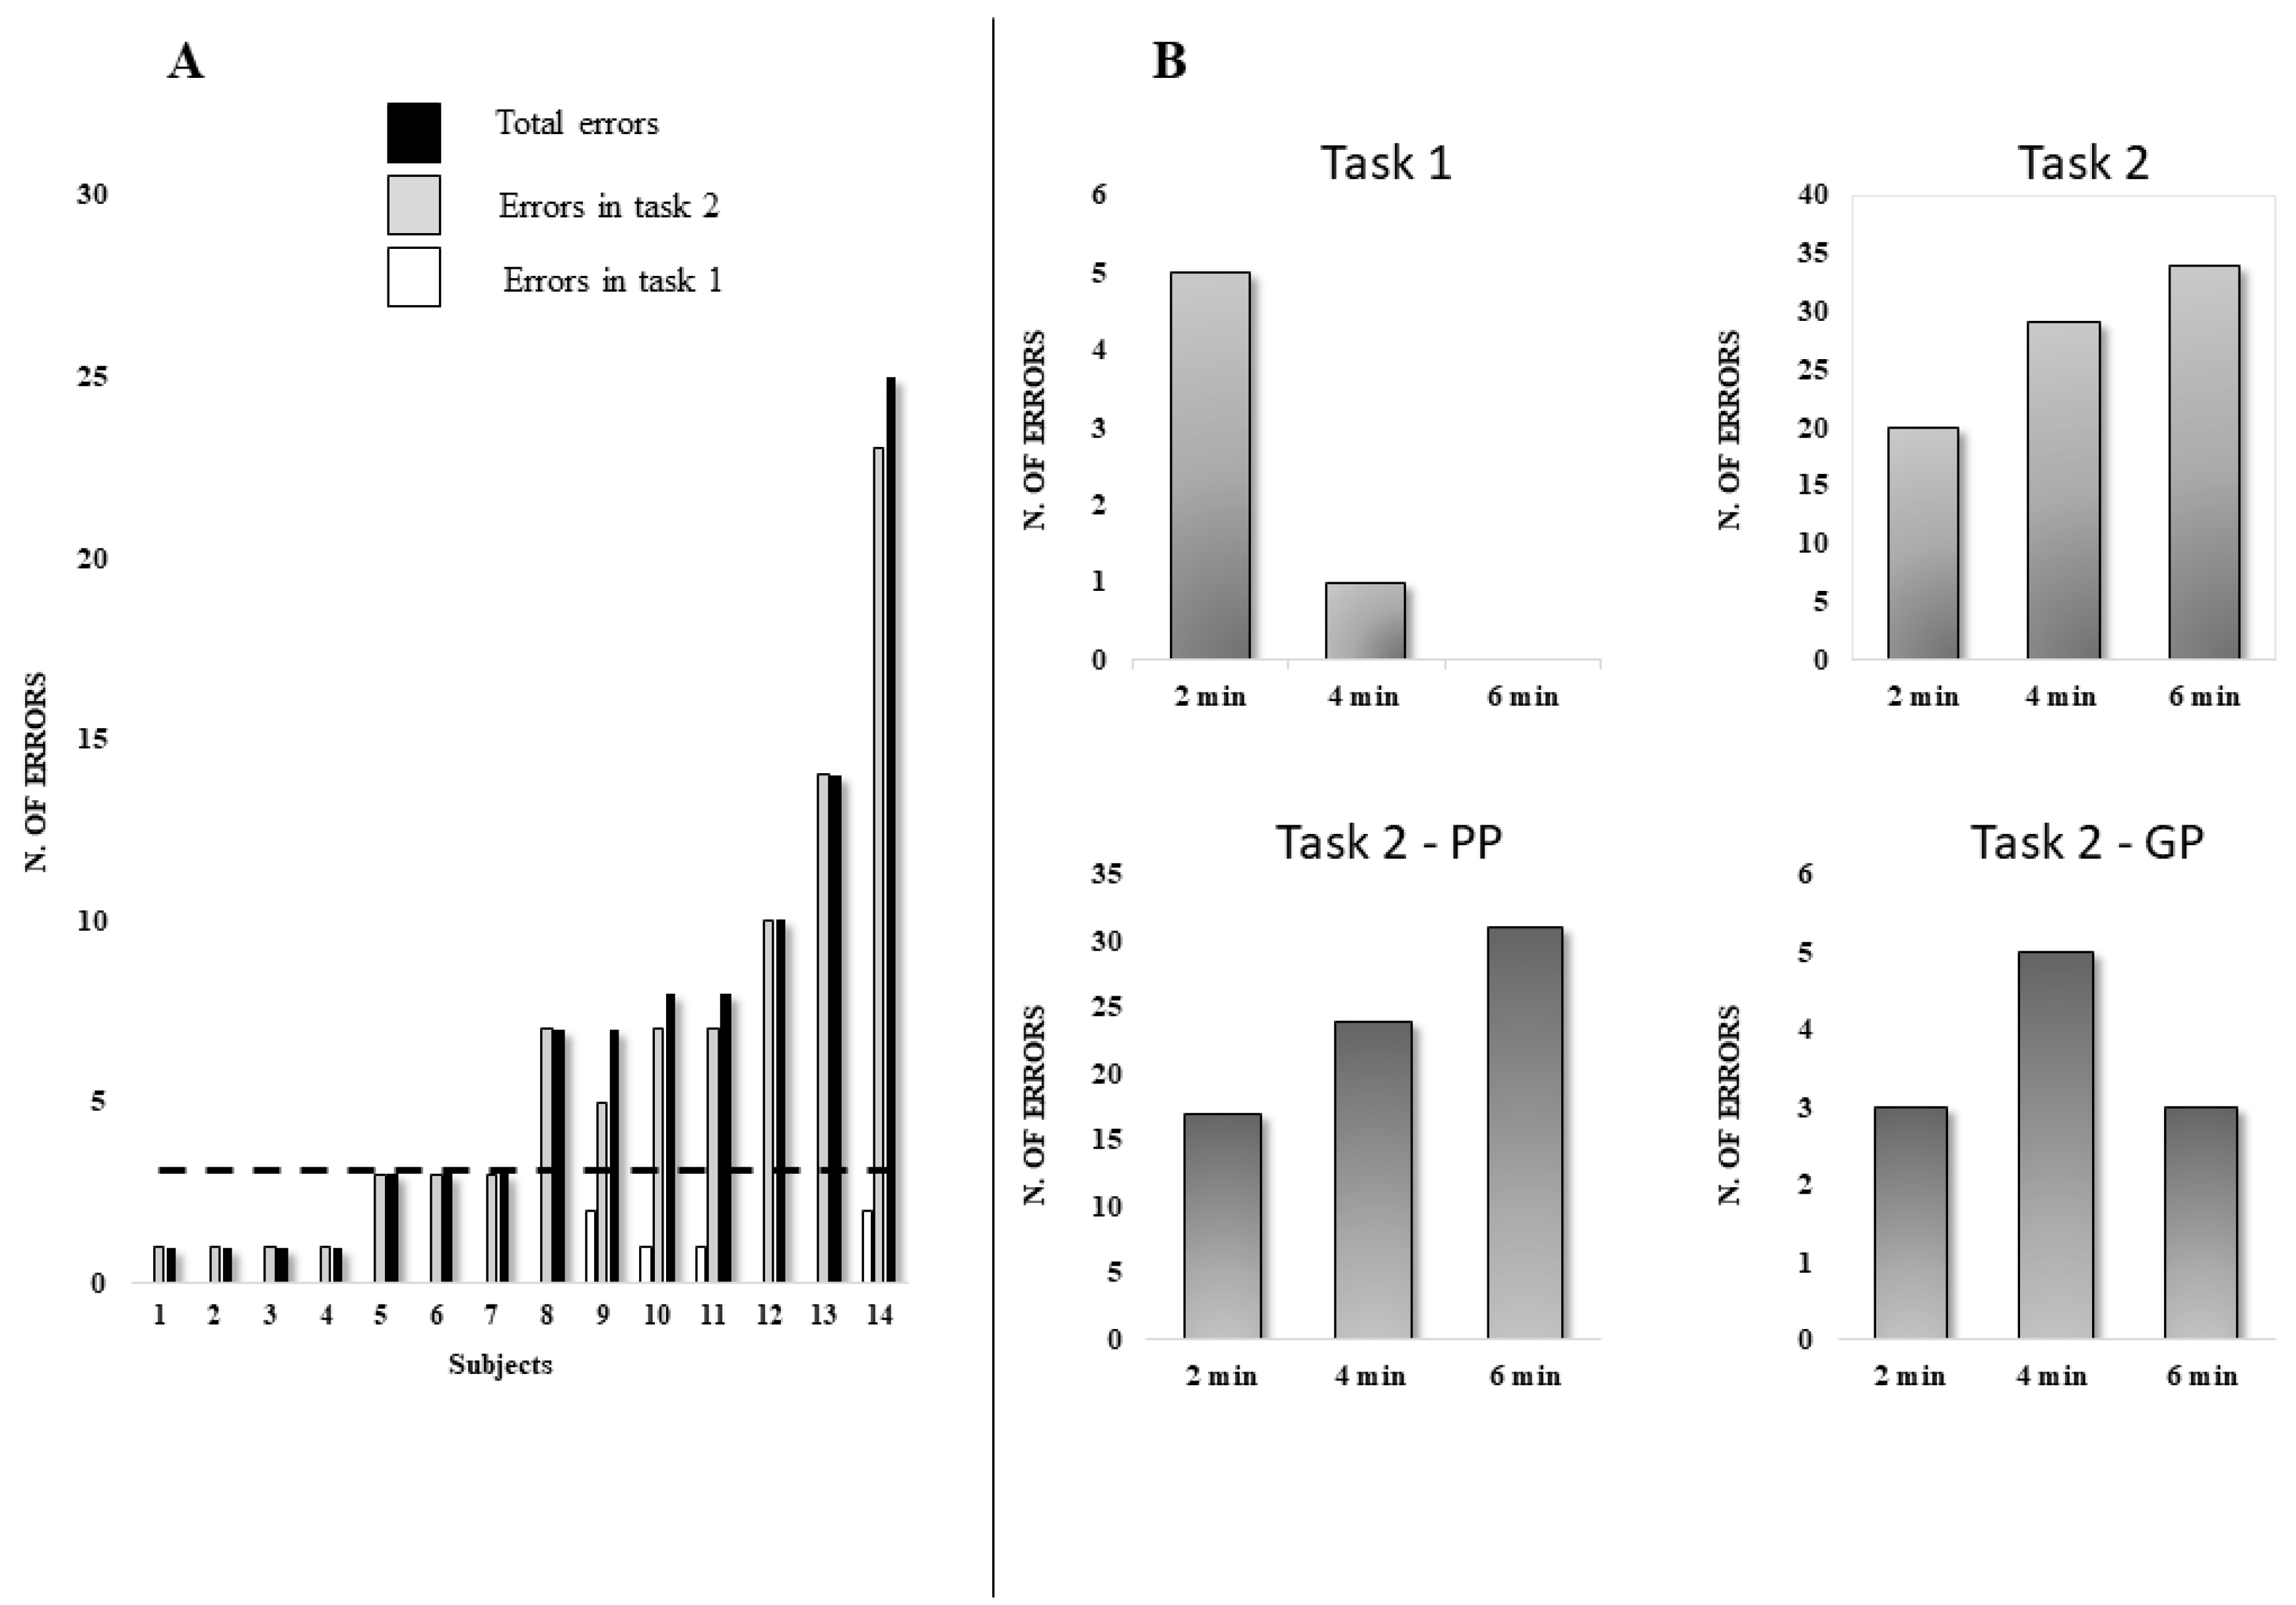
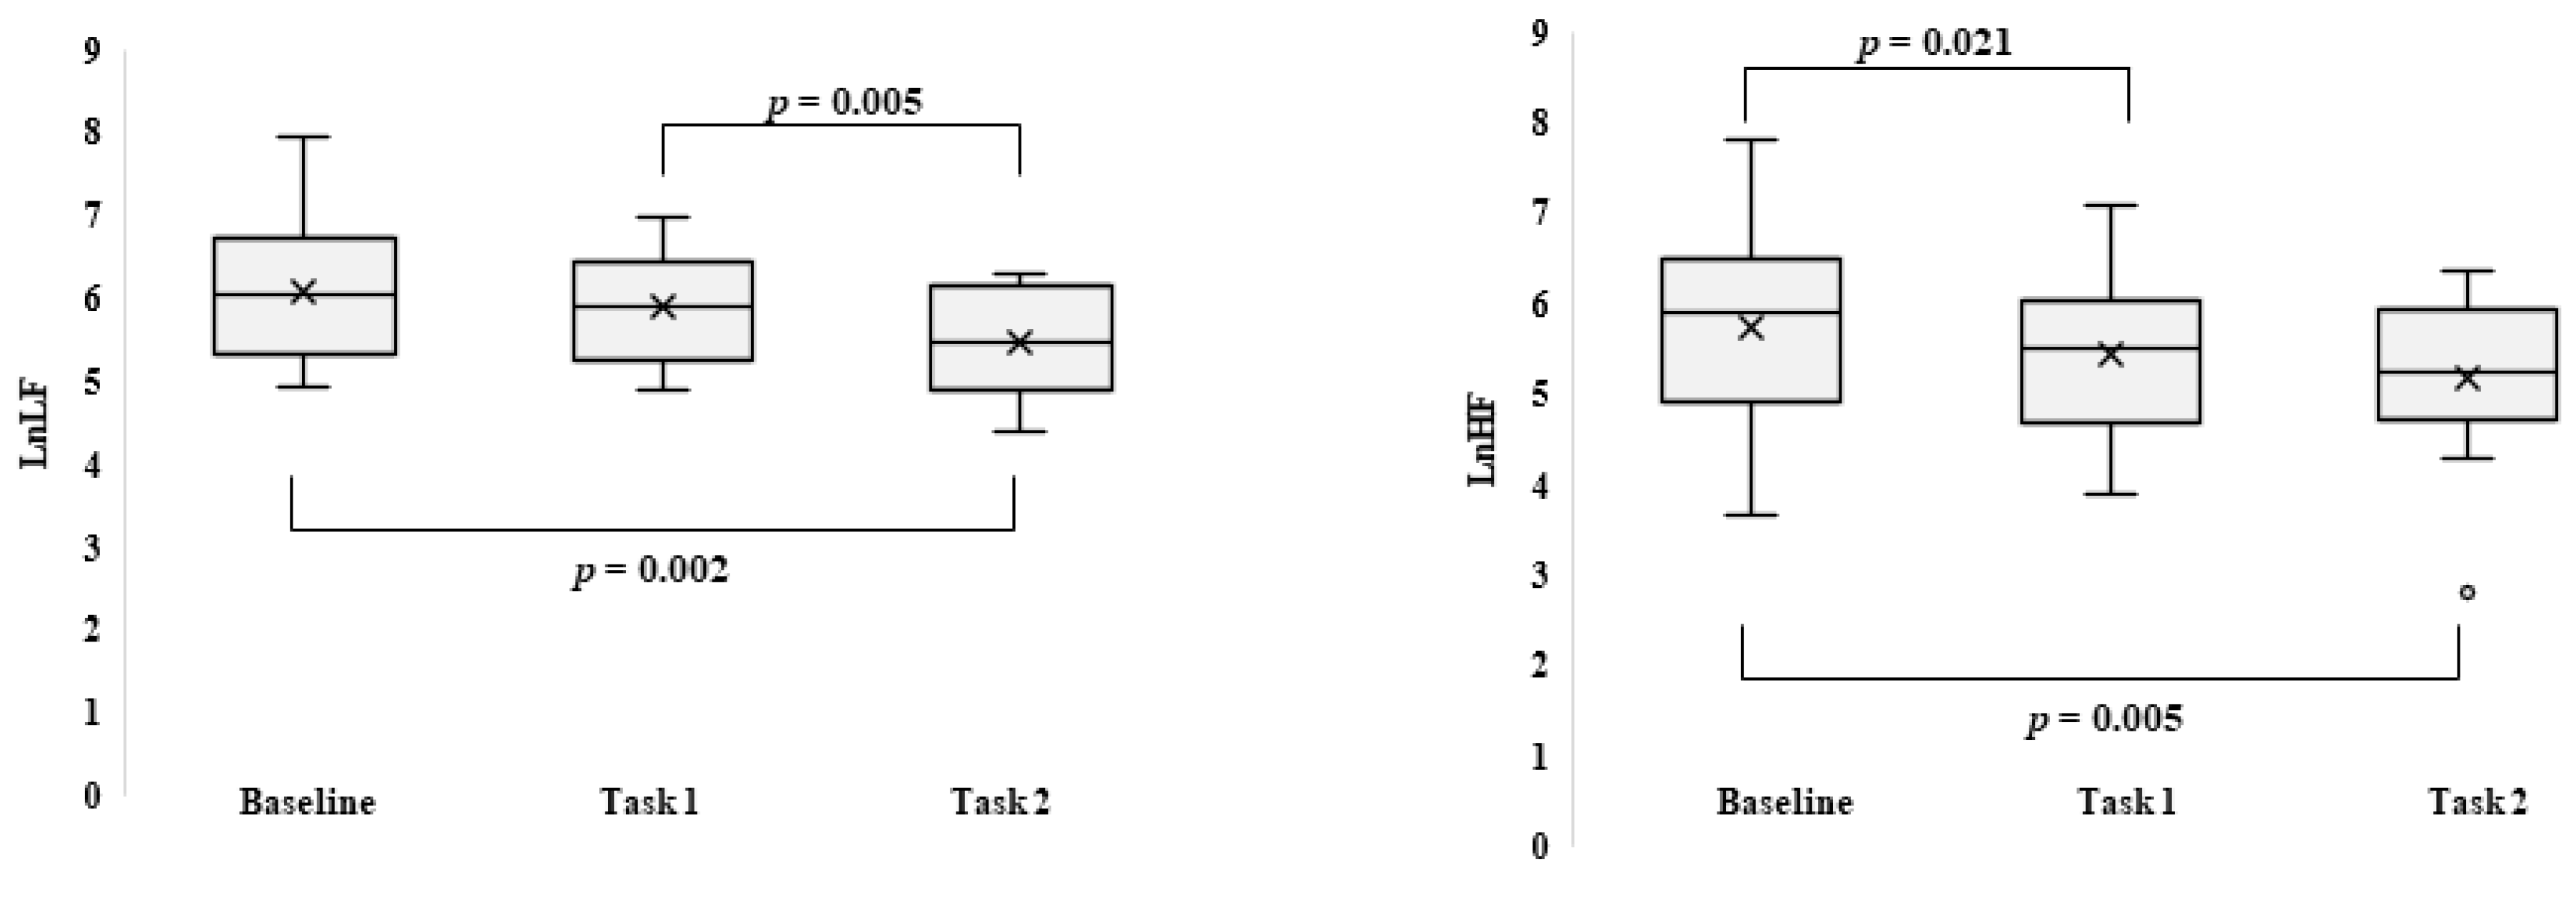
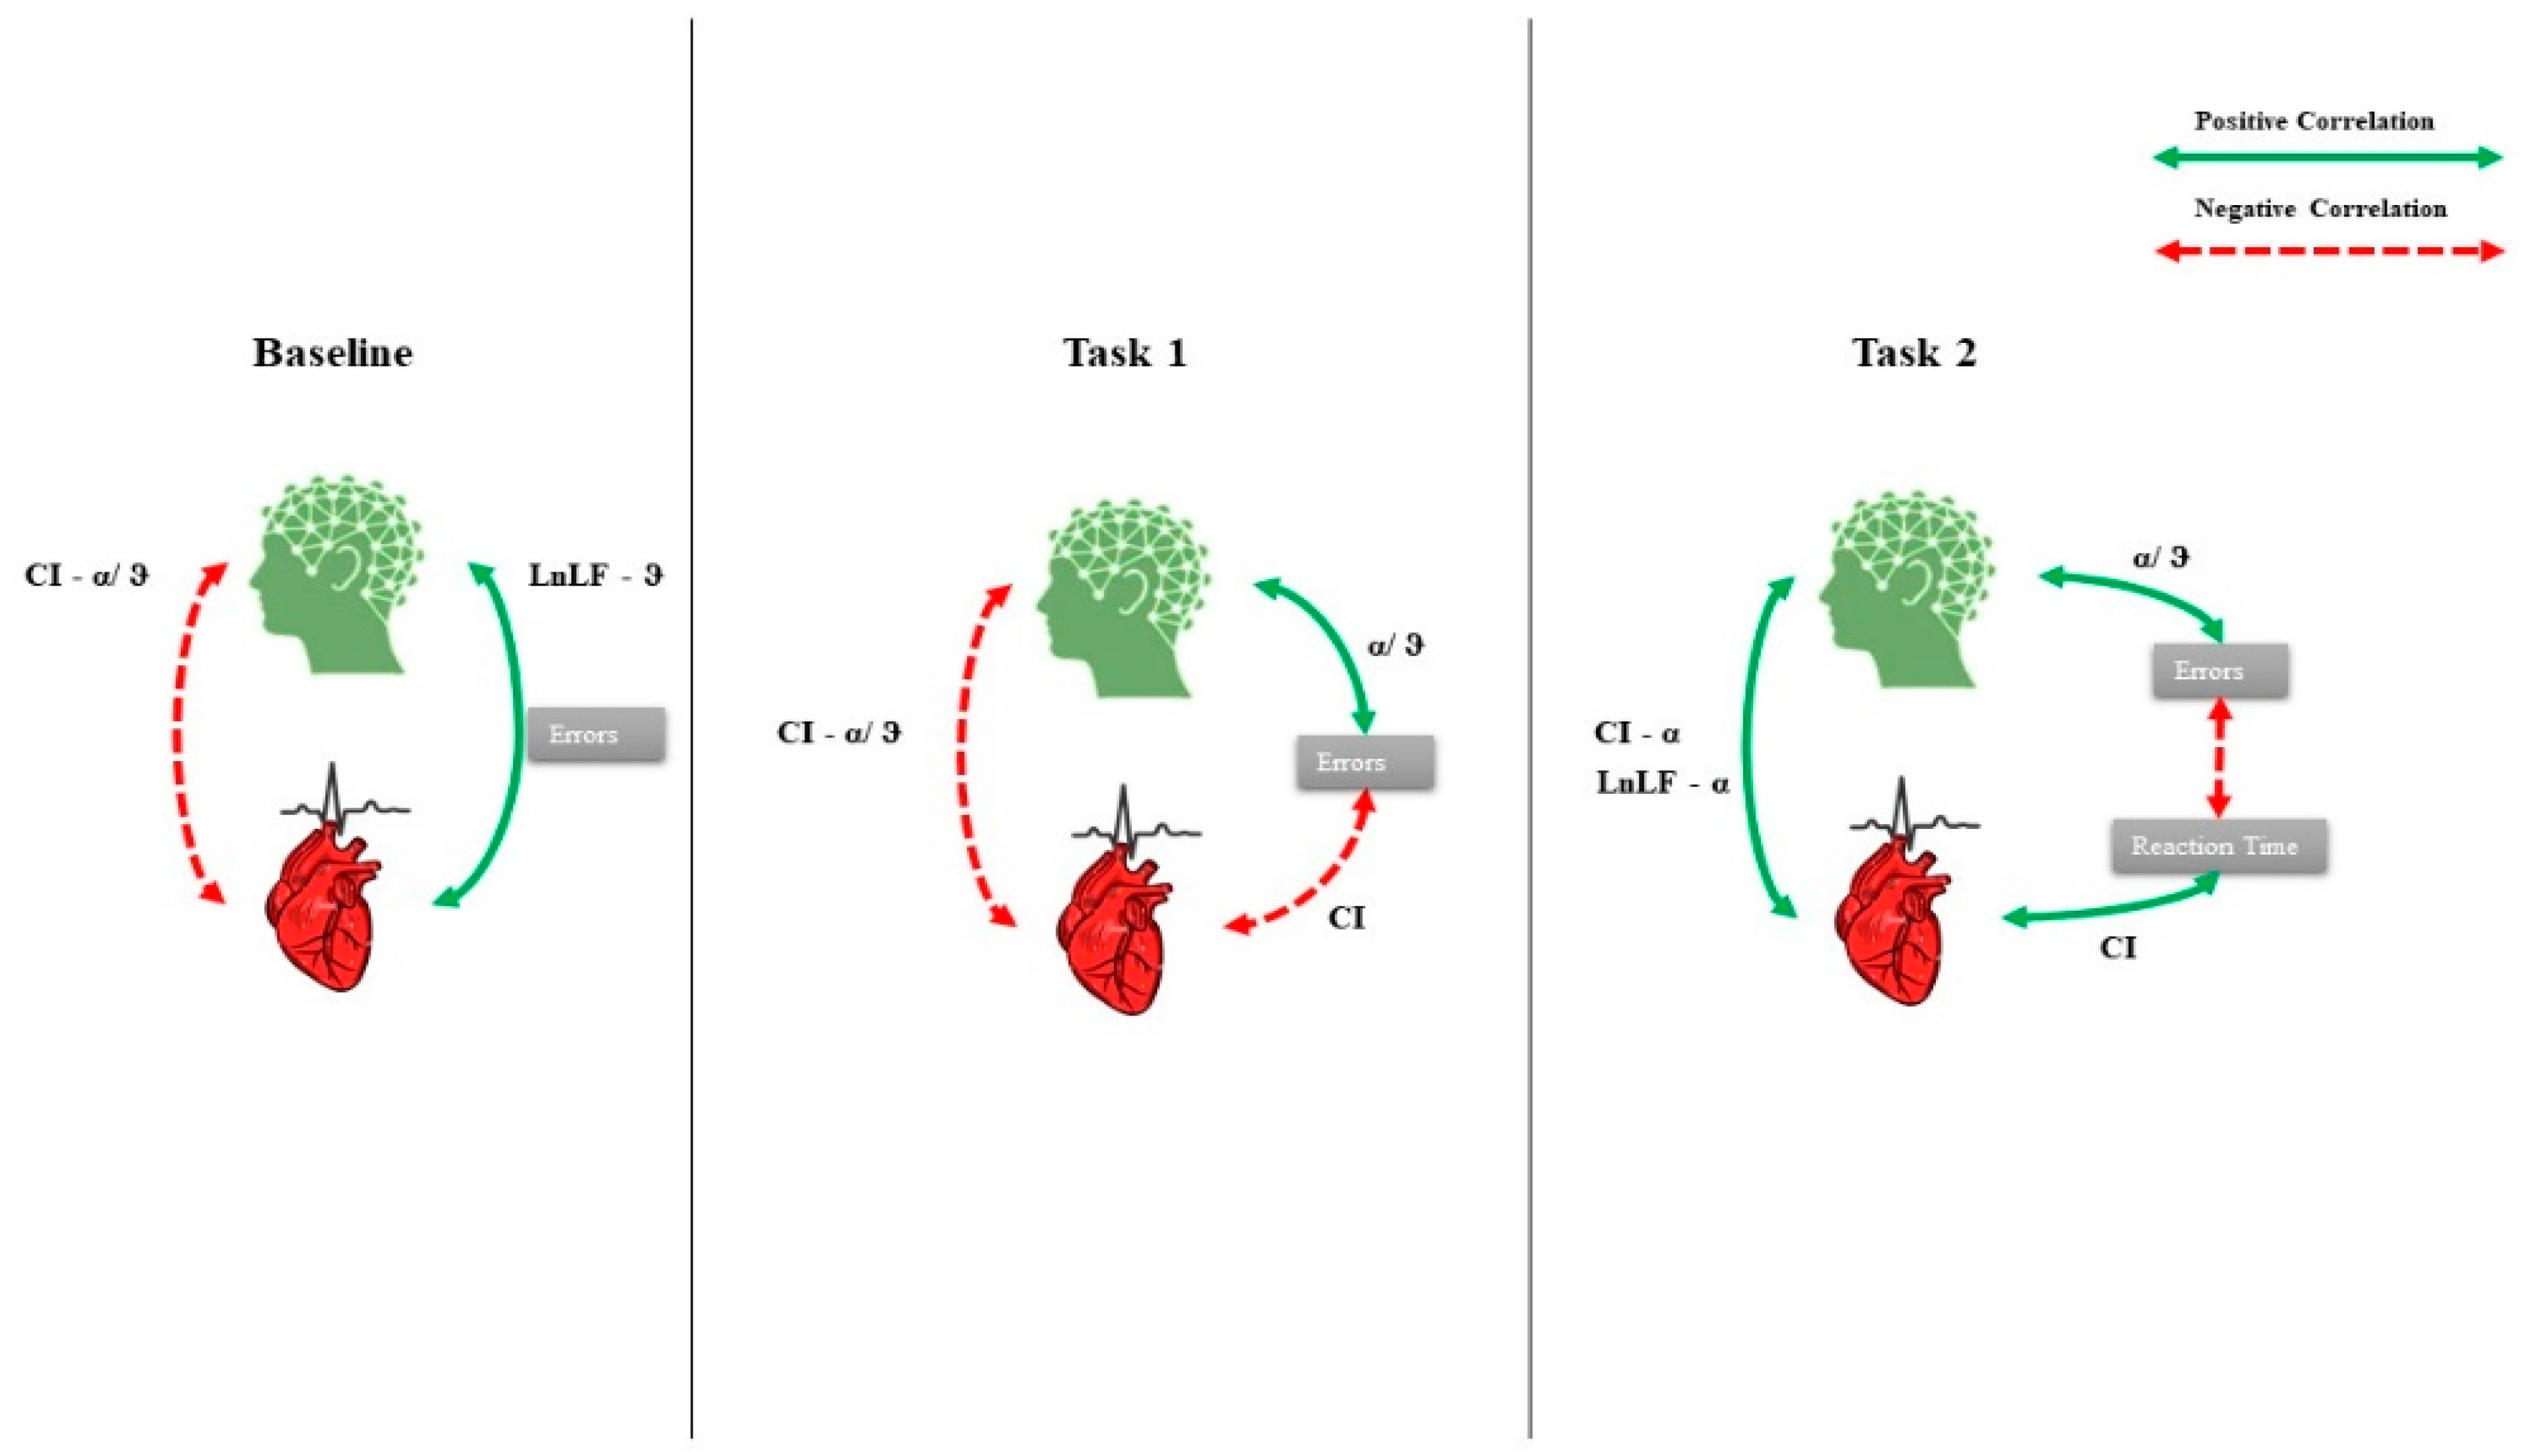
Behavioral Data
4. Discussion
Limitations
5. Conclusions
Author Contributions
Funding
Institutional Review Board Statement
Informed Consent Statement
Data Availability Statement
Conflicts of Interest
References
- Miyake, A.; Friedman, N.P. The Nature and Organization of Individual Differences in Executive Functions: Four General Conclusions. Curr. Dir. Psychol. Sci. 2012, 21, 8–14. [Google Scholar] [CrossRef] [PubMed]
- Fuster, J.M. The Prefrontal Cortex, 4th ed.; Academic Press/Elsevier: Amsterdam, The Netherlands; Boston, MA, USA; ISBN 978-0-12-373644-4.
- Munakata, Y.; Herd, S.A.; Chatham, C.H.; Depue, B.E.; Banich, M.T.; O’Reilly, R.C. A Unified Framework for Inhibitory Control. Trends Cogn. Sci. 2011, 15, 453–459. [Google Scholar] [CrossRef] [PubMed]
- Benarroch, E.E. The Central Autonomic Network: Functional Organization, Dysfunction, and Perspective. Mayo Clin. Proc. 1993, 68, 988–1001. [Google Scholar] [CrossRef]
- Benarroch, E.; Singer, W.; Mauermann, M. Autonomic Neurology; Oxford University Press: Oxford, UK, 2014; ISBN 978-0-19-992019-8. [Google Scholar]
- Saper, C.B. The Central Autonomic Nervous System: Conscious Visceral Perception and Autonomic Pattern Generation. Annu. Rev. Neurosci. 2002, 25, 433–469. [Google Scholar] [CrossRef] [PubMed]
- Cacioppo, J.T.; Tassinary, L.G.; Berntson, G. Handbook of Psychophysiology; Cambridge University Press: Cambridge, UK, 2007; ISBN 0-521-84471-1. [Google Scholar]
- Friedman, B.H. An Autonomic Flexibility–Neurovisceral Integration Model of Anxiety and Cardiac Vagal Tone. Biol. Psychol. 2007, 74, 185–199. [Google Scholar] [CrossRef] [PubMed]
- Riganello, F. Responsiveness and the Autonomic Control–CNS Two-Way Interaction in Disorders of Consciousness. In Brain Function and Responsiveness in Disorders of Consciousness; Monti, M.M., Sannita, W.G., Eds.; Springer International Publishing: Cham, 2016; pp. 145–155. ISBN 978-3-319-21424-5. [Google Scholar]
- Vernieri, F.; Altamura, C.; Palazzo, P.; Altavilla, R.; Fabrizio, E.; Fini, R.; Melgari, J.-M.; Paolucci, M.; Pasqualetti, P.; Maggio, P. 1-Hz Repetitive Transcranial Magnetic Stimulation Increases Cerebral Vasomotor Reactivity: A Possible Autonomic Nervous System Modulation. Brain Stimulat. 2014, 7, 281–286. [Google Scholar] [CrossRef]
- Gulli, G.; Tarperi, C.; Cevese, A.; Acler, M.; Bongiovanni, G.; Manganotti, P. Effects of Prefrontal Repetitive Transcranial Magnetic Stimulation on the Autonomic Regulation of Cardiovascular Function. Exp. Brain Res. 2013, 226, 265–271. [Google Scholar] [CrossRef]
- Triggiani, A.I.; Valenzano, A.; Del Percio, C.; Marzano, N.; Soricelli, A.; Petito, A.; Bellomo, A.; Başar, E.; Mundi, C.; Cibelli, G.; et al. Resting State Rolandic Mu Rhythms Are Related to Activity of Sympathetic Component of Autonomic Nervous System in Healthy Humans. Int. J. Psychophysiol. 2016, 103, 79–87. [Google Scholar] [CrossRef]
- Napadow, V.; Dhond, R.; Conti, G.; Makris, N.; Brown, E.N.; Barbieri, R. Brain Correlates of Autonomic Modulation: Combining Heart Rate Variability with FMRI. NeuroImage 2008, 42, 169–177. [Google Scholar] [CrossRef]
- Thayer, J.F.; Lane, R.D. Claude Bernard and the Heart–Brain Connection: Further Elaboration of a Model of Neurovisceral Integration. Neurosci. Biobehav. Rev. 2009, 33, 81–88. [Google Scholar] [CrossRef]
- Tonhajzerova, I.; Ondrejka, I.; Turianikova, Z.; Javorka, K.; Calkovska, A.; Javorka, M. Heart Rate Variability: An Index of the Brain–Heart Interaction. In Tachycardia; Jamada, T., Ed.; InTech: Rijeka, Croatia, 2012; pp. 185–202. [Google Scholar]
- Shaffer, F.; Ginsberg, J.P. An Overview of Heart Rate Variability Metrics and Norms. Front. Public Health 2017, 5. [Google Scholar] [CrossRef] [PubMed]
- Carney, R.M.; Freedland, K.E. Depression and Heart Rate Variability in Patients with Coronary Heart Disease. Cleve. Clin. J. Med. 2009, 76, S13–S17. [Google Scholar] [CrossRef] [PubMed]
- Mukhin, V.; Yakovlev, N.; Klimenko, V. An Association between Heart Rate Variability and Levels of Frontal Cortex Activation. Neurosci. Behav. Physiol. 2013, 43, 755–759. [Google Scholar] [CrossRef]
- Ottaviani, C.; Zingaretti, P.; Petta, A.M.; Antonucci, G.; Thayer, J.F.; Spitoni, G.F. Resting Heart Rate Variability Predicts Inhibitory Control above and beyond Impulsivity. J. Psychophysiol. 2019, 33, 198–206. [Google Scholar] [CrossRef]
- Delgado-Bonal, A.; Marshak, A. Approximate Entropy and Sample Entropy: A Comprehensive Tutorial. Entropy 2019, 21, 541. [Google Scholar] [CrossRef]
- Costa, M.; Goldberger, A.L.; Peng, C.-K. Multiscale Entropy Analysis of Biological Signals. Phys. Rev. E 2005, 71. [Google Scholar] [CrossRef] [PubMed]
- Bornas, X.; Llabrés, J.; Noguera, M.; López, A.M.; Gelabert, J.M.; Vila, I. Fear Induced Complexity Loss in the Electrocardiogram of Flight Phobics: A Multiscale Entropy Analysis. Biol. Psychol. 2006, 73, 272–279. [Google Scholar] [CrossRef] [PubMed]
- Deschodt-Arsac, V.; Blons, E.; Gilfriche, P.; Spiluttini, B.; Arsac, L.M. Entropy in Heart Rate Dynamics Reflects How HRV-Biofeedback Training Improves Neurovisceral Complexity during Stress-Cognition Interactions. Entropy 2020, 22, 317. [Google Scholar] [CrossRef]
- Riganello, F.; Larroque, S.K.; Bahri, M.A.; Heine, L.; Martial, C.; Carrière, M.; Charland-Verville, V.; Aubinet, C.; Vanhaudenhuyse, A.; Chatelle, C.; et al. A Heartbeat Away From Consciousness: Heart Rate Variability Entropy Can Discriminate Disorders of Consciousness and Is Correlated With Resting-State FMRI Brain Connectivity of the Central Autonomic Network. Front. Neurol. 2018, 9, 769. [Google Scholar] [CrossRef]
- Voss, A.; Heitmann, A.; Schroeder, R.; Peters, A.; Perz, S. Short-Term Heart Rate Variability–Age Dependence in Healthy Subjects. Physiol. Meas. 2012, 33, 1289–1311. [Google Scholar] [CrossRef]
- Forte, G.; Favieri, F.; Casagrande, M. Heart Rate Variability and Cognitive Function: A Systematic Review. Front. Neurosci. 2019, 13, 710. [Google Scholar] [CrossRef] [PubMed]
- Alba, G.; Vila, J.; Rey, B.; Montoya, P.; Muñoz, M.Á. The Relationship Between Heart Rate Variability and Electroencephalography Functional Connectivity Variability Is Associated With Cognitive Flexibility. Front. Hum. Neurosci. 2019, 13, 64. [Google Scholar] [CrossRef] [PubMed]
- Thayer, J.F.; Hansen, A.L.; Saus-Rose, E.; Johnsen, B.H. Heart Rate Variability, Prefrontal Neural Function, and Cognitive Performance: The Neurovisceral Integration Perspective on Self-Regulation, Adaptation, and Health. Ann. Behav. Med. 2009, 37, 141–153. [Google Scholar] [CrossRef] [PubMed]
- Bouny, P.; Deschodt-Arsac, V.; Touré, E.; Arsac, L. Entropy and Multifractality in Heart Rate Dynamics as Markers of Specific Brain-Heart Coordinations when Adapting to Cognitive Tasks. 2021. Available online: https://www.researchgate.net/profile/Pierre-Bouny/publication/359236090_Entropy_and_multifractality_in_heart_rate_dynamics_as_markers_of_specific_brain-heart_coordinations_when_adapting_to_cognitive_tasks/links/62309492d37dab4f96e67488/Entropy-and-multifractality-in-heart-rate-dynamics-as-markers-of-specific-brain-heart-coordinations-when-adapting-to-cognitive-tasks.pdf (accessed on 8 May 2022).
- Young, H.; Benton, D. We Should Be Using Nonlinear Indices When Relating Heart-Rate Dynamics to Cognition and Mood. Sci. Rep. 2015, 5, 16619. [Google Scholar] [CrossRef]
- Schomer, D.L.; Lopes da Silva, F.H. Niedermeyer’s Electroencephalography: Basic Principles, Clinical Applications, and Related Fields-Oxford Medicine, 7th ed.; Oxford University Press: Oxford, UK, 2017; ISBN 9780190228484. [Google Scholar]
- Lopes da Silva, F. Neural Mechanisms Underlying Brain Waves: From Neural Membranes to Networks. Electroencephalogr. Clin. Neurophysiol. 1991, 79, 81–93. [Google Scholar] [CrossRef]
- Clarke, A.R.; Barry, R.J. EEG Activity in Subtypes of Attention-Deficit/Hyperactivity Disorder. J. Neurother. 2005, 8, 43–62. [Google Scholar] [CrossRef]
- Lal, S.K.L.; Craig, A. Driver Fatigue: Electroencephalography and Psychological Assessment. Psychophysiology 2002, 39, 313–321. [Google Scholar] [CrossRef]
- Wascher, E.; Rasch, B.; Sänger, J.; Hoffmann, S.; Schneider, D.; Rinkenauer, G.; Heuer, H.; Gutberlet, I. Frontal Theta Activity Reflects Distinct Aspects of Mental Fatigue. Biol. Psychol. 2014, 96, 57–65. [Google Scholar] [CrossRef]
- O’Connell, R.G.; Dockree, P.M.; Robertson, I.H.; Bellgrove, M.A.; Foxe, J.J.; Kelly, S.P. Uncovering the Neural Signature of Lapsing Attention: Electrophysiological Signals Predict Errors up to 20 s before They Occur. J. Neurosci. Off. J. Soc. Neurosci. 2009, 29, 8604–8611. [Google Scholar] [CrossRef]
- Makeig, S.; Jung, T.P. Changes in Alertness Are a Principal Component of Variance in the EEG Spectrum. Neuroreport 1995, 7, 213–216. [Google Scholar] [CrossRef]
- Gratton, G. Brain Reflections: A Circuit-based Framework for Understanding Information Processing and Cognitive Control. Psychophysiology 2018, 55, e13038. [Google Scholar] [CrossRef] [PubMed]
- Antonucci, G.; Spitoni, G.F.; Orsini, A.; D’Olimpio, F.; Cantagallo, A. Taratura Italiana Della Batteria per La Valutazione Della Sindrome Disesecutiva: BADS. Available online: https://iris.unicampania.it/handle/11591/159383?mode=full.274 (accessed on 22 April 2022).
- Espinosa, A.; Alegret, M.; Boada, M.; Vinyes, G.; Valero, S.; Martínez-Lage, P.; Peña-Casanova, J.; Becker, J.T.; Wilson, B.A.; Tárraga, L. Ecological Assessment of Executive Functions in Mild Cognitive Impairment and Mild Alzheimer’s Disease. J. Int. Neuropsychol. Soc. JINS 2009, 15, 751–757. [Google Scholar] [CrossRef] [PubMed]
- Siegel, S. Nonparametric Statistics. Am. Stat. 1957, 11, 13. [Google Scholar] [CrossRef]
- Gibbons, J.D.; Chakraborti, S. Nonparametric Statistical Inference. In International Encyclopedia of Statistical Science; Lovric, M., Ed.; Springer: Berlin/Heidelberg, Germany, 2011; pp. 977–979. ISBN 978-3-642-04897-5. [Google Scholar]
- Mishra, P.; Pandey, C.M.; Singh, U.; Keshri, A.; Sabaretnam, M. Selection of Appropriate Statistical Methods for Data Analysis. Ann. Card. Anaesth. 2019, 22, 297–301. [Google Scholar] [CrossRef]
- Ghasemi, A.; Zahediasl, S. Normality Tests for Statistical Analysis: A Guide for Non-Statisticians. Int. J. Endocrinol. Metab. 2012, 10, 486–489. [Google Scholar] [CrossRef]
- Jurysta, F.; van de Borne, P.; Migeotte, P.-F.; Dumont, M.; Lanquart, J.-P.; Degaute, J.-P.; Linkowski, P. A Study of the Dynamic Interactions between Sleep EEG and Heart Rate Variability in Healthy Young Men. Clin. Neurophysiol. 2003, 114, 2146–2155. [Google Scholar] [CrossRef]
- Chang, C.; Metzger, C.D.; Glover, G.H.; Duyn, J.H.; Heinze, H.-J.; Walter, M. Association between Heart Rate Variability and Fluctuations in Resting-State Functional Connectivity. NeuroImage 2013, 68, 93–104. [Google Scholar] [CrossRef]
- Jennings, J.R.; Sheu, L.K.; Kuan, D.C.-H.; Manuck, S.B.; Gianaros, P.J. Resting State Connectivity of the Medial Prefrontal Cortex Covaries with Individual Differences in High-Frequency Heart Rate Variability. Psychophysiology 2016, 53, 444–454. [Google Scholar] [CrossRef]
- Sakaki, M.; Yoo, H.J.; Nga, L.; Lee, T.-H.; Thayer, J.F.; Mather, M. Heart Rate Variability Is Associated with Amygdala Functional Connectivity with MPFC across Younger and Older Adults. NeuroImage 2016, 139, 44–52. [Google Scholar] [CrossRef]
- Melo, H.M.; Nascimento, L.M.; Takase, E. Mental Fatigue and Heart Rate Variability (HRV): The Time-on-Task Effect. Psychol. Neurosci. 2017, 10, 428–436. [Google Scholar] [CrossRef]
- Thayer, J.F.; Friedman, B.H.; Borkovec, T.D. Autonomic Characteristics of Generalized Anxiety Disorder and Worry. Biol. Psychiatry 1996, 39, 255–266. [Google Scholar] [CrossRef]
- Verkuil, B.; Brosschot, J.F.; Borkovec, T.D.; Thayer, J.F. Acute Autonomic Effects of Experimental Worry and Cognitive Problem Solving: Why Worry about Worry? Int. J. Clin. Health Psychol. 2009, 9, 439–453. [Google Scholar]
- Lane, R.; Mcrae, K.; Reiman, E.; Chen, K.; Ahern, G.; Thayer, J. Neural Correlates of Heart Rate Variability during Emotion. NeuroImage 2009, 44, 213–222. [Google Scholar] [CrossRef] [PubMed]
- Thayer, J.F.; Åhs, F.; Fredrikson, M.; Sollers, J.J.; Wager, T.D. A Meta-Analysis of Heart Rate Variability and Neuroimaging Studies: Implications for Heart Rate Variability as a Marker of Stress and Health. Neurosci. Biobehav. Rev. 2012, 36, 747–756. [Google Scholar] [CrossRef] [PubMed]
- Jennings, J.R.; Allen, B.; Gianaros, P.J.; Thayer, J.F.; Manuck, S.B. Focusing Neurovisceral Integration: Cognition, Heart Rate Variability, and Cerebral Blood Flow. Psychophysiology 2015, 52, 214–224. [Google Scholar] [CrossRef] [PubMed]
- Riganello, F.; Larroque, S.K.; Di Perri, C.; Prada, V.; Sannita, W.G.; Laureys, S. Measures of CNS-Autonomic Interaction and Responsiveness in Disorder of Consciousness. Front. Neurosci. 2019, 13, 530. [Google Scholar] [CrossRef] [PubMed]
- Riganello, F.; Vatrano, M.; Carozzo, S.; Russo, M.; Lucca, L.F.; Ursino, M.; Ruggiero, V.; Cerasa, A.; Porcaro, C. The Timecourse of Electrophysiological Brain–Heart Interaction in DoC Patients. Brain Sci. 2021, 11, 750. [Google Scholar] [CrossRef]
- Benarroch, E.E. The Autonomic Nervous System: Basic Anatomy and Physiology. Contin. Lifelong Learn. Neurol. 2007, 13, 13–32. [Google Scholar] [CrossRef]
- Hansen, A.L.; Murison, R.; Eid, J.; Thayer, J.F. Heart Rate Variability and Cortisol Responses during Attentional and Working Memory Tasks in Naval Cadets. Int. Marit. Health 2012, 63, 181–187. [Google Scholar]
- Blons, E.; Arsac, L.M.; Gilfriche, P.; McLeod, H.; Lespinet-Najib, V.; Grivel, E.; Deschodt-Arsac, V. Alterations in Heart-Brain Interactions under Mild Stress during a Cognitive Task Are Reflected in Entropy of Heart Rate Dynamics. Sci. Rep. 2019, 9, 18190. [Google Scholar] [CrossRef]
- Riganello, F.; Zubler, F.; Haenggi, M.; De Lucia, M. Heart Rate Complexity: An Early Prognostic Marker of Patient Outcome after Cardiac Arrest. Clin. Neurophysiol. 2022, 134, 27–33. [Google Scholar] [CrossRef] [PubMed]
- Hansen, A.L.; Johnsen, B.H.; Thayer, J.F. Vagal Influence on Working Memory and Attention. Int. J. Psychophysiol. Off. J. Int. Organ. Psychophysiol. 2003, 48, 263–274. [Google Scholar] [CrossRef]
- Benedek, M.; Schickel, R.J.; Jauk, E.; Fink, A.; Neubauer, A.C. Alpha Power Increases in Right Parietal Cortex Reflects Focused Internal Attention. Neuropsychologia 2014, 56, 393–400. [Google Scholar] [CrossRef] [PubMed]
- Brier, M.R.; Ferree, T.C.; Maguire, M.J.; Moore, P.; Spence, J.; Tillman, G.D.; Hart, J.; Kraut, M.A. Frontal Theta and Alpha Power and Coherence Changes Are Modulated by Semantic Complexity in Go/NoGo Tasks. Int. J. Psychophysiol. 2010, 78, 215–224. [Google Scholar] [CrossRef]
- Kubota, Y.; Sato, W.; Toichi, M.; Murai, T.; Okada, T.; Hayashi, A.; Sengoku, A. Frontal Midline Theta Rhythm Is Correlated with Cardiac Autonomic Activities during the Performance of an Attention Demanding Meditation Procedure. Brain Res. Cogn. Brain Res. 2001, 11, 281–287. [Google Scholar] [CrossRef]
- Laukka, S.J.; Järvilehto, T.; Alexandrov, Y.I.; Lindqvist, J. Frontal Midline Theta Related to Learning in a Simulated Driving Task. Biol. Psychol. 1995, 40, 313–320. [Google Scholar] [CrossRef]
- Williams, J.D.; Gruzelier, J.H. Differentiation of Hypnosis and Relaxation by Analysis of Narrow Band Theta and Alpha Frequencies. Int. J. Clin. Exp. Hypn. 2001, 49, 185–206. [Google Scholar] [CrossRef]
- Klimesch, W. Alpha-Band Oscillations, Attention, and Controlled Access to Stored Information. Trends Cogn. Sci. 2012, 16, 606–617. [Google Scholar] [CrossRef]
- Novikov, N.A.; Bryzgalov, D.V.; Chernyshev, B.V. Theta and Alpha Band Modulations Reflect Error-Related Adjustments in the Auditory Condensation Task. Front. Hum. Neurosci. 2015, 9, 673. [Google Scholar] [CrossRef][Green Version]
- Prochnow, A.; Eggert, E.; Münchau, A.; Mückschel, M.; Beste, C. Alpha and Theta Bands Dynamics Serve Distinct Functions during Perception–Action Integration in Response Inhibition. J. Cogn. Neurosci. 2022, 34, 1053–1069. [Google Scholar] [CrossRef]
- Hanslmayr, S.; Gross, J.; Klimesch, W.; Shapiro, K. The Role of α Oscillations in Temporal Attention. Brain Res. Rev. 2011, 67, 331–343. [Google Scholar] [CrossRef] [PubMed]
- Jausovec, N.; Jausovec, K.; Gerlic, I. Differences in Event-Related and Induced EEG Patterns in the Theta and Alpha Frequency Bands Related to Human Emotional Intelligence. Neurosci. Lett. 2001, 311, 93–96. [Google Scholar] [CrossRef]
- Jensen, O.; Mazaheri, A. Shaping Functional Architecture by Oscillatory Alpha Activity: Gating by Inhibition. Front. Hum. Neurosci. 2010, 4, 186. [Google Scholar] [CrossRef] [PubMed]
- Mathewson, K.; Lleras, A.; Beck, D.; Fabiani, M.; Ro, T.; Gratton, G. Pulsed Out of Awareness: EEG Alpha Oscillations Represent a Pulsed-Inhibition of Ongoing Cortical Processing. Front. Psychol. 2011, 2, 99. [Google Scholar] [CrossRef] [PubMed]
- Pscherer, C.; Mückschel, M.; Summerer, L.; Bluschke, A.; Beste, C. On the Relevance of EEG Resting Theta Activity for the Neurophysiological Dynamics Underlying Motor Inhibitory Control. Hum. Brain Mapp. 2019, 40, 4253–4265. [Google Scholar] [CrossRef] [PubMed]
- Gratton, G.; Cooper, P.; Fabiani, M.; Carter, C.S.; Karayanidis, F. Dynamics of Cognitive Control: Theoretical Bases, Paradigms, and a View for the Future. Psychophysiology 2018, 55, e13016. [Google Scholar] [CrossRef] [PubMed]
- Mathewson, K.E.; Gratton, G.; Fabiani, M.; Beck, D.M.; Ro, T. To See or Not to See: Prestimulus Alpha Phase Predicts Visual Awareness. J. Neurosci. Off. J. Soc. Neurosci. 2009, 29, 2725–2732. [Google Scholar] [CrossRef]
- Carp, J.; Compton, R.J. Alpha Power Is Influenced by Performance Errors. Psychophysiology 2009, 46, 336–343. [Google Scholar] [CrossRef]
- Mazaheri, A.; Nieuwenhuis, I.L.C.; van Dijk, H.; Jensen, O. Prestimulus Alpha and Mu Activity Predicts Failure to Inhibit Motor Responses. Hum. Brain Mapp. 2009, 30, 1791–1800. [Google Scholar] [CrossRef]
- Van Driel, J.; Ridderinkhof, K.R.; Cohen, M.X. Not All Errors Are Alike: Theta and Alpha EEG Dynamics Relate to Differences in Error-Processing Dynamics. J. Neurosci. Off. J. Soc. Neurosci. 2012, 32, 16795–16806. [Google Scholar] [CrossRef]
- Cavanagh, J.F.; Frank, M.J. Frontal Theta as a Mechanism for Cognitive Control. Trends Cogn. Sci. 2014, 18, 414–421. [Google Scholar] [CrossRef] [PubMed]
- Clayton, M.S.; Yeung, N.; Cohen Kadosh, R. The Roles of Cortical Oscillations in Sustained Attention. Trends Cogn. Sci. 2015, 19, 188–195. [Google Scholar] [CrossRef] [PubMed]
- Cohen, M.X.; Donner, T.H. Midfrontal Conflict-Related Theta-Band Power Reflects Neural Oscillations That Predict Behavior. J. Neurophysiol. 2013, 110, 2752–2763. [Google Scholar] [CrossRef] [PubMed]
- Cooper, P.S.; Darriba, Á.; Karayanidis, F.; Barceló, F. Contextually Sensitive Power Changes across Multiple Frequency Bands Underpin Cognitive Control. NeuroImage 2016, 132, 499–511. [Google Scholar] [CrossRef]
- Cohen, M.X. A Neural Microcircuit for Cognitive Conflict Detection and Signaling. Trends Neurosci. 2014, 37, 480–490. [Google Scholar] [CrossRef]
- Womelsdorf, T.; Johnston, K.; Vinck, M.; Everling, S. Theta-Activity in Anterior Cingulate Cortex Predicts Task Rules and Their Adjustments Following Errors. Proc. Natl. Acad. Sci. USA 2010, 107, 5248–5253. [Google Scholar] [CrossRef]
- Atchley, R.; Klee, D.; Oken, B. EEG Frequency Changes Prior to Making Errors in an Easy Stroop Task. Front. Hum. Neurosci. 2017, 11, 521. [Google Scholar] [CrossRef]
- Braver, T.S. The Variable Nature of Cognitive Control: A Dual Mechanisms Framework. Trends Cogn. Sci. 2012, 16, 106–113. [Google Scholar] [CrossRef]
- Clements, G.M.; Bowie, D.C.; Gyurkovics, M.; Low, K.A.; Fabiani, M.; Gratton, G. Spontaneous Alpha and Theta Oscillations Are Related to Complementary Aspects of Cognitive Control in Younger and Older Adults. Front. Hum. Neurosci. 2021, 15, 106. [Google Scholar] [CrossRef]
- Lee, D.; Kwon, W.; Heo, J.; Park, J.Y. Associations between Heart Rate Variability and Brain Activity during a Working Memory Task: A Preliminary Electroencephalogram Study on Depression and Anxiety Disorder. Brain Sci. 2022, 12, 172. [Google Scholar] [CrossRef]
- Mahjoory, K.; Cesnaite, E.; Hohlefeld, F.U.; Villringer, A.; Nikulin, V.V. Power and Temporal Dynamics of Alpha Oscillations at Rest Differentiate Cognitive Performance Involving Sustained and Phasic Cognitive Control. NeuroImage 2019, 188, 135–144. [Google Scholar] [CrossRef] [PubMed]
- Magosso, E.; Ricci, G.; Ursino, M. Modulation of Brain Alpha Rhythm and Heart Rate Variability by Attention-Related Mechanisms. AIMS Neurosci. 2019, 6, 1–24. [Google Scholar] [CrossRef] [PubMed]
- Albinet, C.T.; Boucard, G.; Bouquet, C.A.; Audiffren, M. Increased Heart Rate Variability and Executive Performance after Aerobic Training in the Elderly. Eur. J. Appl. Physiol. 2010, 109, 617–624. [Google Scholar] [CrossRef] [PubMed]
- Albinet, C.T.; Abou-Dest, A.; André, N.; Audiffren, M. Executive Functions Improvement Following a 5-Month Aquaerobics Program in Older Adults: Role of Cardiac Vagal Control in Inhibition Performance. Biol. Psychol. 2016, 115, 69–77. [Google Scholar] [CrossRef] [PubMed]
- Stenfors, C.U.D.; Hanson, L.M.; Theorell, T.; Osika, W.S. Executive Cognitive Functioning and Cardiovascular Autonomic Regulation in a Population-Based Sample of Working Adults. Front. Psychol. 2016, 7, 1536. [Google Scholar] [CrossRef]
- Duschek, S.; Muckenthaler, M.; Werner, N.; del Paso, G.A.R. Relationships between Features of Autonomic Cardiovascular Control and Cognitive Performance. Biol. Psychol. 2009, 81, 110–117. [Google Scholar] [CrossRef]
- Hovland, A.; Pallesen, S.; Hammar, Å.; Hansen, A.L.; Thayer, J.F.; Tarvainen, M.P.; Nordhus, I.H. The Relationships among Heart Rate Variability, Executive Functions, and Clinical Variables in Patients with Panic Disorder. Int. J. Psychophysiol. Off. J. Int. Organ. Psychophysiol. 2012, 86, 269–275. [Google Scholar] [CrossRef]


| Task 1 | Task 2 | |
|---|---|---|
| Mean ± SD | Mean ± SD | |
| RT during GO trials (sec) | 0.425 ± 0.11 | 0.52 ± 0.11 |
| RT during NoGO trials (sec) | 0.27 ± 0.05 | 0.42 ± 0.059 |
| % errors during GO trials | 0.09% | 2.01% |
| % errors during NoGo trials | 0.38% | 3.23% |
Publisher’s Note: MDPI stays neutral with regard to jurisdictional claims in published maps and institutional affiliations. |
© 2022 by the authors. Licensee MDPI, Basel, Switzerland. This article is an open access article distributed under the terms and conditions of the Creative Commons Attribution (CC BY) license (https://creativecommons.org/licenses/by/4.0/).
Share and Cite
Cortese, M.D.; Vatrano, M.; Tonin, P.; Cerasa, A.; Riganello, F. Inhibitory Control and Brain–Heart Interaction: An HRV-EEG Study. Brain Sci. 2022, 12, 740. https://doi.org/10.3390/brainsci12060740
Cortese MD, Vatrano M, Tonin P, Cerasa A, Riganello F. Inhibitory Control and Brain–Heart Interaction: An HRV-EEG Study. Brain Sciences. 2022; 12(6):740. https://doi.org/10.3390/brainsci12060740
Chicago/Turabian StyleCortese, Maria Daniela, Martina Vatrano, Paolo Tonin, Antonio Cerasa, and Francesco Riganello. 2022. "Inhibitory Control and Brain–Heart Interaction: An HRV-EEG Study" Brain Sciences 12, no. 6: 740. https://doi.org/10.3390/brainsci12060740
APA StyleCortese, M. D., Vatrano, M., Tonin, P., Cerasa, A., & Riganello, F. (2022). Inhibitory Control and Brain–Heart Interaction: An HRV-EEG Study. Brain Sciences, 12(6), 740. https://doi.org/10.3390/brainsci12060740