
Case Study: Intra- and Interpersonal Coherence of Muscle and Brain Activity of Two Coupled Persons during Pushing and Holding Isometric Muscle Action


Abstract
:1. Introduction
2. Materials and Methods
2.1. Participants
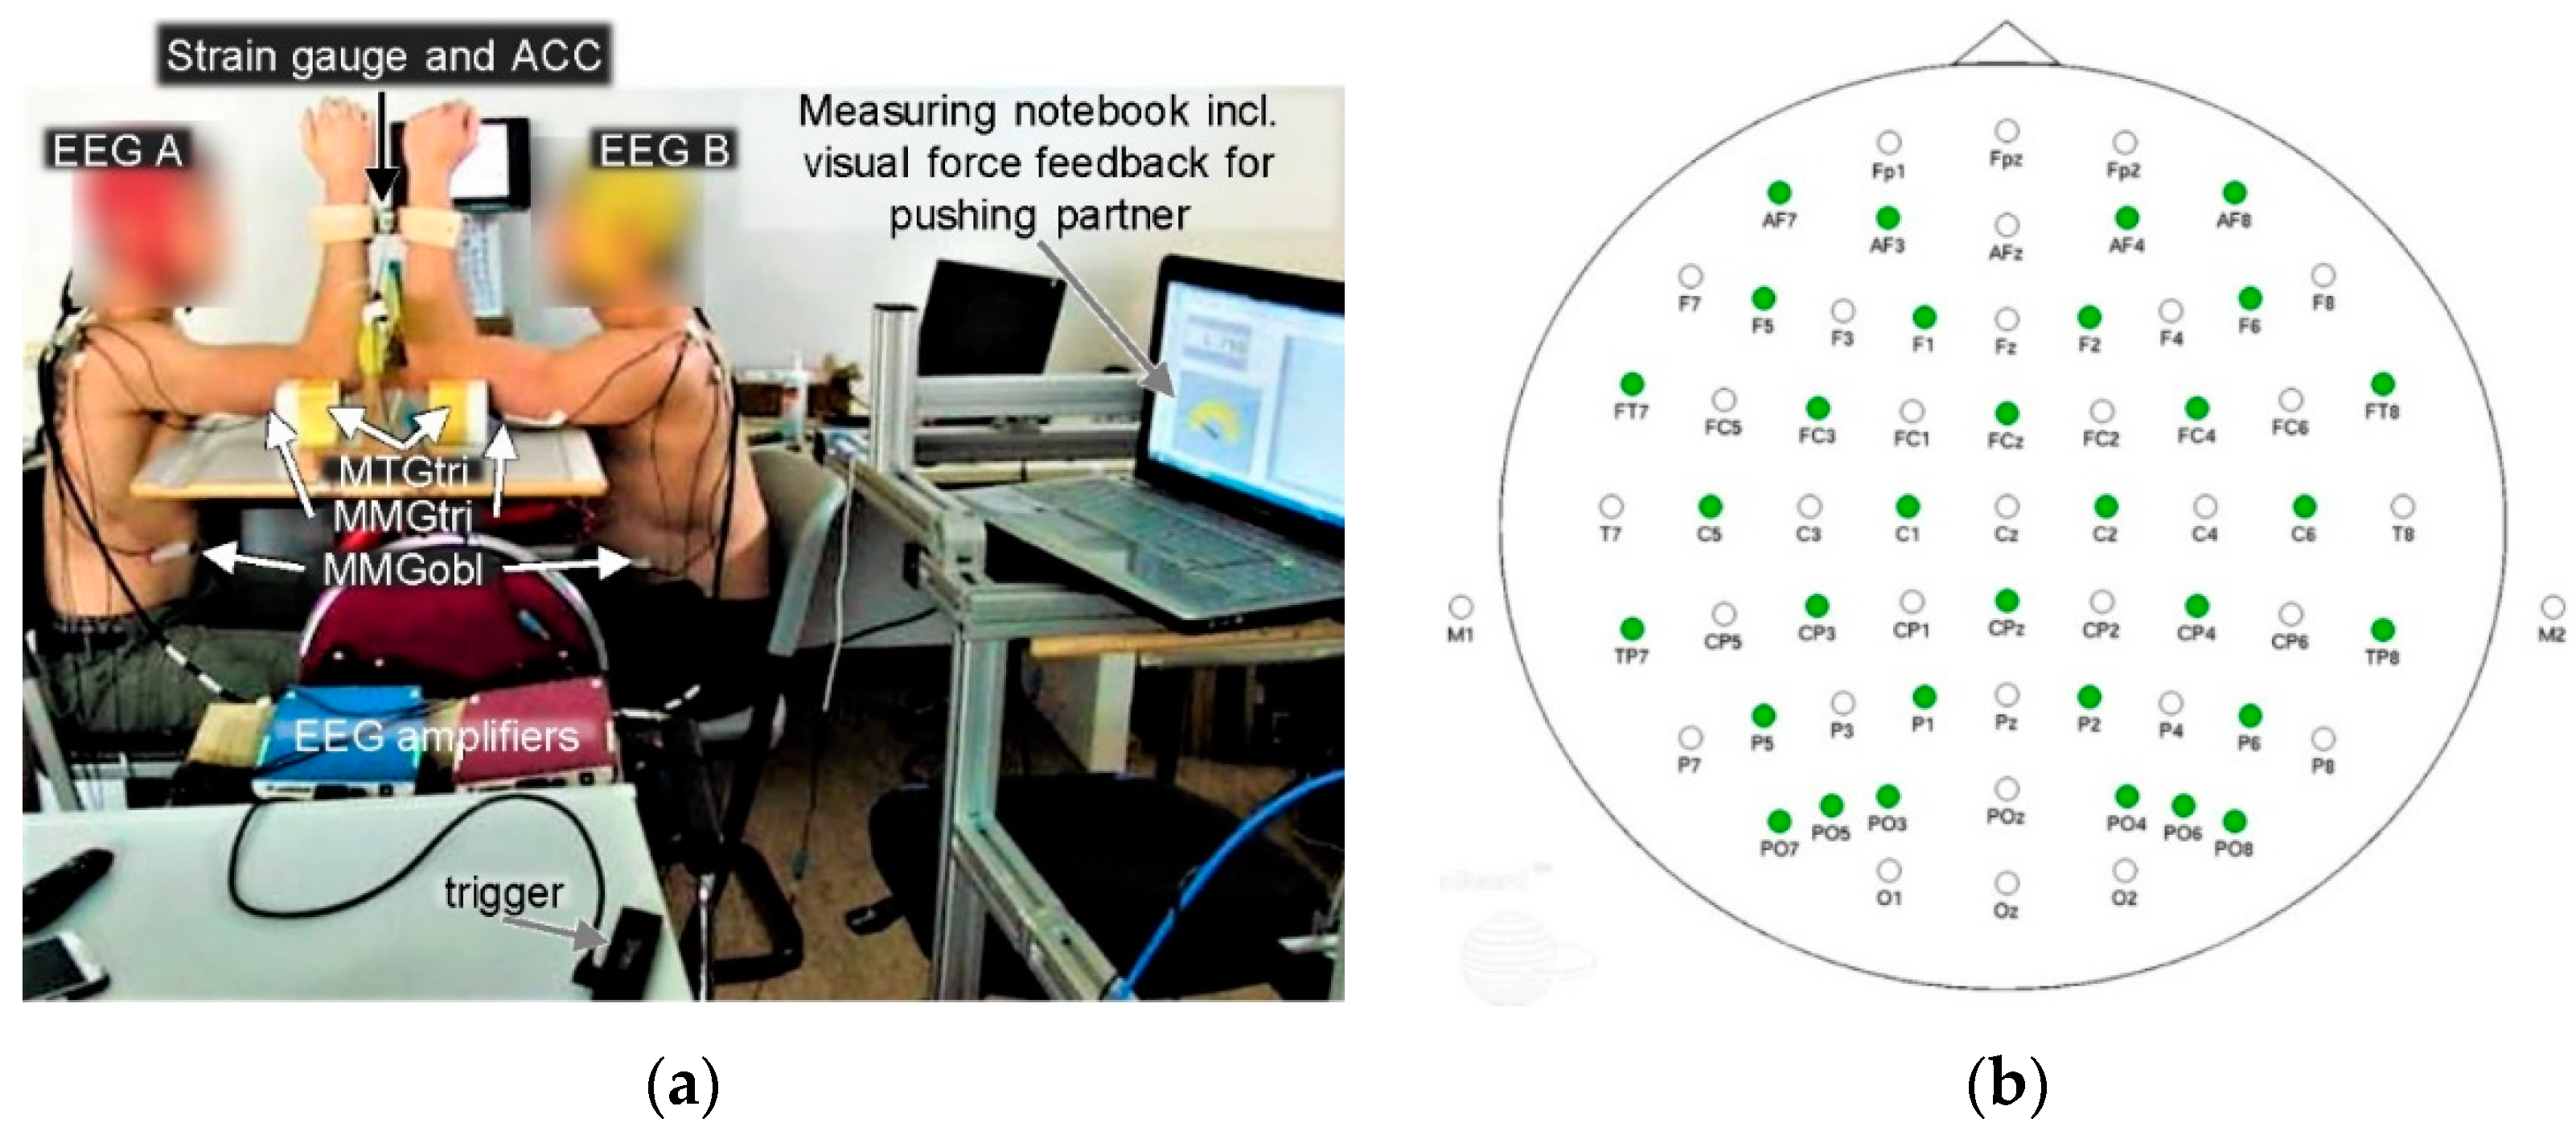
2.2. Setting
2.3. Mechanomyographic and Mechanotendographic Recordings
2.4. Electroencephalographic Recordings
2.5. Measuring Procedure
2.6. Data Processing
2.7. Wavelet Coherence Analysis
2.8. Coherence Parameters of Wavelet Coherence Analysis Used for Statistical Evaluation
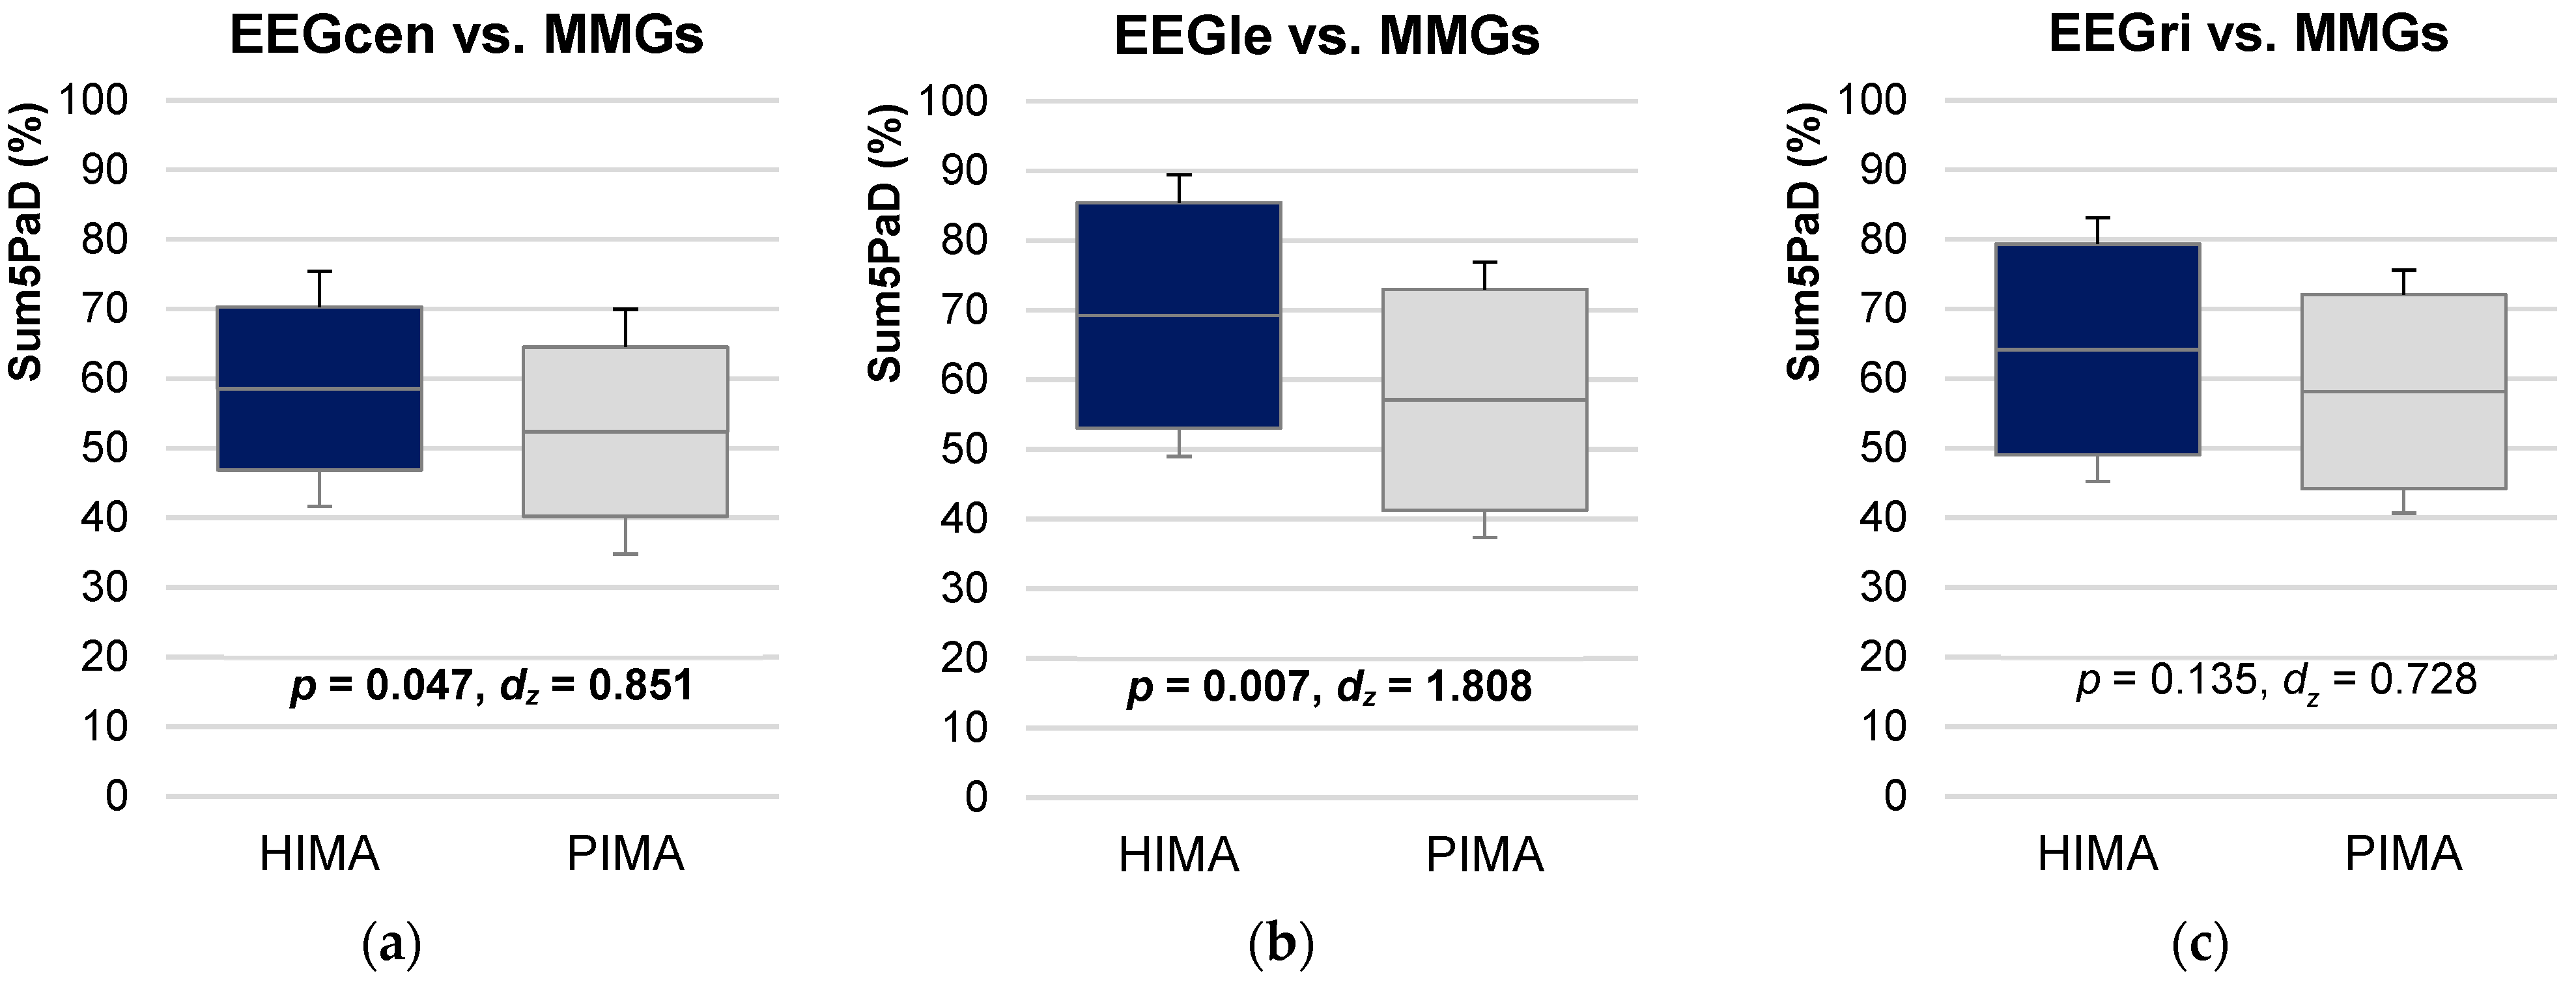
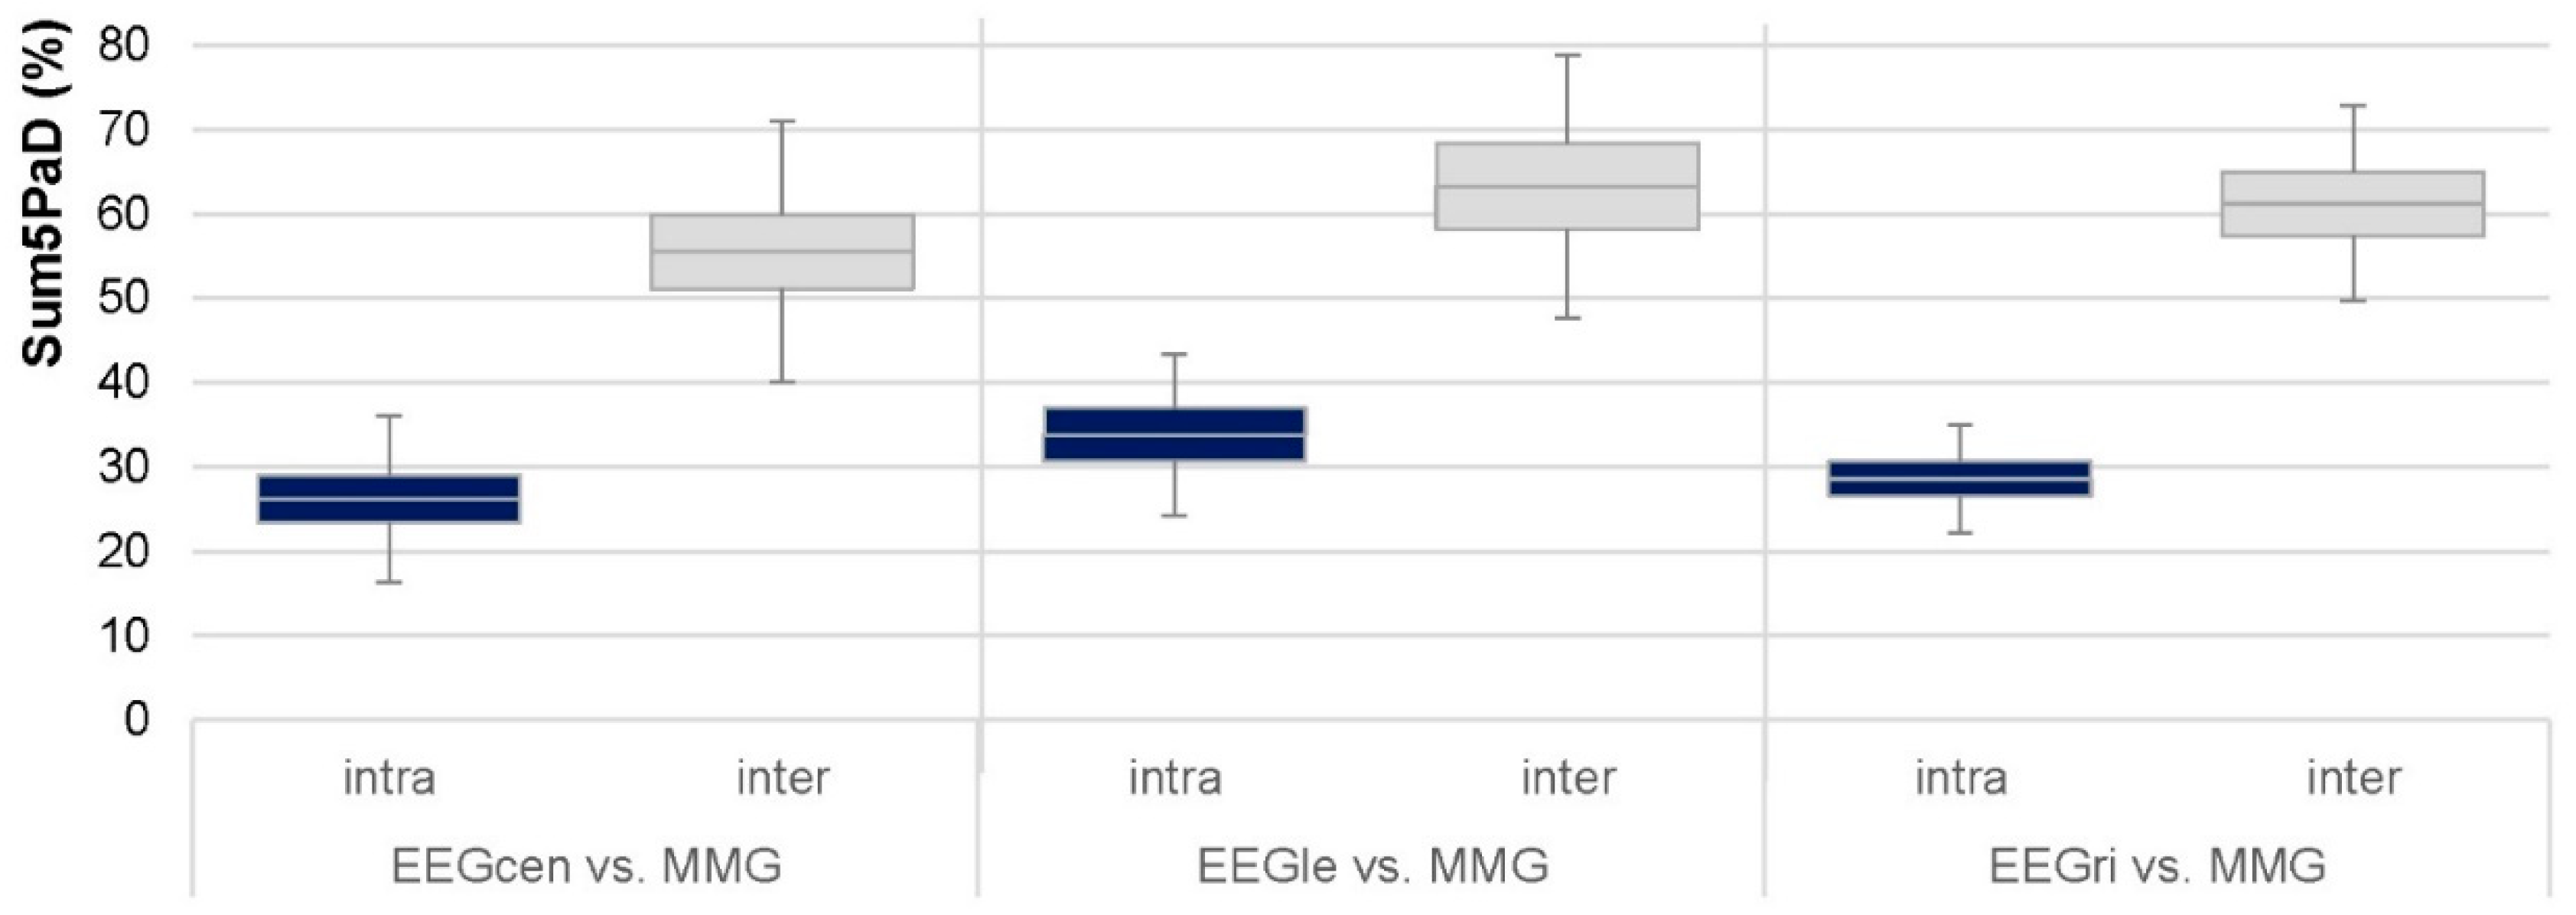
- Sum5PaD (%): The duration (s) of the five longest significant coherence patches in the frequency range of 8 to 15 Hz were added and this sum was related to the whole duration time (s). Hence, this parameter stands for the ratio (%) of the summed duration of the five longest coherent patches to the total duration time in the respective frequency range. The frequency band of 8–15 Hz was chosen since muscular oscillations are known to be located at ~10 Hz. A value >100% could appear due to the summation of the duration of the five longest significant patches, which might overlap because of different frequencies.
- WFreq (Hz): This parameter refers to the time-weighted average of the frequency of the five longest significant patches in the frequency range of 8–15 Hz. It should give an impression of the frequencies in which the patches were located. Some considerations included additionally the WFreq of the five longest coherence patches in the frequency range of 3 to 25 Hz.
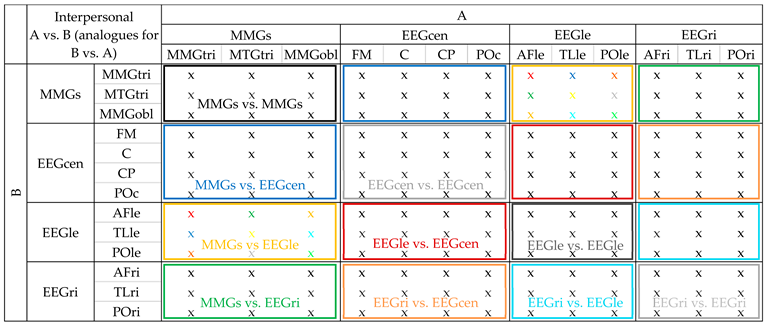
2.9. Statistical Comparisons
2.9.1. Real vs. Randomly Matched Pairs
2.9.2. Comparisons between Pushing (PIMA) vs. Holding Isometric Muscle Action (HIMA)
3. Results
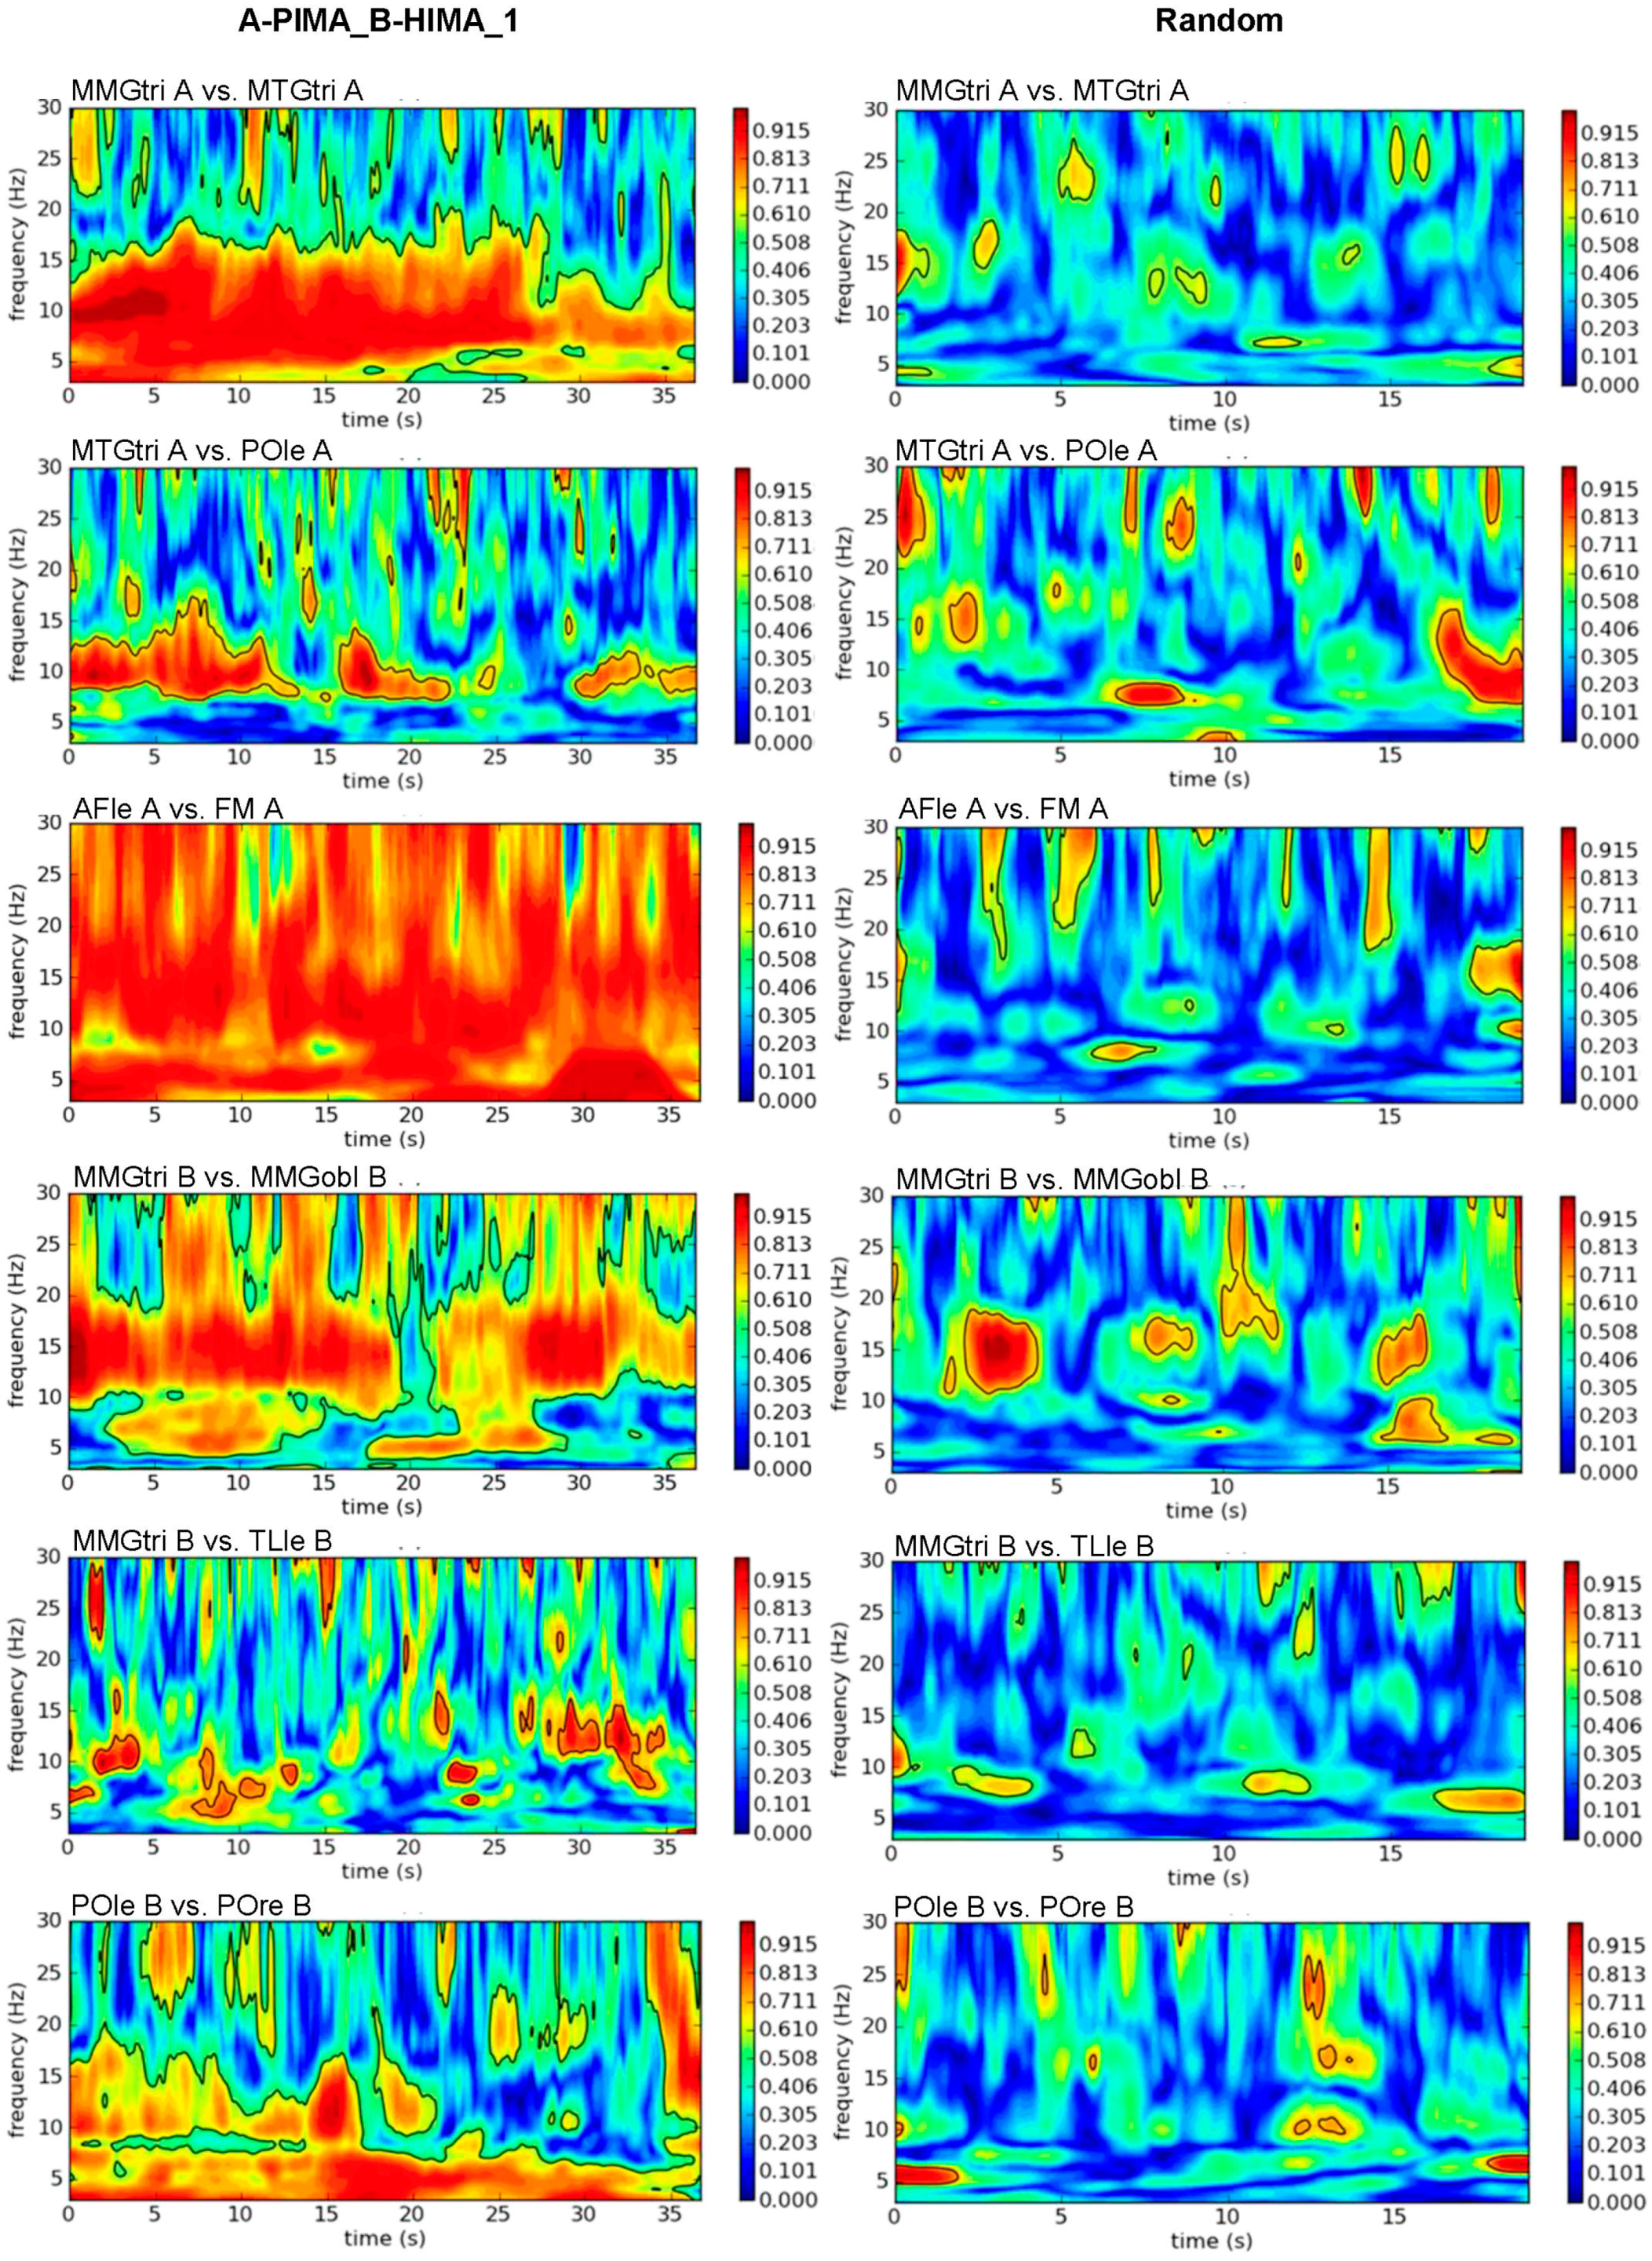
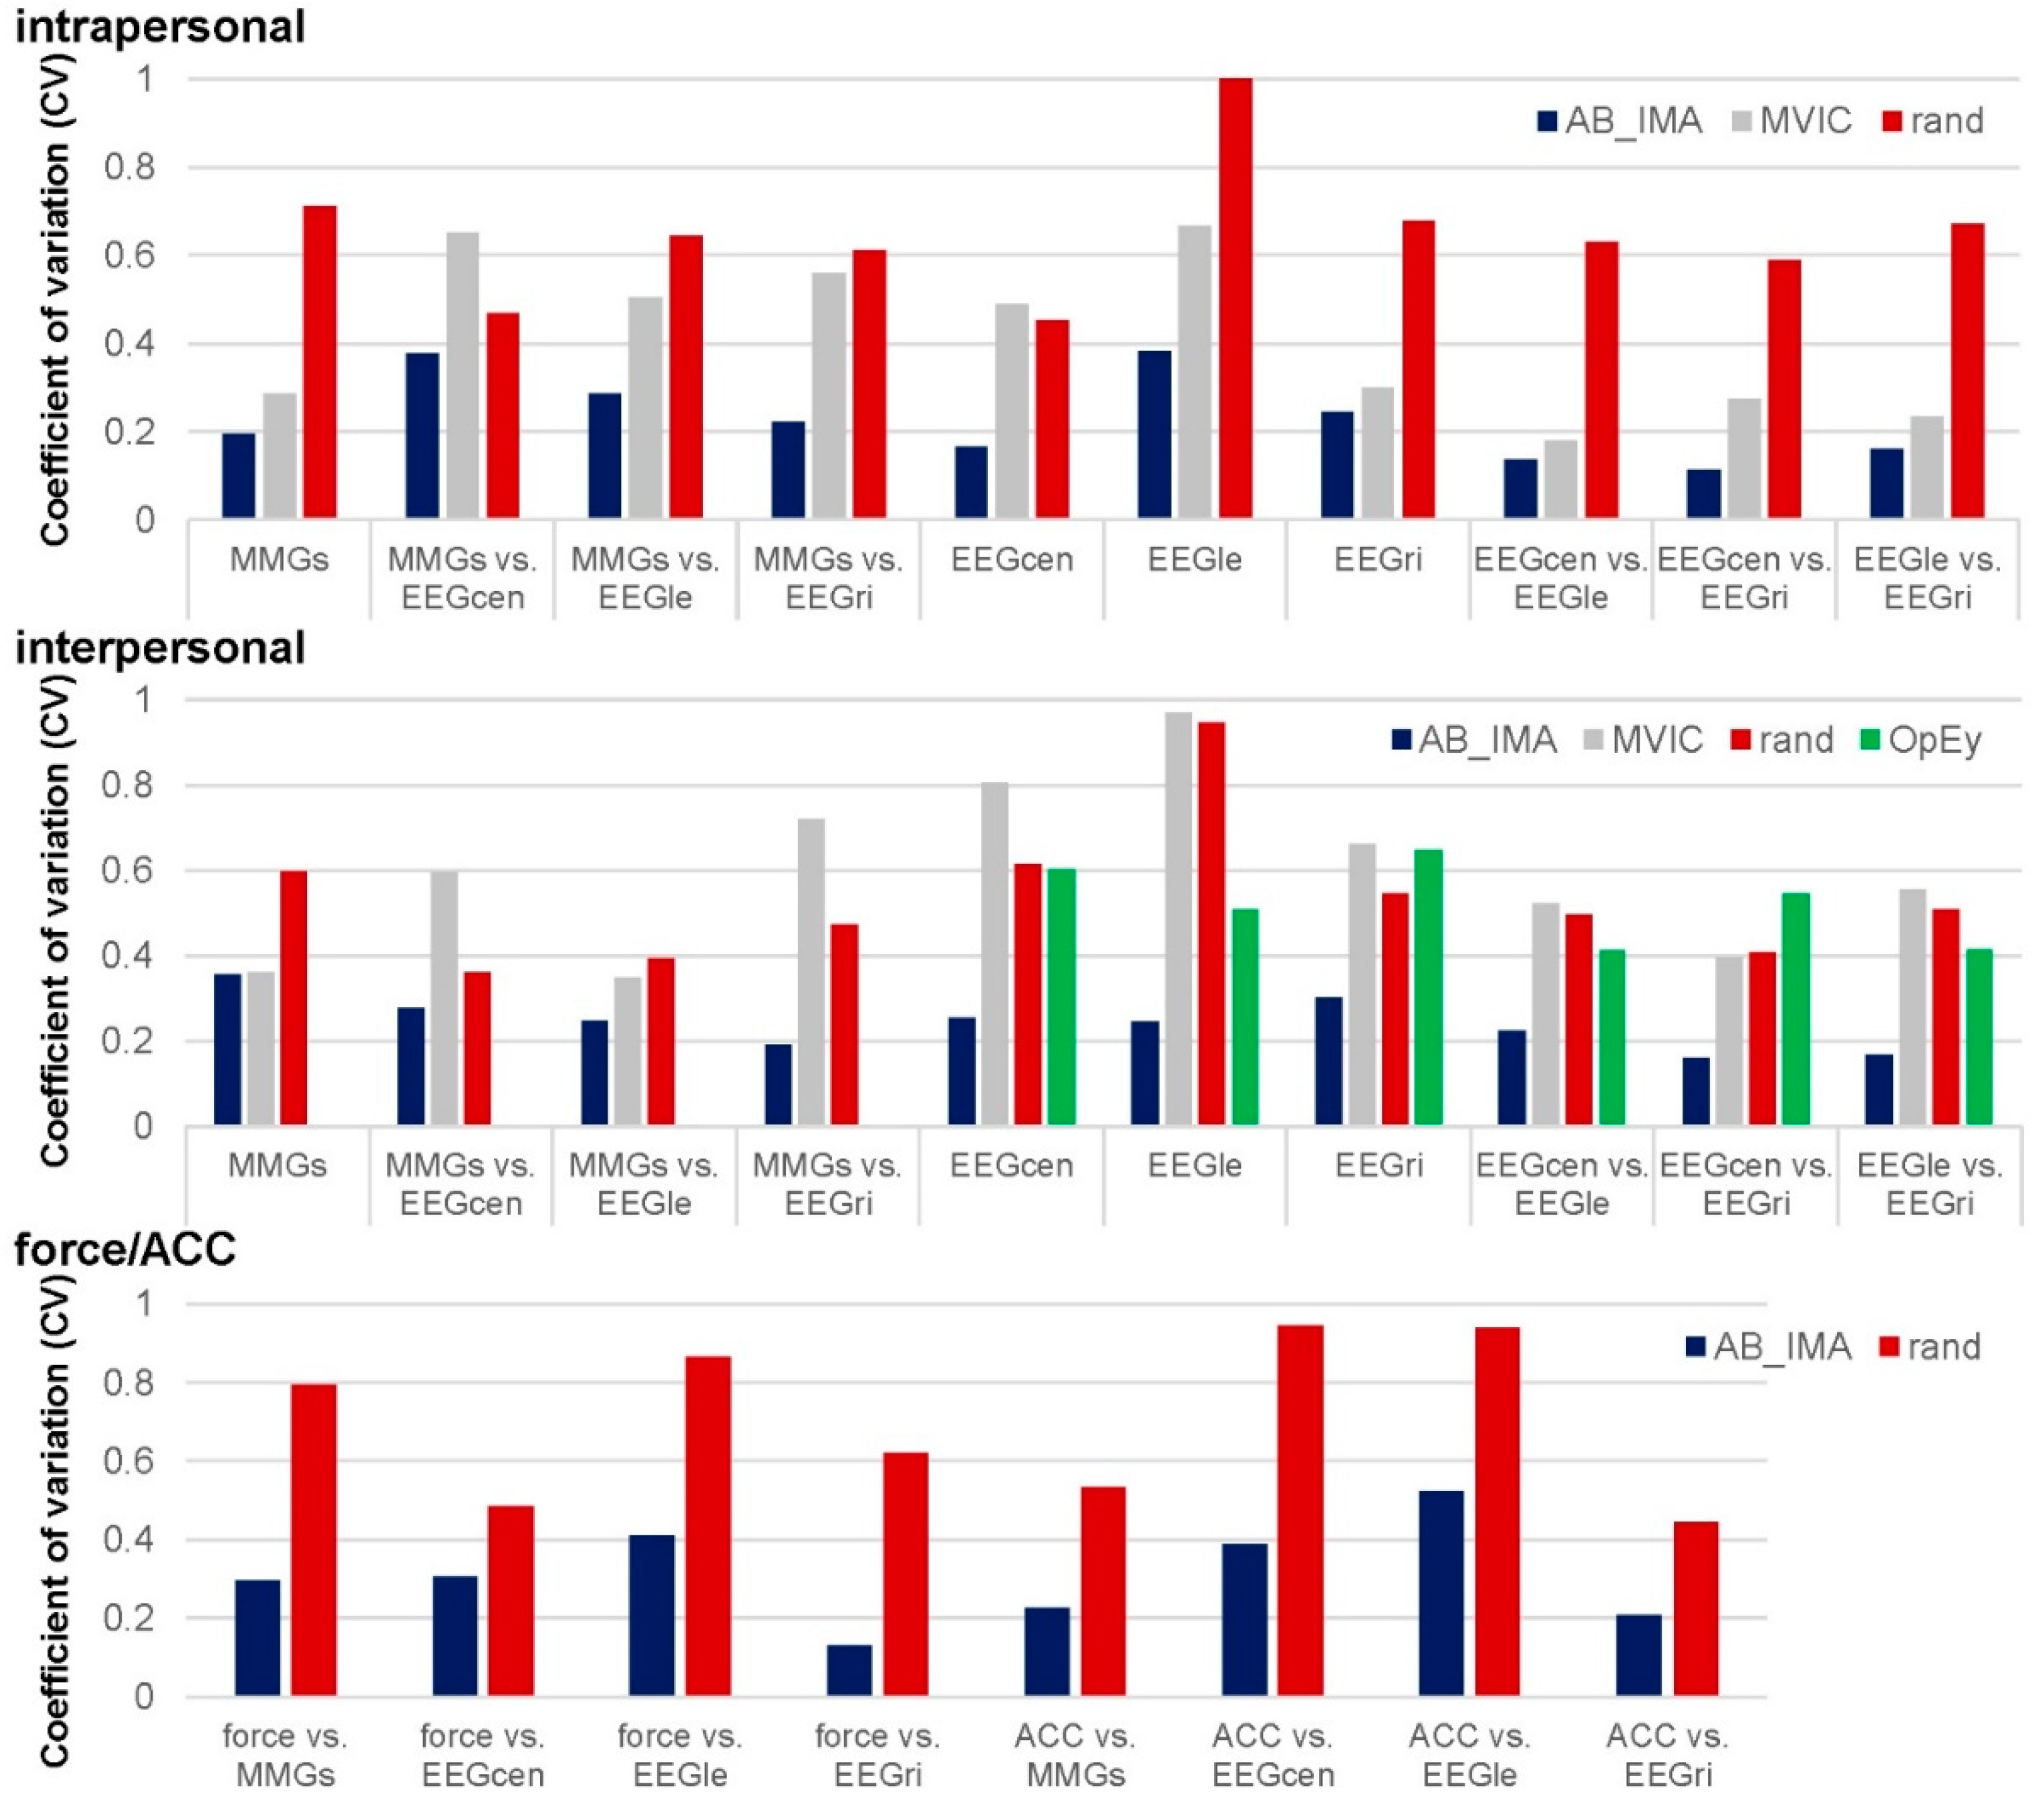
3.1. Real vs. Randomly Matched Pairs
3.1.1. Intrapersonal AB_IMA vs. Rand
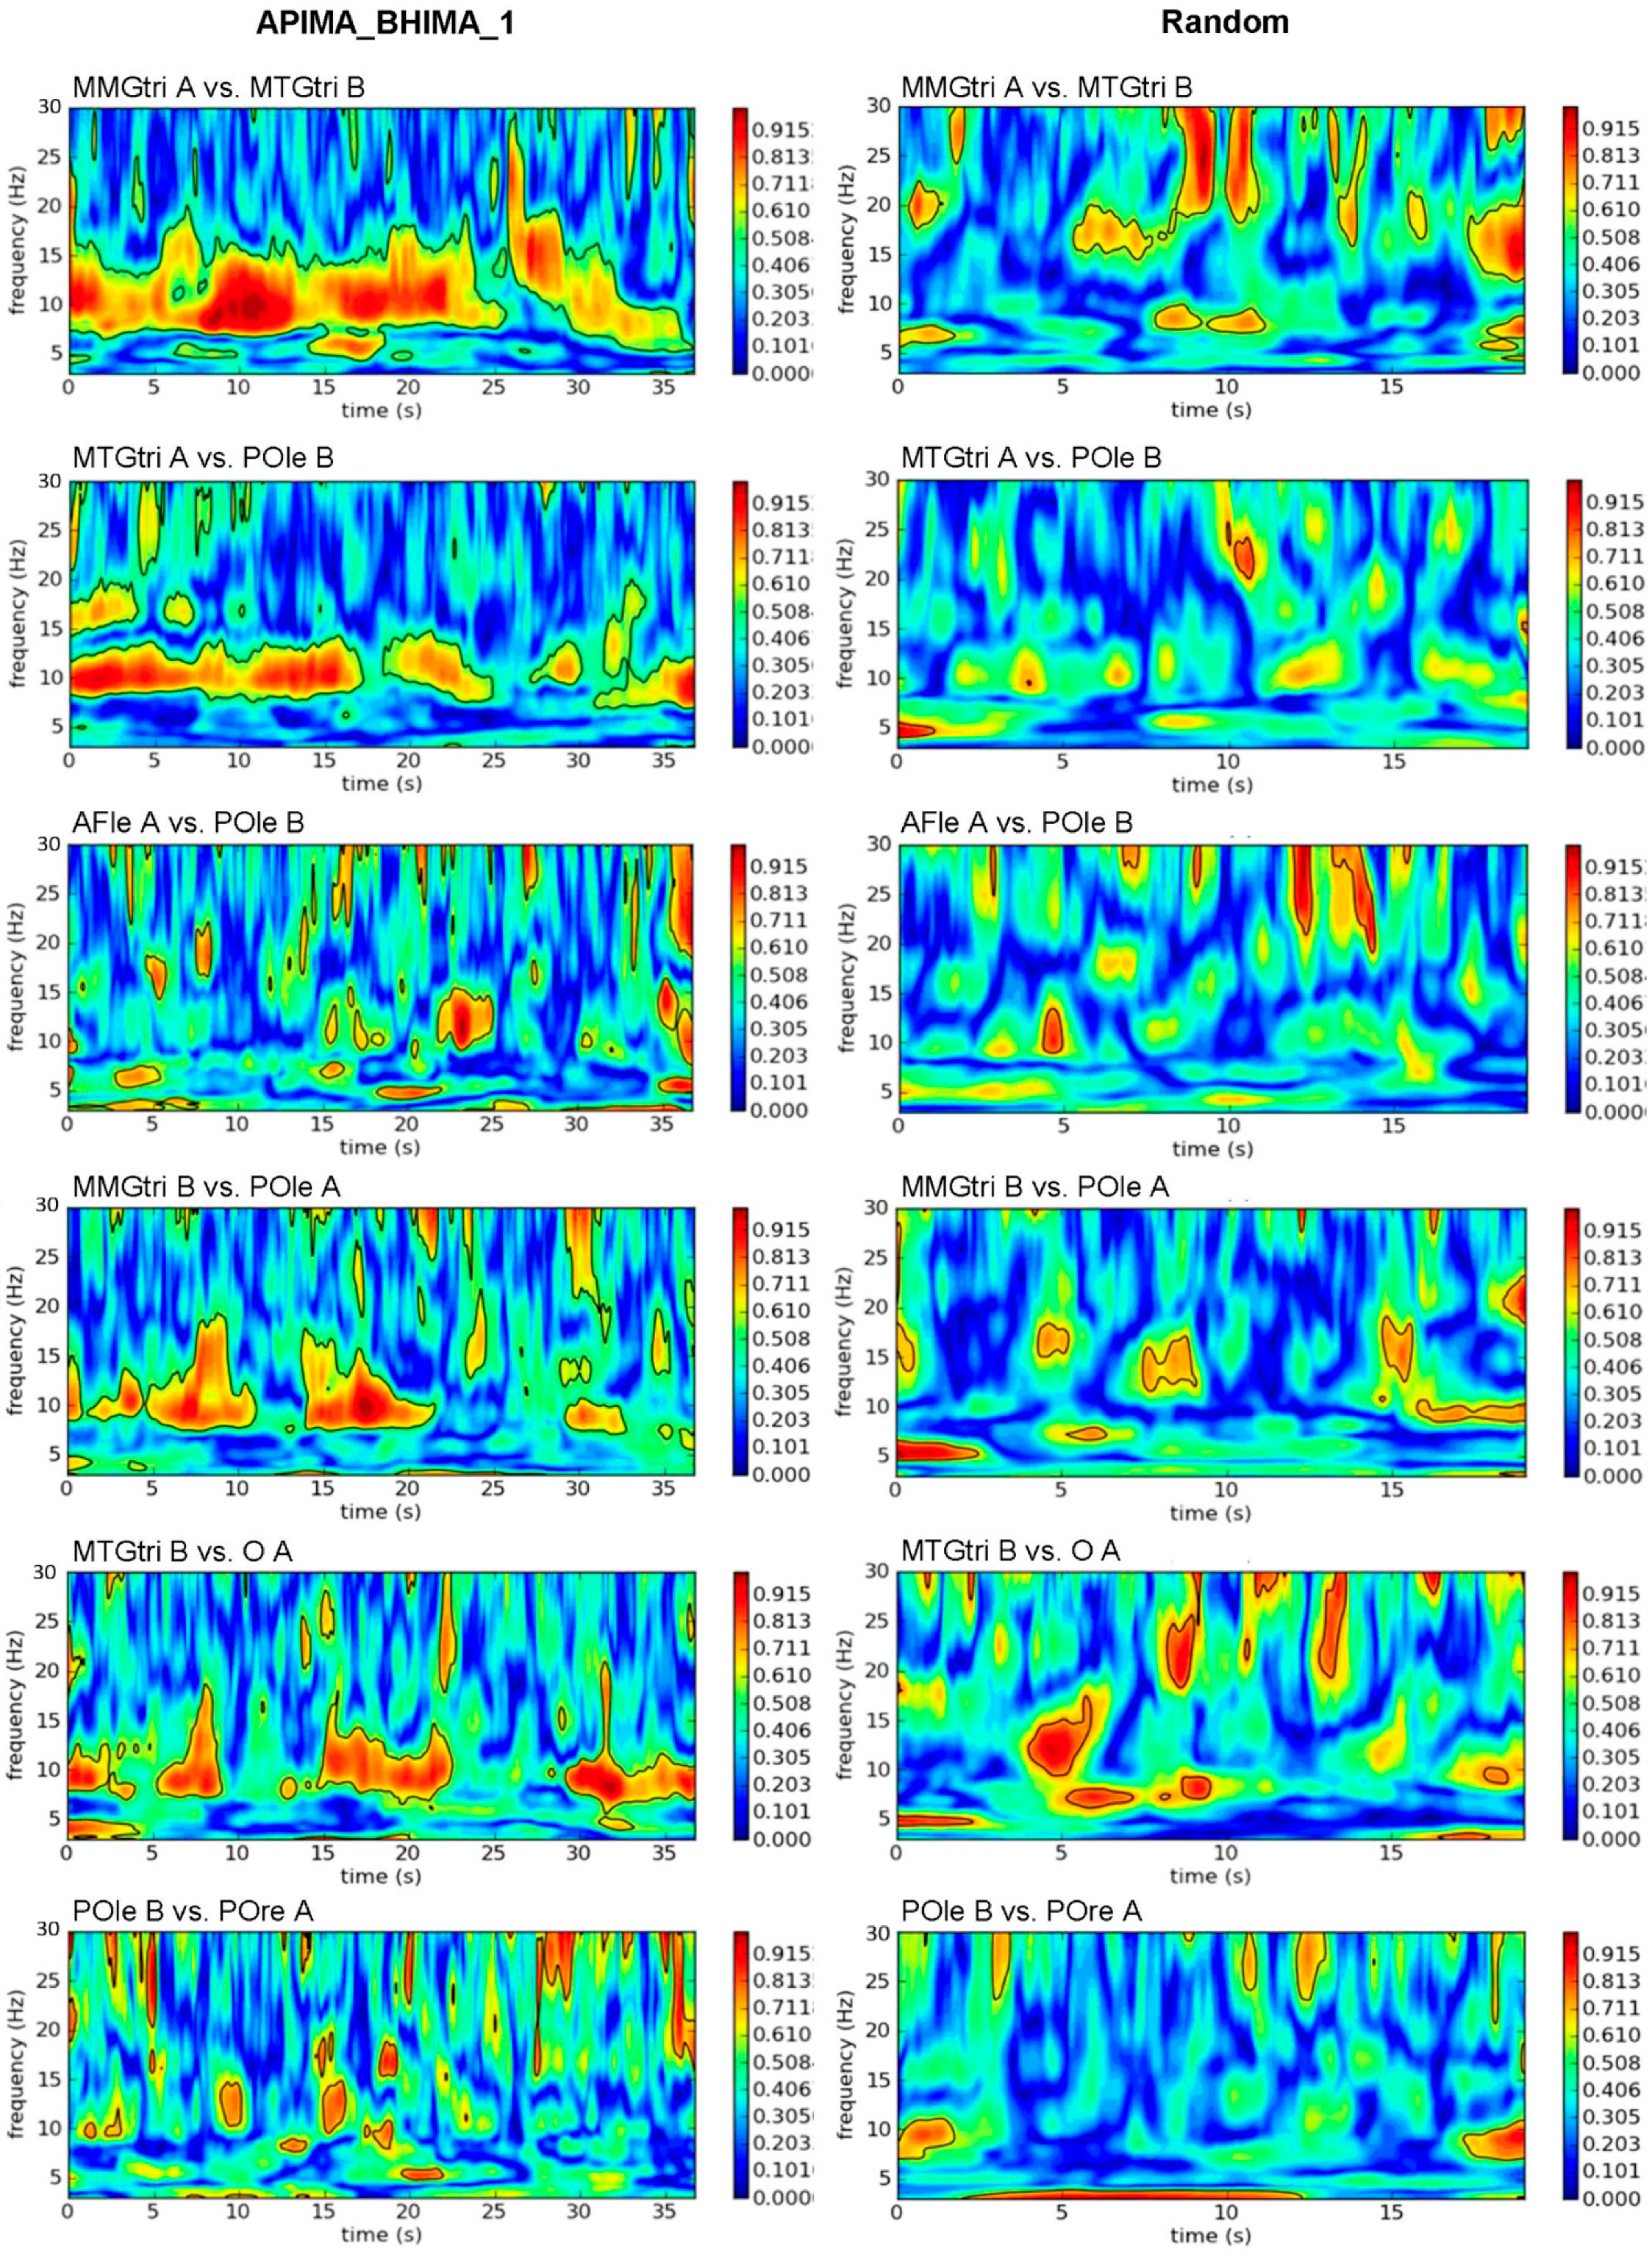
3.1.2. Interpersonal AB_IMA vs. Rand
3.1.3. Force and ACC to EEG and MMG: AB_IMA vs. Rand
3.2. Coherence of Coupled AB_IMA vs. Single MVIC Trials
3.2.1. Intrapersonal AB_IMA vs. MVIC
3.2.2. Interpersonal AB_IMA vs. MVIC
3.3. Coherence Comparing HIMA vs. PIMA
3.3.1. Intrapersonal HIMA vs. PIMA
3.3.2. Interpersonal HIMA vs. PIMA
3.3.3. Force and ACC to All Other Regions: HIMA vs. PIMA
4. Discussion
4.1. Limitations
4.2. Advantages and Disadvantages of Electroencephalography
4.3. Corticomuscular Coherence during Coupled Isometric Interaction
4.4. Comparison of Holding and Pushing Isometric Motor Tasks (HIMA vs. PIMA)
4.5. Inter-Brain Synchronization as an Epiphenomenon?
5. Conclusions
Supplementary Materials
Author Contributions
Funding
Institutional Review Board Statement
Informed Consent Statement
Data Availability Statement
Acknowledgments
Conflicts of Interest
Appendix A. Examples for Statistical Data Preparation for Sum5PaD and WFreq

 |
References
- McAuley, J.H. Physiological and Pathological Tremors and Rhythmic Central Motor Control. Brain 2000, 123, 1545–1567. [Google Scholar] [CrossRef] [PubMed]
- Beck, T. Applications of Mechanomyography for Examining Muscle Function; Transworld Research Network: Trivandrum, India, 2010; ISBN 978-81-7895-449-3. [Google Scholar]
- Orizio, C.; Perini, R.; Diemont, B.; Maranzana Figini, M.; Veicsteinas, A. Spectral Analysis of Muscular Sound during Isometric Contraction of Biceps Brachii. J. Appl. Physiol. 1990, 68, 508–512. [Google Scholar] [CrossRef] [PubMed]
- Barry, D.T. Acoustic Signals from Frog Skeletal Muscle. Biophys. J. 1987, 51, 769–773. [Google Scholar] [CrossRef] [Green Version]
- Barry, D.T.; Cole, N.M. Fluid Mechanics of Muscle Vibrations. Biophys. J. 1988, 53, 899–905. [Google Scholar] [CrossRef] [Green Version]
- Cescon, C.; Madeleine, P.; Farina, D. Longitudinal and Transverse Propagation of Surface Mechanomyographic Waves Generated by Single Motor Unit Activity. Med. Biol. Eng. Comput. 2008, 46, 871–877. [Google Scholar] [CrossRef]
- Frangioni, J.V.; Kwan-Gett, T.S.; Dobrunz, L.E.; McMahon, T.A. The Mechanism of Low-Frequency Sound Production in Muscle. Biophys. J. 1987, 51, 775–783. [Google Scholar] [CrossRef] [Green Version]
- Laine, C.M.; Valero-Cuevas, F.J. Intermuscular Coherence Reflects Functional Coordination. J. Neurophysiol. 2017, 118, 1775–1783. [Google Scholar] [CrossRef]
- Farmer, S.F.; Bremner, F.D.; Halliday, D.M.; Rosenberg, J.R.; Stephens, J.A. The Frequency Content of Common Synaptic Inputs to Motoneurones Studied during Voluntary Isometric Contraction in Man. J. Physiol. 1993, 470, 127–155. [Google Scholar] [CrossRef]
- Kilner, J.M.; Baker, S.N.; Salenius, S.; Jousmäki, V.; Hari, R.; Lemon, R.N. Task-dependent Modulation of 15–30 Hz Coherence between Rectified EMGs from Human Hand and Forearm Muscles. J. Physiol. 1999, 516, 559–570. [Google Scholar] [CrossRef]
- Ishii, T.; Narita, N.; Endo, H. Evaluation of Jaw and Neck Muscle Activities While Chewing Using EMG-EMG Transfer Function and EMG-EMG Coherence Function Analyses in Healthy Subjects. Physiol. Behav. 2016, 160, 35–42. [Google Scholar] [CrossRef] [Green Version]
- Wang, L.; Lu, A.; Zhang, S.; Niu, W.; Zheng, F.; Gong, M. Fatigue-Related Electromyographic Coherence and Phase Synchronization Analysis between Antagonistic Elbow Muscles. Exp. Brain Res. 2015, 233, 971–982. [Google Scholar] [CrossRef] [PubMed]
- Coates, M.; Baker, S.; Fitzgerald, W. A Complex Wavelet-Transform Approach to Power and Coherence Measurement from Non-Stationary Data. J. Physiol. 1997, 501, P36. [Google Scholar]
- Hill, E.C.; Housh, T.J.; Smith, C.M.; Cochrane, K.C.; Jenkins, N.D.M.; Schmidt, R.J.; Johnson, G.O. The Effects of Work-to-Rest Ratios on Torque, Electromyographic, and Mechanomyographic Responses to Fatiguing Workbouts. Int. J. Exerc. Sci. 2017, 10, 580–591. [Google Scholar] [PubMed]
- Yoshitake, Y.; Ue, H.; Miyazaki, M.; Moritani, T. Assessment of Lower-Back Muscle Fatigue Using Electromyography, Mechanomyography, and near-Infrared Spectroscopy. Eur. J. Appl. Physiol. 2001, 84, 174–179. [Google Scholar] [CrossRef] [PubMed]
- Tarata, M.T. Mechanomyography versus Electromyography, in Monitoring the Muscular Fatigue. BioMed. Eng. OnLine 2003, 2, 3. [Google Scholar] [CrossRef] [Green Version]
- Camic, C.L.; Housh, T.J.; Zuniga, J.M.; Bergstrom, H.C.; Schmidt, R.J.; Johnson, G.O. Mechanomyographic and Electromyographic Responses During Fatiguing Eccentric Muscle Actions of the Leg Extensors. J. Appl. Biomech. 2014, 30, 255–261. [Google Scholar] [CrossRef]
- Kassolik, K.; Jaskólska, A.; Kisiel-Sajewicz, K.; Marusiak, J.; Kawczyński, A.; Jaskólski, A. Tensegrity Principle in Massage Demonstrated by Electro- and Mechanomyography. J. Bodyw. Mov. Ther. 2009, 13, 164–170. [Google Scholar] [CrossRef]
- Conway, B.A.; Biswas, P.; Halliday, D.M.; Farmer, S.F.; Rosenberg, J.R. Task-Dependent Changes in Rhythmic Motor Output during Voluntary Elbow Movement in Man. J. Physiol. 1997, 501, P48–P49. [Google Scholar]
- Tass, P.; Rosenblum, M.G.; Weule, J.; Kurths, J.; Pikovsky, A.; Volkmann, J.; Schnitzler, A.; Freund, H.-J. Detection of N: M Phase Locking from Noisy Data: Application to Magnetoencephalography. Phys. Rev. Lett. 1998, 81, 3291–3294. [Google Scholar] [CrossRef]
- Halliday, D.M.; Conway, B.A.; Farmer, S.F.; Rosenberg, J.R. Using Electroencephalography to Study Functional Coupling between Cortical Activity and Electromyograms during Voluntary Contractions in Humans. Neurosci. Lett. 1998, 241, 5–8. [Google Scholar] [CrossRef]
- Farmer, S.F. Rhythmicity, Synchronization and Binding in Human and Primate Motor Systems. J. Physiol. 1998, 509, 3–14. [Google Scholar] [CrossRef] [PubMed]
- Conway, B.A.; Halliday, D.M.; Farmer, S.F.; Shahani, U.; Maas, P.; Weir, A.I.; Rosenberg, J.R. Synchronization between Motor Cortex and Spinal Motoneuronal Pool during the Performance of a Maintained Motor Task in Man. J. Physiol. 1995, 489, 917–924. [Google Scholar] [CrossRef] [PubMed]
- Raethjen, J.; Lindemann, M.; Dümpelmann, M.; Wenzelburger, R.; Stolze, H.; Pfister, G.; Elger, C.; Timmer, J.; Deuschl, G. Corticomuscular Coherence in the 6-15 Hz Band: Is the Cortex Involved in the Generation of Physiologic Tremor? Exp. Brain Res. 2002, 142, 32–40. [Google Scholar] [CrossRef] [PubMed] [Green Version]
- Salenius, S.; Hari, R. Synchronous Cortical Oscillatory Activity during Motor Action. Curr. Opin. Neurobiol. 2003, 13, 678–684. [Google Scholar] [CrossRef] [PubMed]
- Gross, J.; Tass, P.A.; Salenius, S.; Hari, R.; Freund, H.-J.; Schnitzler, A. Cortico-muscular Synchronization during Isometric Muscle Contraction in Humans as Revealed by Magnetoencephalography. J. Physiol. 2000, 527, 623–631. [Google Scholar] [CrossRef]
- Marsden, J.F. Coherence between Cerebellar Thalamus, Cortex and Muscle in Man: Cerebellar Thalamus Interactions. Brain 2000, 123, 1459–1470. [Google Scholar] [CrossRef]
- Ohara, S.; Mima, T.; Baba, K.; Ikeda, A.; Kunieda, T.; Matsumoto, R.; Yamamoto, J.; Matsuhashi, M.; Nagamine, T.; Hirasawa, K.; et al. Increased Synchronization of Cortical Oscillatory Activities between Human Supplementary Motor and Primary Sensorimotor Areas during Voluntary Movements. J. Neurosci. 2001, 21, 9377–9386. [Google Scholar] [CrossRef]
- Broniera Junior, P.; Campos, D.P.; Lazzaretti, A.E.; Nohama, P.; Carvalho, A.A.; Krueger, E.; Minhoto Teixeira, M.C. EEG-FES-Force-MMG Closed-Loop Control Systems of a Volunteer with Paraplegia Considering Motor Imagery with Fatigue Recognition and Automatic Shut-Off. Biomed. Signal Processing Control 2021, 68, 102662. [Google Scholar] [CrossRef]
- Schaefer, L.V.; Bittmann, F.N. Coherent Behavior of Neuromuscular Oscillations between Isometrically Interacting Subjects: Experimental Study Utilizing Wavelet Coherence Analysis of Mechanomyographic and Mechanotendographic Signals. Sci. Rep. 2018, 8, 15456. [Google Scholar] [CrossRef]
- Schaefer, L.V.; Torick, A.H.; Matuschek, H.; Holschneider, M.; Bittmann, F.N. Synchronization of Muscular Oscillations Between Two Subjects During Isometric Interaction. Eur. J. Transl. Myol. 2014, 24, 2237. [Google Scholar] [CrossRef]
- Schaefer, L.V. Synchronisationsphänomene myotendinöser Oszillationen interagierender neuromuskulärer Systeme—Mit Betrachtung einer Hypothese bezüglich unterschiedlicher Qualitäten isometrischer Muskelaktion. Ph.D. Thesis, Universität Potsdam, Potsdam, Germany, 2014. [Google Scholar]
- Pérez, A.; Carreiras, M.; Duñabeitia, J.A. Brain-to-Brain Entrainment: EEG Interbrain Synchronization While Speaking and Listening. Sci. Rep. 2017, 7, 4190. [Google Scholar] [CrossRef] [PubMed] [Green Version]
- Liu, T.; Pelowski, M. A New Research Trend in Social Neuroscience: Towards an Interactive-Brain Neuroscience: Towards an Interactive-Brain Neuroscience. PsyCh J. 2014, 3, 177–188. [Google Scholar] [CrossRef] [PubMed]
- Liu, N.; Mok, C.; Witt, E.E.; Pradhan, A.H.; Chen, J.E.; Reiss, A.L. NIRS-Based Hyperscanning Reveals Inter-Brain Neural Synchronization during Cooperative Jenga Game with Face-to-Face Communication. Front. Hum. Neurosci. 2016, 10, 82. [Google Scholar] [CrossRef] [PubMed] [Green Version]
- Kawasaki, M.; Yamada, Y.; Ushiku, Y.; Miyauchi, E.; Yamaguchi, Y. Inter-Brain Synchronization during Coordination of Speech Rhythm in Human-to-Human Social Interaction. Sci. Rep. 2013, 3, 1692. [Google Scholar] [CrossRef] [Green Version]
- Van Vugt, M.K.; Pollock, J.; Johnson, B.; Gyatso, K.; Norbu, N.; Lodroe, T.; Gyaltsen, T.; Phuntsok, L.; Thakchoe, J.; Khechok, J.; et al. Inter-Brain Synchronization in the Practice of Tibetan Monastic Debate. Mindfulness 2020, 11, 1105–1119. [Google Scholar] [CrossRef] [Green Version]
- Fishburn, F.A.; Murty, V.P.; Hlutkowsky, C.O.; MacGillivray, C.E.; Bemis, L.M.; Murphy, M.E.; Huppert, T.J.; Perlman, S.B. Putting Our Heads Together: Interpersonal Neural Synchronization as a Biological Mechanism for Shared Intentionality. Soc. Cogn. Affect. Neurosci. 2018, 13, 841–849. [Google Scholar] [CrossRef] [Green Version]
- Nozawa, T.; Sakaki, K.; Ikeda, S.; Jeong, H.; Yamazaki, S.; Kawata, K.H.D.S.; Kawata, N.Y.D.S.; Sasaki, Y.; Kulason, K.; Hirano, K.; et al. Prior Physical Synchrony Enhances Rapport and Inter-Brain Synchronization during Subsequent Educational Communication. Sci. Rep. 2019, 9, 12747. [Google Scholar] [CrossRef] [Green Version]
- Dumas, G.; Nadel, J.; Soussignan, R.; Martinerie, J.; Garnero, L. Inter-Brain Synchronization during Social Interaction. PLoS ONE 2010, 5, e12166. [Google Scholar] [CrossRef] [Green Version]
- Balconi, M.; Fronda, G. The Use of Hyperscanning to Investigate the Role of Social, Affective, and Informative Gestures in Non-Verbal Communication. Electrophysiological (EEG) and Inter-Brain Connectivity Evidence. Brain Sci. 2020, 10, 29. [Google Scholar] [CrossRef] [Green Version]
- Balconi, M.; Fronda, G. Intra-Brain Connectivity vs. Inter-Brain Connectivity in Gestures Reproduction: What Relationship? Brain Sci. 2021, 11, 577. [Google Scholar] [CrossRef]
- Takeuchi, N.; Izumi, S.-I. Motor Learning Based on Oscillatory Brain Activity Using Transcranial Alternating Current Stimulation: A Review. Brain Sci. 2021, 11, 1095. [Google Scholar] [CrossRef] [PubMed]
- Müller, V.; Sänger, J.; Lindenberger, U. Intra- and Inter-Brain Synchronization during Musical Improvisation on the Guitar. PLoS ONE 2013, 8, e73852. [Google Scholar] [CrossRef] [PubMed] [Green Version]
- Hennig, H. Synchronization in Human Musical Rhythms and Mutually Interacting Complex Systems. Proc. Natl. Acad. Sci. USA 2014, 111, 12974–12979. [Google Scholar] [CrossRef] [PubMed] [Green Version]
- Lindenberger, U.; Li, S.-C.; Gruber, W.; Müller, V. Brains Swinging in Concert: Cortical Phase Synchronization While Playing Guitar. BMC Neurosci. 2009, 10, 22. [Google Scholar] [CrossRef] [PubMed] [Green Version]
- Novembre, G.; Iannetti, G.D. Hyperscanning Alone Cannot Prove Causality. Multibrain Stimulation Can. Trends Cogn. Sci. 2021, 25, 96–99. [Google Scholar] [CrossRef]
- Gvirts Provolovski, H.Z.; Perlmutter, R. How Can We Prove the Causality of Interbrain Synchronization? Front. Hum. Neurosci. 2021, 15, 651949. [Google Scholar] [CrossRef]
- Hasson, U.; Frith, C.D. Mirroring and beyond: Coupled Dynamics as a Generalized Framework for Modelling Social Interactions. Phil. Trans. R. Soc. B 2016, 371, 20150366. [Google Scholar] [CrossRef] [Green Version]
- Bittmann, F.N.; Dech, S.; Aehle, M.; Schaefer, L.V. Manual Muscle Testing—Force Profiles and Their Reproducibility. Diagnostics 2020, 10, 996. [Google Scholar] [CrossRef]
- Schaefer, L.V.; Dech, S.; Aehle, M.; Bittmann, F.N. Disgusting Odours Affect the Characteristics of the Adaptive Force in Contrast to Neutral and Pleasant Odours. Sci. Rep. 2021, 11, 16410. [Google Scholar] [CrossRef]
- Schaefer, L.V.; Dech, S.; Bittmann, F.N. Adaptive Force and Emotionally Related Imaginations—Preliminary Results Suggest a Reduction of the Maximal Holding Capacity as Reaction to Disgusting Food Imagination. Heliyon 2021, 7, e07827. [Google Scholar] [CrossRef]
- Schaefer, L.V.; Dech, S.; Wolff, L.L.; Bittmann, F.N. Influence of Emotionally Affective Imaginations on the Adaptive Force in Young Women: Unpleasant Imaginations Reduce the Holding Capacity of Muscles. Res. Sq. 2022, 1–48. [Google Scholar] [CrossRef]
- Conable, K.M.; Rosner, A.L. A Narrative Review of Manual Muscle Testing and Implications for Muscle Testing Research. J. Chiropr. Med. 2011, 10, 157–165. [Google Scholar] [CrossRef] [PubMed] [Green Version]
- Hunter, S.K.; Ryan, D.L.; Ortega, J.D.; Enoka, R.M. Task Differences with the Same Load Torque Alter the Endurance Time of Submaximal Fatiguing Contractions in Humans. J. Neurophysiol. 2002, 88, 3087–3096. [Google Scholar] [CrossRef] [PubMed]
- Rudroff, T.; Kalliokoski, K.K.; Block, D.E.; Gould, J.R.; Klingensmith, W.C.; Enoka, R.M. PET/CT Imaging of Age- and Task-Associated Differences in Muscle Activity during Fatiguing Contractions. J. Appl. Physiol. 2013, 114, 1211–1219. [Google Scholar] [CrossRef] [Green Version]
- Rudroff, T.; Barry, B.K.; Stone, A.L.; Barry, C.J.; Enoka, R.M. Accessory Muscle Activity Contributes to the Variation in Time to Task Failure for Different Arm Postures and Loads. J. Appl. Physiol. 2007, 102, 1000–1006. [Google Scholar] [CrossRef]
- Rudroff, T.; Justice, J.N.; Holmes, M.R.; Matthews, S.D.; Enoka, R.M. Muscle Activity and Time to Task Failure Differ with Load Compliance and Target Force for Elbow Flexor Muscles. J. Appl. Physiol. 2011, 110, 125–136. [Google Scholar] [CrossRef] [Green Version]
- Semmler, J.G.; Kornatz, K.W.; Dinenno, D.V.; Zhou, S.; Enoka, R.M. Motor Unit Synchronisation Is Enhanced during Slow Lengthening Contractions of a Hand Muscle. J. Physiol. 2002, 545, 681–695. [Google Scholar] [CrossRef]
- Schaefer, L.V.; Bittmann, F.N. Paired personal interaction reveals objective differences between pushing and holding isometric muscle action. PLoS ONE 2021, 16, e0238331. [Google Scholar] [CrossRef]
- Schaefer, L.V.; Bittmann, F.N. Are There Two Forms of Isometric Muscle Action? Results of the Experimental Study Support a Distinction between a Holding and a Pushing Isometric Muscle Function. BMC Sports Sci. Med. Rehabil. 2017, 9, 11. [Google Scholar] [CrossRef] [Green Version]
- Garner, J.C.; Blackburn, T.; Weimar, W.; Campbell, B. Comparison of Electromyographic Activity during Eccentrically versus Concentrically Loaded Isometric Contractions. J. Electromyogr. Kinesiol. 2008, 18, 466–471. [Google Scholar] [CrossRef]
- Schaefer, L.V.; Bittmann, F.N. Mechanotendography: Description and Evaluation of a Novel Method for Investigating the Physiological Mechanical Oscillations of Tendons Using a Piezo-Based Measurement System. Eur. J. Transl. Myol. 2021, 31, 9553. [Google Scholar]
- Zion-Golumbic, E. What Is EEG? 2007. Available online: https://www.mada.org.il/brain/articles/faces-e.pdf (accessed on 1 May 2022).
- Schlögl, A.; Slater, M.; Pfurtscheller, G. Presence research and EEG 2002. In Proceedings of the 5th International Workshop on Presence, Porto, Portugal, 9–11 October 2002. [Google Scholar]
- Rajya, L.M.; Prasad, T.V.; Prakash, V.C. Survey on EEG Signal Processing Methods. Int. J. Adv. Res. Comput. Sci. Softw. Eng. 2014, 4, 84–91. [Google Scholar]
- Pontifex, M.B.; Gwizdala, K.L.; Parks, A.C.; Billinger, M.; Brunner, C. Variability of ICA Decomposition May Impact EEG Signals When Used to Remove Eyeblink Artifacts: ICA Variability. Psychophysiology 2017, 54, 386–398. [Google Scholar] [CrossRef] [PubMed] [Green Version]
- Meiron, O.; Gale, R.; Namestnic, J.; Bennet-Back, O.; Gebodh, N.; Esmaeilpour, Z.; Mandzhiyev, V.; Bikson, M. Antiepileptic Effects of a Novel Non-Invasive Neuromodulation Treatment in a Subject with Early-Onset Epileptic Encephalopathy: Case Report With 20 Sessions of HD-TDCS Intervention. Front. Neurosci. 2019, 13, 547. [Google Scholar] [CrossRef] [PubMed]
- Alotaiby, T.; El-Samie, F.E.A.; Alshebeili, S.A.; Ahmad, I. A Review of Channel Selection Algorithms for EEG Signal Processing. EURASIP J. Adv. Signal. Process. 2015, 2015, 66. [Google Scholar] [CrossRef] [Green Version]
- Ernst, K. Quantitative EEG-Auswertung Mittels Kohärenz- und Power-Analyse bei Fokalen Epilepsien. Ph.D. Thesis, Ludwig-Maximilians-Universität München, München, Germany, 2020. [Google Scholar]
- Schaefli, B.; Maraun, D.; Holschneider, M. What Drives High Flow Events in the Swiss Alps? Recent Developments in Wavelet Spectral Analysis and Their Application to Hydrology. Adv. Water Resour. 2007, 30, 2511–2525. [Google Scholar] [CrossRef] [Green Version]
- Holschneider, M. Wavelets. An Analysis Tool; Oxford University Press: Oxford, UK, 1995; ISBN 978-0-19-853481-5. [Google Scholar]
- Maraun, D.; Kurths, J.; Holschneider, M. Nonstationary Gaussian Processes in Wavelet Domain: Synthesis, Estimation, and Significance Testing. Phys. Rev. E 2007, 75, 016707. [Google Scholar] [CrossRef] [Green Version]
- Pfurtscheller, G.; Lopes Da Silva, F.H. Event-Related EEG/MEG Synchronization and Desynchronization: Basic Principles. Clin. Neurophysiol. 1999, 110, 1842–1857. [Google Scholar] [CrossRef]
- Cohen, J. A Power Primer. Psychol. Bull. 1992, 112, 155–159. [Google Scholar] [CrossRef]
- Sullivan, G.M.; Feinn, R. Using effect size—Or why the p value is not enough. J. Grad. Med. Educ. 2012, 4, 279–282. [Google Scholar] [CrossRef] [Green Version]
- Rothman, K.J. No Adjustments Are Needed for Multiple Comparisons. Epidemiology 1990, 1, 43–46. [Google Scholar] [CrossRef] [PubMed] [Green Version]
- Bender, R.; Lange, S.; Ziegler, A. Multiples Testen. DMW Dtsch. Med. Wochenschr. 2002, 127, T4–T7. [Google Scholar] [CrossRef] [PubMed] [Green Version]
- O’Brien, P.C. The Appropriateness of Analysis of Variance and Multiple-Comparison Procedures. Biometrics 1983, 39, 787–794. [Google Scholar] [CrossRef] [PubMed]
- Babiloni, F.; Cincotti, F.; Carducci, F.; Rossini, P.M.; Babiloni, C. Spatial Enhancement of EEG Data by Surface Laplacian Estimation: The Use of Magnetic Resonance Imaging-Based Head Models. Clin. Neurophysiol. 2001, 112, 724–727. [Google Scholar] [CrossRef]
- Albus, J.S. A Theory of Cerebellar Function. Math. Biosci. 1971, 10, 25–61. [Google Scholar] [CrossRef]
- Ashe, J.; Bushara, K. The Olivo-Cerebellar System as a Neural Clock. In Neurobiology of Interval Timing; Merchant, H., De Lafuente, V., Eds.; Springer: New York, NY, USA, 2014; Volume 829, pp. 155–165. ISBN 978-1-4939-1781-5. [Google Scholar]
- Lawrenson, C.; Bares, M.; Kamondi, A.; Kovács, A.; Lumb, B.; Apps, R.; Filip, P.; Manto, M. The Mystery of the Cerebellum: Clues from Experimental and Clinical Observations. Cerebellum Ataxias 2018, 5, 8. [Google Scholar] [CrossRef] [Green Version]
- Shadmehr, R.; Smith, M.A.; Krakauer, J.W. Error Correction, Sensory Prediction, and Adaptation in Motor Control. Annu. Rev. Neurosci. 2010, 33, 89–108. [Google Scholar] [CrossRef] [Green Version]
- Doya, K. Complementary Roles of Basal Ganglia and Cerebellum in Learning and Motor Control. Curr. Opin. Neurobiol. 2000, 10, 732–739. [Google Scholar] [CrossRef]
- Bueti, D.; Walsh, V.; Frith, C.; Rees, G. Different Brain Circuits Underlie Motor and Perceptual Representations of Temporal Intervals. J. Cogn. Neurosci. 2008, 20, 204–214. [Google Scholar] [CrossRef]
- Rao, S.M.; Harrington, D.L.; Haaland, K.Y.; Bobholz, J.A.; Cox, R.W.; Binder, J.R. Distributed Neural Systems Underlying the Timing of Movements. J. Neurosci. 1997, 17, 5528–5535. [Google Scholar] [CrossRef] [Green Version]
- Lewis, P.A.; Miall, R.C. Brain Activation Patterns during Measurement of Sub- and Supra-Second Intervals. Neuropsychologia 2003, 41, 1583–1592. [Google Scholar] [CrossRef] [Green Version]
- Huggenberger, S.; Moser, N.; Schröder, H.; Cozzi, B.; Granato, A.; Merighi, A. Neuroanatomie Des. Menschen: Mit 202 Größtenteils Farbigen Abbildungen; Springer: Berlin/Heidelberg, Germany, 2019; ISBN 978-3-662-56461-5. [Google Scholar]
- Vogt, B.A.; Finch, D.M.; Olson, C.R. Functional Heterogeneity in Cingulate Cortex: The Anterior Executive and Posterior Evaluative Regions. Cereb. Cortex 1992, 2, 435–443. [Google Scholar] [CrossRef] [PubMed]
- Groenewegen, H.J. The Basal Ganglia and Motor Control. Neural Plast. 2003, 10, 107–120. [Google Scholar] [CrossRef] [PubMed]
- Gerfen, C.R.; Wilson, C.J. Chapter II the Basal Ganglia. In Handbook of Chemical Neuroanatomy; Elsevier: Amsterdam, The Netherlands, 1996; Volume 12, pp. 371–468. ISBN 978-0-444-82451-6. [Google Scholar]
- Morecraft, R.J.; Tanjii, J. Cingulofrontal Interactions and the Cingulate Motor Areas. In Cingulate Neurobiology and Disease; Oxford University Press: Oxford, UK, 2009; ISBN 978-0-19-856696-0. [Google Scholar]
- Welsh, J.P.; Lang, E.J.; Suglhara, I.; Llinás, R. Dynamic Organization of Motor Control within the Olivocerebellar System. Nature 1995, 374, 453–457. [Google Scholar] [CrossRef] [PubMed]
- Sherman, S. Thalamus. Scholarpedia 2006, 1, 1583. [Google Scholar] [CrossRef]
- Vogt, B.A.; Nimchinsky, E.A.; Vogt, L.J.; Hof, P.R. Human Cingulate Cortex: Surface Features, Flat Maps, and Cytoarchitecture. J. Comp. Neurol. 1995, 359, 490–506. [Google Scholar] [CrossRef] [PubMed]
- Ivry, R.B. The Representation of Temporal Information in Perception and Motor Control. Curr. Opin. Neurobiol. 1996, 6, 851–857. [Google Scholar] [CrossRef]
- Schaefer, L.V.; Löffler, N.; Klein, J.; Bittmann, F.N. Mechanomyography and Acceleration Show Interlimb Asymmetries in Parkinson Patients without Tremor Compared to Controls during a Unilateral Motor Task. Sci. Rep. 2021, 11, 2631. [Google Scholar] [CrossRef]
- Schaefer, L.V.; Bittmann, F.N. Parkinson Patients without Tremor Show Changed Patterns of Mechanical Muscle Oscillations during a Specific Bilateral Motor Task Compared to Controls. Sci. Rep. 2020, 10, 1168. [Google Scholar] [CrossRef] [Green Version]
- Stancák, A.; Pfurtscheller, G. Event-Related Desynchronisation of Central Beta-Rhythms during Brisk and Slow Self-Paced Finger Movements of Dominant and Nondominant Hand. Cogn. Brain Res. 1996, 4, 171–183. [Google Scholar] [CrossRef]
- Enoka, R.M. Eccentric Contractions Require Unique Activation Strategies by the Nervous System. J. Appl. Physiol. 1996, 81, 2339–2346. [Google Scholar] [CrossRef] [PubMed] [Green Version]
- Duchateau, J.; Baudry, S. Insights into the Neural Control of Eccentric Contractions. J. Appl. Physiol. 2014, 116, 1418–1425. [Google Scholar] [CrossRef] [PubMed]
- Duchateau, J.; Enoka, R.M. Neural Control of Lengthening Contractions. J. Exp. Biol. 2016, 219, 197–204. [Google Scholar] [CrossRef] [PubMed] [Green Version]
- Duchateau, J.; Enoka, R.M. Neural Control of Shortening and Lengthening Contractions: Influence of Task Constraints: Shortening and Lengthening Contractions. J. Physiol. 2008, 586, 5853–5864. [Google Scholar] [CrossRef] [PubMed]
- O’Halloran, C.J.; Kinsella, G.J.; Storey, E. The Cerebellum and Neuropsychological Functioning: A Critical Review. J. Clin. Exp. Neuropsychol. 2012, 34, 35–56. [Google Scholar] [CrossRef] [PubMed]
- Schmahmann, J.D.; Caplan, D. Cognition, Emotion and the Cerebellum. Brain 2006, 129, 290–292. [Google Scholar] [CrossRef]
- Sänger, J.; Müller, V.; Lindenberger, U. Intra- and Interbrain Synchronization and Network Properties When Playing Guitar in Duets. Front. Hum. Neurosci. 2012, 6, 312. [Google Scholar] [CrossRef] [Green Version]


| No. | Sub-Regions | Abbr. | EEG Channels | Regions for Statistics |
|---|---|---|---|---|
| 1 | Frontal central | FM | Fpz, Fz | EEGcen |
| 2 | Central | C | FC1, FCz, FC2, C1, Cz, C2; CP | |
| 3 | Central parietal | CP | CP1, CP2 | |
| 4 | Parietal occipital central | POc | Pz, POz, Oz | |
| 5 | Anterior frontal left | AFle | Fp1, AF3, AF7, F1, F3, F5, F7 | EEGle |
| 6 | Temporal lateral left | TLle | FC3, FC5, FT7, C3, C5, T7, CP3, CP5, TP7, M1 | |
| 7 | Parietal occipital left | POle | P1, P3, P5, P7, PO3, PO5, PO7, O1 | |
| 8 | Anterior frontal right | AFri | Fp2, AF4, AF8, F2, F4, F6, F8 | EEGri |
| 9 | Temporal lateral right | TLri | FC4, FC6, FT8, C4, C6, T8, CP4, CP6, TP8, M2 | |
| 10 | Parietal occipital right | POri | P2, P4, P6, P8, PO4, PO6, PO8, O2 |
| Sensor Pair | Mode | n | M (%) | SD | CV | t/z | df | p | dz |
|---|---|---|---|---|---|---|---|---|---|
| Intrapersonal | |||||||||
| MMGs | AB_IMA | 3 | 97.097 | 4.895 | 0.050 | 18.189 | 2 | 0.003 | 10.501 |
| rand | 11.982 | 3.356 | 0.280 | ||||||
| MMGs vs. EEGcen | AB_IMA | 12 | 26.164 | 9.840 | 0.376 | −1.177 | - | 0.239 * | - |
| rand | 21.864 | 7.744 | 0.354 | ||||||
| MMGs vs. EEGle | AB_IMA | 9 | 33.735 | 9.623 | 0.285 | 4.778 | 8 | 0.001 | 1.593 |
| rand | 20.95 | 10.549 | 0.504 | ||||||
| MMGs vs. EEGri | AB_IMA | 9 | 28.557 | 6.406 | 0.224 | 3.886 | 8 | 0.005 | 1.295 |
| rand | 17.190 | 8.995 | 0.523 | ||||||
| EEGcen | AB_IMA | 6 | 89.240 | 14.730 | 0.165 | 11.136 | 5 | <0.001 | 4.547 |
| rand | 20.966 | 5.770 | 0.275 | ||||||
| EEGle | AB_IMA | 3 | 90.717 | 34.711 | 0.383 | 3.467 | 2 | 0.074 | 2.002 |
| rand | 27.188 | 3.027 | 0.111 | ||||||
| EEGri | AB_IMA | 3 | 99.323 | 24.465 | 0.246 | 7.059 | 2 | 0.019 | 4.076 |
| rand | 21.312 | 12.492 | 0.586 | ||||||
| EEGcen vs. EEGle | AB_IMA | 12 | 90.205 | 12.243 | 0.136 | 15.783 | 11 | <0.001 | 4.556 |
| rand | 22.513 | 8.841 | 0.393 | ||||||
| EEGcen vs. EEGri | AB_IMA | 12 | 89.883 | 10.240 | 0.114 | 18.176 | 11 | <0.001 | 5.247 |
| rand | 16.879 | 6.259 | 0.371 | ||||||
| EEGle vs. EEGri | AB_IMA | 9 | 102.419 | 16.432 | 0.160 | 19.358 | 8 | <0.001 | 6.453 |
| rand | 16.718 | 7.804 | 0.467 | ||||||
| Interpersonal | |||||||||
| MMGs | AB_IMA | 6 | 62.450 | 23.429 | 0.375 | 3.636 | 5 | 0.015 | 1.484 |
| rand | 18.658 | 7.535 | 0.404 | ||||||
| MMGs vs. EEGcen | AB_IMA | 12 | 55.472 | 15.429 | 0.278 | 8.029 | 11 | <0.001 | 2.318 |
| rand | 21.788 | 7.855 | 0.361 | ||||||
| MMGs vs. EEGle | AB_IMA | 9 | 63.187 | 15.588 | 0.247 | 9.182 | 8 | <0.001 | 3.061 |
| rand | 16.734 | 6.579 | 0.393 | ||||||
| MMGs vs. EEGri | AB_IMA | 9 | 61.155 | 11.564 | 0.189 | 8.762 | 8 | <0.001 | 2.921 |
| rand | 14.797 | 6.993 | 0.473 | ||||||
| EEGcen | AB_IMA | 10 | 19.082 | 4.678 | 0.245 | 3.17 | 9 | 0.011 | 1.003 |
| rand | 16.412 | 5.941 | 0.362 | ||||||
| EEGle | AB_IMA | 6 | 21.94 | 4.974 | 0.227 | −0.672 | 5 | 0.531 | 0.274 |
| rand | 27.239 | 22.442 | 0.824 | ||||||
| EEGri | AB_IMA | 6 | 20.556 | 3.481 | 0.169 | 3.163 | 5 | 0.025 | 1.291 |
| rand | 12.783 | 4.473 | 0.350 | ||||||
| EEGcen vs. EEGle | AB_IMA | 12 | 20.874 | 4.645 | 0.223 | 0.238 | 11 | 0.817 | 0.069 |
| rand | 20.043 | 9.989 | 0.498 | ||||||
| EEGcen vs. EEGri | AB_IMA | 12 | 19.603 | 3.126 | 0.159 | −0.538 | 11 | 0.602 | 0.155 |
| rand | 20.823 | 8.474 | 0.407 | ||||||
| EEGle vs. EEGri | AB_IMA | 9 | 21.320 | 3.573 | 0.168 | 0.501 | 8 | 0.630 | 0.167 |
| rand | 19.534 | 9.913 | 0.507 | ||||||
Publisher’s Note: MDPI stays neutral with regard to jurisdictional claims in published maps and institutional affiliations. |
© 2022 by the authors. Licensee MDPI, Basel, Switzerland. This article is an open access article distributed under the terms and conditions of the Creative Commons Attribution (CC BY) license (https://creativecommons.org/licenses/by/4.0/).
Share and Cite
Schaefer, L.V.; Bittmann, F.N. Case Study: Intra- and Interpersonal Coherence of Muscle and Brain Activity of Two Coupled Persons during Pushing and Holding Isometric Muscle Action. Brain Sci. 2022, 12, 703. https://doi.org/10.3390/brainsci12060703
Schaefer LV, Bittmann FN. Case Study: Intra- and Interpersonal Coherence of Muscle and Brain Activity of Two Coupled Persons during Pushing and Holding Isometric Muscle Action. Brain Sciences. 2022; 12(6):703. https://doi.org/10.3390/brainsci12060703
Chicago/Turabian StyleSchaefer, Laura V., and Frank N. Bittmann. 2022. "Case Study: Intra- and Interpersonal Coherence of Muscle and Brain Activity of Two Coupled Persons during Pushing and Holding Isometric Muscle Action" Brain Sciences 12, no. 6: 703. https://doi.org/10.3390/brainsci12060703
APA StyleSchaefer, L. V., & Bittmann, F. N. (2022). Case Study: Intra- and Interpersonal Coherence of Muscle and Brain Activity of Two Coupled Persons during Pushing and Holding Isometric Muscle Action. Brain Sciences, 12(6), 703. https://doi.org/10.3390/brainsci12060703