
Later but Not Weaker: Neural Categorization of Native Vowels of Children at Familial Risk of Dyslexia

Abstract
1. Introduction
2. Methods and Materials
2.1. Participants
2.2. Materials
2.3. Procedure
2.4. EEG Processing
2.5. Statistical Analysis
2.6. Results
3. General Discussion
4. Conclusions
Supplementary Materials
Funding
Institutional Review Board Statement
Informed Consent Statement
Data Availability Statement
Acknowledgments
Conflicts of Interest
References
- Shaywitz, S.E.; Shaywitz, B.A. Dyslexia (Specific Reading Disability). Biol. Psychiatry 2005, 57, 1301–1309. [Google Scholar] [CrossRef] [PubMed]
- Francks, C.; MacPhie, I.L.; Monaco, A.P. The genetic basis of dyslexia. Lancet Neurol. 2002, 1, 483–490. [Google Scholar] [CrossRef]
- Galaburda, A.M.; LoTurco, J.; Ramus, F.; Fitch, R.H.; Rosen, G.D. From genes to behavior in developmental dyslexia. Nat. Neurosci. 2006, 9, 1213–1217. [Google Scholar] [CrossRef] [PubMed]
- Schumacher, J.; Hoffmann, P.; Schmäl, C.; Schulte-Körne, G.; Nöthen, M.M. Genetics of dyslexia: The evolving landscape. J. Med. Genet. 2007, 44, 289–297. [Google Scholar] [CrossRef]
- Snowling, M.J.; Melby-Lervåg, M. Oral language deficits in familial dyslexia: A meta-analysis and review. Psychol. Bull. 2016, 142, 498–545. [Google Scholar] [CrossRef]
- Pennington, B.F.; Lefly, D.L. Early Reading Development in Children at Family Risk for Dyslexia. Child Dev. 2001, 72, 816–833. [Google Scholar] [CrossRef]
- Snowling, M.J. Early identification and interventions for dyslexia: A contemporary view. J. Res. Spec. Educ. Needs 2013, 13, 7–14. [Google Scholar] [CrossRef]
- Lyytinen, H.; Guttorm, T.K.; Huttunen, T.; Hämäläinen, J.; Leppänen, P.H.T.; Vesterinen, M. Psychophysiology of developmental dyslexia: A review of findings including studies of children at risk for dyslexia. J. Neurolinguist. 2005, 18, 167–195. [Google Scholar] [CrossRef]
- Bus, A.G.; van Ijzendoorn, M.H. Phonological awareness and early reading: A meta-analysis of experimental training studies. J. Educ. Psychol. 1999, 91, 403–414. [Google Scholar] [CrossRef]
- Ruan, Y.; Georgiou, G.K.; Song, S.; Li, Y.; Shu, H. Does writing system influence the associations between phonological awareness, morphological awareness, and reading? A meta-analysis. J. Educ. Psychol. 2018, 110, 180–202. [Google Scholar] [CrossRef]
- Melby-Lervåg, M.; Lyster, S.-A.H.; Hulme, C. Phonological skills and their role in learning to read: A meta-analytic review. Psychol. Bull. 2012, 138, 322–352. [Google Scholar] [CrossRef] [PubMed]
- Bruck, M. Persistence of dyslexics’ phonological awareness deficits. Dev. Psychol. 1992, 28, 874–886. [Google Scholar] [CrossRef]
- Fawcett, A.J.; Nicolson, R.I. Persistence of phonological awareness deficits in older children with dyslexia. Read. Writ. 1995, 7, 361–376. [Google Scholar] [CrossRef]
- Parrila, R.; Dudley, D.; Song, S.; Georgiou, G.K. A meta-analysis of reading-level match dyslexia studies in consistent alphabetic orthographies. Ann. Dyslexia 2020, 70, 1–26. [Google Scholar] [CrossRef]
- Frey, A.; François, C.; Chobert, J.; Besson, M.; Ziegler, J.C. Behavioral and electrophysiological investigation of speech perception deficits in silence, noise and envelope conditions in developmental dyslexia. Neuropsychologia 2019, 130, 3–12. [Google Scholar] [CrossRef]
- Talla, P. Auditory temporal perception, phonics, and reading disabilities in children. Brain Lang. 1980, 9, 182–198. [Google Scholar] [CrossRef]
- Hämäläinen, J.; Leppänen, P.H.T.; Torppa, M.; Müller, K.; Lyytinen, H. Detection of sound rise time by adults with dyslexia. Brain Lang. 2005, 94, 32–42. [Google Scholar] [CrossRef]
- Vanvooren, S.; Poelmans, H.; de Vos, A.; Ghesquière, P.; Wouters, J. Do prereaders’ auditory processing and speech perception predict later literacy? Res. Dev. Disabil. 2017, 70, 138–151. [Google Scholar] [CrossRef]
- Hämäläinen, J.A.; Salminen, H.K.; Leppänen, P.H.T. Basic Auditory Processing Deficits in Dyslexia: Systematic Review of the Behavioral and Event-Related Potential/ Field Evidence. J. Learn. Disabil. 2013, 46, 413–427. [Google Scholar] [CrossRef]
- Ferrand, C.T. Harmonics-to-Noise Ratio: An Index of Vocal Aging. J. Voice 2002, 16, 480–487. [Google Scholar] [CrossRef]
- Harnsberger, J.D.; Brown, W.S.; Shrivastav, R.; Rothman, H. Noise and Tremor in the Perception of Vocal Aging in Males. J. Voice 2010, 24, 523–530. [Google Scholar] [CrossRef] [PubMed]
- Johnson, K.; Sjerps, M. Speaker normalization in speech perception. UC Berkeley Phon Lab. Annu. Rep. 2018, 14, 32–64. [Google Scholar] [CrossRef]
- Vellutino, F.R.; Fletcher, J.M.; Snowling, M.J.; Scanlon, D.M. Specific reading disability (dyslexia): What have we learned in the past four decades? J. Child Psychol. Psychiatry 2004, 45, 2–40. [Google Scholar] [CrossRef] [PubMed]
- Blomert, L.; Mitterer, H. The fragile nature of the speech-perception deficit in dyslexia: Natural vs. synthetic speech. Brain Lang. 2004, 89, 21–26. [Google Scholar] [CrossRef]
- Cheung, H.; Chung, K.K.H.; Wong, S.W.L.; McBride-Chang, C.; Penney, T.B.; Ho, C.S.H. Perception of tone and aspiration contrasts in Chinese children with dyslexia. J. Child Psychol. Psychiatry 2009, 50, 726–733. [Google Scholar] [CrossRef]
- Manis, F.R.; McBride-Chang, C.; Seidenberg, M.S.; Keating, P.; Doi, L.M.; Munson, B.; Petersen, A. Are Speech Perception Deficits Associated with Developmental Dyslexia? J. Exp. Child Psychol. 1997, 66, 211–235. [Google Scholar] [CrossRef]
- McBride-Chang, C. Models of Speech Perception and Phonological Processing in Reading. Child Dev. 1996, 67, 1836–1856. [Google Scholar] [CrossRef]
- Nittrouer, S. Do Temporal Processing Deficits Cause Phonological Processing Problems? J. Speech Lang. Hear. Res. 1999, 42, 925–942. [Google Scholar] [CrossRef]
- Noordenbos, M.W.; Serniclaes, W. The Categorical Perception Deficit in Dyslexia: A Meta-Analysis. Sci. Stud. Read. 2015, 19, 340–359. [Google Scholar] [CrossRef]
- Serniclaes, W.; van Heghe, S.; Mousty, P.; Carré, R.; Sprenger-Charolles, L. Allophonic mode of speech perception in dyslexia. J. Exp. Child Psychol. 2004, 87, 336–361. [Google Scholar] [CrossRef]
- Serniclaes, W.; Seck, M. Enhanced Sensitivity to Subphonemic Segments in Dyslexia: A New Instance of Allophonic Perception. Brain Sci. 2018, 8, 54. [Google Scholar] [CrossRef] [PubMed]
- Snowling, M.J.; Lervåg, A.; Nash, H.M.; Hulme, C. Longitudinal relationships between speech perception, phonological skills and reading in children at high-risk of dyslexia. Dev. Sci. 2019, 22, e12723. [Google Scholar] [CrossRef] [PubMed]
- Goswami, U. A temporal sampling framework for developmental dyslexia. Trends Cogn. Sci. 2011, 15, 3–10. [Google Scholar] [CrossRef] [PubMed]
- Hazan, V.; Messaoud-Galusi, S.; Rosen, S.; Nouwens, S.; Shakespeare, B. Speech Perception Abilities of Adults With Dyslexia: Is There Any Evidence for a True Deficit? J. Speech Lang. Hear. Res. 2009, 52, 1510–1529. [Google Scholar] [CrossRef]
- Joanisse, M.F.; Manis, F.R.; Keating, P.; Seidenberg, M.S. Language Deficits in Dyslexic Children: Speech Perception, Phonology, and Morphology. J. Exp. Child Psychol. 2000, 77, 30–60. [Google Scholar] [CrossRef]
- Messaoud-Galusi, S.; Hazan, V.; Rosen, S. Investigating speech perception in children with dyslexia: Is there evidence of a consistent deficit in individuals? J. Speech Lang. Hear. Res. 2011, 54, 1682–1701. [Google Scholar] [CrossRef]
- Van der Leij, A.; van Bergen, E.; van Zuijen, T.; de Jong, P.; Maurits, N.; Maassen, B. Precursors of Developmental Dyslexia: An Overview of the Longitudinal Dutch Dyslexia Programme Study. Dyslexia 2013, 19, 191–213. [Google Scholar] [CrossRef]
- Richardson, U.; Leppänen, P.H.T.; Leiwo, M.; Lyytinen, H. Speech Perception of Infants With High Familial Risk for Dyslexia Differ at the Age of 6 Months. Dev. Neuropsychol. 2003, 23, 385–397. [Google Scholar] [CrossRef]
- De Klerk, M.; de Bree, E.; Veen, D.; Wijnen, F. Speech discrimination in infants at family risk of dyslexia: Group and individual-based analyses. J. Exp. Child Psychol. 2021, 206, 105066. [Google Scholar] [CrossRef]
- Boets, B.; Wouters, J.; van Wieringen, A.; Ghesquière, P. Auditory processing, speech perception and phonological ability in pre-school children at high-risk for dyslexia: A longitudinal study of the auditory temporal processing theory. Neuropsychologia 2007, 45, 1608–1620. [Google Scholar] [CrossRef]
- Gerrits, E.; de Bree, E. Early language development of children at familial risk of dyslexia: Speech perception and production. J. Commun. Disord. 2009, 42, 180–194. [Google Scholar] [CrossRef] [PubMed]
- Noordenbos, M.W.; Segers, E.; Serniclaes, W.; Mitterer, H.; Verhoeven, L. Allophonic mode of speech perception in Dutch children at risk for dyslexia: A longitudinal study. Res. Dev. Disabil. 2012, 33, 1469–1483. [Google Scholar] [CrossRef] [PubMed]
- Van Alphen, P.; de Bree, E.; Gerrits, E.; de Jong, J.; Wilsenach, C.; Wijnen, F. Early language development in children with a genetic risk of dyslexia. Dyslexia 2004, 10, 265–288. [Google Scholar] [CrossRef] [PubMed]
- Peltola, M.S.; Kujala, T.; Tuomainen, J.; Ek, M.; Aaltonen, O.; Näätänen, R. Native and foreign vowel discrimination as indexed by the mismatch negativity (MMN) response. Neurosci. Lett. 2003, 352, 25–28. [Google Scholar] [CrossRef]
- Saloranta, A.; Alku, P.; Peltola, M.S. Listen-and-repeat training improves perception of second language vowel duration: Evidence from mismatch negativity (MMN) and N1 responses and behavioral discrimination. Int. J. Psychophysiol. 2020, 147, 72–82. [Google Scholar] [CrossRef] [PubMed]
- Bishop, D.V.M. Using mismatch negativity to study central auditory processing in developmental language and literacy impairments: Where are we, and where should we be going? Psychol. Bull. 2007, 133, 651–672. [Google Scholar] [CrossRef] [PubMed]
- Näätänen, R.; Paavilainen, P.; Rinne, T.; Alho, K. The mismatch negativity (MMN) in basic research of central auditory processing: A review. Clin. Neurophysiol. 2007, 118, 2544–2590. [Google Scholar] [CrossRef]
- Tervaniemi, M.; Maury, S.; Naatanen, R. Neural representations of abstract stimulus features in the human brain as reflected by the mismatch negativity. Neuroreport 1994, 5, 844–846. [Google Scholar] [CrossRef]
- Xiao, X.Z.; Wong, H.K.; Wang, Y.; Zhao, K.; Zeng, G.Q.; Yip, L.Y.; Wong, G.C.S.; Tse, C.Y. Detecting violation in abstract pitch patterns with mismatch negativity. Psychophysiology 2018, 55, e13078. [Google Scholar] [CrossRef]
- Stefanics, G.; Háden, G.P.; Sziller, I.; Balázs, L.; Beke, A.; Winkler, I. Newborn infants process pitch intervals. Clin. Neurophysiol. 2009, 120, 304–308. [Google Scholar] [CrossRef]
- Tew, S.; Fujioka, T.; He, C.; Trainor, L. Neural Representation of Transposed Melody in Infants at 6 Months of Age. Ann. N. Y. Acad. Sci. 2009, 1169, 287–290. [Google Scholar] [CrossRef]
- Lang, H.A.; Nyrke, T.; Ek, O.; Aaltonen, O.; Raimo, I.; Näätänen, R. Pitch discrimination performance and auditory event-related potentials. In Phychophysiological Brain Research; Brunia, C.H.M., Gaillard, A.W.K., Kok, A., Mulder, G., Verbaten, M.N., Eds.; Tilburg University Press: Tilburg, The Netherlands, 1990; pp. 294–298. [Google Scholar]
- Alho, K.; Kujala, T.; Paavilainen, P.; Summala, H.; Näätänen, R. Auditory processing in visual brain areas of the early blind: Evidence from event-related potentials. Electroenceph. Clin. Neurophysiol. 1993, 86, 418–427. [Google Scholar] [CrossRef]
- He, C.; Hotson, L.; Trainor, L.J. Mismatch Responses to Pitch Changes in Early Infancy. J. Cogn. Neurosci. 2007, 19, 878–892. [Google Scholar] [CrossRef] [PubMed]
- He, C.; Hotson, L.; Trainor, L.J. Maturation of cortical mismatch responses to occasional pitch change in early infancy: Effects of presentation rate and magnitude of change. Neuropsychologia 2009, 47, 218–229. [Google Scholar] [CrossRef] [PubMed]
- Morr, M.L.; Shafer, V.L.; Kreuzer, J.A.; Kurtzberg, D. Maturation of Mismatch Negativity in Typically Developing Infants and Preschool Children. Ear Hear. 2002, 23, 118–136. [Google Scholar] [CrossRef] [PubMed]
- Bishop, D.; Hardiman, M.J.; Barry, J.G. Is auditory discrimination mature by middle childhood? A study using time-frequency analysis of mismatch responses from 7 years to adulthood. Dev. Sci. 2011, 14, 402–416. [Google Scholar] [CrossRef] [PubMed]
- Kushnerenko, E.; Ceponiene, R.; Balan, P.; Fellman, V.; Näätänen, R. Maturation of the auditory change detection response in infants: A longitudinal ERP study. Neuroreport 2002, 13, 1843–1848. [Google Scholar] [CrossRef]
- Cheng, Y.-Y.; Wu, H.-C.; Tzeng, Y.-L.; Yang, M.-T.; Zhao, L.-L.; Lee, C.-Y. Feature-specific transition from positive mismatch response to mismatch negativity in early infancy: Mismatch responses to vowels and initial consonants. Int. J. Psychophysiol. 2015, 96, 84–94. [Google Scholar] [CrossRef]
- Lee, C.Y.; Yen, H.L.; Yeh, P.W.; Lin, W.H.; Cheng, Y.Y.; Tzeng, Y.L.; Wu, H.C. Mismatch responses to lexical tone, initial consonant, and vowel in Mandarin-speaking preschoolers. Neuropsychologia 2012, 50, 3228–3239. [Google Scholar] [CrossRef] [PubMed]
- Kujala, T.; Näätänen, R. The mismatch negativity in evaluating central auditory dysfunction in dyslexia. Neurosci. Biobehav. Rev. 2001, 25, 535–543. [Google Scholar] [CrossRef]
- Gu, C.; Bi, H.-Y. Auditory processing deficit in individuals with dyslexia: A meta-analysis of mismatch negativity. Neurosci. Biobehav. Rev. 2020, 116, 396–405. [Google Scholar] [CrossRef] [PubMed]
- Corbera, S.; Escera, C.; Artigas, J. Impaired duration mismatch negativity in developmental dyslexia. Neuroreport 2006, 17, 1051–1055. [Google Scholar] [CrossRef] [PubMed]
- Baldeweg, T.; Richardson, A.; Watkins, S.; Foale, C.; Gruzelier, J. Impaired auditory frequency discrimination in dyslexia detected with mismatch evoked potentials. Ann. Neurol. 1999, 45, 495–503. [Google Scholar] [CrossRef]
- Noordenbos, M.W.; Segers, E.; Serniclaes, W.; Mitterer, H.; Verhoeven, L. Neural evidence of allophonic perception in children at risk for dyslexia. Neuropsychologia 2012, 50, 2010–2017. [Google Scholar] [CrossRef] [PubMed]
- Bitz, U.; Gust, K.; Spitzer, M.; Kiefer, M. Phonological deficit in school children is reflected in the Mismatch Negativity. Neuroreport 2007, 18, 911–915. [Google Scholar] [CrossRef] [PubMed]
- Molfese, D.L. Predicting Dyslexia at 8 Years of Age Using Neonatal Brain Responses. Brain Lang. 2000, 72, 238–245. [Google Scholar] [CrossRef]
- Volkmer, S.; Schulte-Körne, G. Cortical responses to tone and phoneme mismatch as a predictor of dyslexia? A systematic review. Schizophr. Res. 2018, 191, 148–160. [Google Scholar] [CrossRef]
- Hong, T.; Shuai, L.; Frost, S.J.; Landi, N.; Pugh, K.R.; Shu, H. Cortical Responses to Chinese Phonemes in Preschoolers Predict Their Literacy Skills at School Age. Dev. Neuropsychol. 2018, 43, 356–369. [Google Scholar] [CrossRef] [PubMed]
- Maurer, U.; Bucher, K.; Brem, S.; Brandeis, D. Altered responses to tone and phoneme mismatch in kindergartners at familial dyslexia risk. Neuroreport 2003, 14, 2245–2250. [Google Scholar] [CrossRef]
- Cantiani, C.; Riva, V.; Piazza, C.; Bettoni, R.; Molteni, M.; Choudhury, N.; Marino, C.; Benasich, A.A. Auditory discrimination predicts linguistic outcome in Italian infants with and without familial risk for language learning impairment. Dev. Cogn. Neurosci. 2016, 20, 23–34. [Google Scholar] [CrossRef]
- Lohvansuu, K.; Torppa, M.; Ahonen, T.; Eklund, K.; Hämäläinen, J.A.; Leppänen, P.H.; Lyytinen, H. Unveiling the Mysteries of Dyslexia—Lessons Learned from the Prospective Jyväskylä Longitudinal Study of Dyslexia. Brain Sci. 2021, 11, 427. [Google Scholar] [CrossRef] [PubMed]
- Leppänen, P.H.; Richardson, U.; Pihko, E.; Eklund, K.M.; Guttorm, T.K.; Aro, M.; Lyytinen, H. Brain Responses to Changes in Speech Sound Durations Differ Between Infants With and Without Familial Risk for Dyslexia. Dev. Neuropsychol. 2002, 22, 407–422. [Google Scholar] [CrossRef] [PubMed]
- Leppänen, P.; Pihko, E.; Eklund, K.; Lyytinen, H. Cortical responses of infants with and without a genetic risk for dyslexia: II. Group effects. Neuroreport 1999, 10, 969–973. [Google Scholar] [CrossRef] [PubMed]
- Thiede, A.; Virtala, P.; Ala-Kurikka, I.; Partanen, E.; Huotilainen, M.; Mikkola, K.; Leppänen, P.H.; Kujala, T. An extensive pattern of atypical neural speech-sound discrimination in newborns at risk of dyslexia. Clin. Neurophysiol. 2019, 130, 634–646. [Google Scholar] [CrossRef]
- Van Leeuwen, T.; Been, P.; Kuijpers, C.; Zwarts, F.; Massen, B.; van der Leij, A. Mismatch reponse is absent in 2-month-old infants at risk for dyslexia. Neuroreport 2006, 17, 351–355. [Google Scholar] [CrossRef]
- Van Leeuwen, T.; Been, P.; van Herten, M.; Zwarts, F.; Maassen, B.; van der Leij, A. Two-month-old infants at risk for dyslexia do not discriminate /bAk/ from /dAk/: A brain-mapping study. J. Neurolinguistics 2008, 21, 333–348. [Google Scholar] [CrossRef]
- Van Zuijen, T.L.; Plakas, A.; Maassen, B.A.M.; Maurits, N.M.; van der Leij, A. Infant ERPs separate children at risk of dyslexia who become good readers from those who become poor readers. Dev. Sci. 2013, 16, 554–563. [Google Scholar] [CrossRef] [PubMed]
- Hakvoort, B.; van der Leij, A.; Maurits, N.; Maassen, B.; van Zuijen, T.L. Basic auditory processing is related to familial risk, not to reading fluency: An ERP study. Cortex 2015, 63, 90–103. [Google Scholar] [CrossRef]
- Virtala, P.; Talola, S.; Partanen, E.; Kujala, T. Poor neural and perceptual phoneme discrimination during acoustic variation in dyslexia. Sci. Rep. 2020, 10, 8646. [Google Scholar] [CrossRef]
- Adlard, A.; Hazan, V. Speech Perception in Children with Specific Reading Difficulties (Dyslexia). Q. J. Exp. Psychol. Sect. A 1998, 51, 153–177. [Google Scholar] [CrossRef]
- Beam, G. Dyslexia and Perception of Indexical Features in Speech; The Ohio State University: Columbus, OH, USA, 2019. [Google Scholar]
- Serniclaes, W. Allophonic Theory of Dyslexia: A Short Overview. JSM Commun. Disord. 2018, 2. [Google Scholar]
- Metsala, J.L.; Walley, A.C. Spoken Vocabulary Growth and the Segmental Restructuring of Lexical Representations: Precursors to Phonemic Awareness and Early Reading Ability; Metsala, J.L., Ehri, L.C., Eds.; Lawrence Erlbaum Associates Publishers: Mahwah, NJ, USA, 1998; pp. 89–120. [Google Scholar]
- Walley, A.; Metsala, J.; Garlock, V. Spoken vocabulary growth: Its role in the development of phoneme awareness and early reading ability. Read. Writ. 2003, 16, 5–20. [Google Scholar] [CrossRef]
- Chen, A.; Wijnen, F.; Koster, C.; Schnack, H. Individualized Early Prediction of Familial Risk of Dyslexia: A Study of Infant Vocabulary Development. Front. Psychol. 2017, 8, 156. [Google Scholar] [CrossRef] [PubMed]
- Zink, I.; Lejaegere, M. N-CDI Woordenlijst; Acco: Leusden, The Netherlands, 2002. [Google Scholar]
- Hill, P.R.; McArthur, G.M.; Bishop, D.V.M. Phonological categorization of vowels: A mismatch negativity study. Neuroreport 2004, 15, 2195–2199. [Google Scholar] [CrossRef] [PubMed][Green Version]
- Shestakova, A.; Brattico, E.; Huotilainen, M.; Galunov, V.; Soloviev, A.; Sams, M.; Ilmoniemi, R.J.; Näätänen, R. Abstract phoneme representations in the left temporal cortex: Magnetic mismatch negativity study. Neuroreport 2002, 13, 1813–1816. [Google Scholar] [CrossRef][Green Version]
- Shestakova, A.; Brattico, E.; Soloviev, A.; Klucharev, V.; Huotilainen, M. Orderly cortical representation of vowel categories presented by multiple exemplars. Cogn. Brain Res. 2004, 21, 342–350. [Google Scholar] [CrossRef]
- Jacobsen, T.; Schröger, E.; Alter, K. Pre-attentive perception of vowel phonemes from variable speech stimuli. Psychophysiology 2004, 41, 654–659. [Google Scholar] [CrossRef]
- Brus, B.T.; Voeten, M.J.M. Een-Minuut Test: Vorm A en B.; Berkhout: Nijmegen, The Netherlands, 1973. [Google Scholar]
- Van den Bos, K.P.; Spelberg, H.C.l.; Scheepstra, A.; de Vries, J.R. Handleiding de Klepel [Manual Pseudoword Test “the Clapper”]; Berkhout: Nijmegen, The Netherlands, 1994. [Google Scholar]
- Uterwijk, J. WAIS-III Nederlandstalige Bewerking: Technische Handleiding [WAIS-III Dutch Version: Technical Manual]; Swets & Zeitlinger: Lisse, The Netherlands, 2000. [Google Scholar]
- Kuijpers, C.; Leij, P.H.; van Leeuwen, B.T.G.; Keurs, M.T.; Schreuder, R. Leesproblemen in het voortgezet onderwijs en de volwassenheid [Reading problems in the secondary education and adulthood]. Pedagog. Stud. 2003, 80, 272–287. [Google Scholar]
- Boersma, P.; Weenink, D. Praat: Doing Phonetics by Computer (Version 5.3.25). 2011. Available online: https://www.fon.hum.uva.nl/praat/ (accessed on 1 March 2022).
- Adank, P.; van Hout, R.; Smits, R. An acoustic description of the vowels of Northern and Southern Standard Dutch. J. Acoust. Soc. Am. 2004, 116, 1729–1738. [Google Scholar] [CrossRef]
- Swingley, D. Learning Phonology from Surface Distributions, Considering Dutch and English Vowel Duration. Lang. Learn. Dev. 2019, 15, 199–216. [Google Scholar] [CrossRef]
- Chládková, K.; Escudero, P.; Lipski, S.C. When ‘AA’ is long but ‘A’ is not short: Speakers who distinguish short and long vowels in production do not necessarily encode a short–long contrast in their phonological lexicon. Front. Psychol. 2015, 6, 438. [Google Scholar] [CrossRef] [PubMed]
- Dietrich, C.; Swingley, D.; Werker, J.F. Native language governs interpretation of salient speech sound differences at 18 months. Proc. Natl. Acad. Sci. USA 2007, 104, 16027–16031. [Google Scholar] [CrossRef] [PubMed]
- Kuhl, P.K. Human adults and human infants show a “perceptual magnet effect” for the prototypes of speech categories, monkeys do not. Atten. Percept. Psychophys. 1991, 50, 93–107. [Google Scholar] [CrossRef] [PubMed]
- Polka, L.; Bohn, O.-S. Natural Referent Vowel (NRV) framework: An emerging view of early phonetic development. J. Phon. 2011, 39, 467–478. [Google Scholar] [CrossRef]
- Delorme, A.; Makeig, S. EEGLAB: An open source toolbox for analysis of single-trial EEG dynamics including independent component analysis. J. Neurosci. Methods 2004, 134, 9–21. [Google Scholar] [CrossRef]
- Chen, A.; Peter, V.; Wijnen, F.; Schnack, H.; Burnham, D. Are lexical tones musical? Native language’s influence on neural response to pitch in different domains. Brain Lang. 2018, 180–182, 31–41. [Google Scholar] [CrossRef]
- Maris, E.; Oostenveld, R. Nonparametric statistical testing of EEG- and MEG-data. J. Neurosci. Methods 2007, 164, 177–190. [Google Scholar] [CrossRef]
- Oostenveld, R.; Fries, P.; Maris, E.; Schoffelen, J.-M. FieldTrip: Open Source Software for Advanced Analysis of MEG, EEG, and Invasive Electrophysiological Data. Comput. Intell. Neurosci. 2011, 2011, 156869. [Google Scholar] [CrossRef]
- Brusini, P.; Dehaene-Lambertz, G.; Van Heugten, M.; de Carvalho, A.; Goffinet, F.; Fiévet, A.C.; Christophe, A. Ambiguous function words do not prevent 18-month-olds from building accurate syntactic category expectations: An ERP study. Neuropsychologia 2017, 98, 4–12. [Google Scholar] [CrossRef]
- Jones, M.W.; Kuipers, J.-R.; Nugent, S.; Miley, A.; Oppenheim, G. Episodic traces and statistical regularities: Paired associate learning in typical and dyslexic readers. Cognition 2018, 177, 214–225. [Google Scholar] [CrossRef]
- Gangl, M.; Moll, K.; Jones, M.W.; Banfi, C.; Schulte-Körne, G.; Landerl, K. Lexical Reading in Dysfluent Readers of German. Sci. Stud. Read. 2018, 22, 24–40. [Google Scholar] [CrossRef] [PubMed]
- Shafer, V.L.; Yu, Y.H.; Datta, H. Maturation of Speech Discrimination in 4- to 7-Yr-Old Children as Indexed by Event-Related Potential Mismatch Responses. Ear Hear. 2010, 31, 735–745. [Google Scholar] [CrossRef] [PubMed]
- Metsala, J.L. Young children’s phonological awareness and nonword repetition as a function of vocabulary development. J. Educ. Psychol. 1999, 91, 3–19. [Google Scholar] [CrossRef]
- Plunkett, K.; Sinha, C.; Moller, M.; Strandsby, O. Symbol Grounding or the Emergence of Symbols? Vocabulary Growth in Children and a Connectionist Net. Conn. Sci. 1992, 4, 293–312. [Google Scholar] [CrossRef]
- Hulme, C.; Nash, H.M.; Gooch, D.; Lervåg, A.; Snowling, M.J. The Foundations of Literacy Development in Children at Familial Risk of Dyslexia. Psychol. Sci. 2015, 26, 1877–1886. [Google Scholar] [CrossRef]


| Sample Size | Age (SD) in Days at the Experiment | Gender | CDI Productive Score | CDI Comprehensive Score | Days (SD) between CDI and Experiment | |
|---|---|---|---|---|---|---|
| TD | 35 | 601 (13) | 16 girls | 97 (90) | 297(131) | 7 (11) |
| FR | 35 | 604 (20) | 16 girls | 98 (84) | 296 (107) | 6 (12) |
| Multiple-Speaker Condition | |||
|---|---|---|---|
| /i/ in giep | /I/ in gip | t (11) | |
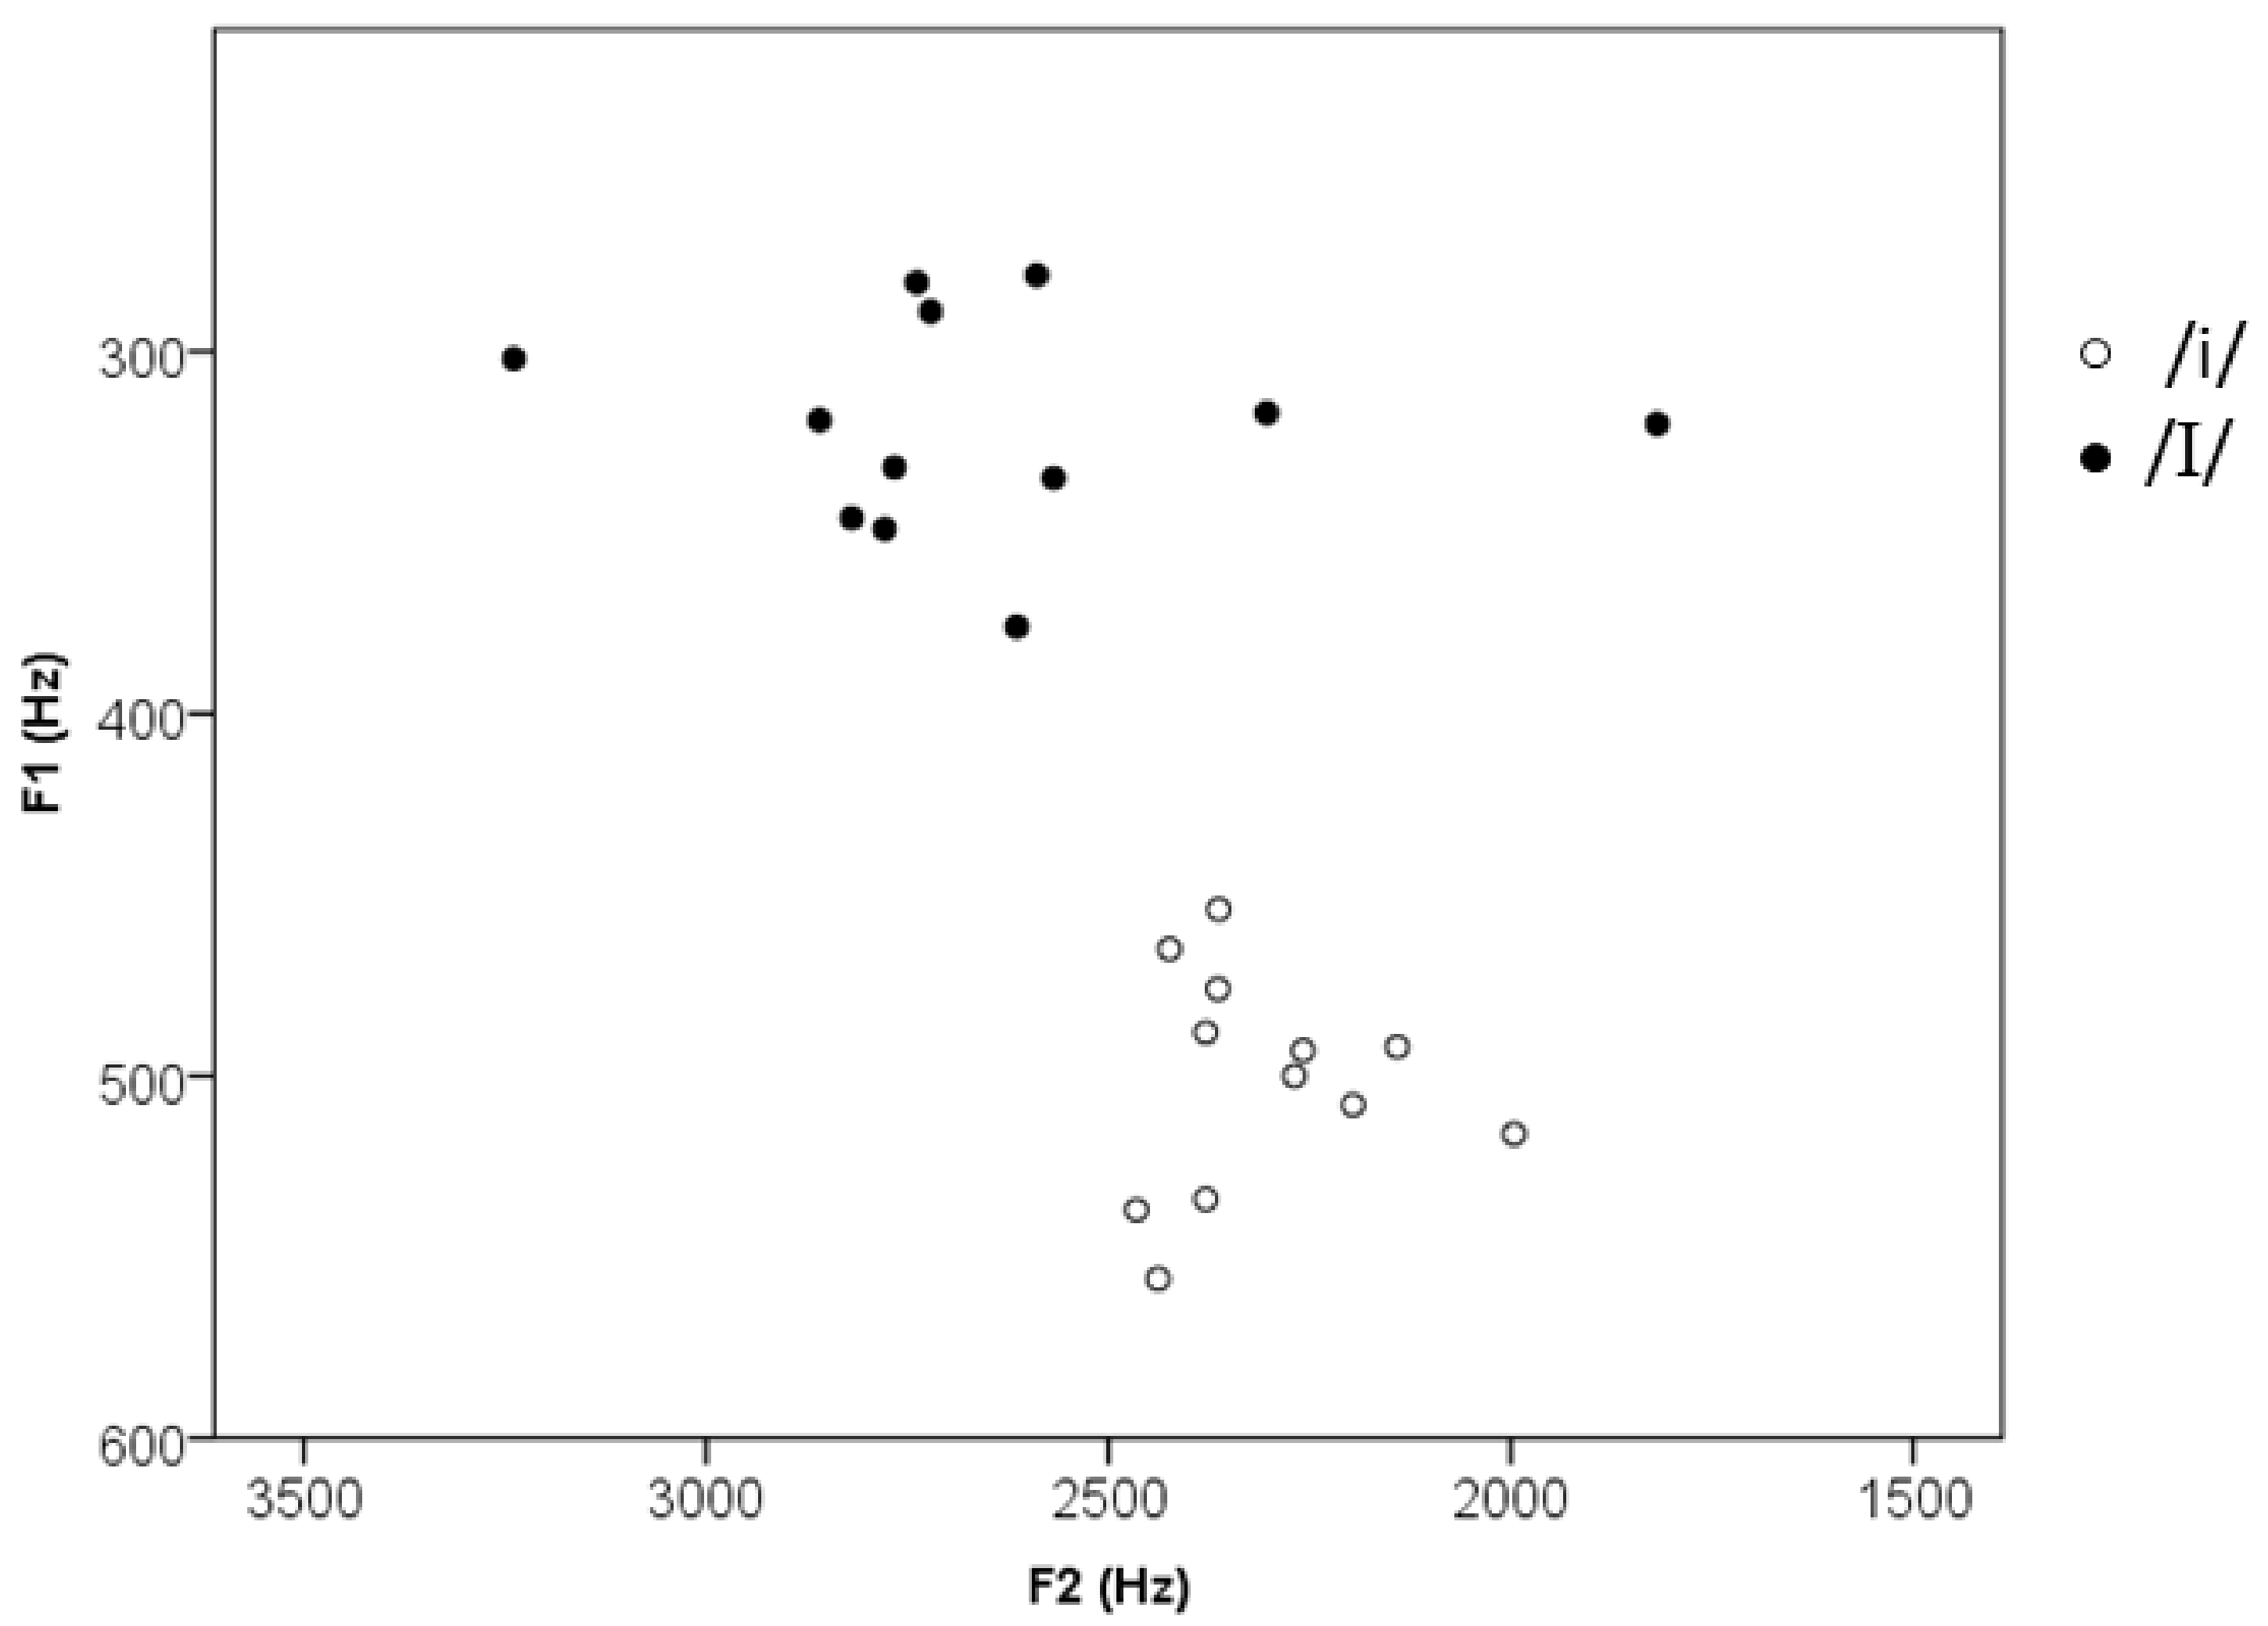
| f0 max (Hz) | 269 (34, 219–321) | 243 (60, 126–321) | 0.89, p = 0.39 |
| f0 min (Hz) | 226 (32, 184–272) | 216 (55, 120–294) | 0.35, p = 0.56 |
| F1 (Hz) | 320 (29, 279–376) | 502 (30, 454–556) | 13.72, p < 0.001 |
| F2 (Hz) | 2651 (342, 1818, 3239) | 2636 (139, 1996–2465) | 3.75, p = 0.003 |
| F3 (Hz) | 3189 (231, 2724–3624) | 2896 (191, 2601–3193) | 3.19, p = 0.009 |
| Vowel duration (ms) | 91 (16, 66–122) | 88 (11, 70–113) | 0.87, p = 0.41 |
| Initial consonant duration (ms) | 87 (2, 83–89) | 88 (2, 86–91) | 1.76, p = 0.12 |
| Word duration (ms) | 346 (9, 331–361) | 342 (10, 323–357) | 1.04, p = 0.32 |
| MS Standard | MS Deviant | SS Standard | SS Deviant | |
|---|---|---|---|---|
| TD | 279 (34) (78%) | 93 (12) (78%) | 266 (38) (74%) | 89 (13) (74%) |
| FR | 286 (64) (79%) | 96 (21) (80%) | 275 (30) (76%) | 93 (12) (78%) |
Publisher’s Note: MDPI stays neutral with regard to jurisdictional claims in published maps and institutional affiliations. |
© 2022 by the author. Licensee MDPI, Basel, Switzerland. This article is an open access article distributed under the terms and conditions of the Creative Commons Attribution (CC BY) license (https://creativecommons.org/licenses/by/4.0/).
Share and Cite
Chen, A. Later but Not Weaker: Neural Categorization of Native Vowels of Children at Familial Risk of Dyslexia. Brain Sci. 2022, 12, 412. https://doi.org/10.3390/brainsci12030412
Chen A. Later but Not Weaker: Neural Categorization of Native Vowels of Children at Familial Risk of Dyslexia. Brain Sciences. 2022; 12(3):412. https://doi.org/10.3390/brainsci12030412
Chicago/Turabian StyleChen, Ao. 2022. "Later but Not Weaker: Neural Categorization of Native Vowels of Children at Familial Risk of Dyslexia" Brain Sciences 12, no. 3: 412. https://doi.org/10.3390/brainsci12030412
APA StyleChen, A. (2022). Later but Not Weaker: Neural Categorization of Native Vowels of Children at Familial Risk of Dyslexia. Brain Sciences, 12(3), 412. https://doi.org/10.3390/brainsci12030412