
Age-Related Alterations in EEG Network Connectivity in Healthy Aging


Abstract
1. Introduction
2. Materials and Methods
2.1. Participants
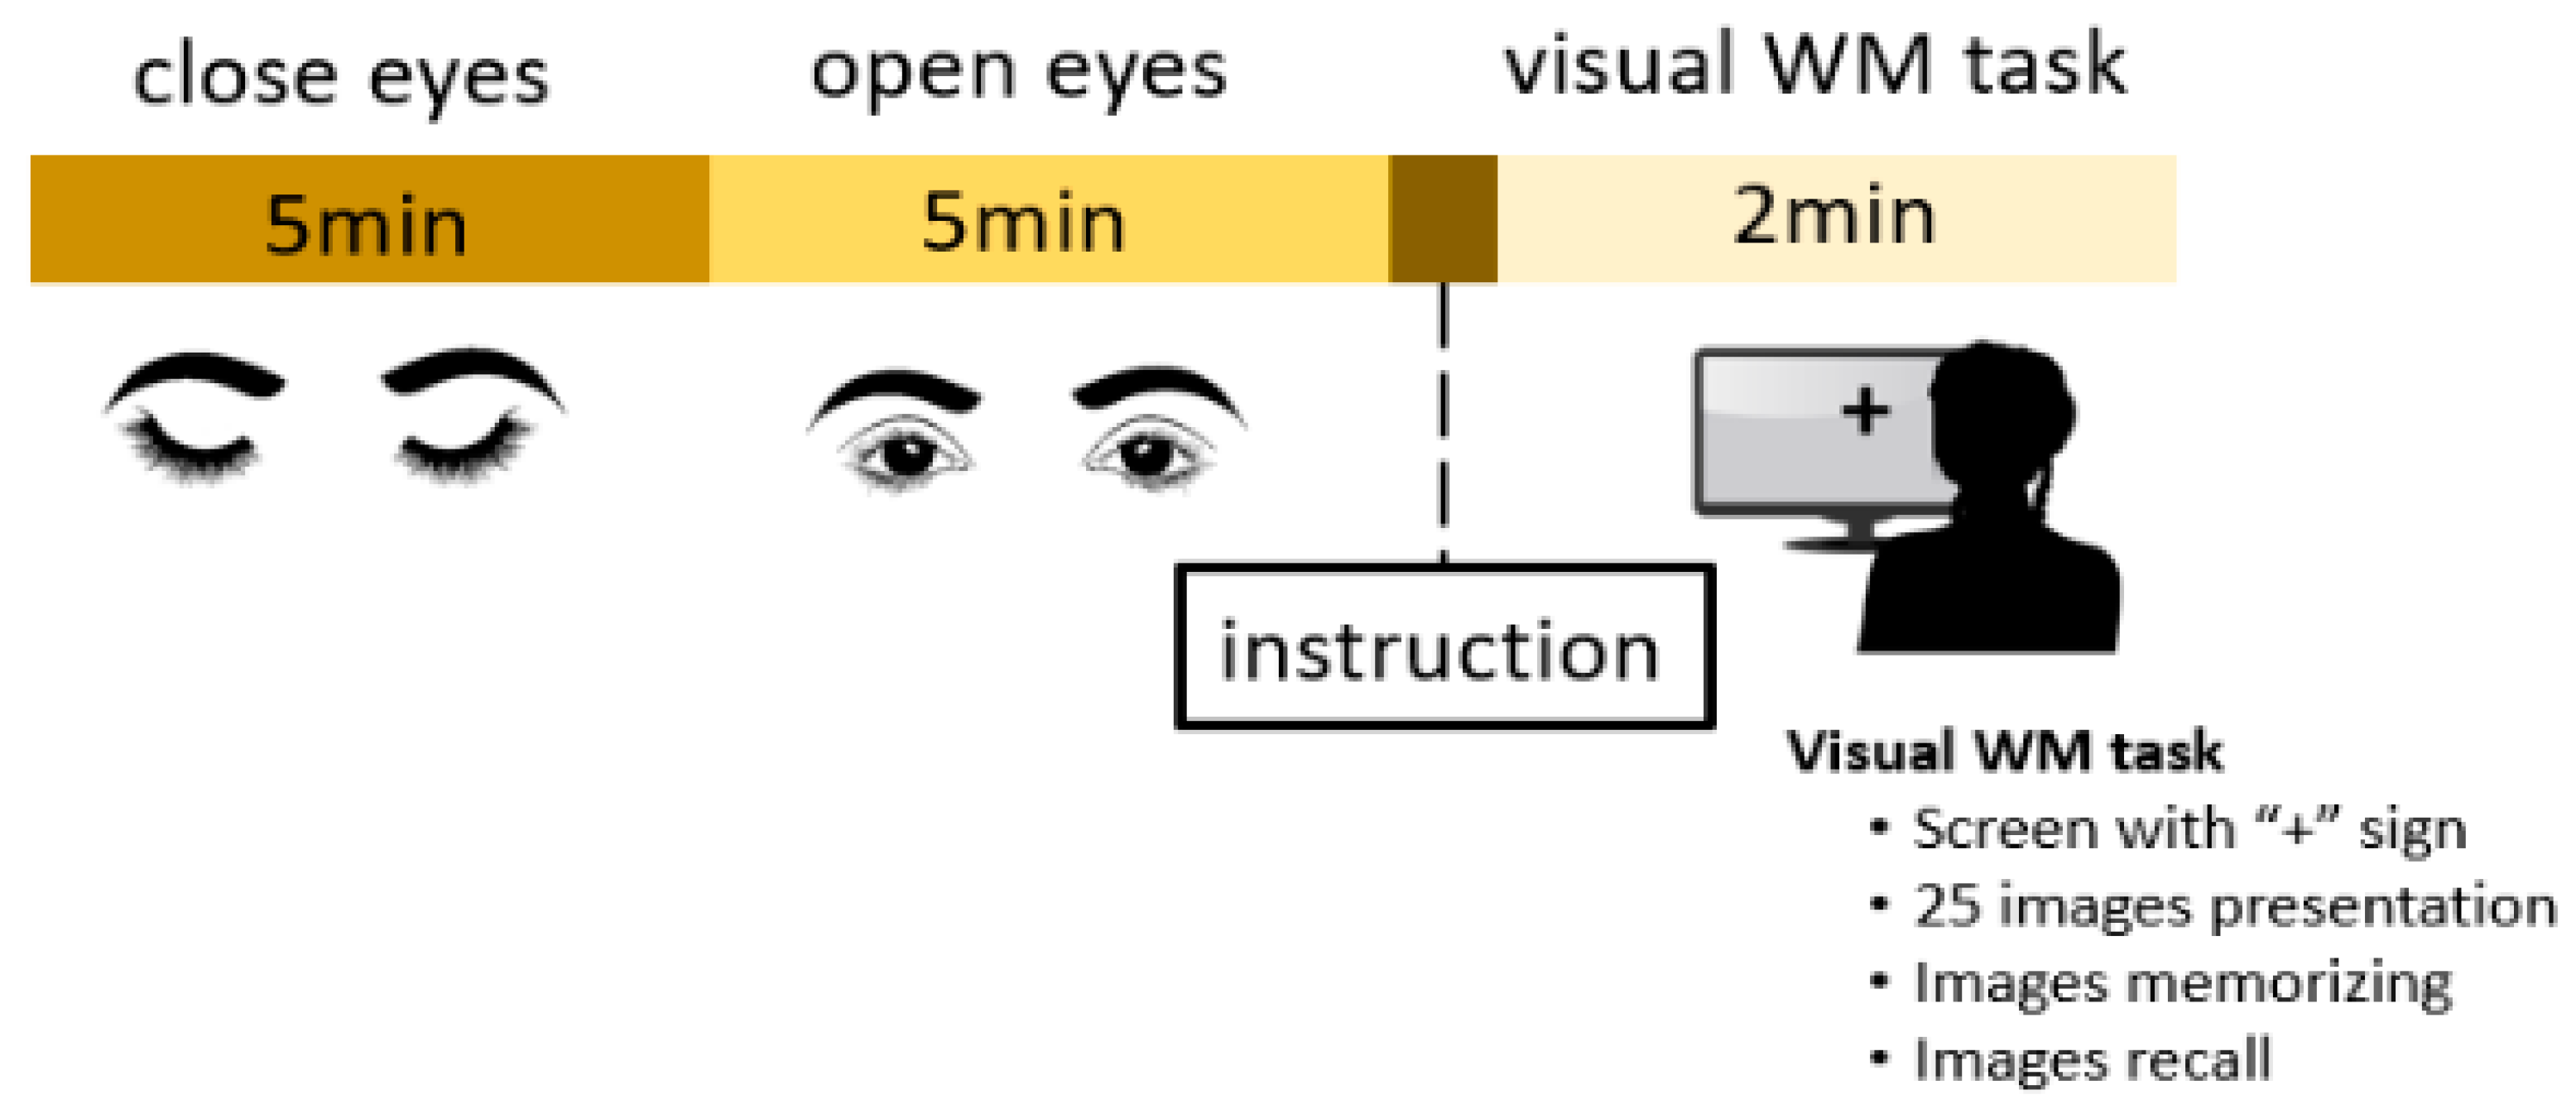
2.2. Experimental Task
2.3. EEG Recording and Preprocessing
2.4. Network Construction
2.5. Statistical Analysis
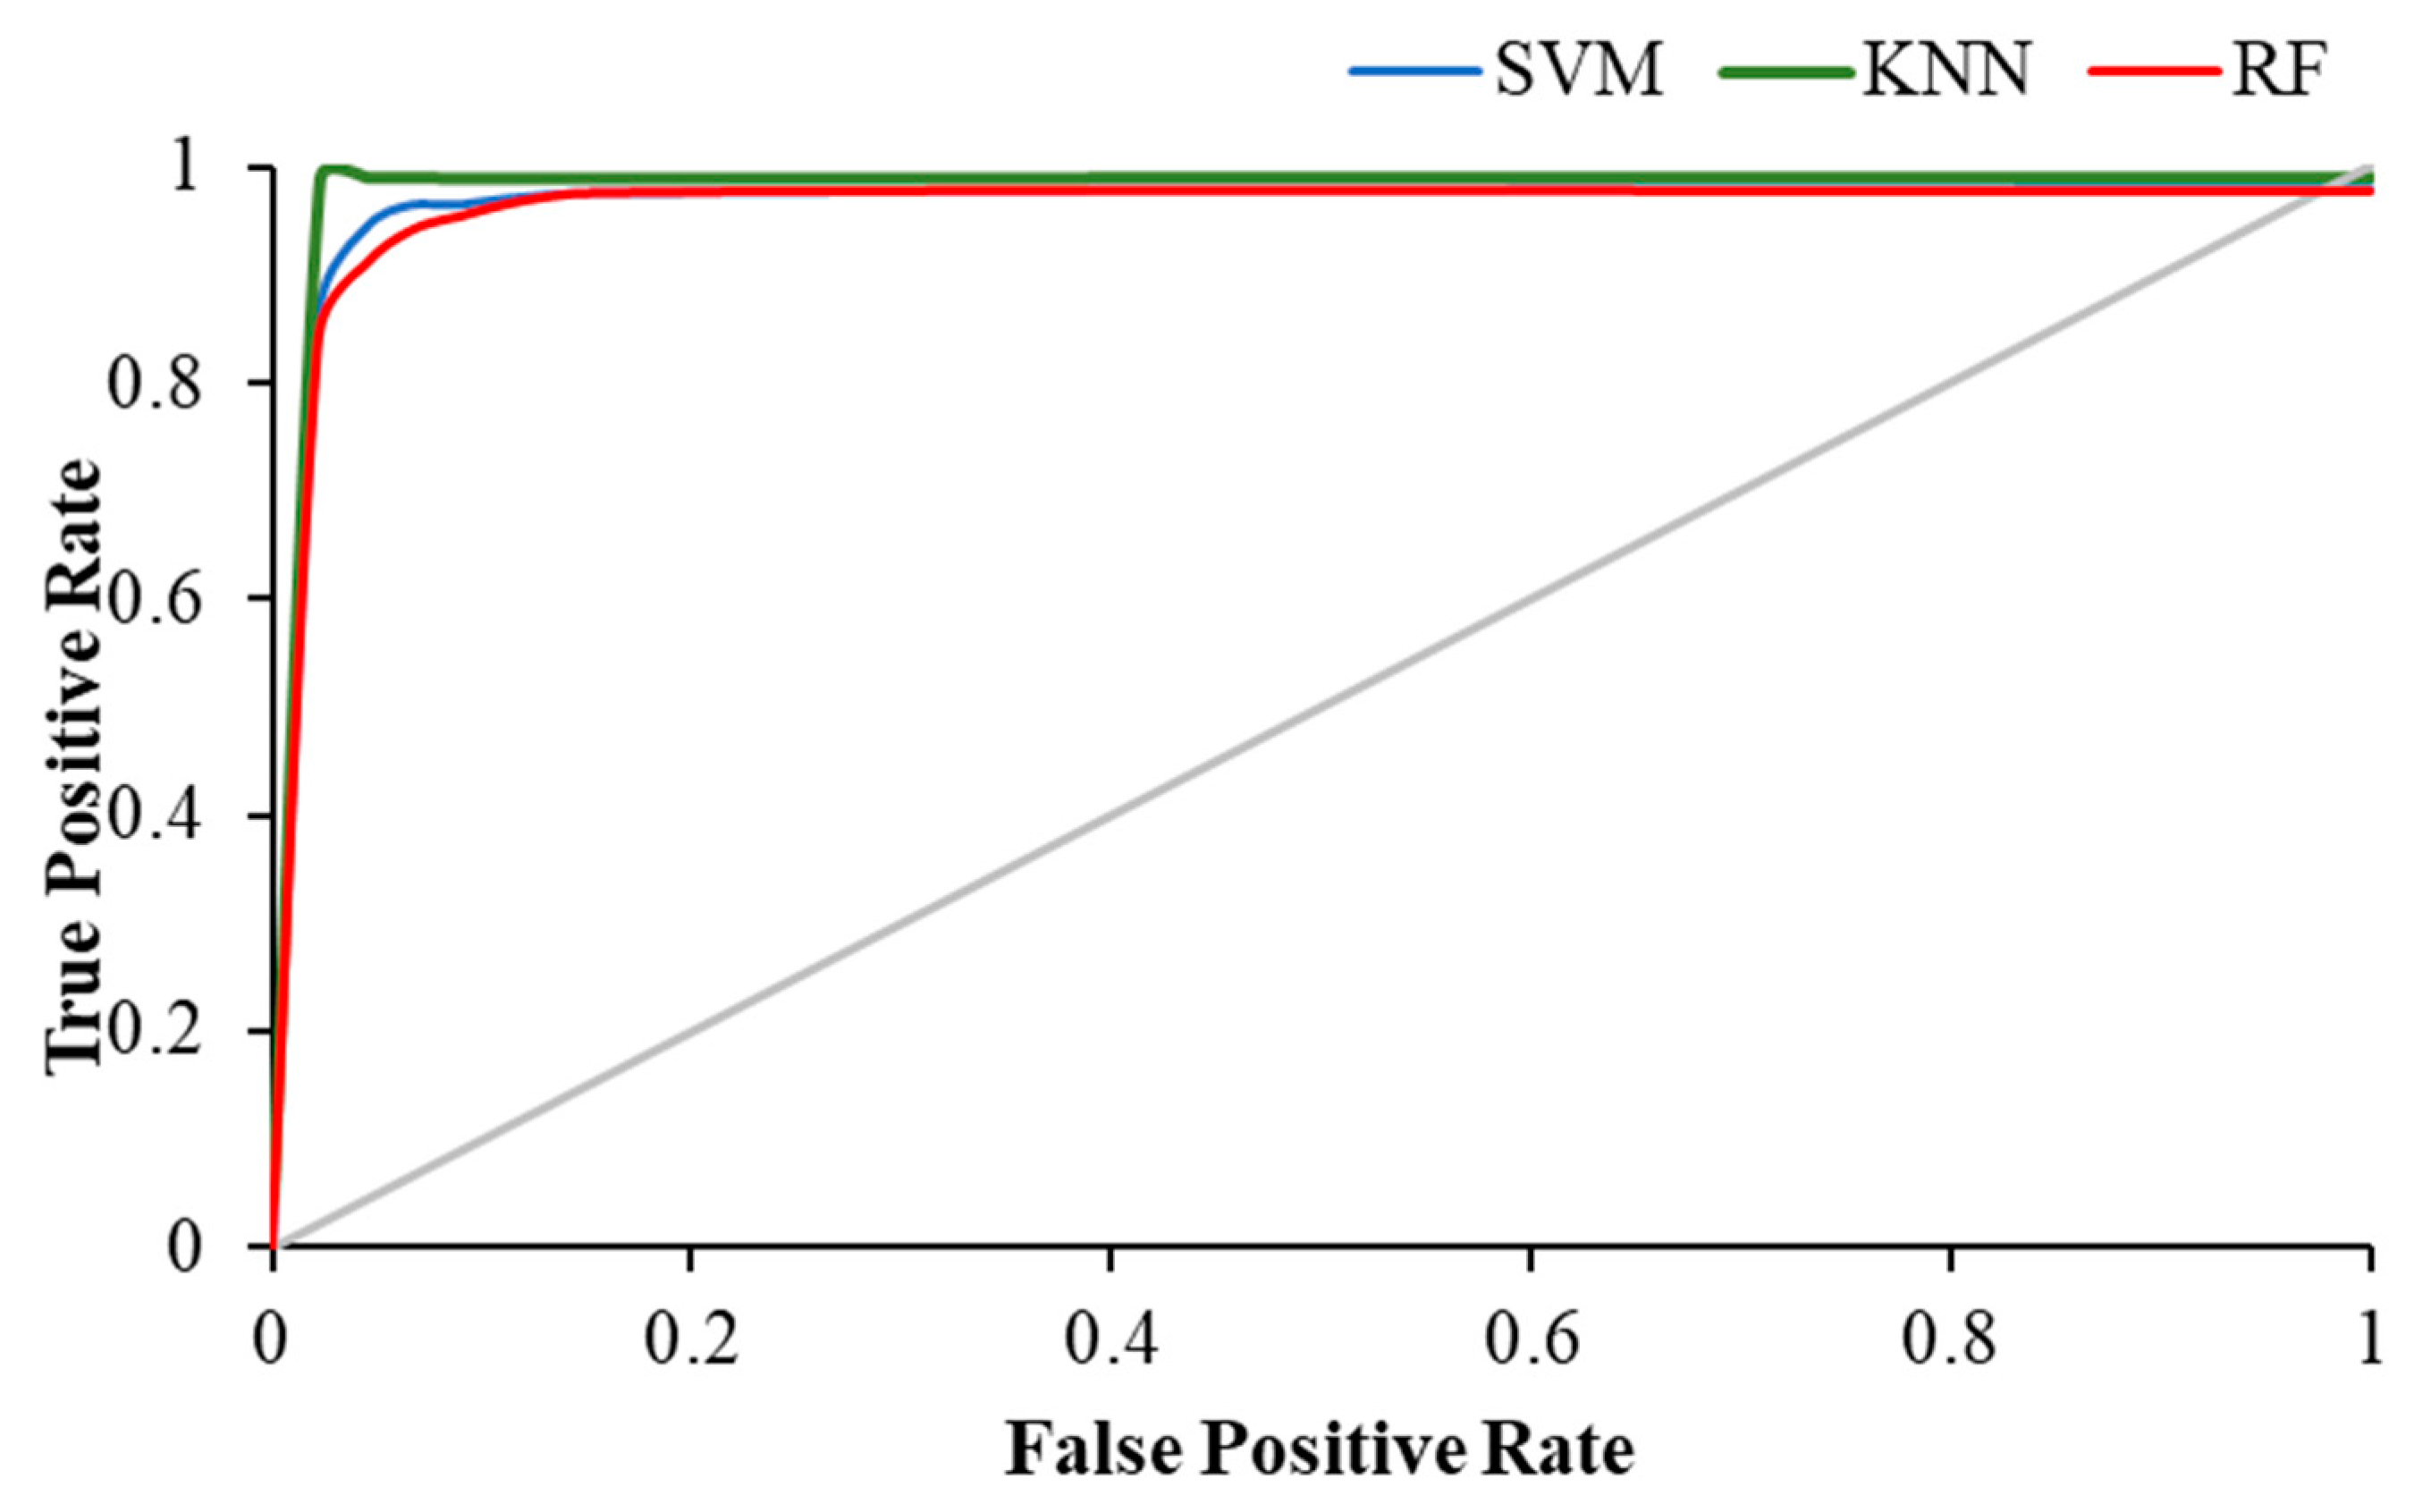
2.6. Classification Algorithms and Performance Measures
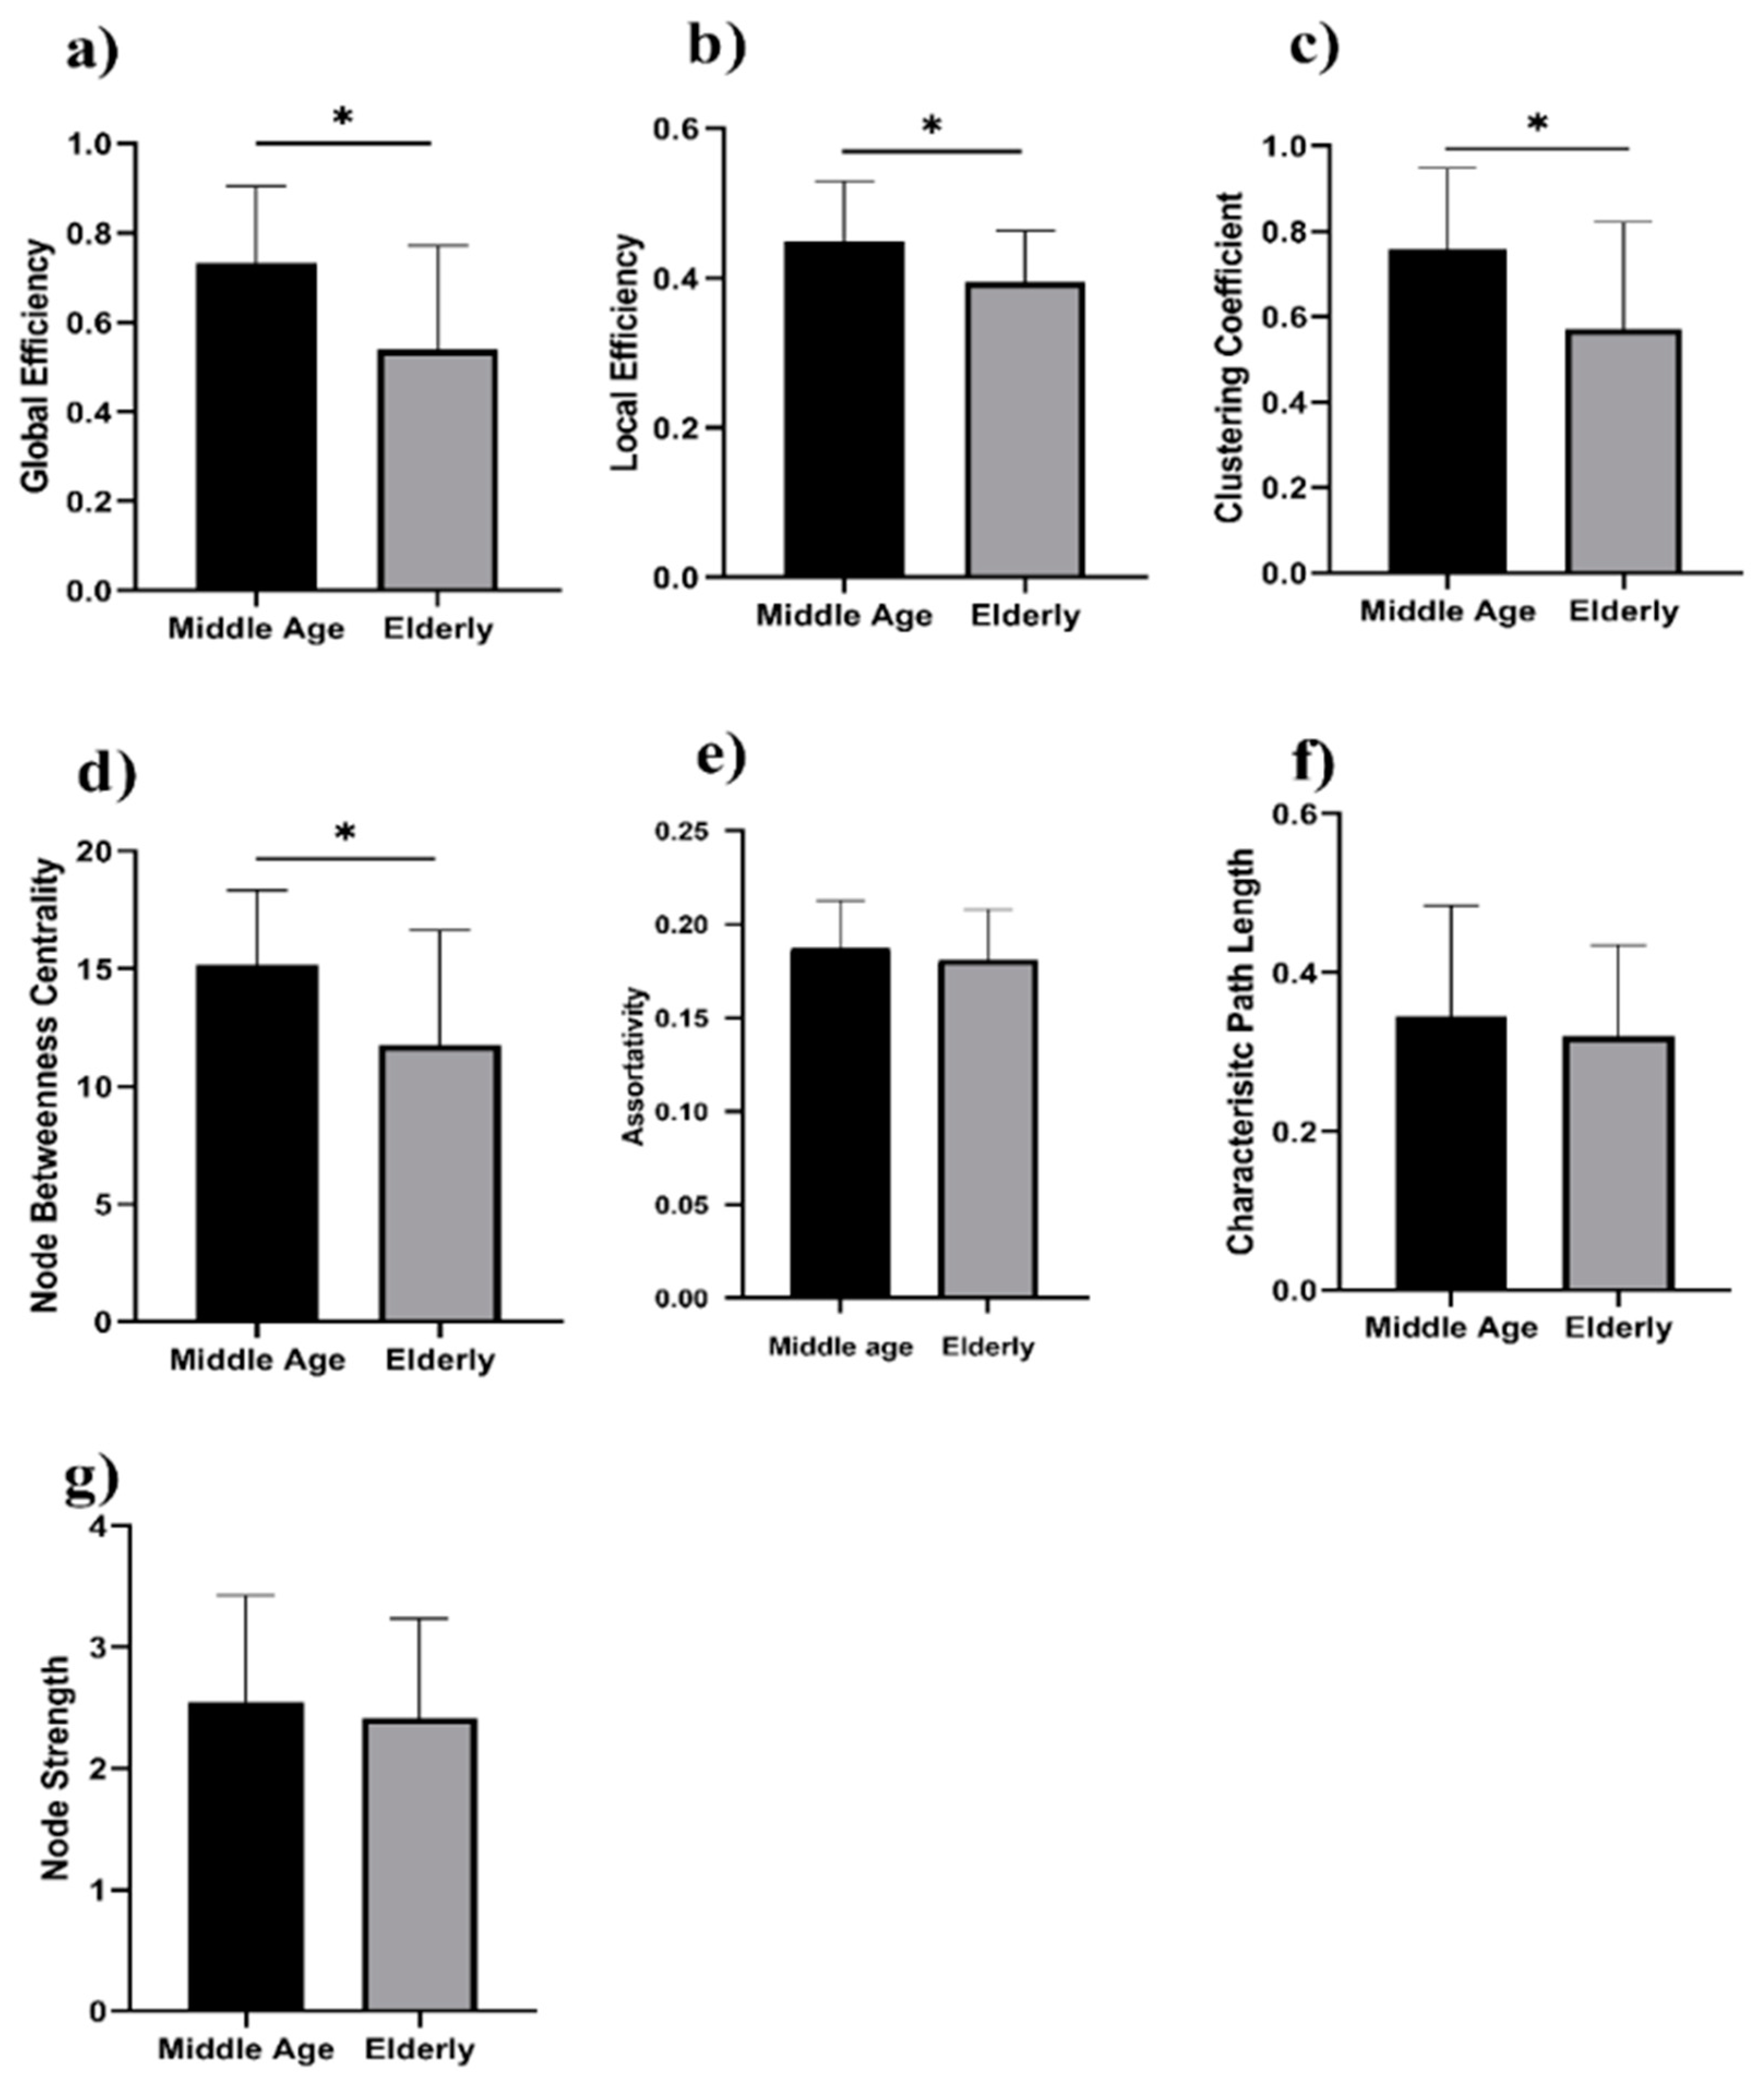
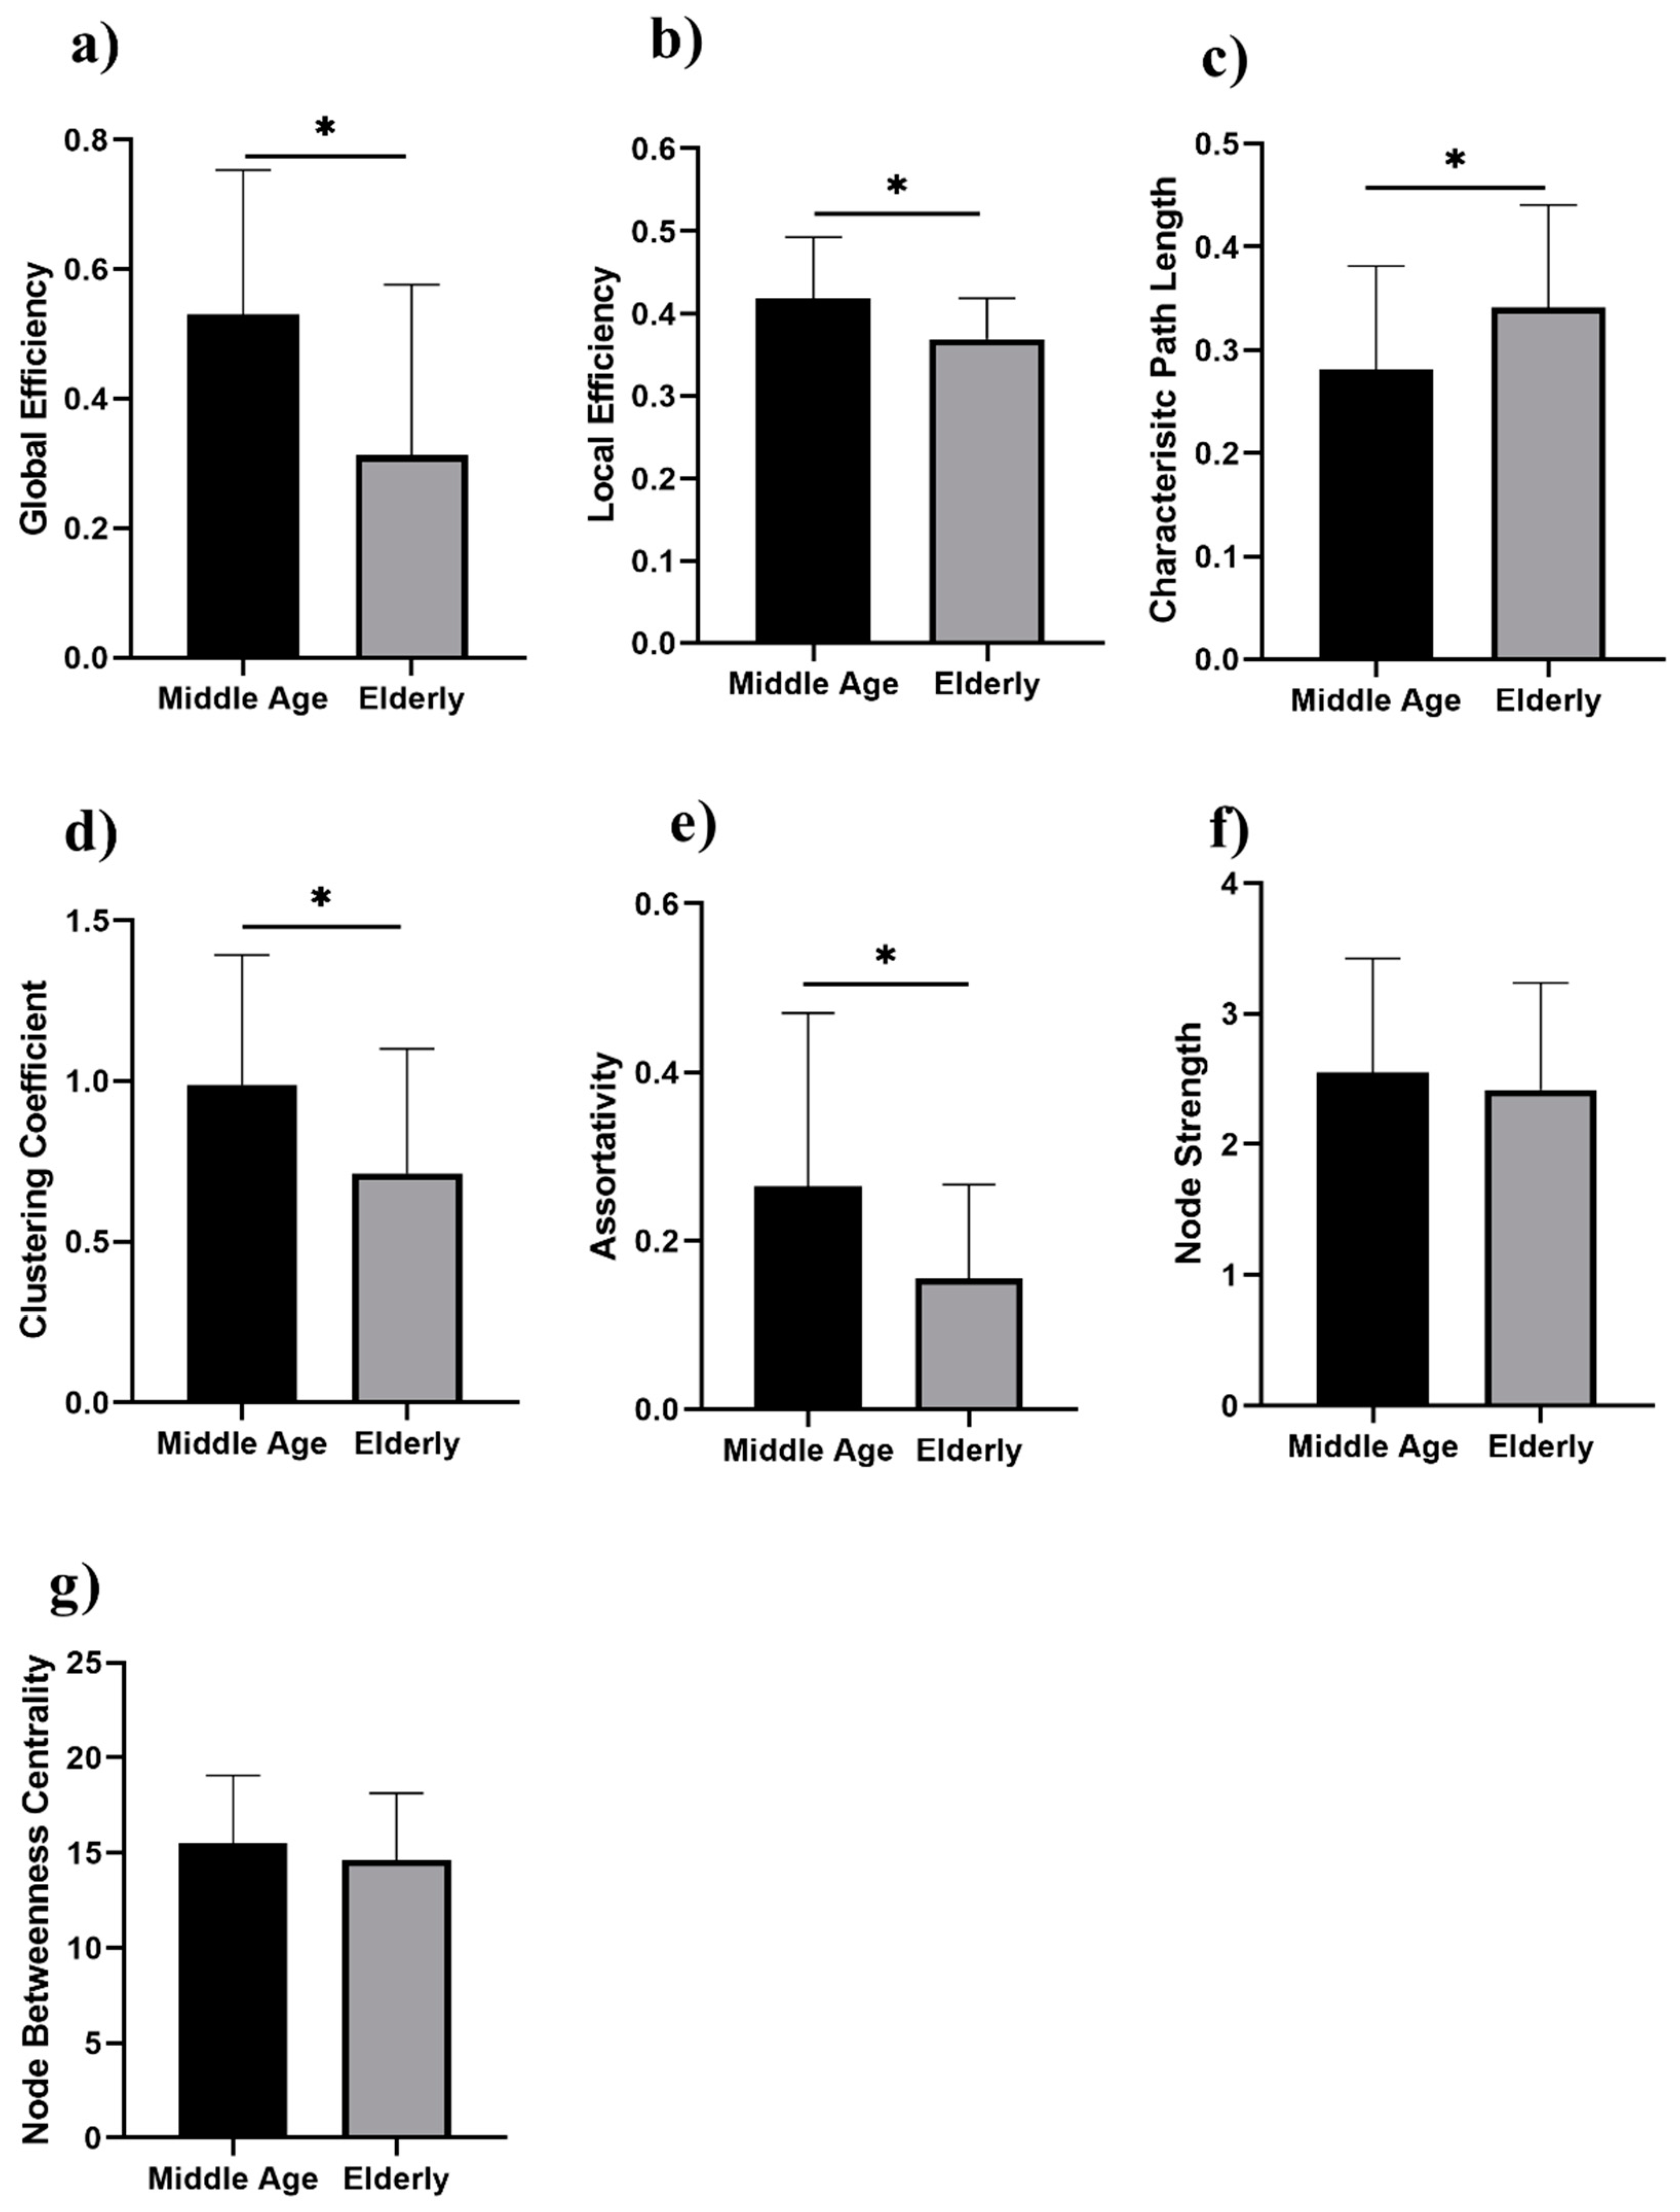
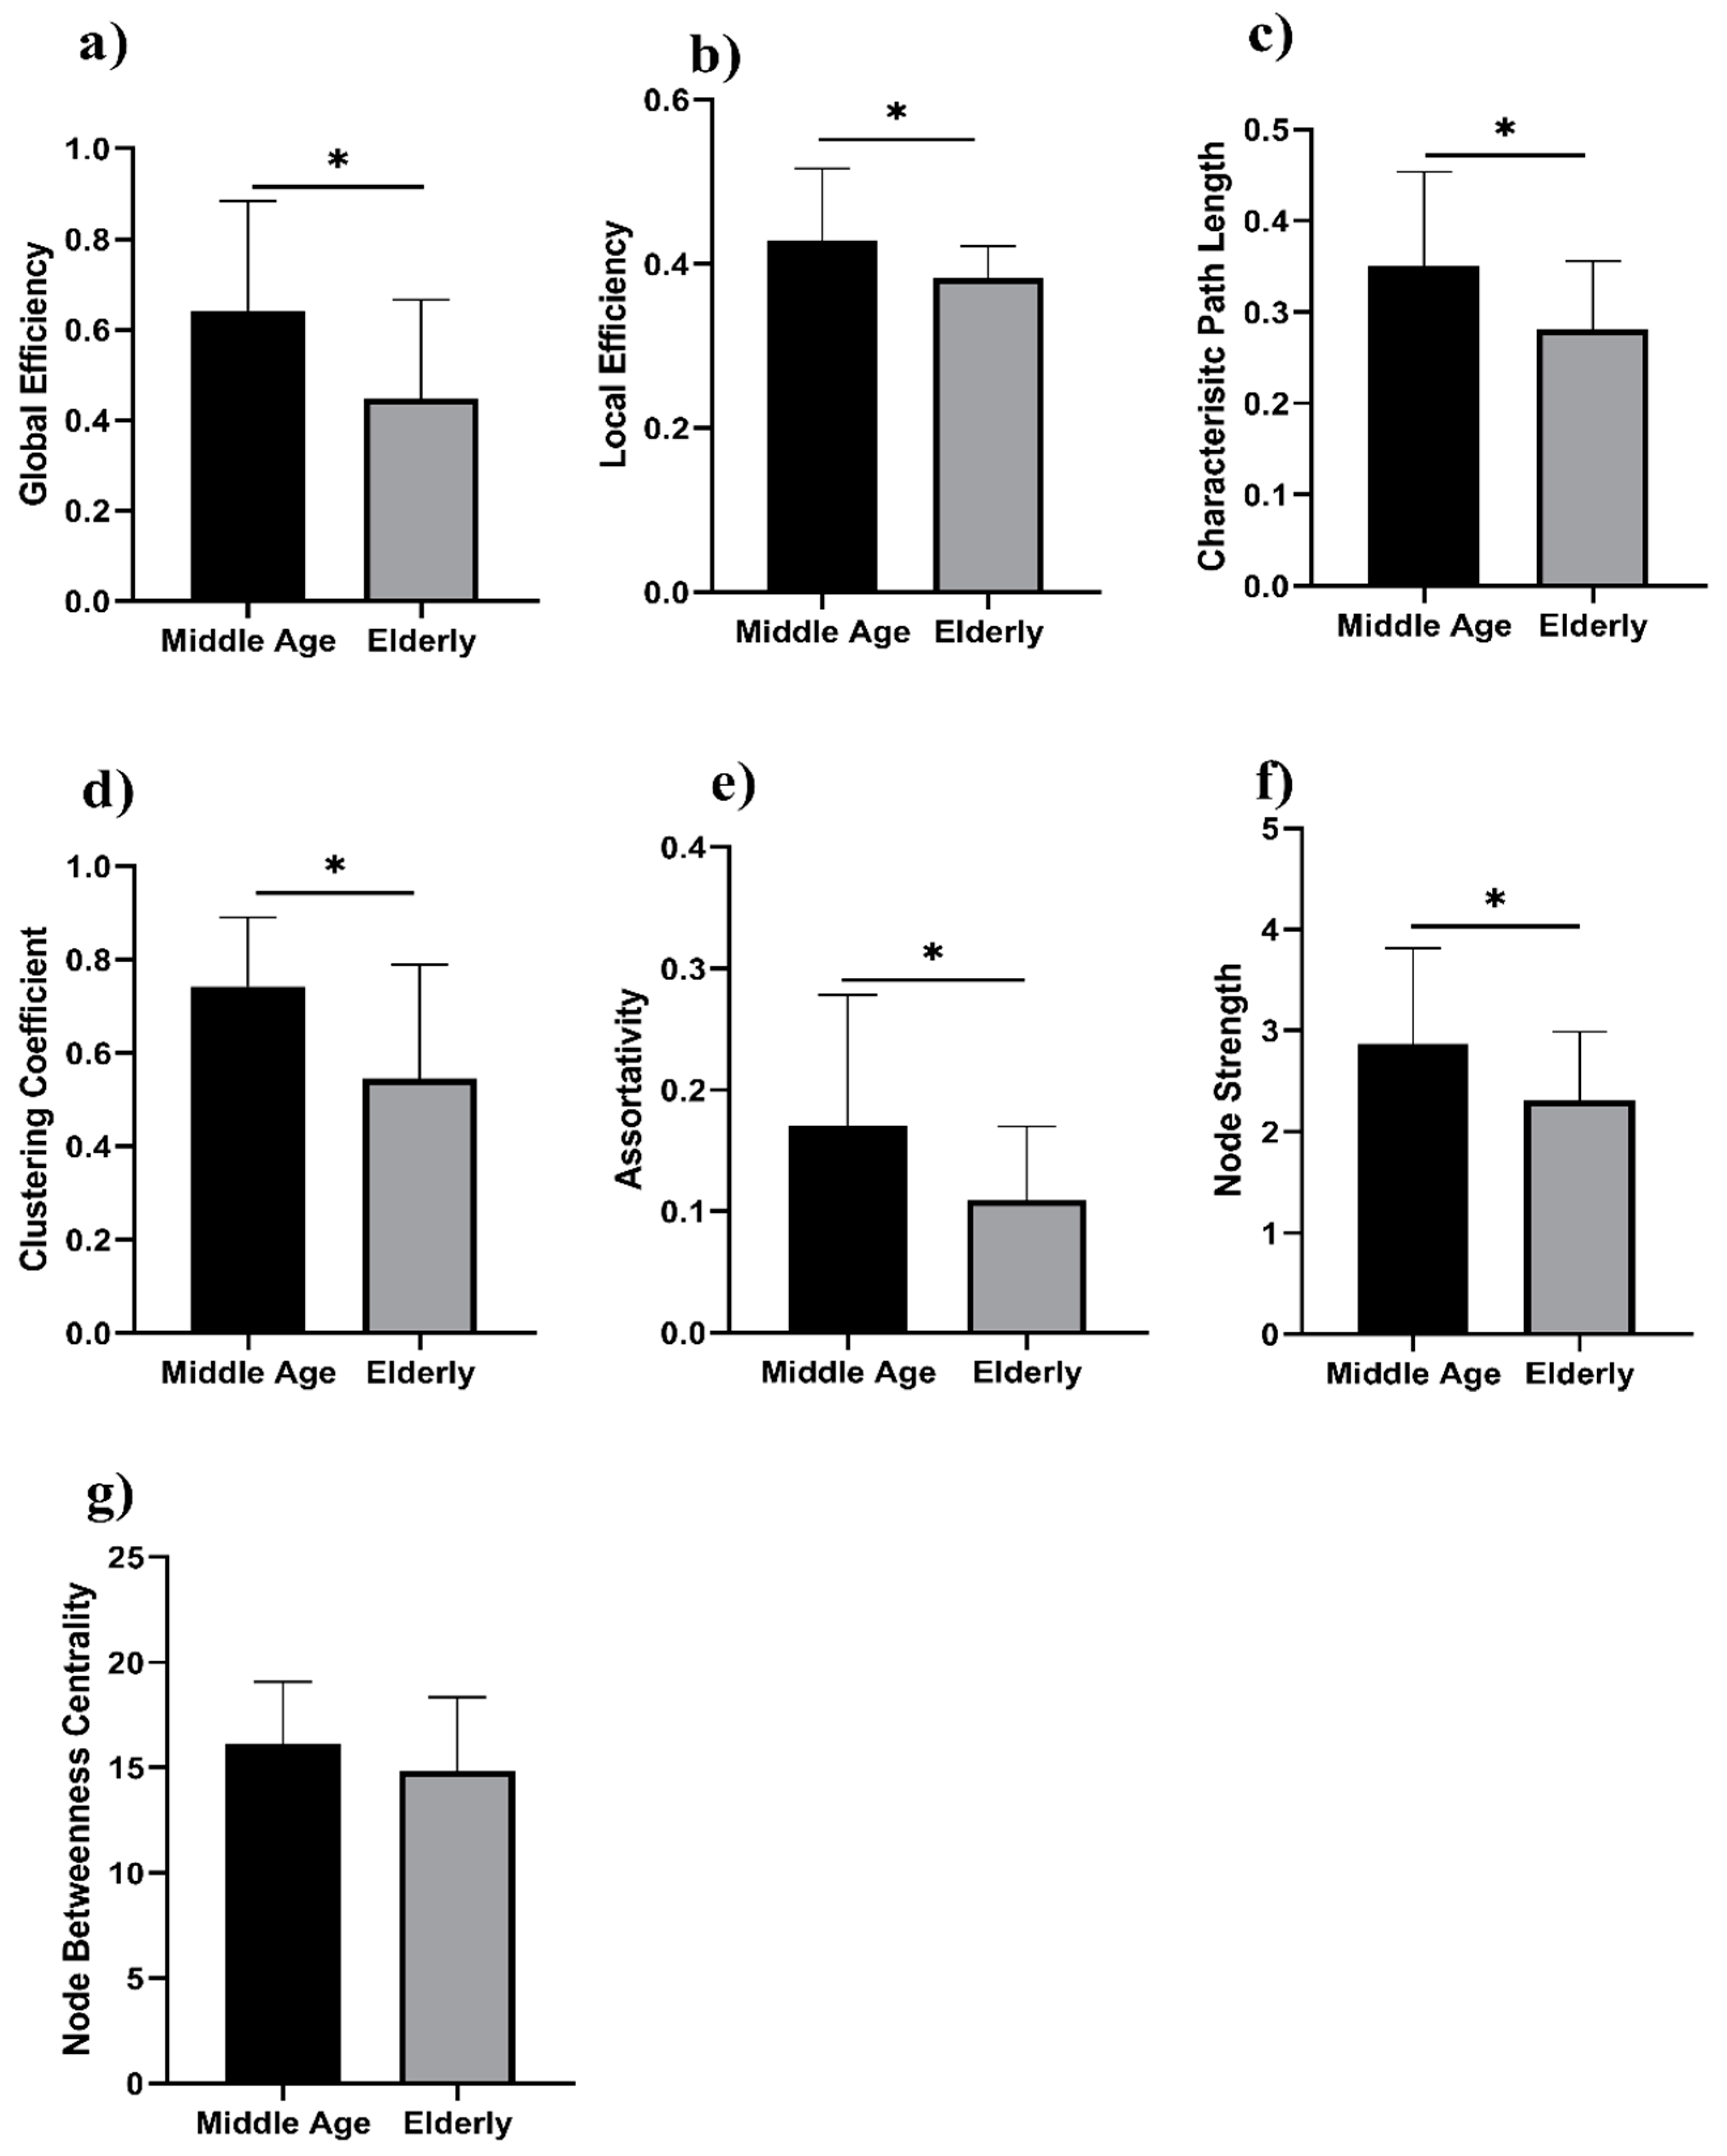
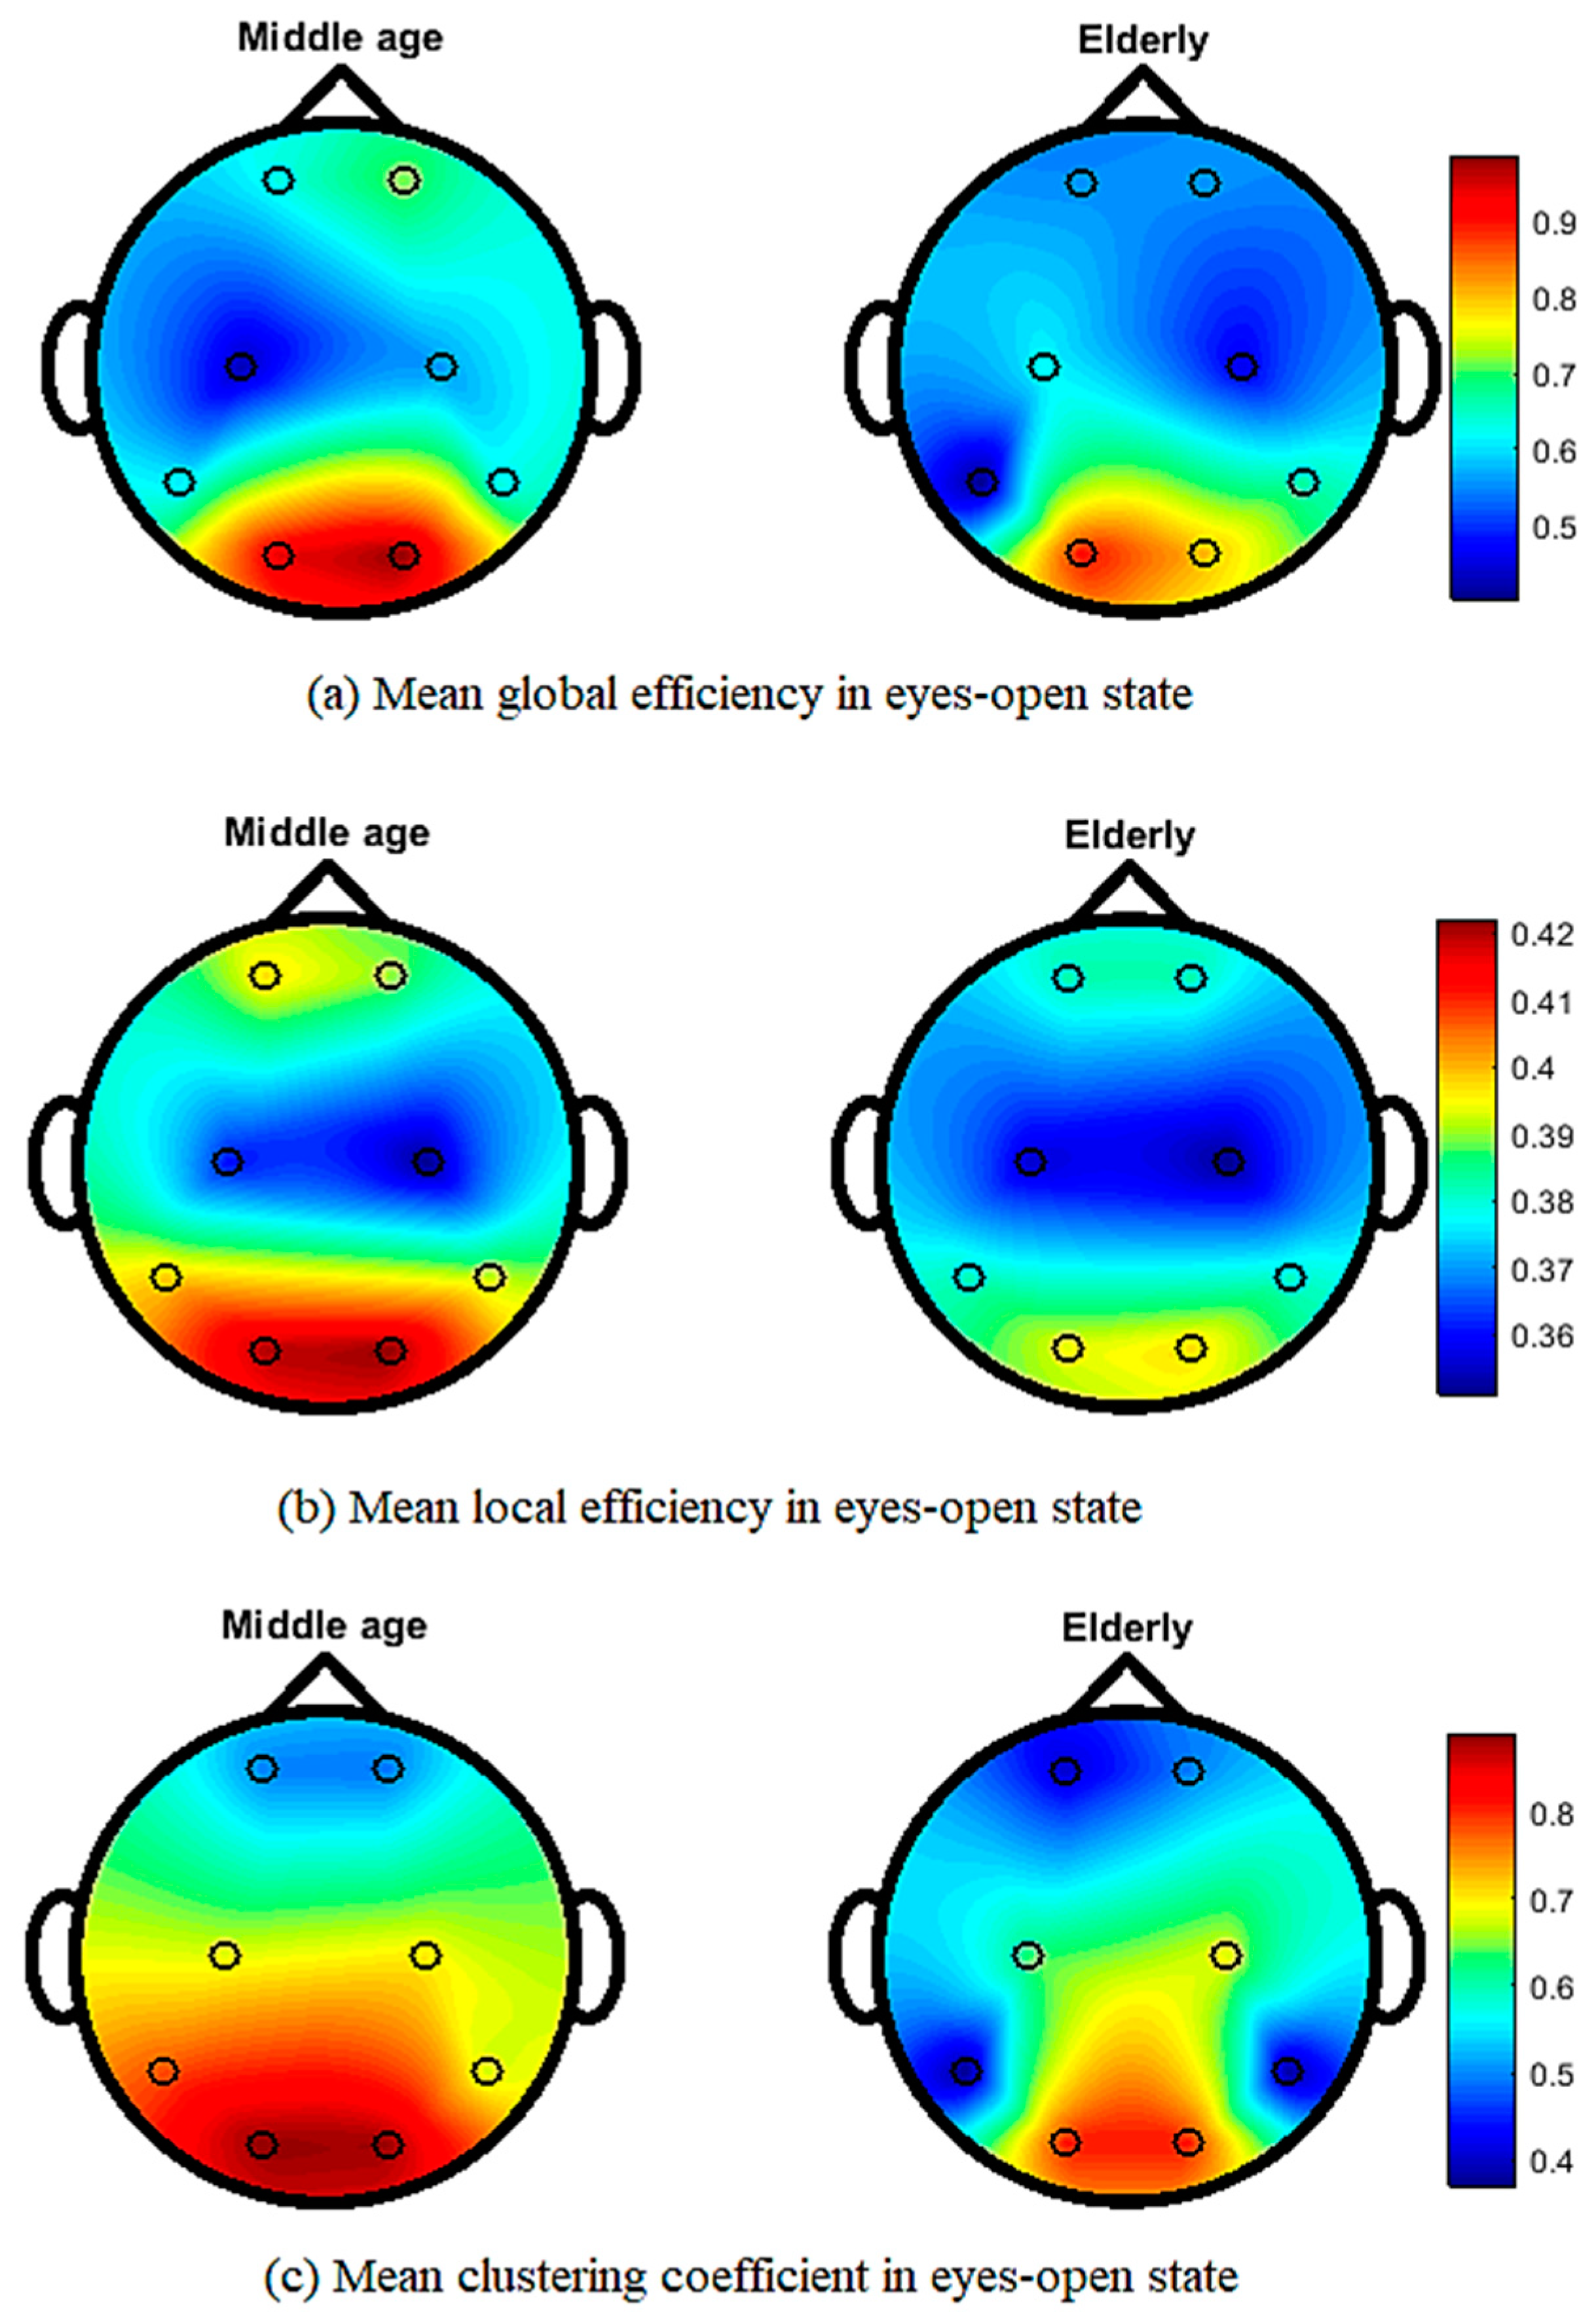
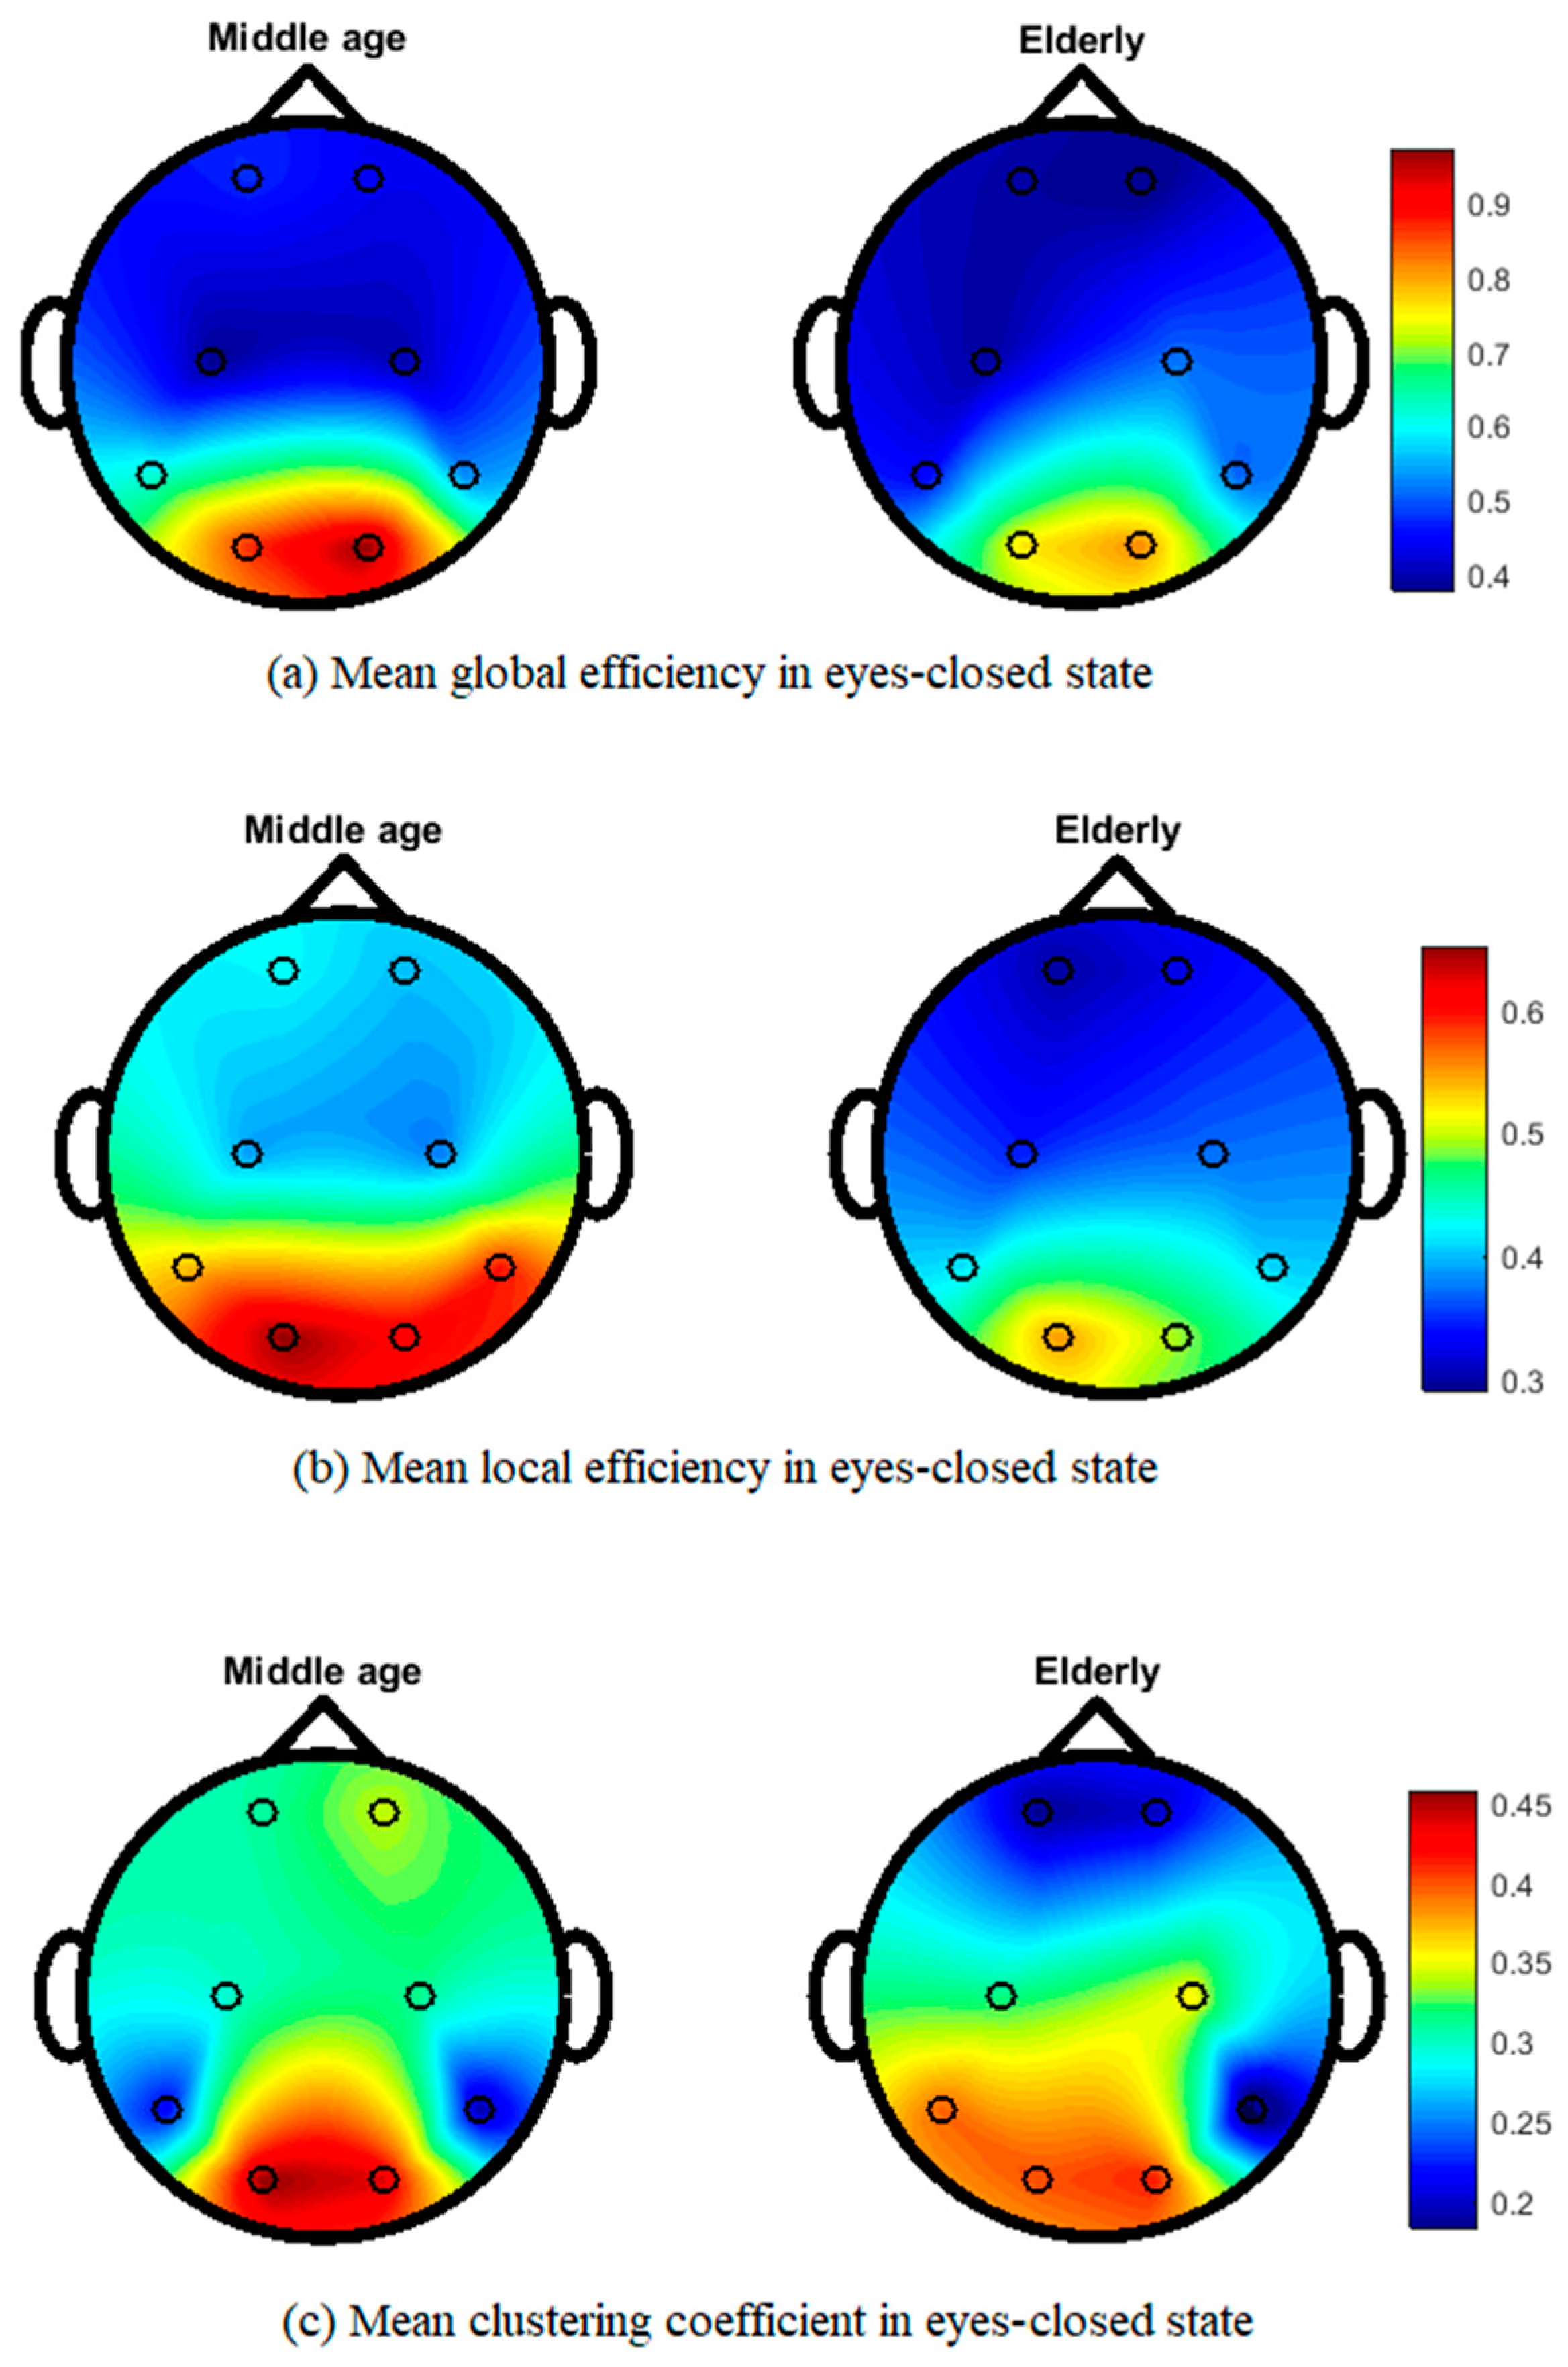
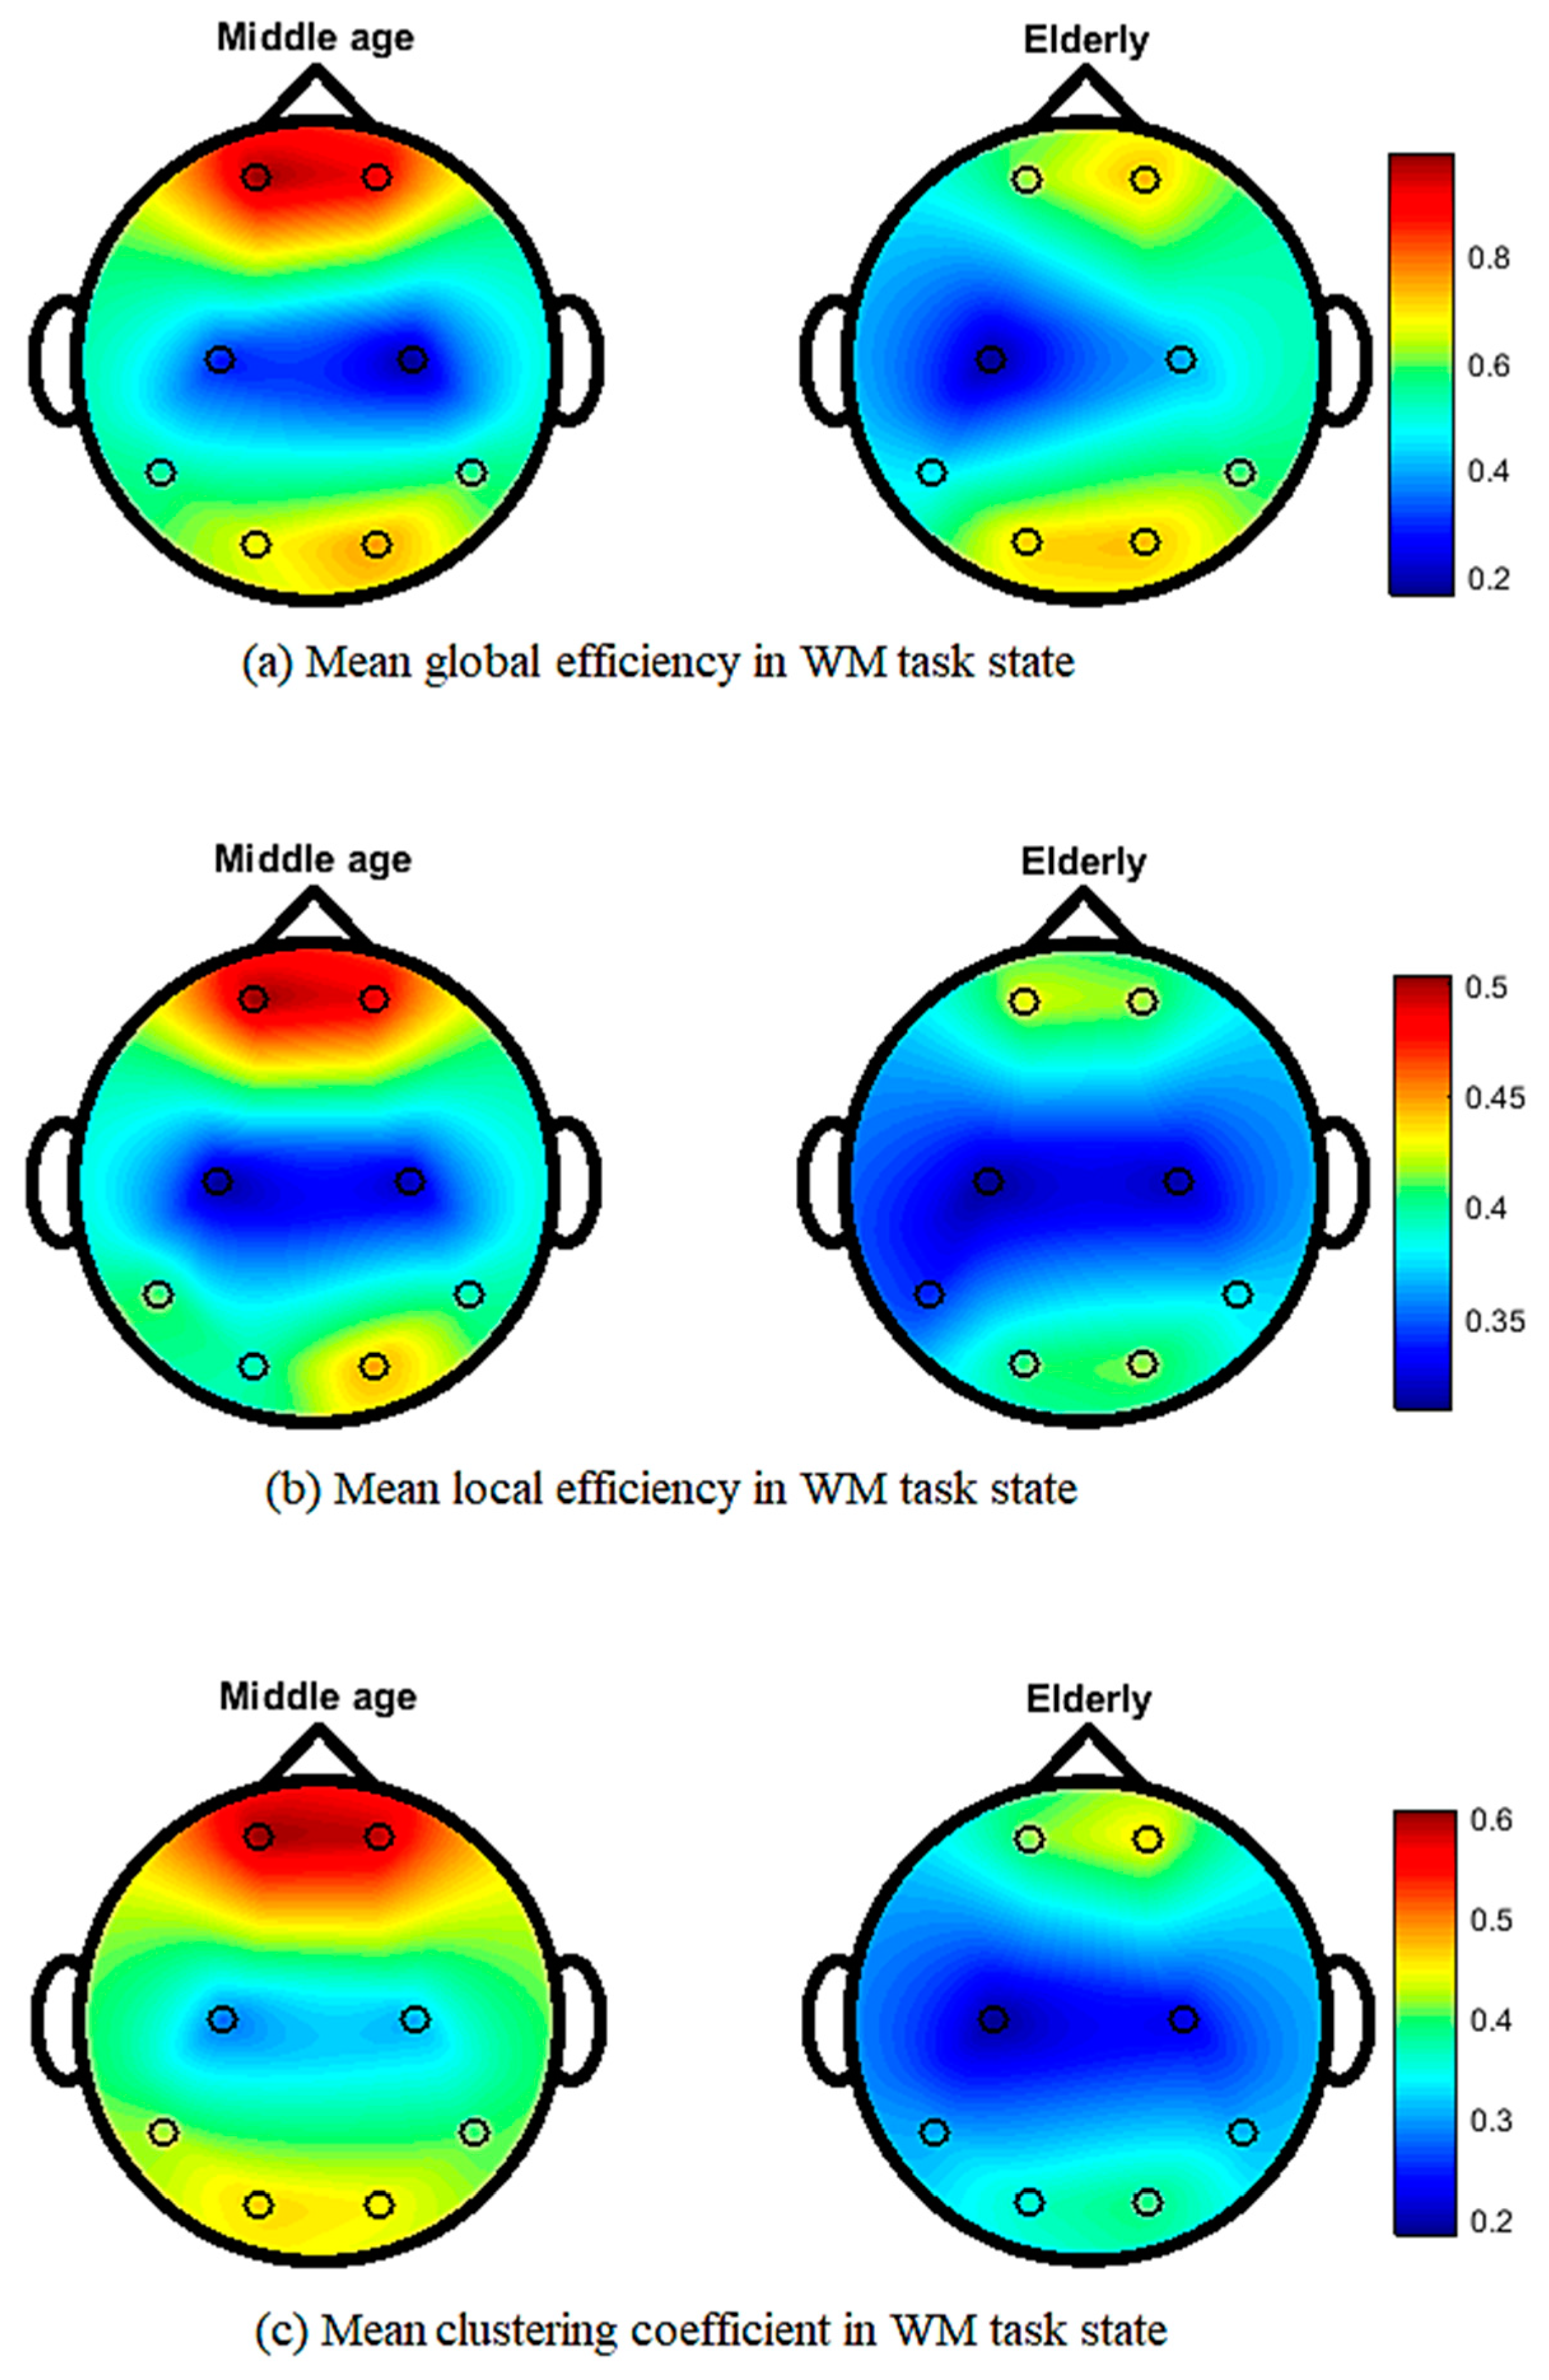
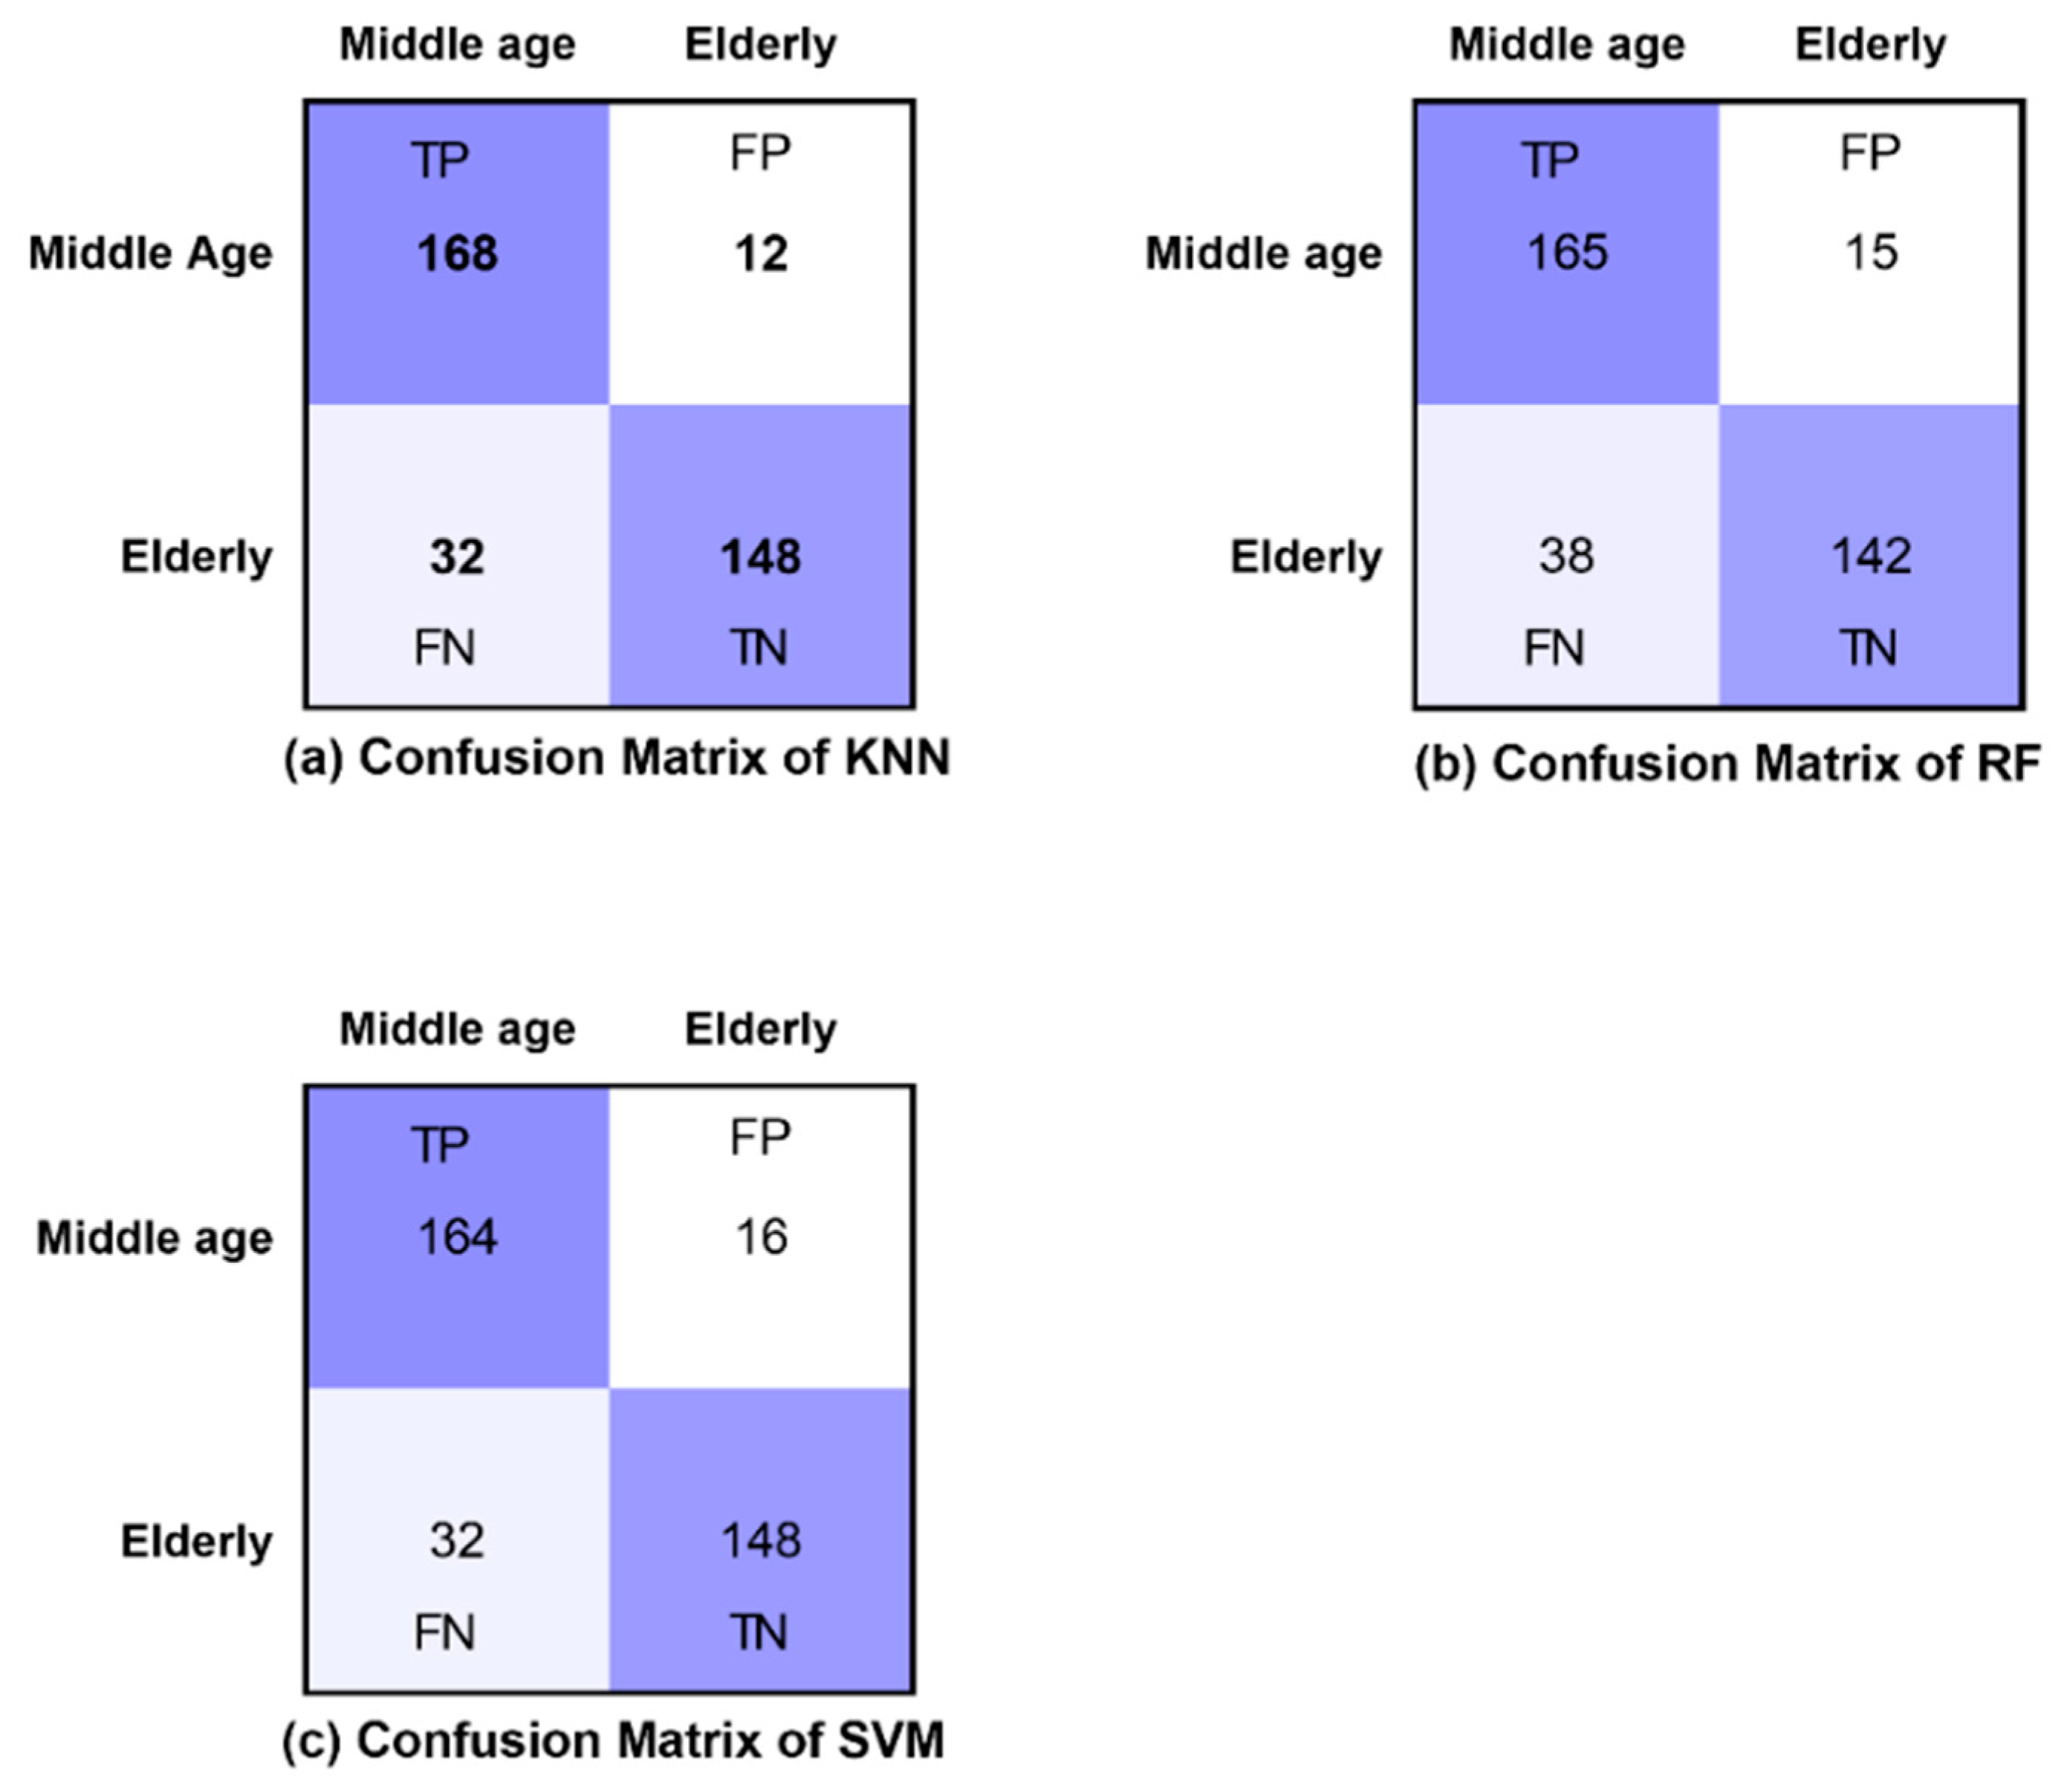
3. Results
4. Discussion
5. Conclusions
Author Contributions
Funding
Institutional Review Board Statement
Informed Consent Statement
Acknowledgments
Conflicts of Interest
References
- Bullmore, E.; Sporns, O. Complex brain networks: Graph theoretical analysis of structural and functional systems. Nat. Rev. Neurosci. 2009, 10, 186–198. [Google Scholar] [CrossRef] [PubMed]
- Van den Heuvel, M.I.; Turk, E.; Manning, J.H.; Hect, J.; Hernandez-Andrade, E.; Hassan, S.S.; Romero, R.; van den Heuvel, M.P.; Thomason, M.E. Hubs in the human fetal brain network. Dev. Cogn. Neurosci. 2018, 30, 108–115. [Google Scholar] [CrossRef] [PubMed]
- Micheloyannis, S.; Vourkas, M.; Tsirka, V.; Karakonstantaki, E.; Kanatsouli, K.; Stam, C.J. The influence of ageing on complex brain networks: A graph theoretical analysis. Hum. Brain Mapp. 2009, 30, 200–208. [Google Scholar] [CrossRef] [PubMed]
- Smit, D.J.A.; Boersma, M.; Schnack, H.G.; Micheloyannis, S.; Boomsma, D.I.; Hulshoff Pol, H.E.; Stam, C.J.; de Geus, E.J.C. The brain matures with stronger functional connectivity and decreased randomness of its network. PLoS ONE 2012, 7, e36896. [Google Scholar] [CrossRef] [PubMed]
- Gaál, Z.A.; Boha, R.; Stam, C.J.; Molnár, M. Age-dependent features of EEG-reactivity—Spectral, complexity, and network characteristics. Neurosci. Lett. 2010, 479, 79–84. [Google Scholar] [CrossRef]
- Petti, M.; Toppi, J.; Babiloni, F.; Cincotti, F.; Mattia, D.; Astolfi, L. EEG resting-state brain topological reorganization as a function of age. Comput. Intell. Neurosci. 2016, 2016, 1–10. [Google Scholar] [CrossRef]
- Rubinov, M.; Sporns, O. Complex network measures of brain connectivity: Uses and interpretations. Neuroimage 2010, 52, 1059–1069. [Google Scholar] [CrossRef]
- Betzel, R.F.; Fukushima, M.; He, Y.; Zuo, X.-N.; Sporns, O. Dynamic fluctuations coincide with periods of high and low modularity in resting-state functional brain networks. Neuroimage 2016, 127, 287–297. [Google Scholar] [CrossRef]
- Zalesky, A.; Fornito, A.; Cocchi, L.; Gollo, L.L.; Breakspear, M. Time-resolved resting-state brain networks. Proc. Natl. Acad. Sci. USA 2014, 111, 10341–10346. [Google Scholar] [CrossRef]
- Calhoun, V.D.; Miller, R.; Pearlson, G.; Adalı, T. The chronnectome: Time-varying connectivity networks as the next frontier in fMRI data discovery. Neuron 2014, 84, 262–274. [Google Scholar] [CrossRef]
- Duffy, F.H.; Albert, M.S.; McAnulty, G.; Garvey, A.J. Age-related differences in brain electrical activity of healthy subjects. Ann. Neurol. 1984, 16, 430–438. [Google Scholar] [CrossRef] [PubMed]
- Van der Hiele, K.; Bollen, E.L.E.M.; Vein, A.A.; Reijntjes, R.H.A.M.; Westendorp, R.G.J.; van Buchem, M.A.; Middelkoop, H.A.M.; van Dijk, J.G. EEG markers of future cognitive performance in the elderly. J. Clin. Neurophysiol. 2008, 25, 83–89. [Google Scholar] [CrossRef] [PubMed]
- Bassett, D.S.; Wymbs, N.F.; Porter, M.A.; Mucha, P.J.; Carlson, J.M.; Grafton, S.T. Dynamic reconfiguration of human brain networks during learning. Proc. Natl. Acad. Sci. USA 2011, 108, 7641–7646. [Google Scholar] [CrossRef] [PubMed]
- Davison, E.N.; Schlesinger, K.J.; Bassett, D.S.; Lynall, M.-E.; Miller, M.B.; Grafton, S.T.; Carlson, J.M. Brain network adaptability across task states. PLoS Comput. Biol. 2015, 11, e1004029. [Google Scholar] [CrossRef] [PubMed]
- Chen, Y.; Zhao, X.; Zhang, X.; Liu, Y.; Zhou, P.; Ni, H.; Ma, J.; Ming, D. Age-related early/late variations of functional connectivity across the human lifespan. Neuroradiology 2018, 60, 403–412. [Google Scholar] [CrossRef] [PubMed]
- Tian, L.; Li, Q.; Wang, C.; Yu, J. Changes in dynamic functional connections with aging. Neuroimage 2018, 172, 31–39. [Google Scholar] [CrossRef]
- Zhang, J.; Cheng, W.; Liu, Z.; Zhang, K.; Lei, X.; Yao, Y.; Becker, B.; Liu, Y.; Kendrick, K.M.; Lu, G. Neural, electrophysiological and anatomical basis of brain-network variability and its characteristic changes in mental disorders. Brain 2016, 139, 2307–2321. [Google Scholar] [CrossRef]
- Knyazev, G.G.; Volf, N.V.; Belousova, L.V. Age-related differences in electroencephalogram connectivity and network topology. Neurobiol. Aging 2015, 36, 1849–1859. [Google Scholar] [CrossRef]
- Roux, F.; Uhlhaas, P.J. Working memory and neural oscillations: Alpha-gamma versus theta-gamma codes for distinct WM information? Trends Cogn. Sci. 2014, 18, 16–25. [Google Scholar] [CrossRef]
- Bopp, K.L.; Verhaeghen, P. Working memory and aging: Separating the effects of content and context. Psychol. Aging 2009, 24, 968. [Google Scholar] [CrossRef]
- Li, H.-J.; Hou, X.-H.; Liu, H.-H.; Yue, C.-L.; Lu, G.-M.; Zuo, X.-N. Putting age-related task activation into large-scale brain networks: A meta-analysis of 114 fMRI studies on healthy aging. Neurosci. Biobehav. Rev. 2015, 57, 156–174. [Google Scholar] [CrossRef] [PubMed]
- Jacobs, E.G.; Weiss, B.; Makris, N.; Whitfield-Gabrieli, S.; Buka, S.L.; Klibanski, A.; Goldstein, J.M. Reorganization of functional networks in verbal working memory circuitry in early midlife: The impact of sex and menopausal status. Cereb. Cortex 2017, 27, 2857–2870. [Google Scholar] [CrossRef] [PubMed]
- Padgaonkar, N.A.; Zanto, T.P.; Bollinger, J.; Gazzaley, A. Predictive cues and age-related declines in working memory performance. Neurobiol. Aging 2017, 49, 31–39. [Google Scholar] [CrossRef] [PubMed]
- Dong, S.; Reder, L.M.; Yao, Y.; Liu, Y.; Chen, F. Individual differences in working memory capacity are reflected in different ERP and EEG patterns to task difficulty. Brain Res. 2015, 1616, 146–156. [Google Scholar] [CrossRef]
- Rypma, B.; D’Esposito, M. The roles of prefrontal brain regions in components of working memory: Effects of memory load and individual differences. Proc. Natl. Acad. Sci. USA 1999, 96, 6558–6563. [Google Scholar] [CrossRef]
- Marvel, C.L.; Desmond, J.E. Functional topography of the cerebellum in verbal working memory. Neuropsychol. Rev. 2010, 20, 271–279. [Google Scholar] [CrossRef]
- Vergauwe, E.; Hartstra, E.; Barrouillet, P.; Brass, M. Domain-general involvement of the posterior frontolateral cortex in time-based resource-sharing in working memory: An fMRI study. Neuroimage 2015, 115, 104–116. [Google Scholar] [CrossRef][Green Version]
- Toppi, J.; Astolfi, L.; Risetti, M.; Anzolin, A.; Kober, S.E.; Wood, G.; Mattia, D. Different topological properties of EEG-derived networks describe working memory phases as revealed by graph theoretical analysis. Front. Hum. Neurosci. 2018, 11, 637. [Google Scholar] [CrossRef]
- Becker, H.; Fleureau, J.; Guillotel, P.; Wendling, F.; Merlet, I.; Albera, L. Emotion recognition based on high-resolution EEG recordings and reconstructed brain sources. IEEE Trans. Affect. Comput. 2017, 11, 244–257. [Google Scholar] [CrossRef]
- Bansal, D.; Chhikara, R.; Khanna, K.; Gupta, P. Comparative analysis of various machine learning algorithms for detecting dementia. Procedia Comput. Sci. 2018, 132, 1497–1502. [Google Scholar] [CrossRef]
- Hussain, I.; Park, S.-J. Quantitative evaluation of task-induced neurological outcome after stroke. Brain Sci. 2021, 11, 900. [Google Scholar] [CrossRef] [PubMed]
- Jalili, M. Graph theoretical analysis of Alzheimer’s disease: Discrimination of AD patients from healthy subjects. Inf. Sci. 2017, 384, 145–156. [Google Scholar] [CrossRef]
- Yu, H.; Zhu, L.; Cai, L.; Wang, J.; Liu, J.; Wang, R.; Zhang, Z. Identification of Alzheimer’s EEG With a WVG network-based fuzzy learning approach. Front. Neurosci. 2020, 14, 641. [Google Scholar] [CrossRef] [PubMed]
- Pellegrini, E.; Ballerini, L.; Hernandez, M.d.C.V.; Chappell, F.M.; González-Castro, V.; Anblagan, D.; Danso, S.; Muñoz-Maniega, S.; Job, D.; Pernet, C.; et al. Machine learning of neuroimaging for assisted diagnosis of cognitive impairment and dementia: A systematic review. Alzheimer’s Dement. Diagn. Assess. Dis. Monit. 2018, 10, 519–535. [Google Scholar] [CrossRef] [PubMed]
- Cassani, R.; Falk, T.H.; Fraga, F.J.; Cecchi, M.; Moore, D.K.; Anghinah, R. Towards automated electroencephalography-based Alzheimer’s disease diagnosis using portable low-density devices. Biomed. Signal Process. Control 2017, 33, 261–271. [Google Scholar] [CrossRef]
- Hussain, I.; Young, S.; Park, S.-J. Driving-induced neurological biomarkers in an advanced driver-assistance system. Sensors 2021, 21, 6985. [Google Scholar] [CrossRef]
- Hussain, I.; Park, S.J. HealthSOS: Real-time health monitoring system for stroke prognostics. IEEE Access 2020, 8, 213574–213586. [Google Scholar] [CrossRef]
- Wang, X.; Gong, G.; Li, N.; Qiu, S. Detection analysis of epileptic EEG using a novel random forest model combined with grid search optimization. Front. Hum. Neurosci. 2019, 13, 52. [Google Scholar] [CrossRef]
- Ota, M.; Koshibe, Y.; Higashi, S.; Nemoto, K.; Tsukada, E.; Tamura, M.; Takahashi, T.; Arai, T. Structural brain network correlated with reading impairment in Alzheimer’s disease. Dement. Geriatr. Cogn. Disord. 2020, 49, 264–269. [Google Scholar] [CrossRef]
- Vecchio, F.; Miraglia, F.; Quaranta, D.; Granata, G.; Romanello, R.; Marra, C.; Bramanti, P.; Rossini, P.M. Cortical connectivity and memory performance in cognitive decline: A study via graph theory from EEG data. Neuroscience 2016, 316, 143–150. [Google Scholar] [CrossRef]
- Peláez Suárez, A.A.; Berrillo Batista, S.; Pedroso Ibáñez, I.; Casabona Fernández, E.; Fuentes Campos, M.; Chacón, L.M. EEG-derived functional connectivity patterns associated with mild cognitive impairment in Parkinson’s disease. Behav. Sci. 2021, 11, 40. [Google Scholar] [CrossRef] [PubMed]
- Vecchio, F.; Miraglia, F.; Bramanti, P.; Rossini, P.M. Human brain networks in physiological aging: A graph theoretical analysis of cortical connectivity from EEG data. J. Alzheimer’s Dis. 2014, 41, 1239–1249. [Google Scholar] [CrossRef] [PubMed]
- Hou, F.; Liu, C.; Yu, Z.; Xu, X.; Zhang, J.; Peng, C.-K.; Wu, C.; Yang, A. Age-related alterations in electroencephalography connectivity and network topology during n-back working memory task. Front. Hum. Neurosci. 2018, 12, 484. [Google Scholar] [CrossRef] [PubMed]
- Stam, C.J. Brain dynamics in theta and alpha frequency bands and working memory performance in humans. Neurosci. Lett. 2000, 286, 115–118. [Google Scholar] [CrossRef]
- Autthasan, P.; Du, X.; Arnin, J.; Lamyai, S.; Perera, M.; Itthipuripat, S.; Yagi, T.; Manoonpong, P.; Wilaiprasitporn, T. A single-channel consumer-grade EEG device for brain–computer interface: Enhancing detection of SSVEP and its amplitude modulation. IEEE Sens. J. 2019, 20, 3366–3378. [Google Scholar] [CrossRef]
- Samson, V.R.R.; Praveen Kitti, B.; Pradeep Kumar, S.; Suresh Babu, D.; Monica, C. Electroencephalogram-based OpenBCI devices for disabled people. In Proceedings of 2nd International Conference on Micro-Electronics, Electromagnetics and Telecommunications; Springer: Berlin/Heidelberg, Germany, 2018; pp. 229–238. [Google Scholar]
- Qiu, J.M.; Casey, M.A.; Diamond, S.G. Assessing feedback response with a wearable electroencephalography system. Front. Hum. Neurosci. 2019, 13, 258. [Google Scholar] [CrossRef]
- Hinrichs, H.; Scholz, M.; Baum, A.K.; Kam, J.W.Y.; Knight, R.T.; Heinze, H.-J. Comparison between a wireless dry electrode EEG system with a conventional wired wet electrode EEG system for clinical applications. Sci. Rep. 2020, 10, 1–14. [Google Scholar] [CrossRef]
- Delorme, A.; Makeig, S. EEGLAB: An open source toolbox for analysis of single-trial EEG dynamics including independent component analysis. J. Neurosci. Methods 2004, 134, 9–21. [Google Scholar] [CrossRef]
- Jalili, M. Functional brain networks: Does the choice of dependency estimator and binarization method matter? Sci. Rep. 2016, 6, 1–12. [Google Scholar] [CrossRef]
- Achard, S.; Bullmore, E. Efficiency and cost of economical brain functional networks. PLoS Comput. Biol. 2007, 3, e17. [Google Scholar] [CrossRef]
- Opsahl, T.; Agneessens, F.; Skvoretz, J. Node centrality in weighted networks: Generalizing degree and shortest paths. Soc. Netw. 2010, 32, 245–251. [Google Scholar] [CrossRef]
- Newman, M.E.J. Assortative mixing in networks. Phys. Rev. Lett. 2002, 89, 208701. [Google Scholar] [CrossRef] [PubMed]
- Martínez-Cagigal, V. Topographic EEG/MEG Plot. Available online: https://www.mathworks.com/matlabcentral/fileexchange/72729-topographic-eeg-meg-plot (accessed on 20 August 2021).
- Qureshi, S.; Karrila, S.; Vanichayobon, S. Human sleep scoring based on K-nearest neighbors. Turk. J. Electr. Eng. Comput. Sci. 2018, 26, 2802–2818. [Google Scholar] [CrossRef]
- Miltiadous, A.; Tzimourta, K.D.; Giannakeas, N.; Tsipouras, M.G.; Afrantou, T.; Ioannidis, P.; Tzallas, A.T. Alzheimer’s disease and frontotemporal dementia: A robust classification method of EEG signals and a comparison of validation methods. Diagnostics 2021, 11, 1437. [Google Scholar] [CrossRef] [PubMed]
- Breiman, L. Bagging predictors. Mach. Learn. 1996, 24, 123–140. [Google Scholar] [CrossRef]
- Stam, C.J.; De Bruin, E.A. Scale-free dynamics of global functional connectivity in the human brain. Hum. Brain Mapp. 2004, 22, 97–109. [Google Scholar] [CrossRef]
- Tan, B.; Kong, X.; Yang, P.; Jin, Z.; Li, L. The difference of brain functional connectivity between eyes-closed and eyes-open using graph theoretical analysis. Comput. Math. Methods Med. 2013, 2013, 1–15. [Google Scholar] [CrossRef]
- Costumero, V.; Bueichekú, E.; Adrián-Ventura, J.; Ávila, C. Opening or closing eyes at rest modulates the functional connectivity of V1 with default and salience networks. Sci. Rep. 2020, 10, 1–10. [Google Scholar] [CrossRef]
- Zhu, W.; Wen, W.; He, Y.; Xia, A.; Anstey, K.J.; Sachdev, P. Changing topological patterns in normal aging using large-scale structural networks. Neurobiol. Aging 2012, 33, 899–913. [Google Scholar] [CrossRef]
- Wu, K.; Taki, Y.; Sato, K.; Qi, H.; Kawashima, R.; Fukuda, H. A longitudinal study of structural brain network changes with normal aging. Front. Hum. Neurosci. 2013, 7, 113. [Google Scholar] [CrossRef]
- Iordan, A.D.; Moored, K.D.; Katz, B.; Cooke, K.A.; Buschkuehl, M.; Jaeggi, S.M.; Polk, T.A.; Peltier, S.J.; Jonides, J.; Reuter-Lorenz, P.A. Age differences in functional network reconfiguration with working memory training. Hum. Brain Mapp. 2021, 42, 1888–1909. [Google Scholar] [CrossRef] [PubMed]
- Chong, J.S.X.; Ng, K.K.; Tandi, J.; Wang, C.; Poh, J.-H.; Lo, J.C.; Chee, M.W.L.; Zhou, J.H. Longitudinal changes in the cerebral cortex functional organization of healthy elderly. J. Neurosci. 2019, 39, 5534–5550. [Google Scholar] [CrossRef] [PubMed]
- La Corte, V.; Sperduti, M.; Malherbe, C.; Vialatte, F.; Lion, S.; Gallarda, T.; Oppenheim, C.; Piolino, P. Cognitive decline and reorganization of functional connectivity in healthy aging: The pivotal role of the salience network in the prediction of age and cognitive performances. Front. Aging Neurosci. 2016, 8, 204. [Google Scholar] [CrossRef] [PubMed]
- Fjell, A.M.; Walhovd, K.B. Structural brain changes in aging: Courses, causes and cognitive consequences. Rev. Neurosci. 2010, 21, 187–222. [Google Scholar] [CrossRef] [PubMed]
- Wang, L.; Wang, W.; Yan, T.; Song, J.; Yang, W.; Wang, B.; Go, R.; Huang, Q.; Wu, J. Beta-band functional connectivity influences audiovisual integration in older age: An EEG study. Front. Aging Neurosci. 2017, 9, 239. [Google Scholar] [CrossRef]
- Cai, L.; Wei, X.; Wang, J.; Yu, H.; Deng, B.; Wang, R. Reconstruction of functional brain network in Alzheimer’s disease via cross-frequency phase synchronization. Neurocomputing 2018, 314, 490–500. [Google Scholar] [CrossRef]
- Wang, J.; Yang, C.; Wang, R.; Yu, H.; Cao, Y.; Liu, J. Functional brain networks in Alzheimer’s disease: EEG analysis based on limited penetrable visibility graph and phase space method. Phys. A Stat. Mech. Its Appl. 2016, 460, 174–187. [Google Scholar] [CrossRef]
- Vecchio, F.; Miraglia, F.; Maria Rossini, P. Connectome: Graph theory application in functional brain network architecture. Clin. Neurophysiol. Pract. 2017, 2, 206–213. [Google Scholar] [CrossRef]
- Von Stein, A.; Sarnthein, J. Different frequencies for different scales of cortical integration: From local gamma to long range alpha/theta synchronization. Int. J. Psychophysiol. 2000, 38, 301–313. [Google Scholar] [CrossRef]
- Guevara, M.A.; Paniagua, E.I.C.; González, M.H.; Carrillo, I.K.S.; Sepúlveda, M.L.A.; Orozco, J.C.H.; Gutiérrez, C.A. EEG activity during the spatial span task in young men: Differences between short-term and working memory. Brain Res. 2018, 1683, 86–94. [Google Scholar] [CrossRef]
- Gola, M.; Magnuski, M.; Szumska, I.; Wróbel, A. EEG beta band activity is related to attention and attentional deficits in the visual performance of elderly subjects. Int. J. Psychophysiol. 2013, 89, 334–341. [Google Scholar] [CrossRef] [PubMed]
- Teng, C.; Cheng, Y.; Wang, C.; Ren, Y.; Xu, W.; Xu, J. Aging-related changes of EEG synchronization during a visual working memory task. Cogn. Neurodyn. 2018, 12, 561–568. [Google Scholar] [CrossRef] [PubMed]
- Moezzi, B.; Pratti, L.M.; Hordacre, B.; Graetz, L.; Berryman, C.; Lavrencic, L.M.; Ridding, M.C.; Keage, H.A.D.; McDonnell, M.D.; Goldsworthy, M.R. Characterization of young and old adult brains: An EEG functional connectivity analysis. Neuroscience 2019, 422, 230–239. [Google Scholar] [CrossRef] [PubMed]
- Lotfan, S.; Shahyad, S.; Khosrowabadi, R.; Mohammadi, A.; Hatef, B. Support vector machine classification of brain states exposed to social stress test using EEG-based brain network measures. Biocybern. Biomed. Eng. 2019, 39, 199–213. [Google Scholar] [CrossRef]


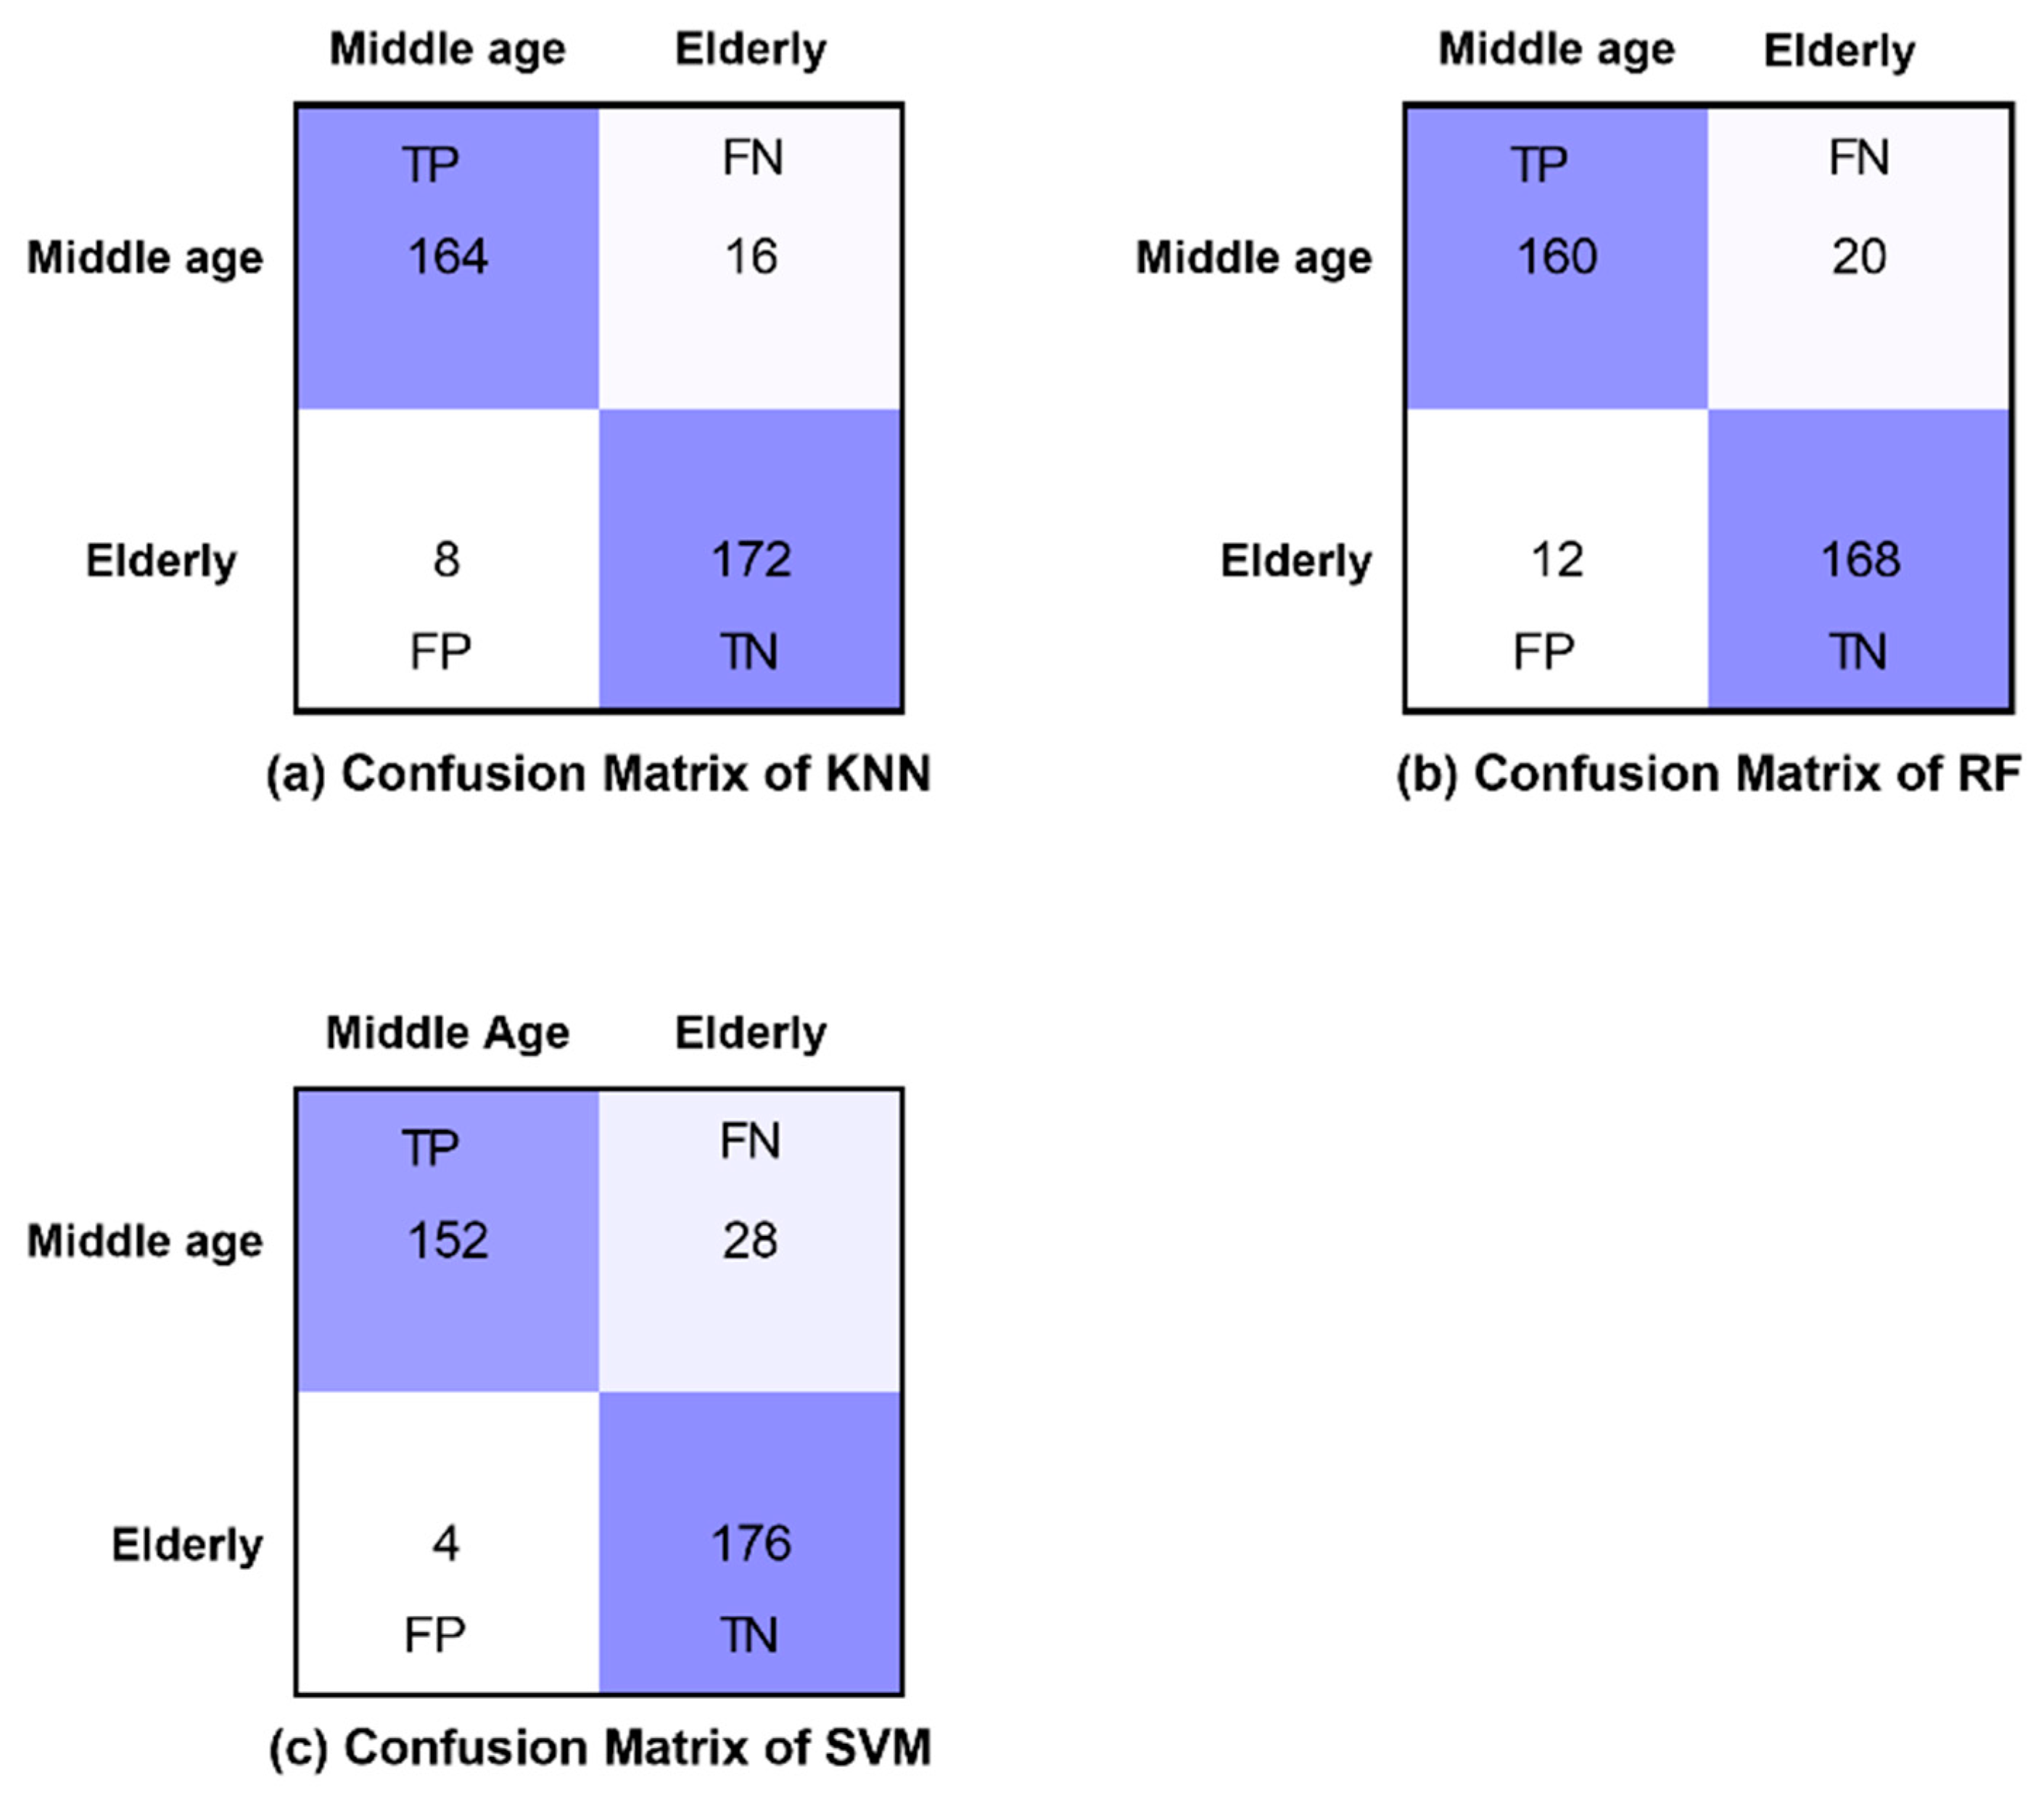
| Accuracy (%) | Sensitivity | Specificity | Kappa Statistics | F-Score | |
|---|---|---|---|---|---|
| KNN | 87.80 | 0.927 | 0.829 | 0.756 | 0.878 |
| RF | 85.36 | 0.902 | 0.805 | 0.707 | 0.853 |
| SVM | 86.67 | 0.911 | 0.822 | 0.733 | 0.866 |
| Accuracy (%) | Sensitivity | Specificity | Kappa Statistics | F-Score | |
|---|---|---|---|---|---|
| KNN | 93.33 | 0.956 | 0.911 | 0.867 | 0.935 |
| RF | 91.11 | 0.889 | 0.933 | 0.822 | 0.911 |
| SVM | 91.10 | 0.978 | 0.844 | 0.822 | 0.911 |
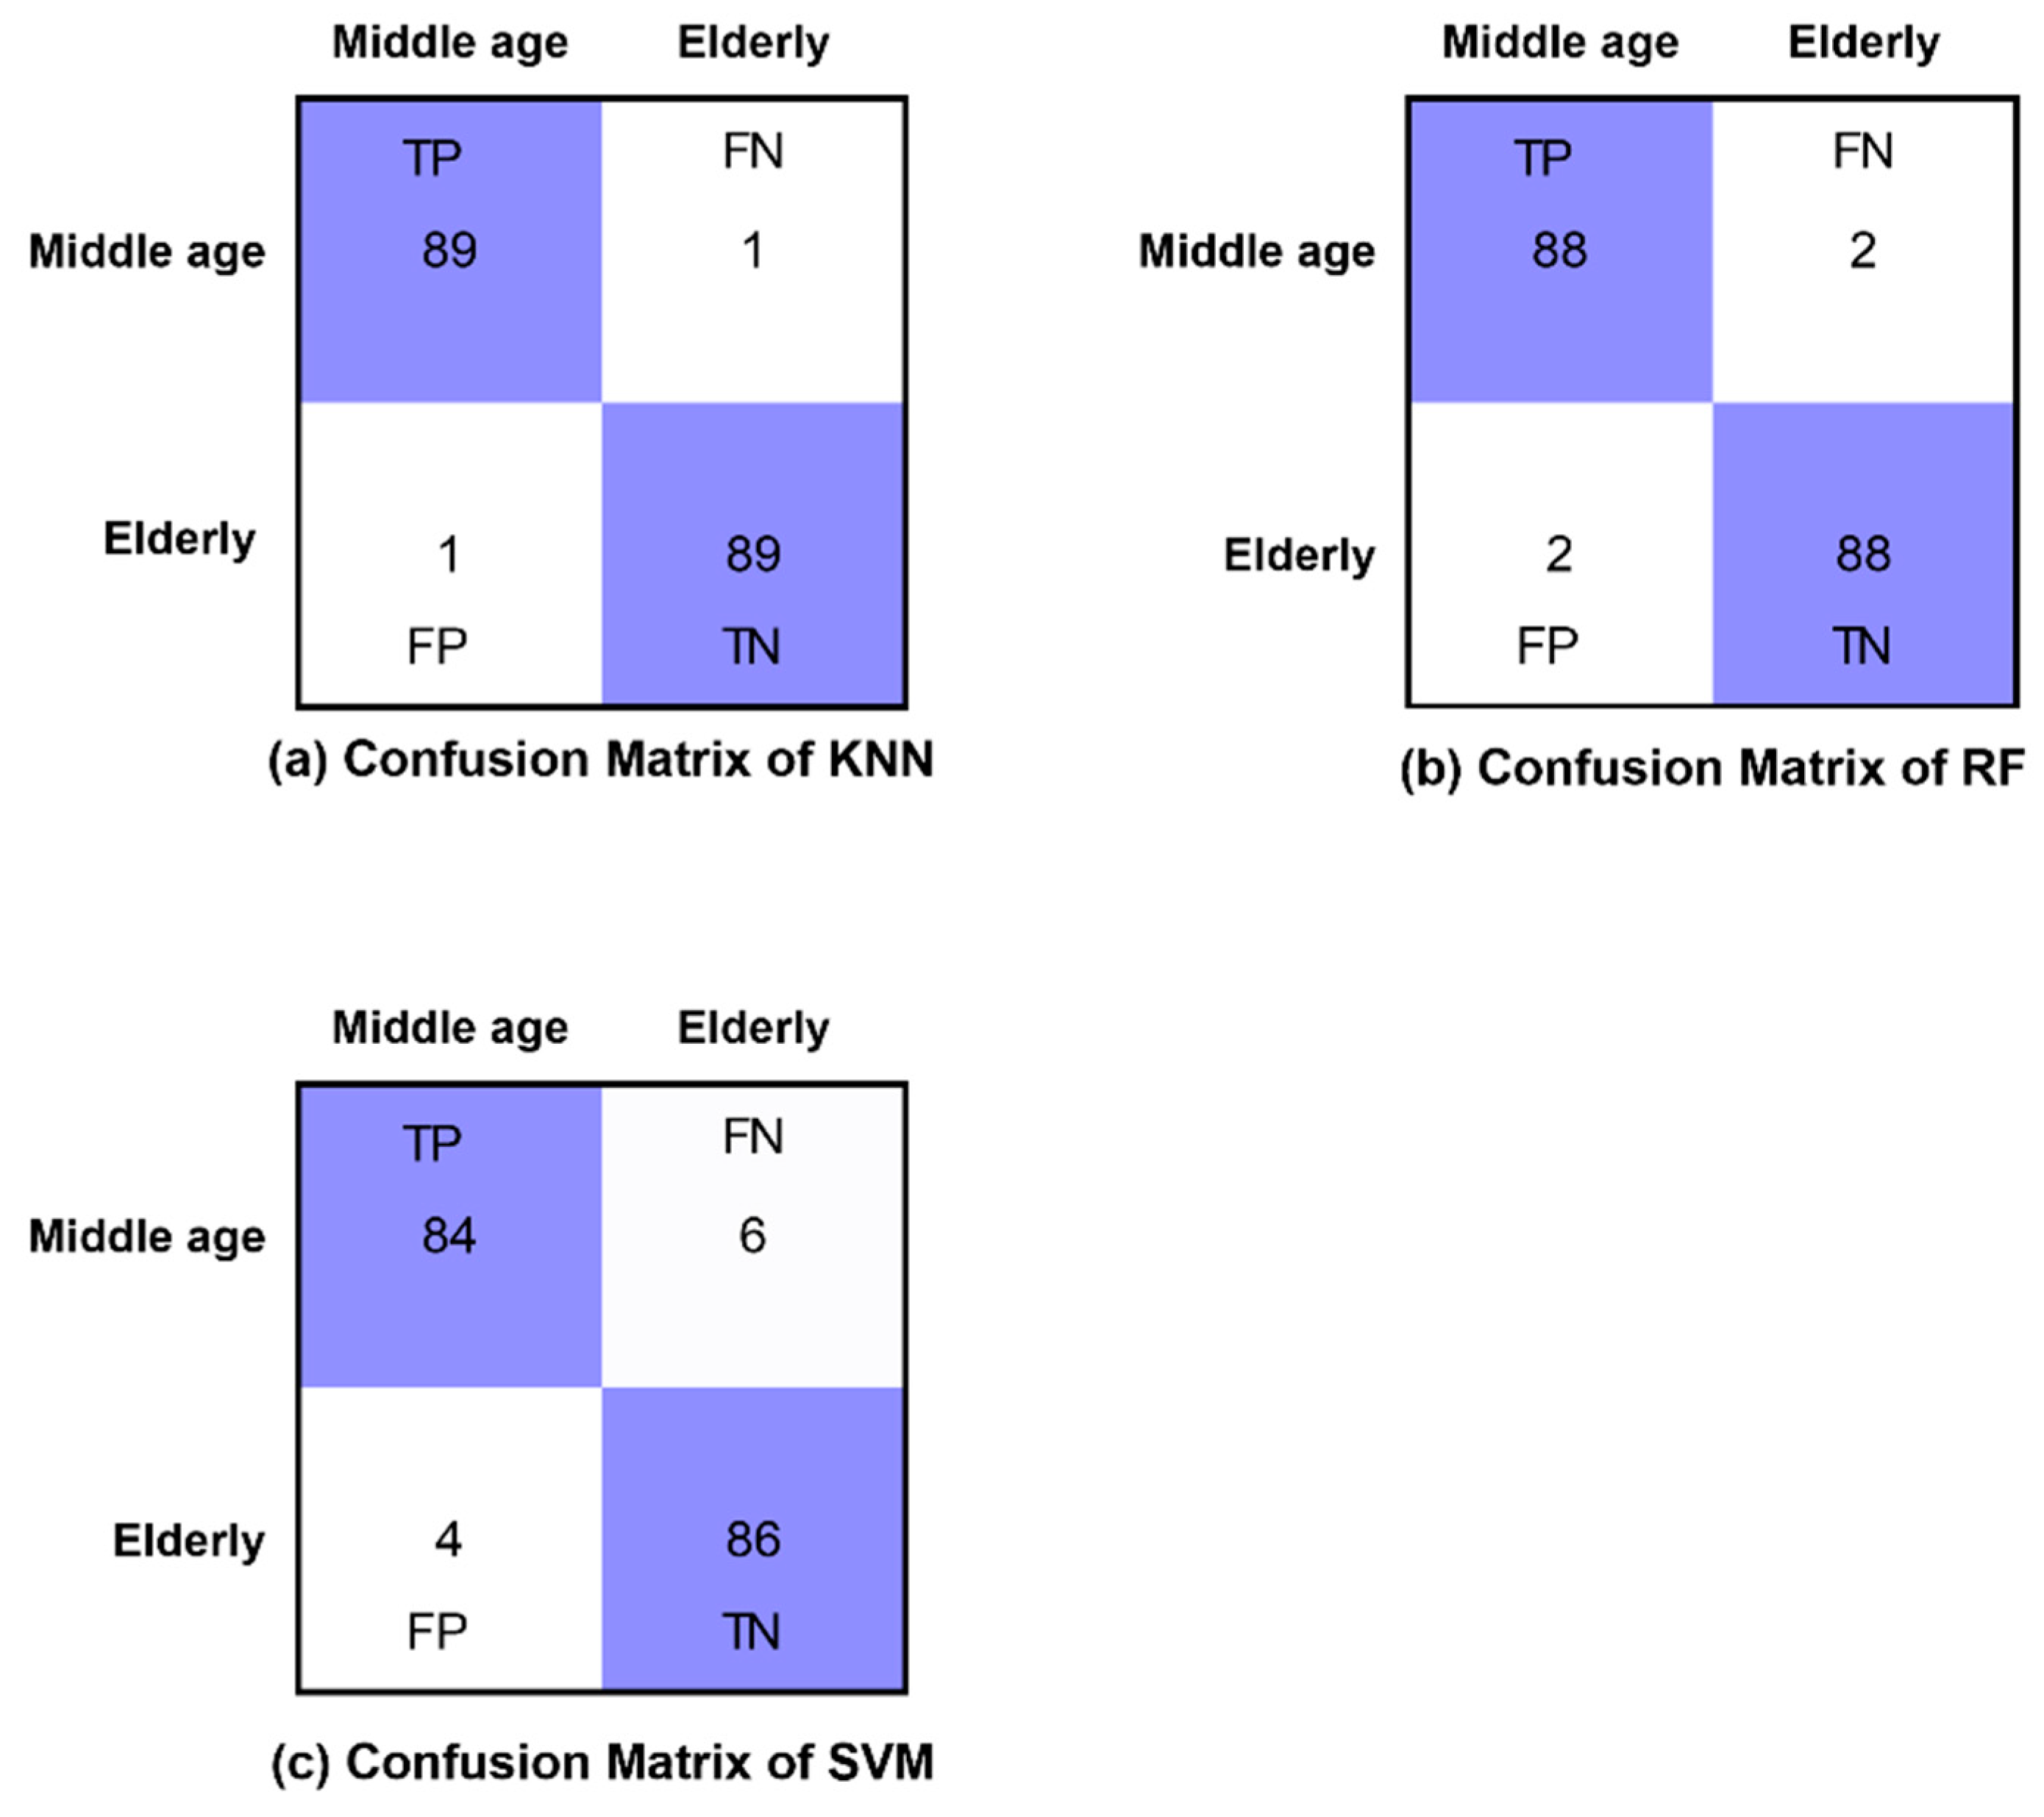
| Accuracy (%) | Sensitivity | Specificity | Kappa Statistics | F-Score | |
|---|---|---|---|---|---|
| KNN | 98.89 | 0.978 | 0.998 | 0.956 | 0.989 |
| RF | 97.78 | 0.980 | 0.976 | 0.889 | 0.978 |
| SVM | 94.44 | 0.956 | 0.933 | 0.978 | 0.944 |
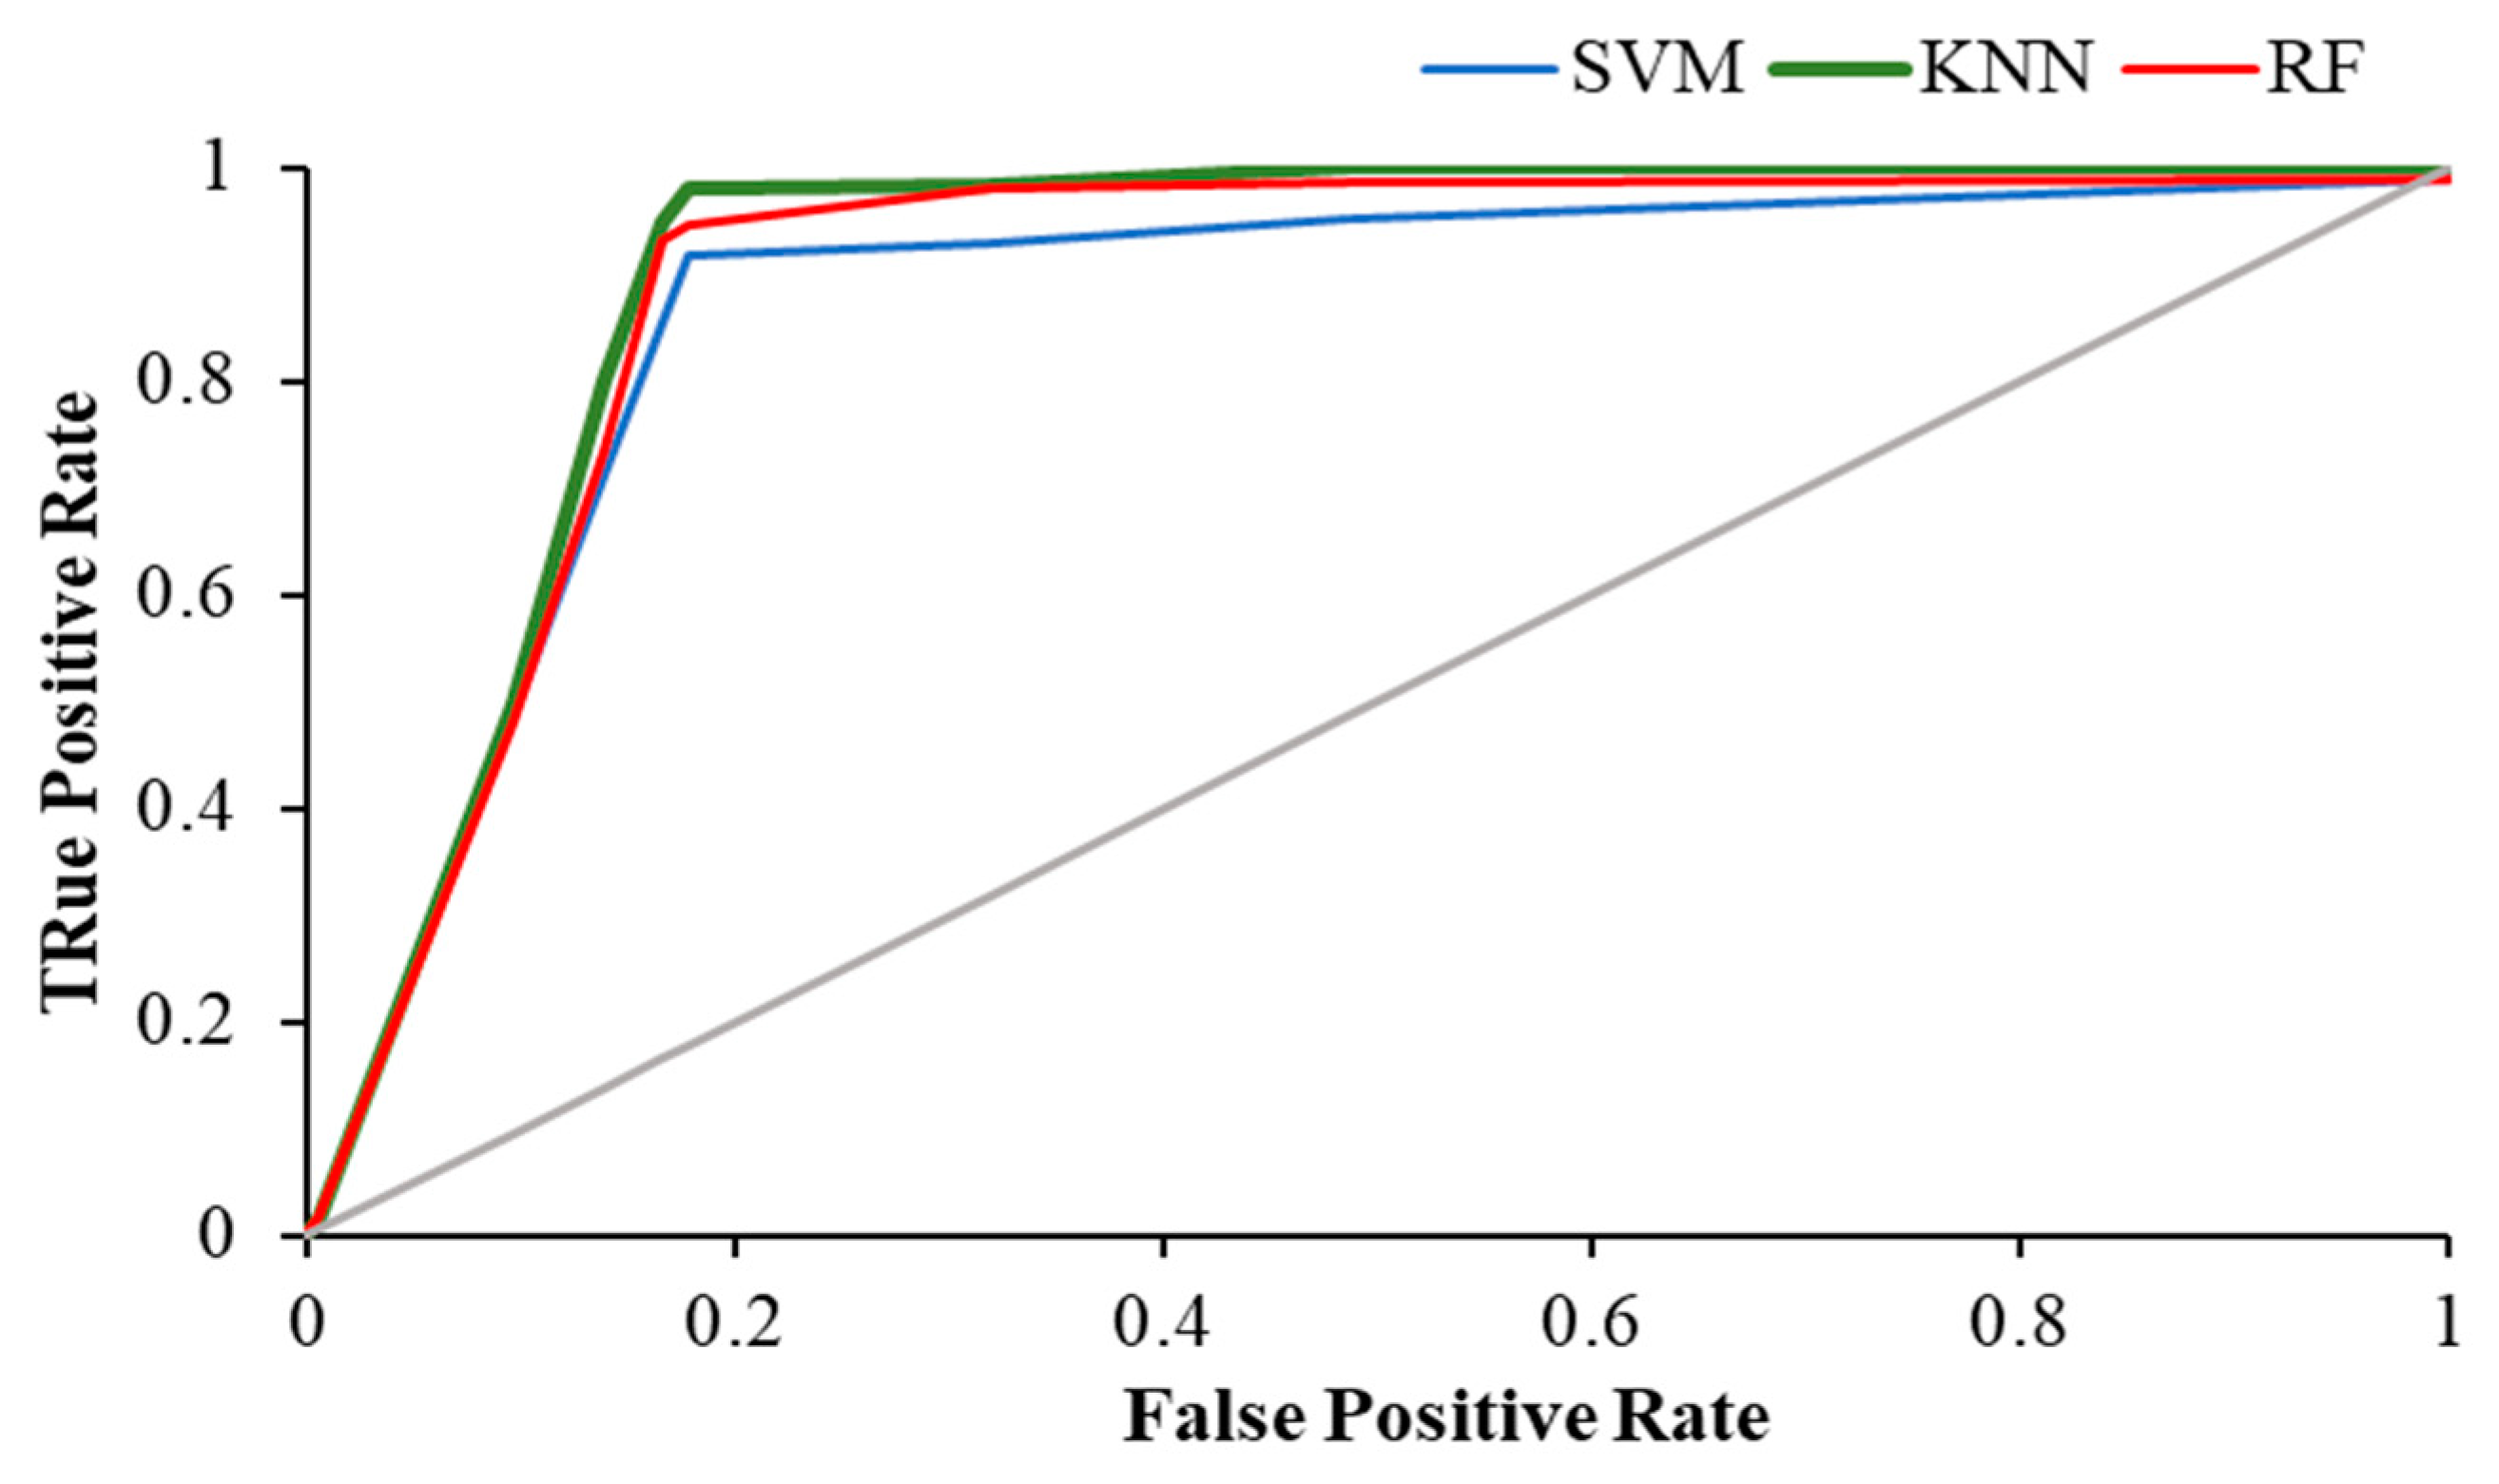
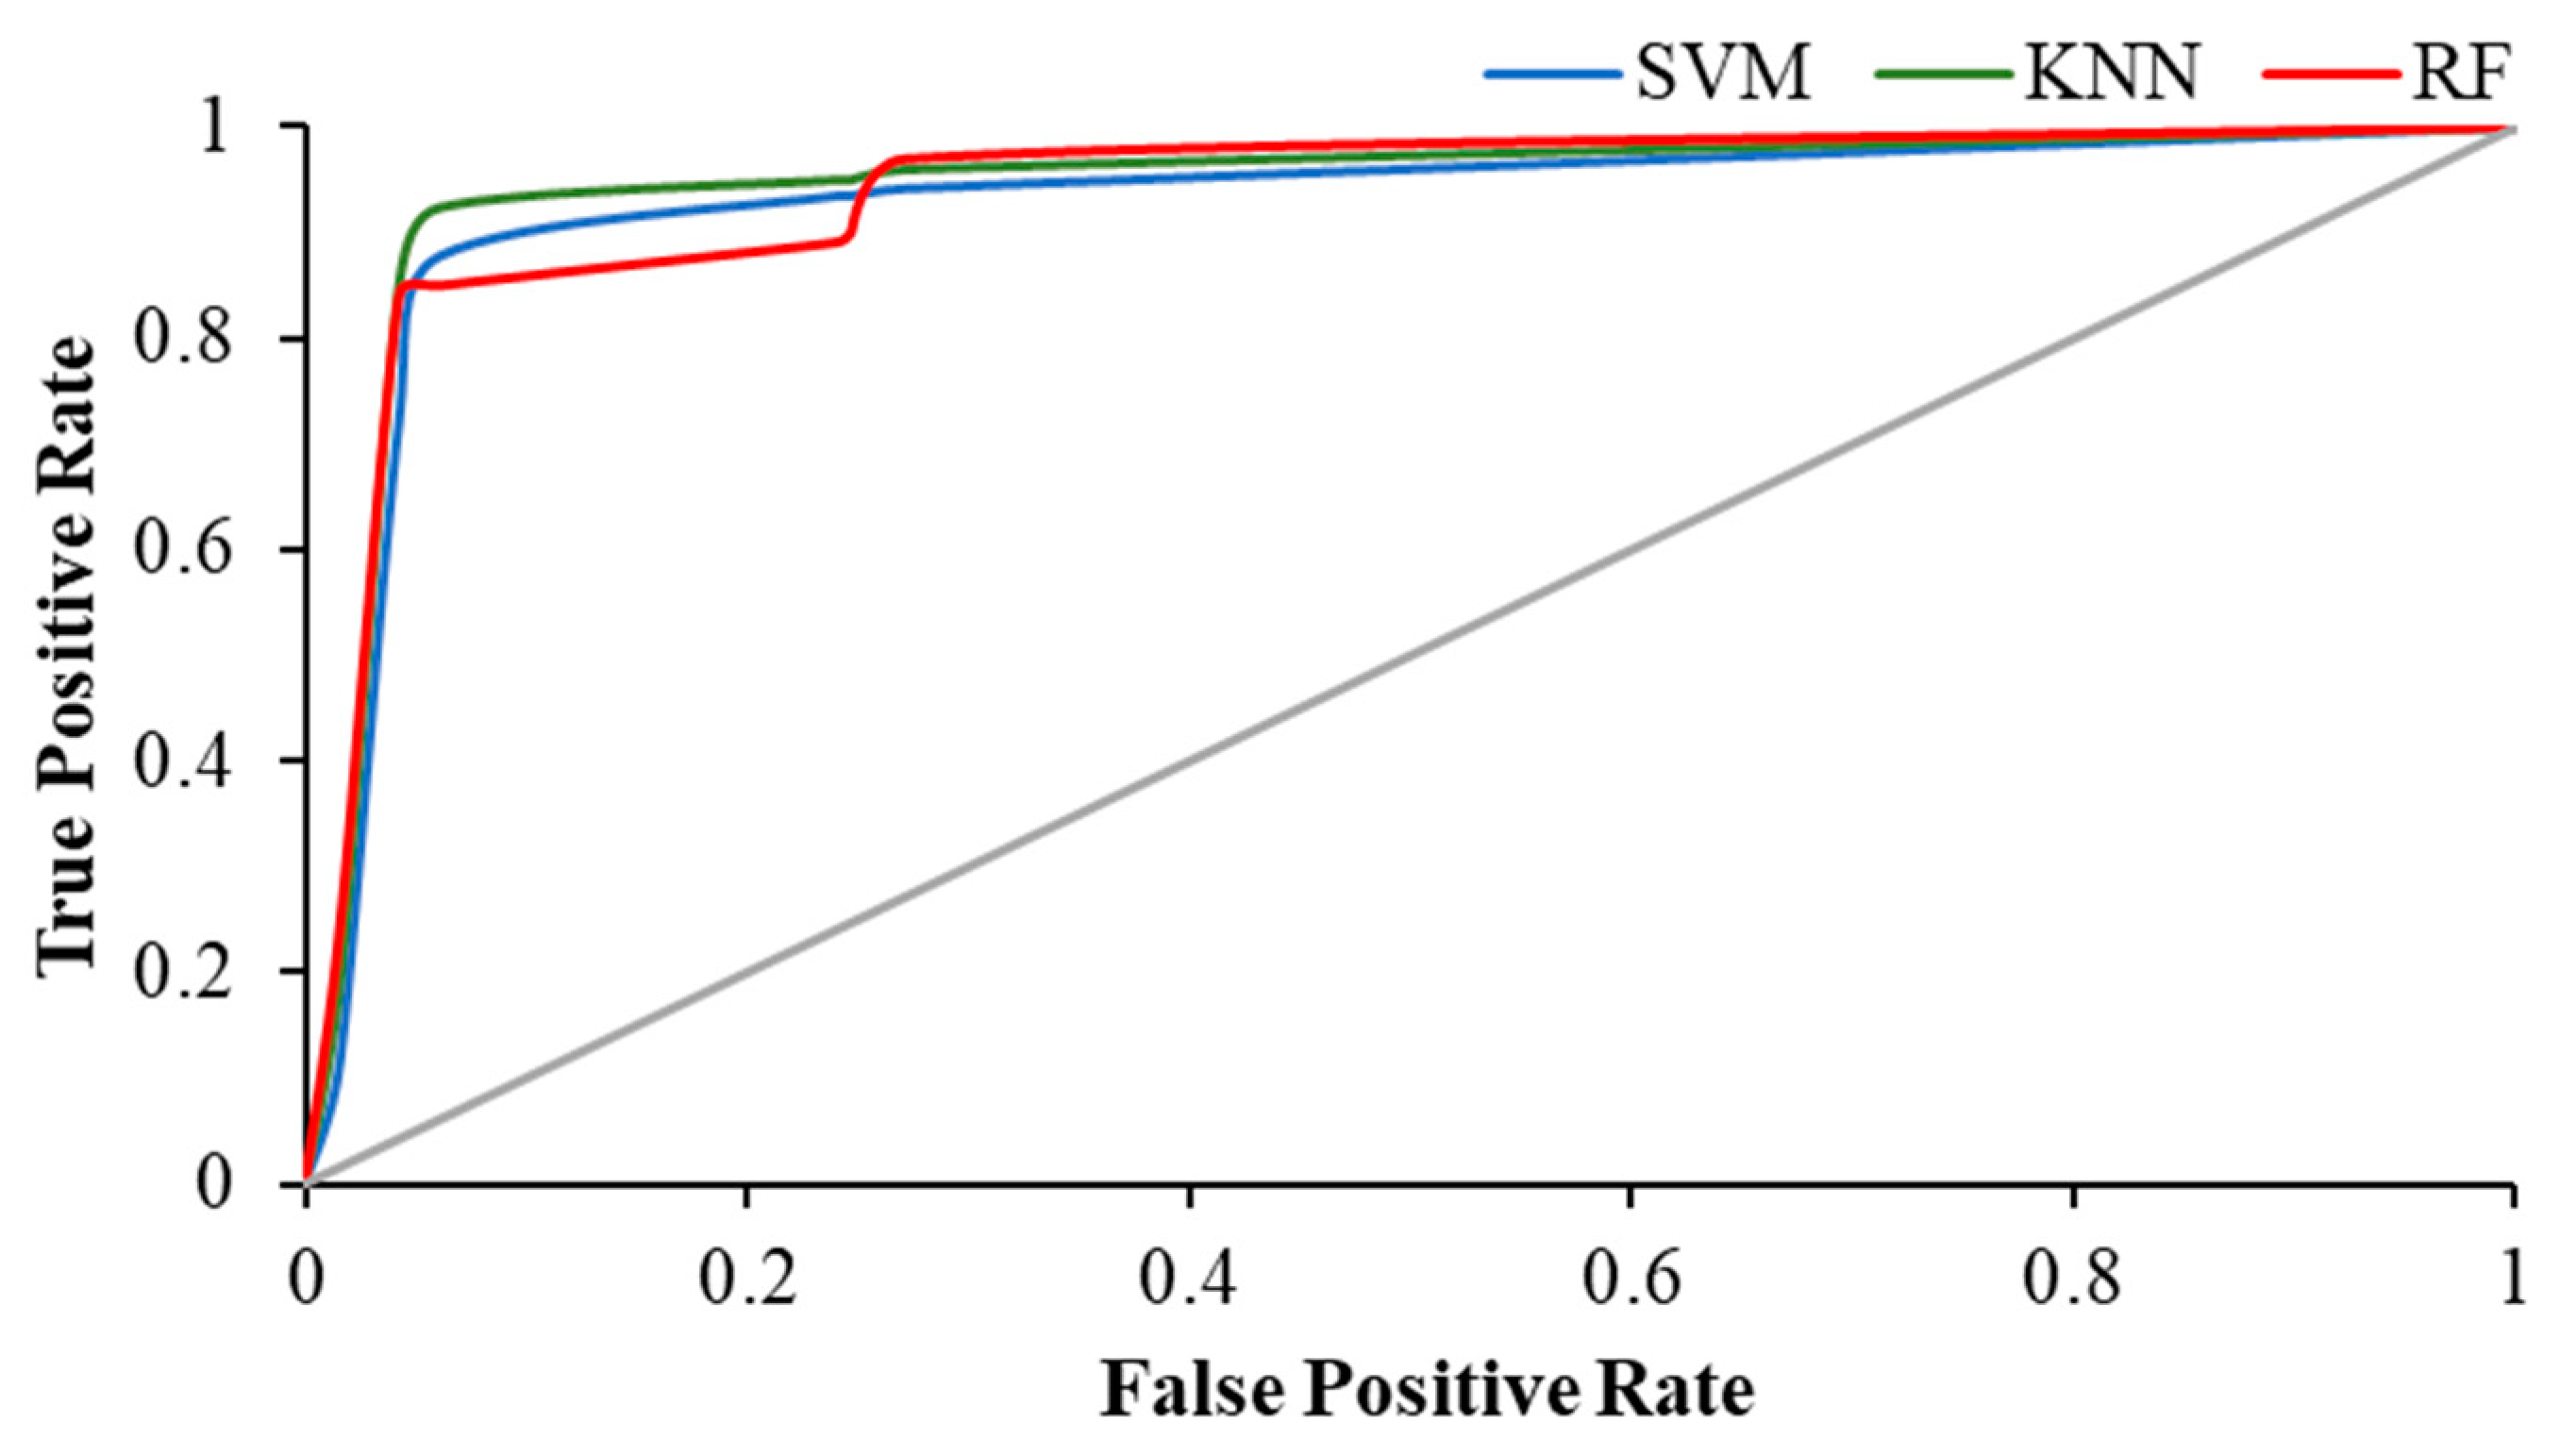
| Activity | Precision | AUC | ||||
|---|---|---|---|---|---|---|
| KNN | RF | SVM | KNN | RF | SVM | |
| Eyes-Open | 0.883 | 0.858 | 0.870 | 0.878 | 0.952 | 0.867 |
| Eyes-Closed | 0.934 | 0.912 | 0.919 | 0.935 | 0.658 | 0.912 |
| Visual WM Task | 0.989 | 0.978 | 0.945 | 0.979 | 0.988 | 0.944 |
| Study | Application | State | Features | Classification Results |
|---|---|---|---|---|
| Jalili, M [32] | Alzheimer’s disease (AD vs. healthy) | Resting state (Eyes-open and eyes-closed) | Local efficiency, transitivity, global efficiency, node and edge between centrality, assortativity, and modularity | SVM = 82% |
| Bahar Moezzi et al. [75] | Healthy aging (young vs. old) | Resting state (Eyes-open) | Power spectra, functional connectivity, and electrode-to-electrode distance | SVM = 94% |
| Petti, Manuela et al. [6] | Healthy aging (young vs. middle-aged) | Resting state (Eyes-closed) | Node strength, local efficiency, global efficiency, clustering coefficient, weight, and characteristic path length | SVM = 82% |
| Lotfan, Saeed et al. [76] | Social stress measurement (healthy young) | Before, right after, and 20 min after stress | Transitivity, modularity, characteristic path length, and global efficiency | SVM = 84.14% |
| Proposed work | Healthy aging (middle-aged vs. elderly) | Eyes-open, eyes-closed, and visual WM task | Global efficiency, local efficiency, clustering coefficient, characteristic path length, node strength, and assortativity | KNN = 98.89% |
Publisher’s Note: MDPI stays neutral with regard to jurisdictional claims in published maps and institutional affiliations. |
© 2022 by the authors. Licensee MDPI, Basel, Switzerland. This article is an open access article distributed under the terms and conditions of the Creative Commons Attribution (CC BY) license (https://creativecommons.org/licenses/by/4.0/).
Share and Cite
Javaid, H.; Kumarnsit, E.; Chatpun, S. Age-Related Alterations in EEG Network Connectivity in Healthy Aging. Brain Sci. 2022, 12, 218. https://doi.org/10.3390/brainsci12020218
Javaid H, Kumarnsit E, Chatpun S. Age-Related Alterations in EEG Network Connectivity in Healthy Aging. Brain Sciences. 2022; 12(2):218. https://doi.org/10.3390/brainsci12020218
Chicago/Turabian StyleJavaid, Hamad, Ekkasit Kumarnsit, and Surapong Chatpun. 2022. "Age-Related Alterations in EEG Network Connectivity in Healthy Aging" Brain Sciences 12, no. 2: 218. https://doi.org/10.3390/brainsci12020218
APA StyleJavaid, H., Kumarnsit, E., & Chatpun, S. (2022). Age-Related Alterations in EEG Network Connectivity in Healthy Aging. Brain Sciences, 12(2), 218. https://doi.org/10.3390/brainsci12020218