
Musical Performance in Adolescents with ADHD, ADD and Dyslexia—Behavioral and Neurophysiological Aspects

 ,
,  , , , and
Abstract
:1. Introduction
2. Materials and Methods
2.1. Participants
2.2. Musical Background
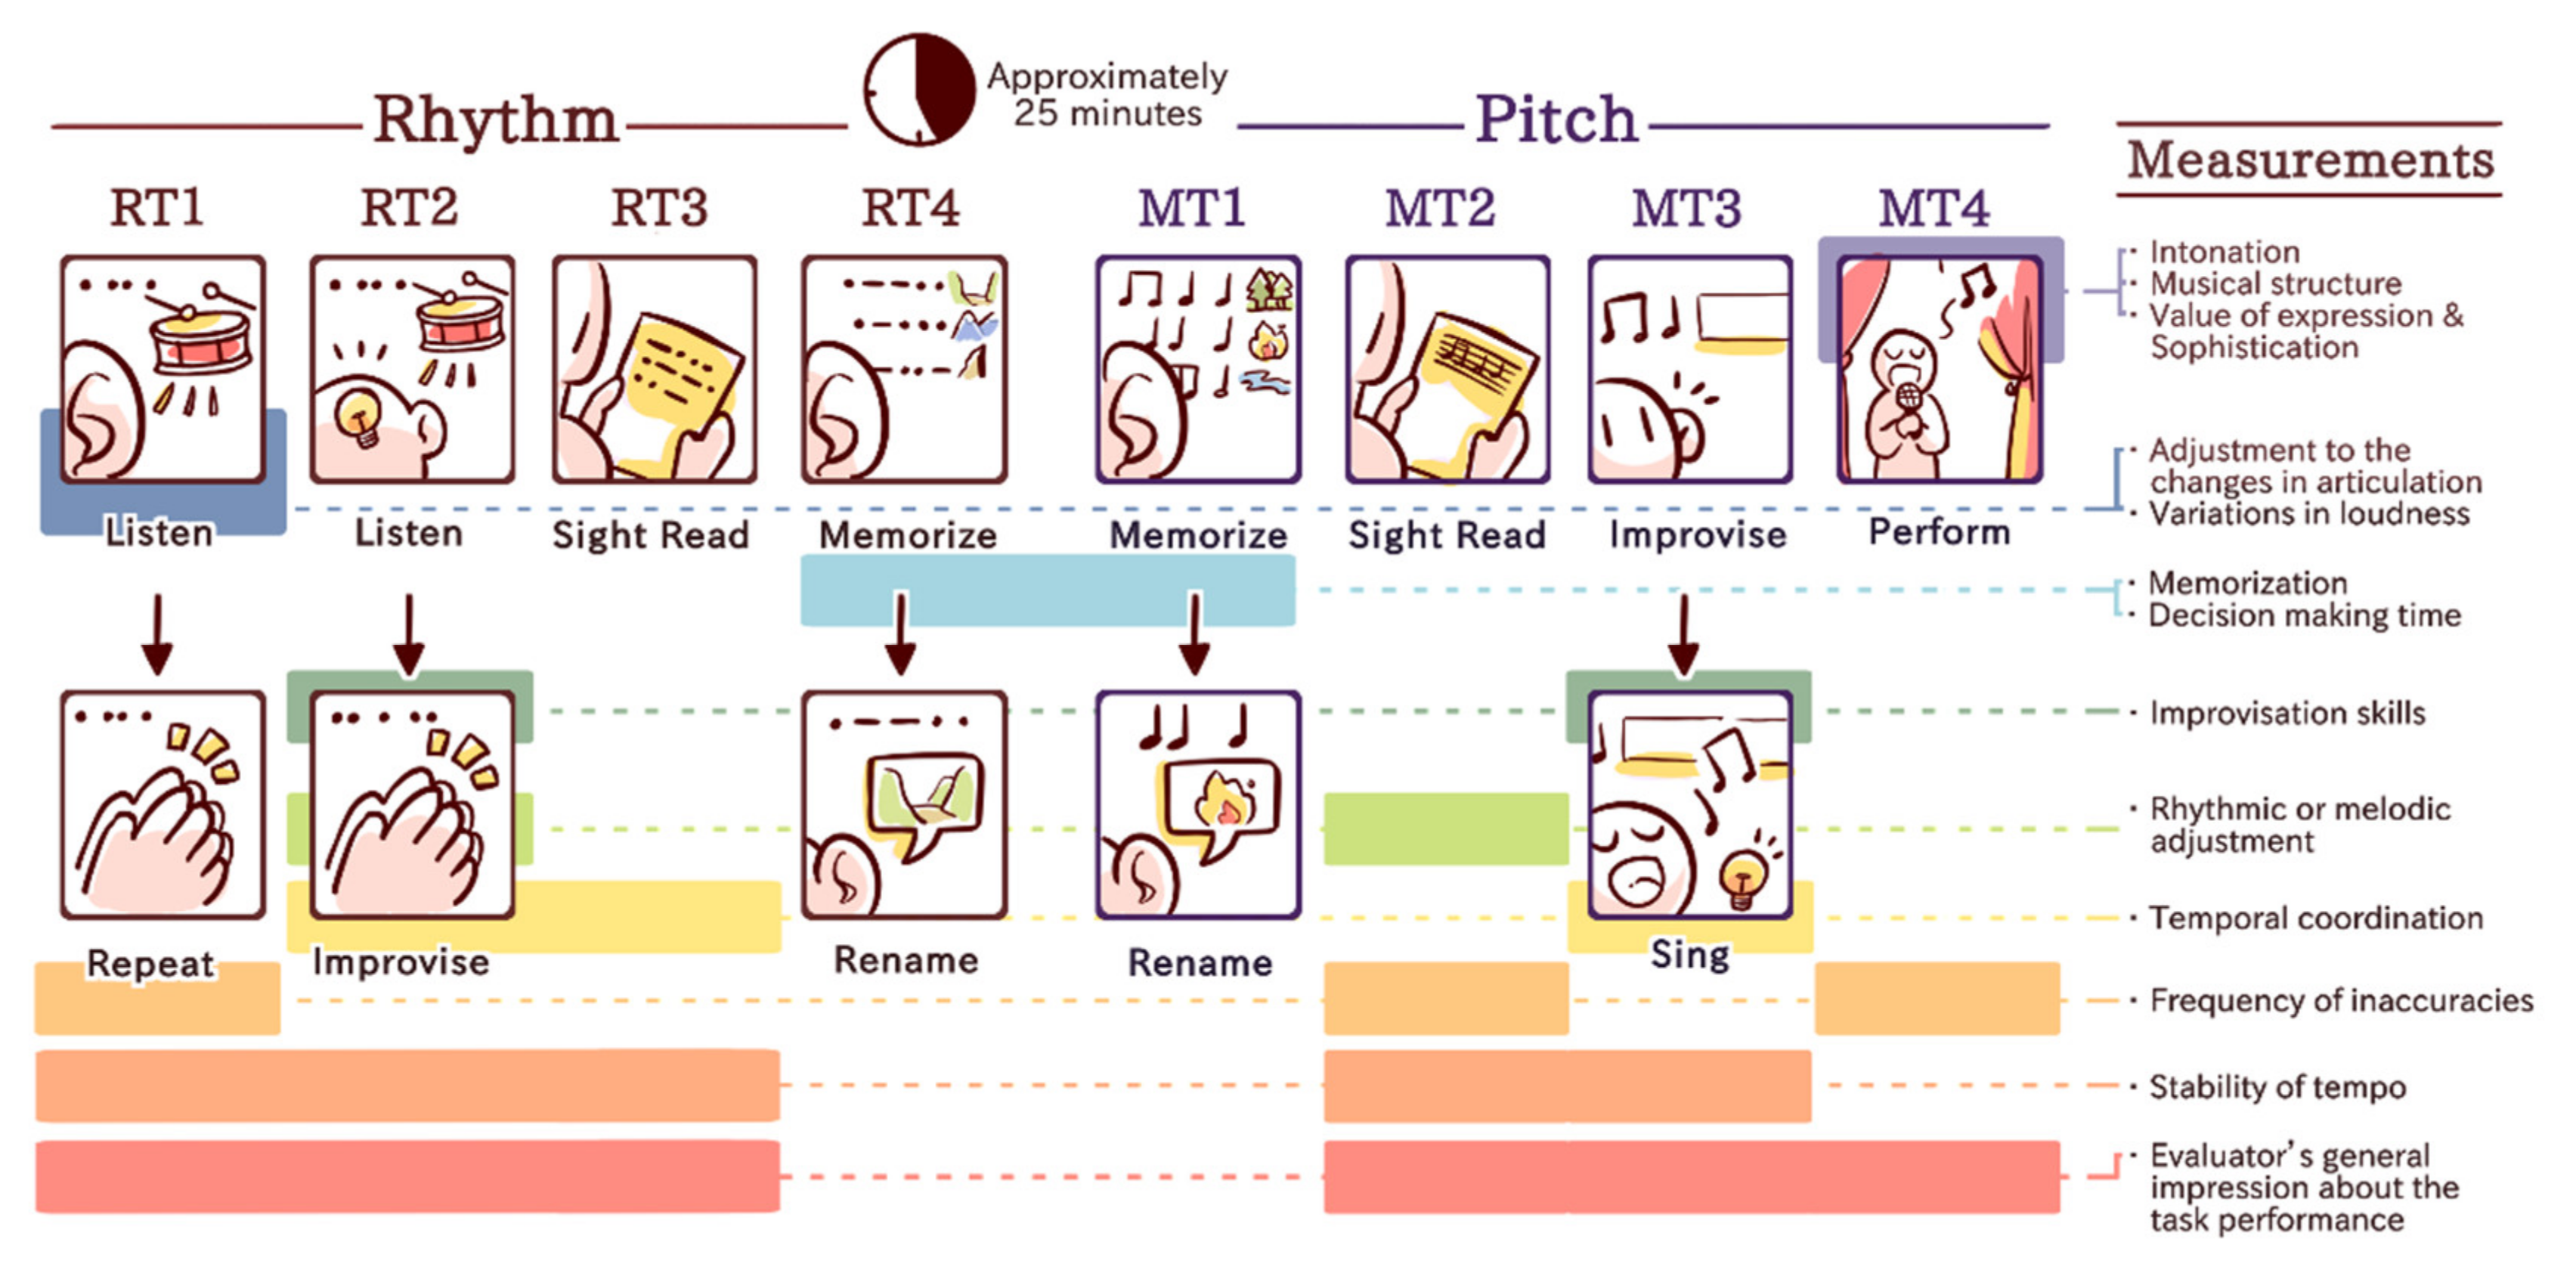
2.3. Musical Performance Measurement: Music Performance Assessment Scale (MuPAS)
- Listen to a rhythmic phrase twice (2/4, 6 bars including on the beat rhythmic accents and slight changes in dynamics) and repeat it by clapping as precisely as possible without any time limit after the second listen (RT1);
- Listen to 3 short rhythmic phrases twice (2/4, 2 bars each including simple and compound division) with a metronome clicking in the background, and then rhythmically improvise to each phrase by handclapping during the second listen while keeping the meter (RT2);
- Sight read a rhythmic phrase by handclapping, which was presented on a single line staff including quarters, semi-quarters and dotted notes (RT3);
- Memorize 3 subsequent rhythmic phrases with free chosen titles (valley—pattern characterized by flat voicing, mountain—pattern characterized by partly ascending voicing and cliff—pattern characterized by partly descending voicing) and rename two randomly played phrases (RT4).
- Memorize 3 music phrases with free chosen titles (forest—pattern characterized by chord progression, river—–pattern characterized by the same progression as for forest outlined in eighth notes and Fire—pattern characterized by progression outlined in sixteenth notes) and rename two randomly played phrases (MT1);
- Sight reading of a melody phrase in G-major by singing based on scale-related ascending and descending structures (MT2);
- Improvisation task with the melody in G Major, mostly based on a main triad structure (4 bars, 2/4, piano recording) in which the subject was asked to continue by singing without length restrictions (MT3);
- Play or sing their favorite music piece, which they were instructed to rehearse beforehand (MT4).
2.4. Neurophysiological Measurement: Magnetencephalography (MEG)
2.4.1. Stimuli
2.4.2. Procedure
2.4.3. Pre-Processing
2.4.4. Variables
2.5. Statistical Analysis
3. Results
3.1. Descriptives Statistics of the Musical Performance Variables
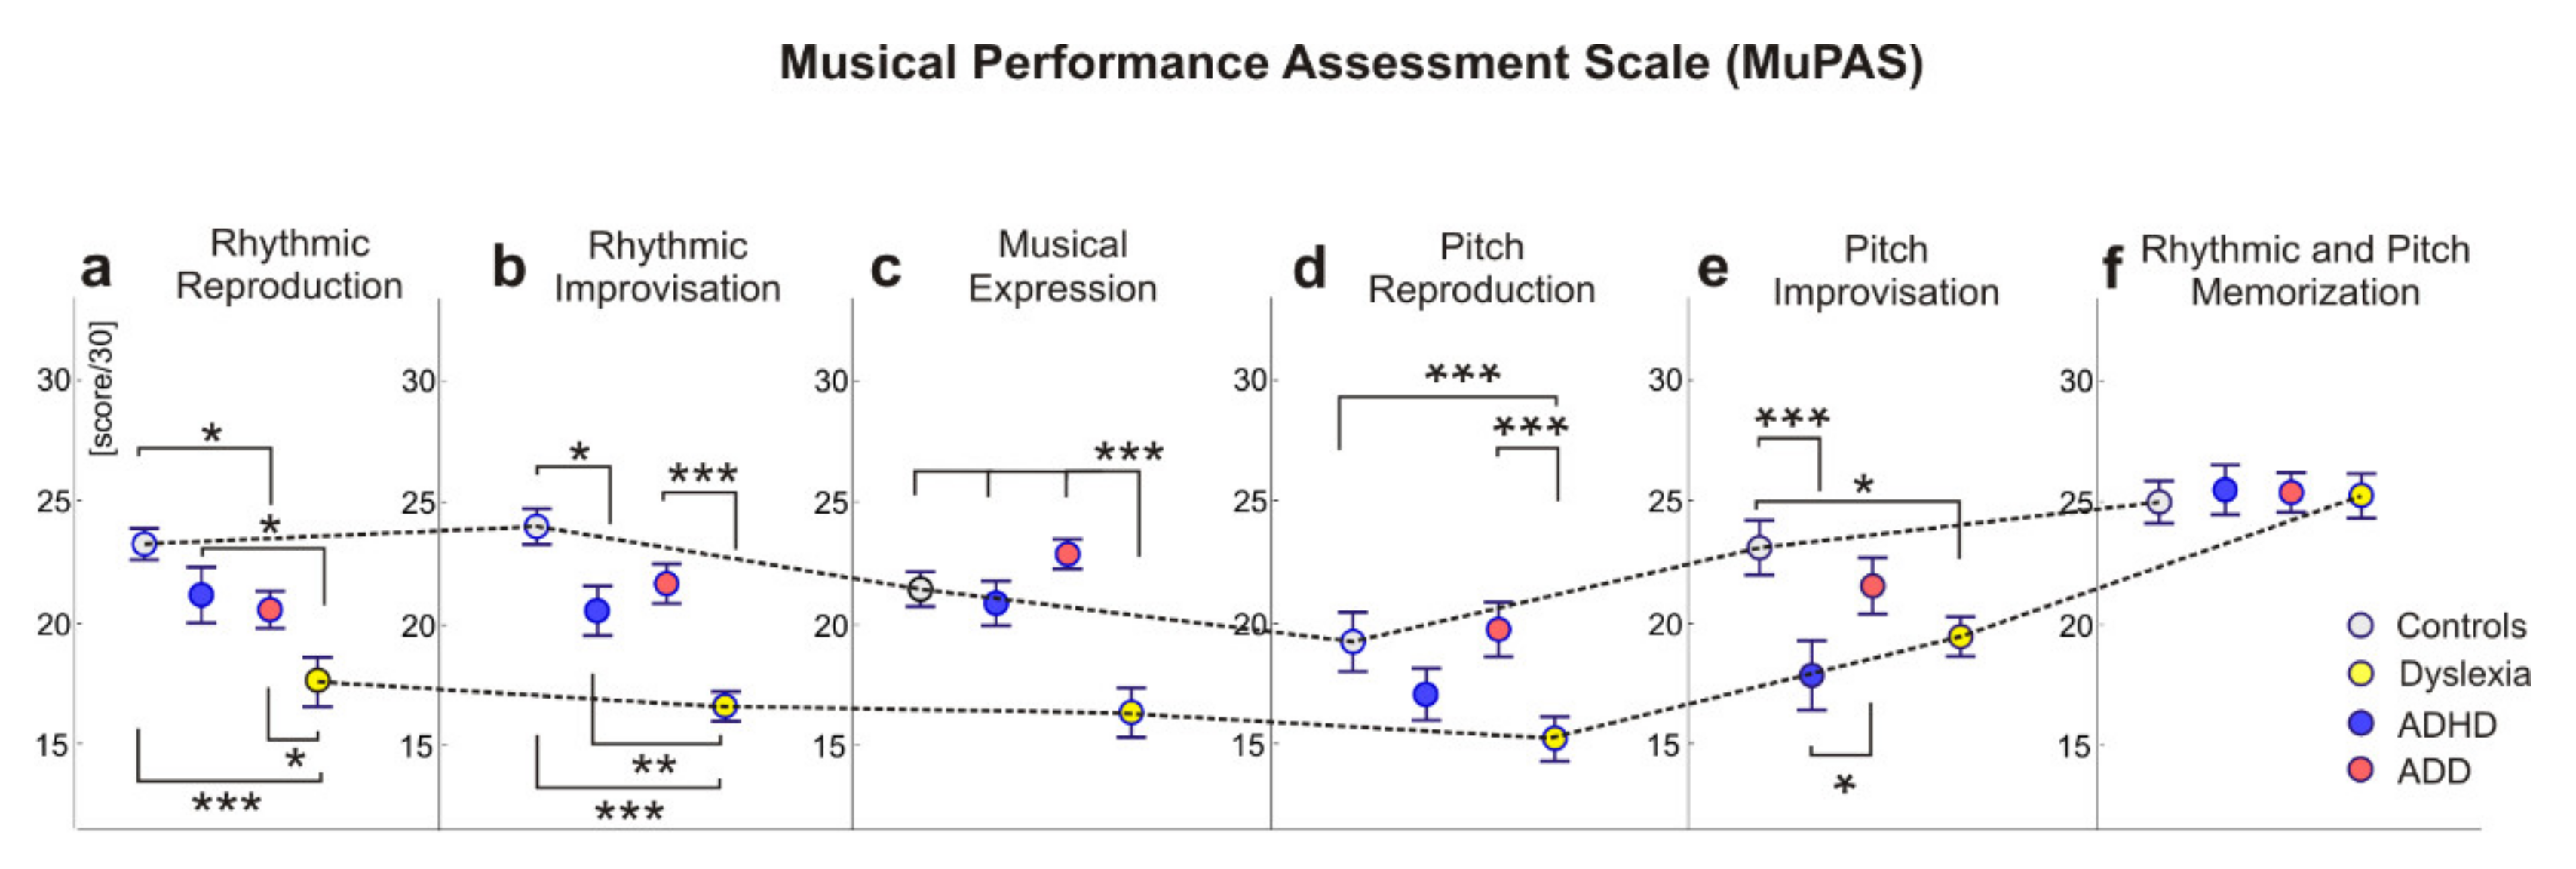
3.2. Group Differences in Musical Performance
3.2.1. MANOVA: Mean Differences of Musical Performance
3.2.2. ANOVAs and Post Hoc Comparison of Musical Performance
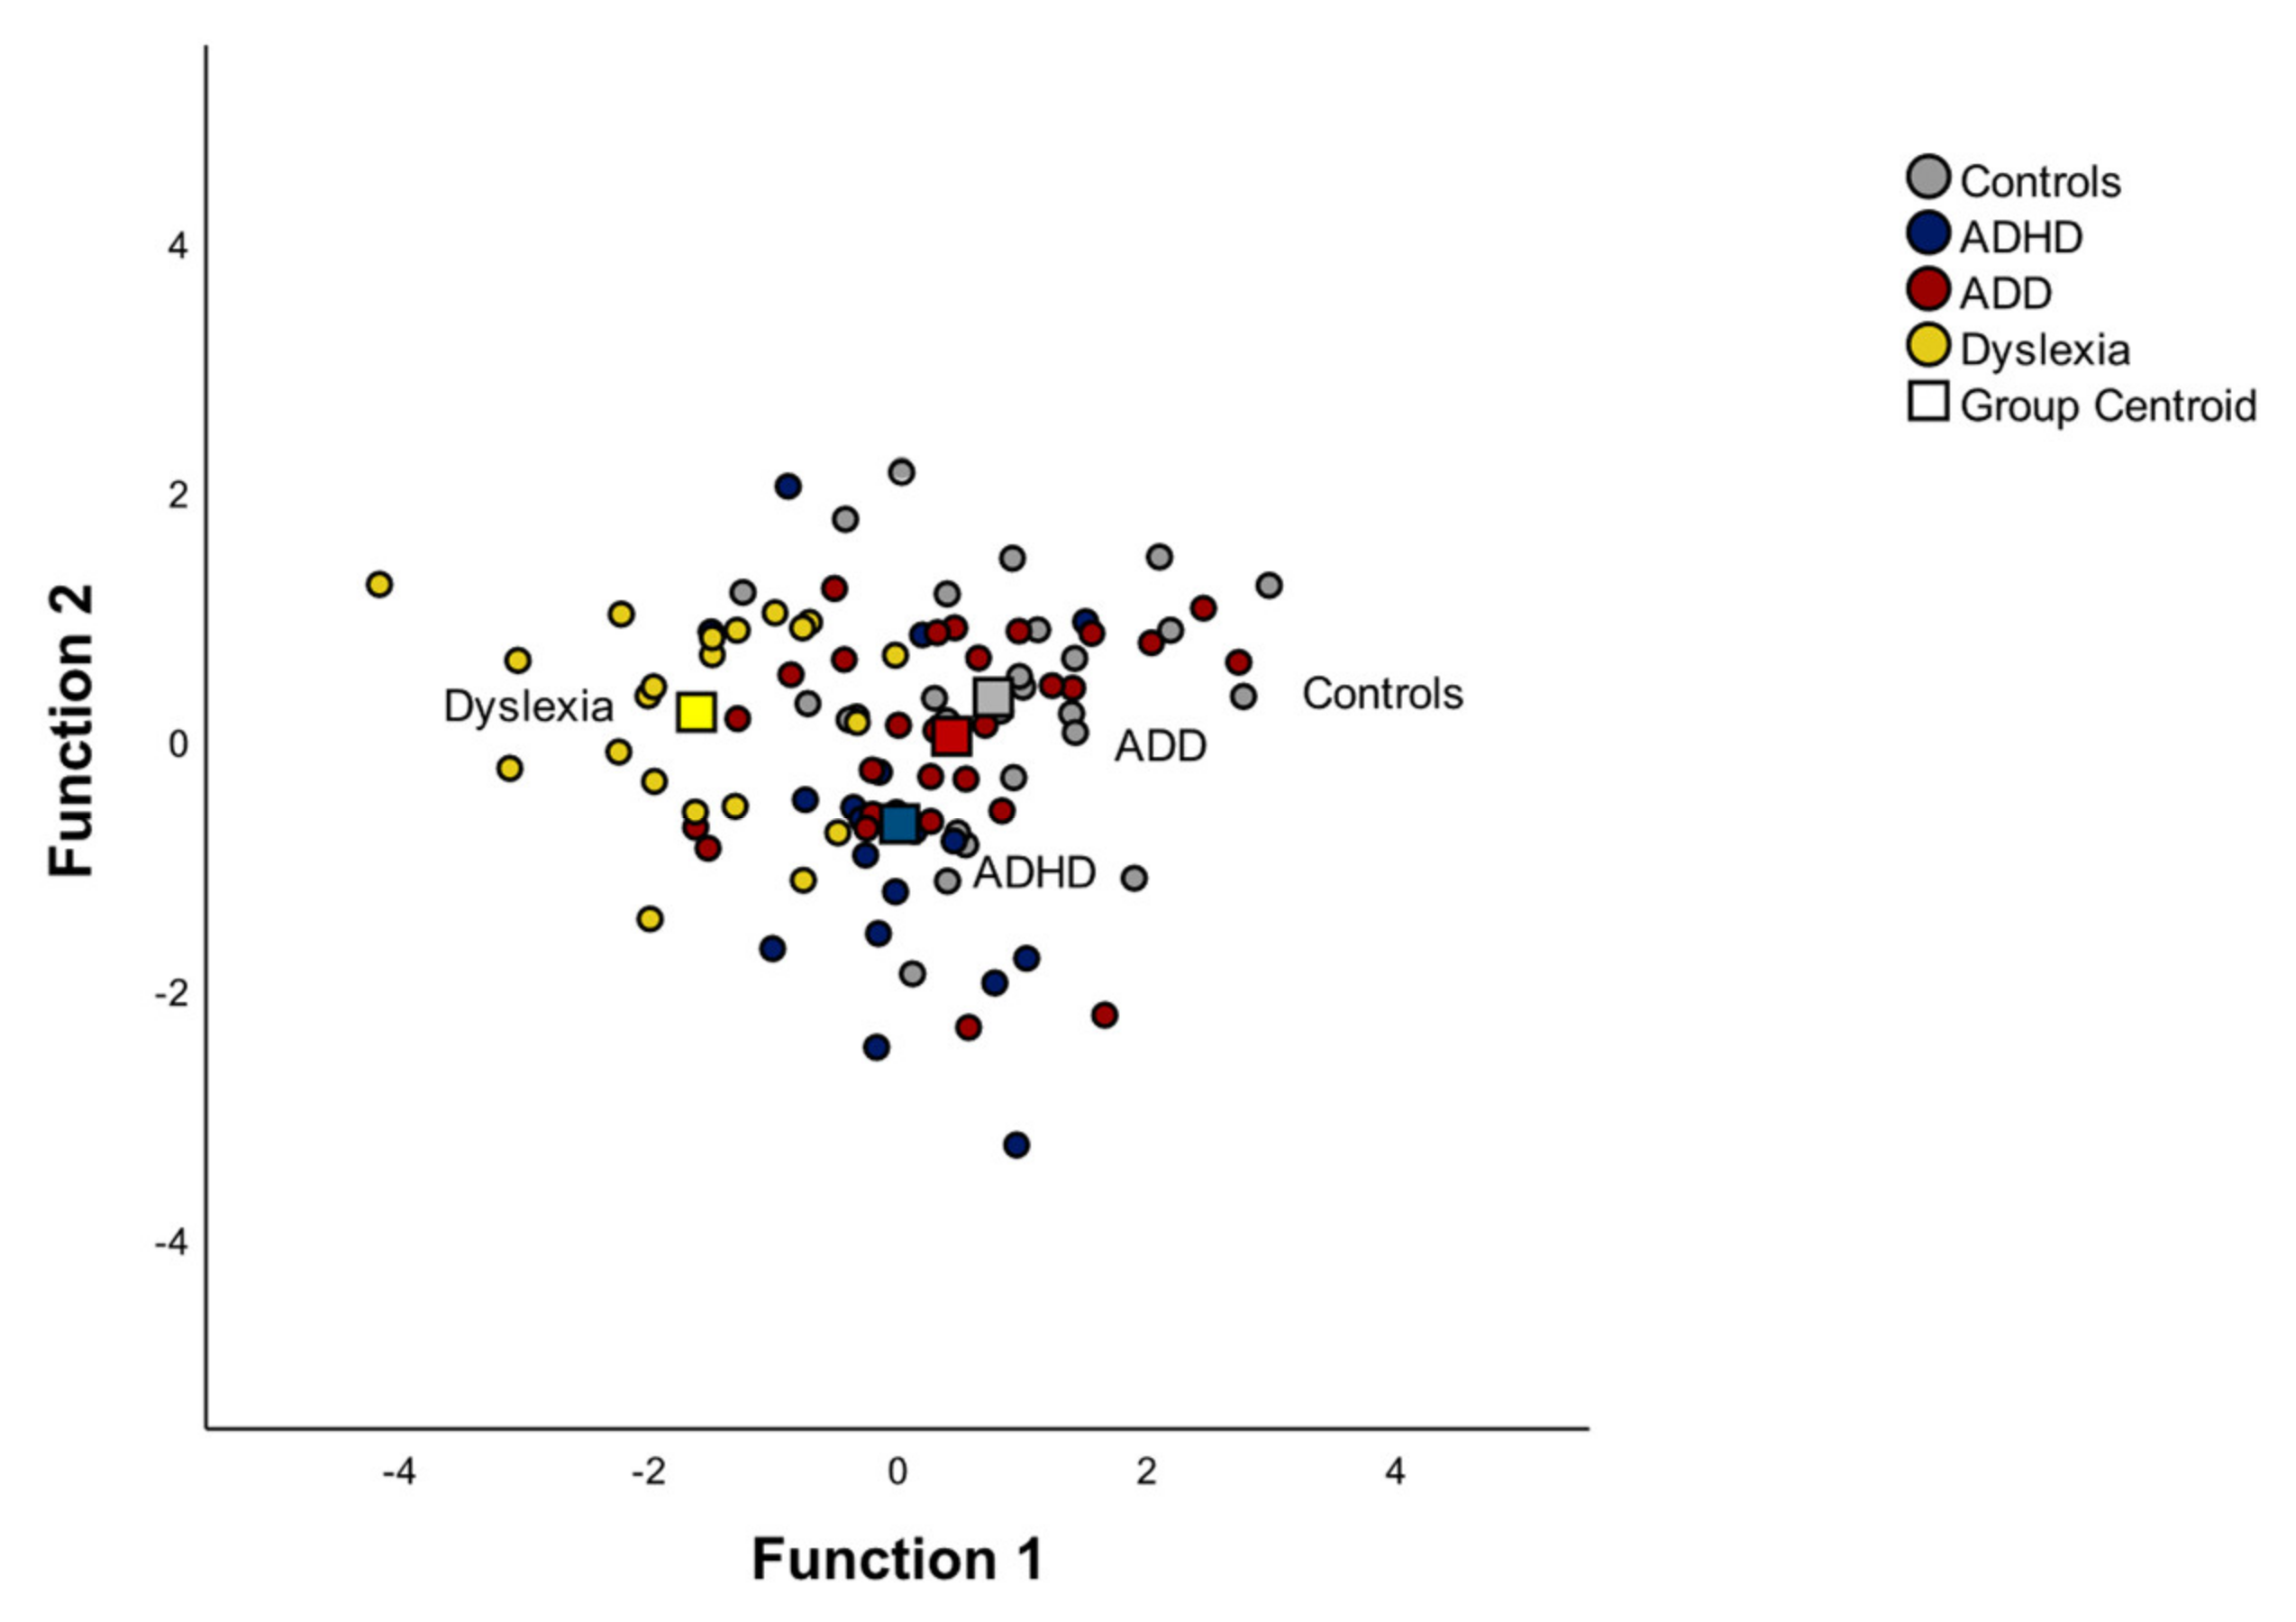
3.2.3. Discriminant Function of Musical Performance
3.3. Descriptives Statistics of the Auditory-Evoked Field Variables
3.4. Group Differences in Auditory-Evoked Fields
3.4.1. MANOVA: Mean Differences of Auditory-Evoked Fields
3.4.2. ANOVAs and Post Hoc Comparisons of Auditory-Evoked Fields
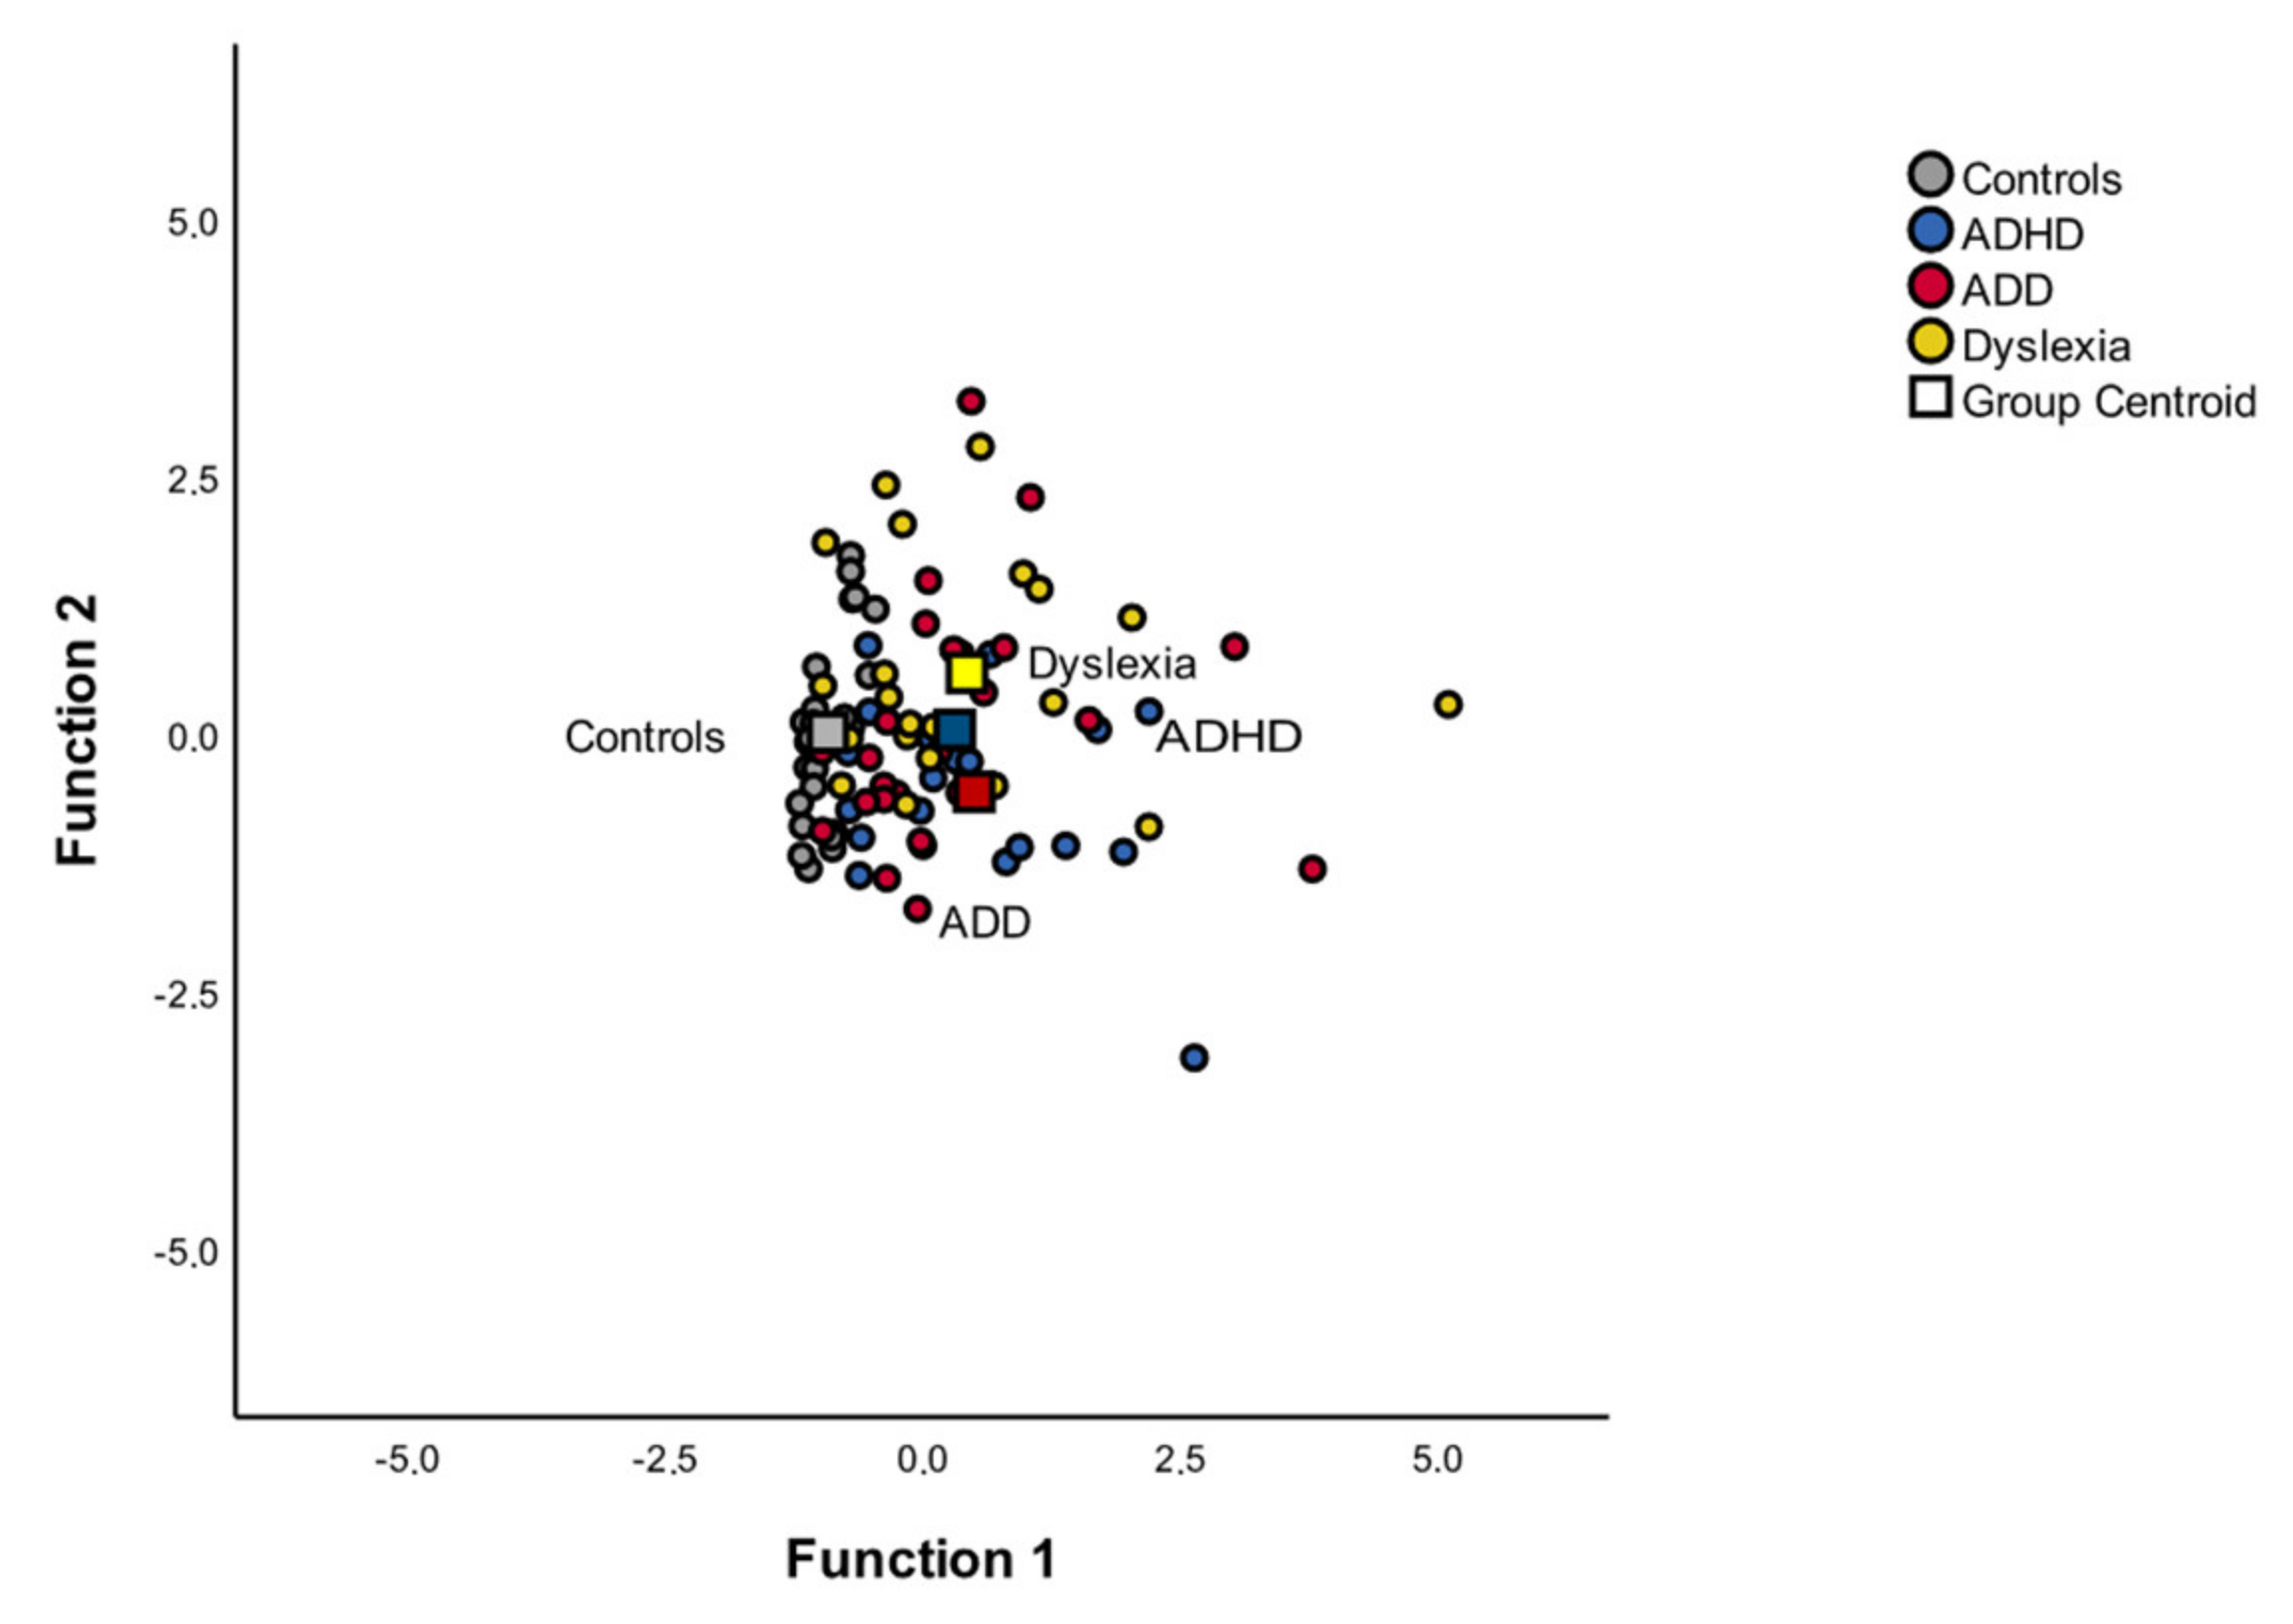
3.4.3. Discriminant Function of Auditory-Evoked Fields
3.5. Correlations of Musical Performance and MEG
4. Discussion
Supplementary Materials
Author Contributions
Funding
Institutional Review Board Statement
Informed Consent Statement
Data Availability Statement
Acknowledgments
Conflicts of Interest
References
- Mills, J. Assessing musical performance musically. Educ. Stud. 1991, 17, 173–181. [Google Scholar] [CrossRef]
- Seashore, C.E. Manual of Instructions and Interpretations for Measures of Musical Talent; Columbia Graphophone Company: London, UK, 1919. [Google Scholar]
- Gordon, E. Intermediate Measures of Music Audiation; GIA Publications: Chicago, IL, USA, 1982; Volume IL. [Google Scholar]
- Gordon, E. Advanced Measures of Music Audiation; Gia Publications: Chicago, IL, USA, 1989. [Google Scholar]
- Peretz, I.; Champod, A.S.; Hyde, K. Varieties of musical disorders. The Montreal Battery of Evaluation of Amusia. Ann. Acad. Sci. 2003, 999, 58–75. [Google Scholar] [CrossRef]
- Law, L.N.; Zentner, M. Assessing musical abilities objectively: Construction and validation of the profile of music perception skills. PLoS ONE 2012, 7, e52508. [Google Scholar] [CrossRef] [Green Version]
- Müllensiefen, D.; Gingras, B.; Musil, J.; Stewart, L. A New Tool for Measuring Musical Sophistication: The Goldsmiths Musical Sophistication Index. In Proceedings of the 12th International Conference on Music Perception and Cognition (ICMPC), Thessaloniki, Greece, 25 July 2012. [Google Scholar]
- Wallentin, M.; Nielsen, A.H.; Friis-Olivarius, M.; Vuust, C.; Vuust, P. The Musical Ear Test, a new reliable test for measuring musical competence. Learn. Individ. Differ. 2010, 20, 188–196. [Google Scholar] [CrossRef] [Green Version]
- Christiner, M.; Reiterer, S.M. Song and speech: Examining the link between singing talent and speech imitation ability. Front. Psychol. 2013, 4, 874. [Google Scholar] [CrossRef] [Green Version]
- Christiner, M.; Gross, C.; Seither-Preisler, A.; Schneider, P. The Melody of Speech: What the Melodic Perception of Speech Reveals about Language Performance and Musical Abilities. Languages 2021, 6, 132. [Google Scholar] [CrossRef]
- Larrouy-Maestri, P.; Lévêque, Y.; Schön, D.; Giovanni, A.; Morsomme, D. The evaluation of singing voice accuracy: A comparison between subjective and objective methods. J. Voice 2013, 27, 259.e1–259.e5. [Google Scholar] [CrossRef] [PubMed]
- Dalla Bella, S.; Giguere, J.F.; Peretz, I. Singing in congenital amusia. J. Acoust. Soc. Am. 2009, 126, 414–424. [Google Scholar] [CrossRef] [Green Version]
- Salvador, K. How can elementary teachers measure singing voice achievement? A critical review of assessments, 1994–2009. Update Appl. Res. Music. Educ. 2010, 29, 40–47. [Google Scholar] [CrossRef]
- Christiner, M. Musicality and Second Language Acquisition: Singing and Phonetic Language. Aptitude. Dissertation, University of Vienna, Vienna, Austria, 2020. [Google Scholar]
- Hornbach, C.M.; Taggart, C.C. The relationship between developmental tonal aptitude and singing achievement among kindergarten, first-, second-, and third-grade students. J. Res. Music. Educ. 2005, 53, 322–331. [Google Scholar] [CrossRef] [Green Version]
- Rutkowski, J.; Snell Miller, M. A longitudinal study of elementary children’s acquisition of their singing voices. Update Appl. Res. Music. Educ. 2002, 22, 5–14. [Google Scholar] [CrossRef]
- Christiner, M.; Reiterer, S.M. A Mozart is not a Pavarotti: Singers outperform instrumentalists on foreign accent imitation. Front. Hum. Neurosci. 2015, 9, 482. [Google Scholar] [CrossRef] [Green Version]
- Christiner, M.; Reiterer, S. Music, Song and Speech, Cognitive Individual Differences in Second Language Processing and Acquisition; John Benjamins Publishing: Amsterdam, The Netherlands, 2016; pp. 131–147. [Google Scholar] [CrossRef]
- Christiner, M.; Rüdegger, S.; Reiterer, S.M. Sing Chinese and tap Tagalog? Predicting individual differences in musical and phonetic aptitude using language families differing by sound-typology. Int. J. Multiling. 2018, 15, 455–471. [Google Scholar] [CrossRef] [Green Version]
- Christiner, M. Let the music speak: Examining the relationship between music and language aptitude in pre-school children. In Exploring Language Aptitude: Views from Psychology, the Language Sciences, and Cognitive Neuroscience; Springer: Berlin/Heidelberg, Germany, 2018; pp. 149–166. [Google Scholar]
- Moore, R.E.; Estis, J.; Gordon-Hickey, S.; Watts, C. Pitch discrimination and pitch matching abilities with vocal and nonvocal stimuli. J. Voice 2008, 22, 399–407. [Google Scholar] [CrossRef]
- Hutchins, S.; Moreno, S. The Linked Dual Representation model of vocal perception and production. Front. Psychol. 2013, 4, 825. [Google Scholar] [CrossRef] [PubMed] [Green Version]
- Demorest, S.M.; Pfordresher, P.Q.; Bella, S.D.; Hutchins, S.; Loui, P.; Rutkowski, J.; Welch, G.F. Methodological perspectives on singing accuracy: An introduction to the special issue on singing accuracy (Part 2). Music. Percept. Interdiscip. J. 2015, 32, 266–271. [Google Scholar] [CrossRef]
- Demorest, S.M.; Pfordresher, P.Q. Singing accuracy development from K-adult: A comparative study. Music. Percept. Interdiscip. J. 2015, 32, 293–302. [Google Scholar] [CrossRef]
- Loui, P.; Alsop, D.; Schlaug, G. Tone deafness: A new disconnection syndrome? J. Neurosci. 2009, 29, 10215–10220. [Google Scholar] [CrossRef]
- Hutchins, S.M.; Peretz, I. A frog in your throat or in your ear? Searching for the causes of poor singing. J. Exp. Psychol. Gen. 2012, 141, 76–97. [Google Scholar] [CrossRef] [Green Version]
- Berkowska, M.; Dalla Bella, S. Acquired and congenital disorders of sung performance: A review. Adv. Cogn. Psychol. 2009, 5, 69–83. [Google Scholar] [CrossRef]
- Buchsbaum, B.R.; Baldo, J.; Okada, K.; Berman, K.F.; Dronkers, N.; D’Esposito, M.; Hickok, G. Conduction aphasia, sensory-motor integration, and phonological short-term memory–an aggregate analysis of lesion and fMRI data. Brain Lang. 2011, 119, 119–128. [Google Scholar] [CrossRef] [Green Version]
- Falk, S.; Schreier, R.; Russo, F.A. Singing and Stuttering. In The Routledge Companion to Interdisciplinary Studies in Singing; Routledge: London, UK, 2020; pp. 50–60. [Google Scholar]
- Repp, B.H. Sensorimotor synchronization: A review of the tapping literature. Psychon. Bull. Rev. 2005, 12, 969–992. [Google Scholar] [CrossRef] [PubMed] [Green Version]
- Dalla Bella, S.; Farrugia, N.; Benoit, C.-E.; Begel, V.; Verga, L.; Harding, E.; Kotz, S.A. BAASTA: Battery for the assessment of auditory sensorimotor and timing abilities. Behav. Res. Methods 2017, 49, 1128–1145. [Google Scholar] [CrossRef] [Green Version]
- Fujii, S.; Schlaug, G. The Harvard Beat Assessment Test (H-BAT): A battery for assessing beat perception and production and their dissociation. Front. Hum. Neurosci. 2013, 7, 771. [Google Scholar] [CrossRef] [PubMed] [Green Version]
- Repp, B.H. Sensorimotor synchronization and perception of timing: Effects of music training and task experience. Hum. Mov. Sci. 2010, 29, 200–213. [Google Scholar] [CrossRef]
- Altenmuller, E. Neurology of musical performance. Clin. Med. 2008, 8, 410–413. [Google Scholar] [CrossRef]
- Schneider, P.; Sluming, V.; Roberts, N.; Scherg, M.; Goebel, R.; Specht, H.J.; Dosch, H.G.; Bleeck, S.; Stippich, C.; Rupp, A. Structural and functional asymmetry of lateral Heschl’s gyrus reflects pitch perception preference. Nat. Neurosci. 2005, 8, 1241–1247. [Google Scholar] [CrossRef]
- Foster, N.E.; Zatorre, R.J. Cortical structure predicts success in performing musical transformation judgments. Neuroimage 2010, 53, 26–36. [Google Scholar] [CrossRef]
- Wengenroth, M.; Blatow, M.; Heinecke, A.; Reinhardt, J.; Stippich, C.; Hofmann, E.; Schneider, P. Increased volume and function of right auditory cortex as a marker for absolute pitch. Cereb. Cortex 2014, 24, 1127–1137. [Google Scholar] [CrossRef] [PubMed] [Green Version]
- Bangert, M.; Peschel, T.; Schlaug, G.; Rotte, M.; Drescher, D.; Hinrichs, H.; Heinze, H.J.; Altenmuller, E. Shared networks for auditory and motor processing in professional pianists: Evidence from fMRI conjunction. Neuroimage 2006, 30, 917–926. [Google Scholar] [CrossRef]
- Engel, A.; Bangert, M.; Horbank, D.; Hijmans, B.S.; Wilkens, K.; Keller, P.E.; Keysers, C. Learning piano melodies in visuo-motor or audio-motor training conditions and the neural correlates of their cross-modal transfer. NeuroImage 2012, 63, 966–978. [Google Scholar] [CrossRef]
- Pantev, C.; Herholz, S.C. Plasticity of the human auditory cortex related to musical training. Neurosci. Biobehav. Rev. 2011, 35, 2140–2154. [Google Scholar] [CrossRef]
- Plakke, B.; Romanski, L.M. Auditory connections and functions of prefrontal cortex. Front. Neurosci. 2014, 8, 199. [Google Scholar] [CrossRef] [PubMed] [Green Version]
- Wong, P.C.; Warrier, C.M.; Penhune, V.B.; Roy, A.K.; Sadehh, A.; Parrish, T.B.; Zatorre, R.J. Volume of left Heschl’s Gyrus and linguistic pitch learning. Cereb. Cortex 2008, 18, 828–836. [Google Scholar] [CrossRef] [Green Version]
- Golestani, N.; Molko, N.; Dehaene, S.; LeBihan, D.; Pallier, C. Brain structure predicts the learning of foreign speech sounds. Cereb. Cortex 2007, 17, 575–582. [Google Scholar] [CrossRef] [Green Version]
- Hartwigsen, G.; Baumgaertner, A.; Price, C.J.; Koehnke, M.; Ulmer, S.; Siebner, H.R. Phonological decisions require both the left and right supramarginal gyri. Proc. Natl. Acad. Sci. USA 2010, 107, 16494–16499. [Google Scholar] [CrossRef] [PubMed] [Green Version]
- Schön, D.; Magne, C.; Besson, M. The music of speech: Music training facilitates pitch processing in both music and language. Psychophysiology 2004, 41, 341–349. [Google Scholar] [CrossRef] [Green Version]
- Ding, N.; Patel, A.D.; Chen, L.; Butler, H.; Luo, C.; Poeppel, D. Temporal modulations in speech and music. Neurosci. Biobehav. Rev. 2017, 81, 181–187. [Google Scholar] [CrossRef] [PubMed]
- Fiveash, A.; Bedoin, N.; Gordon, R.L.; Tillmann, B. Processing rhythm in speech and music: Shared mechanisms and implications for developmental speech and language disorders. Neuropsychology 2021, 35, 771–791. [Google Scholar] [CrossRef] [PubMed]
- Fujii, S.; Wan, C.Y. The Role of Rhythm in Speech and Language Rehabilitation: The SEP Hypothesis. Front. Hum. Neurosci. 2014, 8, 777. [Google Scholar] [CrossRef] [Green Version]
- Patel, A.D. Why would musical training benefit the neural encoding of speech? The OPERA hypothesis. Front. Psychol. 2011, 2, 142. [Google Scholar] [CrossRef] [Green Version]
- Tierney, A.; Kraus, N. Auditory-motor entrainment and phonological skills: Precise auditory timing hypothesis (PATH). Front. Hum. Neurosci. 2014, 8, 949. [Google Scholar] [CrossRef] [Green Version]
- Serrallach, B.; Gross, C.; Bernhofs, V.; Engelmann, D.; Benner, J.; Gundert, N.; Blatow, M.; Wengenroth, M.; Seitz, A.; Brunner, M.; et al. Neural Biomarkers for Dyslexia, ADHD, and ADD in the Auditory Cortex of Children. Front. Neurosci. 2016, 10, 324. [Google Scholar] [CrossRef] [Green Version]
- Turker, S.; Reiterer, S.M.; Schneider, P.; Seither-Preisler, A. Auditory Cortex Morphology Predicts Language Learning Potential in Children and Teenagers. Front. Neurosci. 2019, 13, 824. [Google Scholar] [CrossRef] [Green Version]
- Seither-Preisler, A.; Parncutt, R.; Schneider, P. Size and synchronization of auditory cortex promotes musical, literacy, and attentional skills in children. J. Neurosci. 2014, 34, 10937–10949. [Google Scholar] [CrossRef] [Green Version]
- Raschle, N.M.; Chang, M.; Gaab, N. Structural brain alterations associated with dyslexia predate reading onset. Neuroimage 2011, 57, 742–749. [Google Scholar] [CrossRef] [Green Version]
- Power, A.J.; Mead, N.; Barnes, L.; Goswami, U. Neural entrainment to rhythmic speech in children with developmental dyslexia. Front. Hum. Neurosci. 2013, 7, 777. [Google Scholar] [CrossRef] [PubMed] [Green Version]
- Polanczyk, G.; de Lima, M.S.; Horta, B.L.; Biederman, J.; Rohde, L.A. The worldwide prevalence of ADHD: A systematic review and metaregression analysis. Am. J. Psychiatry 2007, 164, 942–948. [Google Scholar] [CrossRef] [PubMed]
- Shaywitz, S.E.; Shaywitz, B.A. Dyslexia (specific reading disability). Pediatr. Rev. 2003, 24, 147–153. [Google Scholar] [CrossRef] [PubMed]
- Kaplan, B.J.; Dewey, D.M.; Crawford, S.G.; Wilson, B.N. The term comorbidity is of questionable value in reference to developmental disorders: Data and theory. J. Learn. Disabil. 2001, 34, 555–565. [Google Scholar] [CrossRef] [PubMed]
- Mueller, K.L.; Tomblin, J.B. Examining the comorbidity of language disorders and ADHD. Top. Lang. Disord. 2012, 32, 228–246. [Google Scholar] [CrossRef] [Green Version]
- Redmond, S.M. Language Impairment in the Attention-Deficit/Hyperactivity Disorder Context. J. Speech Lang. Hear. Res. 2016, 59, 133–142. [Google Scholar] [CrossRef] [Green Version]
- Bishop, D.V.; Carlyon, R.P.; Deeks, J.M.; Bishop, S.J. Auditory temporal processing impairment: Neither necessary nor sufficient for causing language impairment in children. J. Speech Lang. Hear. Res. 1999, 42, 1295–1310. [Google Scholar] [CrossRef]
- Hämäläinen, J.A.; Lohvansuu, K.; Ervast, L.; Leppänen, P.H. Event-related potentials to tones show differences between children with multiple risk factors for dyslexia and control children before the onset of formal reading instruction. Int. J. Psychophysiol. 2015, 95, 101–112. [Google Scholar] [CrossRef] [Green Version]
- Farmer, M.E.; Klein, R.M. The evidence for a temporal processing deficit linked to dyslexia: A review. Psychon. Bull. Rev. 1995, 2, 460–493. [Google Scholar] [CrossRef] [Green Version]
- Overy, K. Dyslexia and music. From timing deficits to musical intervention. Ann. Acad. Sci. 2003, 999, 497–505. [Google Scholar] [CrossRef] [PubMed]
- Huss, M.; Verney, J.P.; Fosker, T.; Mead, N.; Goswami, U. Music, rhythm, rise time perception and developmental dyslexia: Perception of musical meter predicts reading and phonology. Cortex 2011, 47, 674–689. [Google Scholar] [CrossRef] [Green Version]
- Lee, H.-Y.; Sie, Y.-S.; Chen, S.-C.; Cheng, M.-C. The music perception performance of children with and without dyslexia in Taiwan. Psychol. Rep. 2015, 116, 13–22. [Google Scholar] [CrossRef] [PubMed]
- Goswami, U. A temporal sampling framework for developmental dyslexia. Trends Cogn. Sci. 2011, 15, 3–10. [Google Scholar] [CrossRef]
- Hornickel, J.; Kraus, N. Unstable representation of sound: A biological marker of dyslexia. J. Neurosci. 2013, 33, 3500–3504. [Google Scholar] [CrossRef] [PubMed] [Green Version]
- Lehongre, K.; Morillon, B.; Giraud, A.-L.; Ramus, F. Impaired auditory sampling in dyslexia: Further evidence from combined fMRI and EEG. Front. Hum. Neurosci. 2013, 7, 454. [Google Scholar] [CrossRef] [PubMed] [Green Version]
- Bégel, V.; Bachrach, A.; Dalla Bella, S.; Laroche, J.; Clément, S.; Riquet, A.; Dellacherie, D. Dance improves motor, cognitive and social skills in children with developmental cerebellar anomalies. Cerebellum 2021. [Google Scholar] [CrossRef]
- Moura, O.; Simões, M.R.; Pereira, M. Executive functioning in children with developmental dyslexia. Clin. Neuropsychol. 2014, 28, 20–41. [Google Scholar] [CrossRef] [PubMed] [Green Version]
- Bégel, V.; Dalla Bella, S.; Devignes, Q.; Vandenbergue, M.; Lemaître, M.-P.; Dellacherie, D. Rhythm as an Independent Determinant of Developmental Dyslexia; American Psychological Association: Washington, DC, USA, 2020. [Google Scholar]
- ICD-10-GM Version 2020, Systematisches Verzeichnis, Internationale statistische Klassifikation der Krankheiten und verwandter Gesundheitsprobleme. Available online: https://www.dimdi.de/static/de/klassifikationen/icd/icd-10-gm/kode-suche/htmlgm2020/ (accessed on 20 September 2019).
- Ghanizadeh, A. Sensory processing problems in children with ADHD, a systematic review. Psychiatry Investig. 2011, 8, 89–94. [Google Scholar] [CrossRef] [PubMed] [Green Version]
- Chermak, G.D.; Hall, J.W., III; Musiek, F.E. Differential diagnosis and management of central auditory processing disorder and attention deficit hyperactivity disorder. J. Am. Acad. Audiol. 1999, 10, 289–303. [Google Scholar]
- Carrer, L.R. Music and Sound in Time Processing of Children with ADHD. Front. Psychiatry 2015, 6, 127. [Google Scholar] [CrossRef] [Green Version]
- Noreika, V.; Falter, C.M.; Rubia, K. Timing deficits in attention-deficit/hyperactivity disorder (ADHD): Evidence from neurocognitive and neuroimaging studies. Neuropsychologia 2013, 51, 235–266. [Google Scholar] [CrossRef]
- Falter, C.M.; Noreika, V. Interval timing deficits and abnormal cognitive development. Front. Integr. Neurosci. 2011, 5, 26. [Google Scholar] [CrossRef] [Green Version]
- Smith, A.; Taylor, E.; Rogers, J.W.; Newman, S.; Rubia, K. Evidence for a pure time perception deficit in children with ADHD. J. Child Psychol. Psychiatry 2002, 43, 529–542. [Google Scholar] [CrossRef] [PubMed]
- Lesiuk, T. Music perception ability of children with executive function deficits. Psychol. Music. 2015, 43, 530–544. [Google Scholar] [CrossRef]
- Hove, M.J.; Gravel, N.; Spencer, R.M.C.; Valera, E.M. Finger tapping and pre-attentive sensorimotor timing in adults with ADHD. Exp. Brain Res. 2017, 235, 3663–3672. [Google Scholar] [CrossRef]
- Kamath, M.; Dahm, C.; Tucker, J.; Huang-Pollock, C.; Etter, N.; Neely, K.A. Sensory profiles in adults with and without ADHD. Res. Dev. Disabil. 2020, 104, 103696. [Google Scholar] [CrossRef] [PubMed]
- Bailey, T. Beyond DSM: The role of auditory processing in attention and its disorders. Appl. Neuropsychol. Child 2012, 1, 112–120. [Google Scholar] [CrossRef] [PubMed]
- Puyjarinet, F.; Begel, V.; Lopez, R.; Dellacherie, D.; Dalla Bella, S. Children and adults with Attention-Deficit/Hyperactivity Disorder cannot move to the beat. Sci. Rep. 2017, 7, 11550. [Google Scholar] [CrossRef] [Green Version]
- Lenhard, W.; Schneider, W. Elfe 1-6–Ein Leseverständnistest für Erst-bis Sechstklässler; Hogrefe: Göttingen, Germany, 2006. [Google Scholar]
- May, P. HSP 1–10. Hamburger Schreib-Probe. Diagnose Orthographischer Kompetenz; VPM: Hamburg, Germany, 2012. [Google Scholar]
- Brunner, M.; Baeumer, C.; Dockter, S.; Feldhusen, F.; Plinkert, P.; Proeschel, U. Heidelberg Phoneme Discrimination Test (HLAD): Normative data for children of the third grade and correlation with spelling ability. Folia Phoniatr. Et Logop. 2008, 60, 157–161. [Google Scholar] [CrossRef]
- Goodyear, P.; Hynd, G.W. Attention-deficit disorder with (ADD/H) and without (ADD/WO) hyperactivity: Behavioral and neuropsychological differentiation. J. Clin. Child Adolesc. Psychol. 1992, 21, 273–305. [Google Scholar] [CrossRef]
- Yoshimasu, K.; Barbaresi, W.J.; Colligan, R.C.; Killian, J.M.; Voigt, R.G.; Weaver, A.L.; Katusic, S.K. Gender, attention-deficit/hyperactivity disorder, and reading disability in a population-based birth cohort. Pediatrics 2010, 126, e788–e795. [Google Scholar] [CrossRef] [Green Version]
- McPherson, G.E. The assessment of musical performance: Development and validation of five new measures. Psychol. Music. 1995, 23, 142–161. [Google Scholar] [CrossRef]
- McPherson, G.E.; Thompson, W.F. Assessing music performance: Issues and influences. Res. Stud. Music. Educ. 1998, 10, 12–24. [Google Scholar] [CrossRef]
- Steenstrup, K.; Haumann, N.T.; Kleber, B.; Camarasa, C.; Vuust, P.; Petersen, B. Imagine, Sing, Play- Combined Mental, Vocal and Physical Practice Improves Musical Performance. Front. Psychol. 2021, 12, 757052. [Google Scholar] [CrossRef]
- Vorberg, D.; Hambuch, R. On the temporal control of rhythmic performance. Atten. Perform. 1978, 7, 535–555. [Google Scholar]
- Drake, C.; Palmer, C. Skill acquisition in music performance: Relations between planning and temporal control. Cognition 2000, 74, 1–32. [Google Scholar] [CrossRef]
- Palmer, C. Mapping musical thought to musical performance. J. Exp. Psychol. Hum. Percept. Perform. 1989, 15, 331–346. [Google Scholar] [CrossRef] [PubMed]
- Sundberg, J.; Prame, E.; Iwarsson, J. Replicability and accuracy of pitch patterns in professional singers. Vocal Fold Physiol. Control. Complex. Chaos 1996, 36, 291–306. [Google Scholar]
- Shuter-Dyson, R. Musical ability. In The Psychology of Music; Deutsch, D., Ed.; Academic Press: San Diego, CA, USA, 1999. [Google Scholar]
- Krumhansl, C.L. Rhythm and pitch in music cognition. Psychol. Bull. 2000, 126, 159–179. [Google Scholar] [CrossRef]
- Bernhofs, V. Pitch and Rhythm Structures for Aural Attention Training; Jazepa Vitola Latvijas Muzikas Akademija: Riga, Latvia, 2013. [Google Scholar]
- Tinsley, H.E.; Workman, K.R.; Kass, R.A. Factor analysis of the domain of client expectancies about counseling. J. Couns. Psychol. 1980, 27, 561. [Google Scholar] [CrossRef]
- Hamalainen, M.S.; Sarvas, J. Feasibility of the homogeneous head model in the interpretation of neuromagnetic fields. Phys. Med. Biol. 1987, 32, 91–97. [Google Scholar] [CrossRef]
- Sarvas, J. Basic mathematical and electromagnetic concepts of the biomagnetic inverse problem. Phys. Med. Biol. 1987, 32, 11–22. [Google Scholar] [CrossRef]
- Scherg, M. Fundamentals of dipole source potential analysis. Auditory evoked magnetic fields and electric potentials. Adv. Audiol. 1990, 6, 40–69. [Google Scholar]
- Schneider, P.; Scherg, M.; Dosch, H.G.; Specht, H.J.; Gutschalk, A.; Rupp, A. Morphology of Heschl’s gyrus reflects enhanced activation in the auditory cortex of musicians. Nat. Neurosci. 2002, 5, 688–694. [Google Scholar] [CrossRef]
- Sharma, A.; Kraus, N.; McGee, T.J.; Nicol, T.G. Developmental changes in P1 and N1 central auditory responses elicited by consonant-vowel syllables. Electroencephalogr. Clin. Neurophysiol./Evoked Potentials Sect. 1997, 104, 540–545. [Google Scholar] [CrossRef]
- Ponton, C.W.; Don, M.; Eggermont, J.J.; Waring, M.D.; Masuda, A. Maturation of human cortical auditory function: Differences between normal-hearing children and children with cochlear implants. Ear. Hear. 1996, 17, 430–437. [Google Scholar] [CrossRef]
- Field, A. Discovering Statistics Using IBM SPSS Statistics; SAGE Publications: New York, NY, USA, 2013. [Google Scholar]
- Warner, R.M. Applied Statistics I: Basic Bivariate Techniques; SAGE Publications: New York, NY, USA, 2020. [Google Scholar]
- Hickey, M.; Colwell, R.; Richardson, C. The New Handbook of Research on Music Teaching and Learning; Oxford University Press: Oxford, UK, 2002. [Google Scholar]
- White, H.A.; Shah, P. Scope of semantic activation and innovative thinking in college students with ADHD. Creat. Res. J. 2016, 28, 275–282. [Google Scholar] [CrossRef]
- Hoogman, M.; Stolte, M.; Baas, M.; Kroesbergen, E. Creativity and ADHD: A review of behavioral studies, the effect of psychostimulants and neural underpinnings. Neurosci. Biobehav. Rev. 2020, 119, 66–85. [Google Scholar] [CrossRef]
- Zabelina, D.; Saporta, A.; Beeman, M. Flexible or leaky attention in creative people? Distinct patterns of attention for different types of creative thinking. Mem. Cognit. 2016, 44, 488–498. [Google Scholar] [CrossRef] [Green Version]
- Martinez Zaragoza, F. Impulsivity, breadth of attention and creative performance. An empirical study with university students. An. De Psicol./Ann. Psychol. 2010, 26, 238–245. [Google Scholar]
- Petzold, H.G.; Müller, L. Integrative Kinder-und Jugendlichenpsychotherapie: Protektive Faktoren und Resilienzen in der Diagnostischen und Therapeutischen Praxis. Psychother. Forum 2004, 12, 185–196. [Google Scholar] [CrossRef]
- Erbeli, F.; Peng, P.; Rice, M. No Evidence of Creative Benefit Accompanying Dyslexia: A Meta-Analysis. J. Learn. Disabil. 2021, 222194211010350. [Google Scholar] [CrossRef]
- Hamalainen, J.A.; Salminen, H.K.; Leppanen, P.H. Basic auditory processing deficits in dyslexia: Systematic review of the behavioral and event-related potential/ field evidence. J. Learn. Disabil. 2013, 46, 413–427. [Google Scholar] [CrossRef] [PubMed]
- Heiervang, E.; Stevenson, J.; Hugdahl, K. Auditory processing in children with dyslexia. J. Child Psychol. Psychiatry 2002, 43, 931–938. [Google Scholar] [CrossRef]
- Tallal, P.; Miller, S.; Fitch, R.H. Neurobiological basis of speech: A case for the preeminence of temporal processing. Ann. Acad. Sci. 1993, 682, 27–47. [Google Scholar] [CrossRef] [PubMed]
- Thomson, J.M.; Leong, V.; Goswami, U. Auditory processing interventions and developmental dyslexia: A comparison of phonemic and rhythmic approaches. Read. Writ. 2013, 26, 139–161. [Google Scholar] [CrossRef]
- Corriveau, K.H.; Goswami, U. Rhythmic motor entrainment in children with speech and language impairments: Tapping to the beat. Cortex 2009, 45, 119–130. [Google Scholar] [CrossRef] [PubMed]
- Thomson, J.M.; Goswami, U. Rhythmic processing in children with developmental dyslexia: Auditory and motor rhythms link to reading and spelling. J. Physiol. Paris 2008, 102, 120–129. [Google Scholar] [CrossRef]
- Sharma, A.; Campbell, J.; Cardon, G. Developmental and cross-modal plasticity in deafness: Evidence from the P1 and N1 event related potentials in cochlear implanted children. Int. J. Psychophysiol. 2015, 95, 135–144. [Google Scholar] [CrossRef] [PubMed] [Green Version]
- Woldorff, M.G.; Hillyard, S.A. Modulation of early auditory processing during selective listening to rapidly presented tones. Electroencephalogr. Clin. Neurophysiol. 1991, 79, 170–191. [Google Scholar] [CrossRef]
- Sharma, A.; Martin, K.; Roland, P.; Bauer, P.; Sweeney, M.H.; Gilley, P.; Dorman, M. P1 latency as a biomarker for central auditory development in children with hearing impairment. J. Am. Acad. Audiol. 2005, 16, 564–573. [Google Scholar] [CrossRef]
- Leong, V.; Goswami, U. Impaired extraction of speech rhythm from temporal modulation patterns in speech in developmental dyslexia. Front. Hum. Neurosci. 2014, 8, 96. [Google Scholar] [CrossRef] [Green Version]
- Sergeant, J.A.; Geurts, H.; Huijbregts, S.; Scheres, A.; Oosterlaan, J. The top and the bottom of ADHD: A neuropsychological perspective. Neurosci. Biobehav. Rev. 2003, 27, 583–592. [Google Scholar] [CrossRef]
- Johnstone, S.J.; Barry, R.J.; Anderson, J.W. Topographic distribution and developmental timecourse of auditory event-related potentials in two subtypes of attention-deficit hyperactivity disorder. Int. J. Psychophysiol. 2001, 42, 73–94. [Google Scholar] [CrossRef]
- Halperin, J.M.; Healey, D.M. The influences of environmental enrichment, cognitive enhancement, and physical exercise on brain development: Can we alter the developmental trajectory of ADHD? Neurosci. Biobehav. Rev. 2011, 35, 621–634. [Google Scholar] [CrossRef] [PubMed] [Green Version]
- Rueda, M.R.; Rothbart, M.K.; McCandliss, B.D.; Saccomanno, L.; Posner, M.I. Training, maturation, and genetic influences on the development of executive attention. Proc. Natl. Acad. Sci. USA 2005, 102, 14931–14936. [Google Scholar] [CrossRef] [Green Version]
- Kumar, P.; Kumar Gupta, R. Cortical processing of speech in children with dyslexia. Int. J. Health Sci. Res. 2014, 4, 221–228. [Google Scholar]
- Pinkerton, F.; Watson, D.R.; McClelland, R.J. A neurophysiological study of children with reading, writing and spelling difficulties. Dev. Med. Child Neurol. 1989, 31, 569–581. [Google Scholar] [CrossRef] [PubMed]
- Baumann, S.; Meyer, M.; Jäncke, L. Enhancement of auditory-evoked potentials in musicians reflects an influence of expertise but not selective attention. J. Cogn. Neurosci. 2008, 20, 2238–2249. [Google Scholar] [CrossRef] [PubMed] [Green Version]
- Zatorre, R.J.; Belin, P.; Penhune, V.B. Structure and function of auditory cortex: Music and speech. Trends Cogn. Sci. 2002, 6, 37–46. [Google Scholar] [CrossRef]
- Lu, J.; Yang, H.; Zhang, X.; He, H.; Luo, C.; Yao, D. The Brain Functional State of Music Creation: An fMRI Study of Composers. Sci. Rep. 2015, 5, 12277. [Google Scholar] [CrossRef] [Green Version]
- Bengtsson, S.L.; Nagy, Z.; Skare, S.; Forsman, L.; Forssberg, H.; Ullén, F. Extensive piano practicing has regionally specific effects on white matter development. Nat. Neurosci. 2005, 8, 1148–1150. [Google Scholar] [CrossRef] [PubMed]
- Halwani, G.F.; Loui, P.; Ruber, T.; Schlaug, G. Effects of practice and experience on the arcuate fasciculus: Comparing singers, instrumentalists, and non-musicians. Front. Psychol. 2011, 2, 156. [Google Scholar] [CrossRef] [Green Version]
- Oechslin, M.S.; Imfeld, A.; Loenneker, T.; Meyer, M.; Jäncke, L. The plasticity of the superior longitudinal fasciculus as a function of musical expertise: A diffusion tensor imaging study. Front. Hum. Neurosci. 2010, 3, 76. [Google Scholar] [CrossRef] [Green Version]
- Pinho, A.L.; de Manzano, Ö.; Fransson, P.; Eriksson, H.; Ullén, F. Connecting to create: Expertise in musical improvisation is associated with increased functional connectivity between premotor and prefrontal areas. J. Neurosci. 2014, 34, 6156–6163. [Google Scholar] [CrossRef] [PubMed] [Green Version]
- Elmer, S.; Hänggi, J.; Jäncke, L. Processing demands upon cognitive, linguistic, and articulatory functions promote grey matter plasticity in the adult multilingual brain: Insights from simultaneous interpreters. Cortex 2014, 54, 179–189. [Google Scholar] [CrossRef] [PubMed]
- Elmer, S.; Rogenmoser, L.; Kühnis, J.; Jäncke, L. Bridging the gap between perceptual and cognitive perspectives on absolute pitch. J. Neurosci. 2015, 35, 366–371. [Google Scholar] [CrossRef] [PubMed] [Green Version]
- Overy, K.; Norton, A.C.; Cronin, K.T.; Gaab, N.; Alsop, D.C.; Winner, E.; Schlaug, G. Imaging melody and rhythm processing in young children. Neuroreport 2004, 15, 1723–1726. [Google Scholar] [CrossRef]
- Shahin, A.; Roberts, L.E.; Trainor, L.J. Enhancement of auditory cortical development by musical experience in children. Neuroreport 2004, 15, 1917–1921. [Google Scholar] [CrossRef] [PubMed]
- Shahin, A.; Roberts, L.E.; Pantev, C.; Trainor, L.J.; Ross, B. Modulation of P2 auditory-evoked responses by the spectral complexity of musical sounds. Neuroreport 2005, 16, 1781–1785. [Google Scholar] [CrossRef]
- Kraus, N.; Chandrasekaran, B. Music training for the development of auditory skills. Nat. Rev. Neurosci. 2010, 11, 599–605. [Google Scholar] [CrossRef] [PubMed]
- Kraus, N.; White-Schwoch, T. Neurobiology of everyday communication: What have we learned from music? Neuroscientist 2017, 23, 287–298. [Google Scholar] [CrossRef]
- Magne, C.; Schön, D.; Besson, M. Musician children detect pitch violations in both music and language better than nonmusician children: Behavioral and electrophysiological approaches. J. Cogn. Neurosci. 2006, 18, 199–211. [Google Scholar] [CrossRef] [PubMed]
- Wong, P.C.; Skoe, E.; Russo, N.M.; Dees, T.; Kraus, N. Musical experience shapes human brainstem encoding of linguistic pitch patterns. Nat. Neurosci. 2007, 10, 420–422. [Google Scholar] [CrossRef] [Green Version]
- Franklin, M.S.; Sledge Moore, K.; Yip, C.-Y.; Jonides, J.; Rattray, K.; Moher, J. The effects of musical training on verbal memory. Psychol. Music. 2008, 36, 353–365. [Google Scholar] [CrossRef] [Green Version]
- Jentschke, S.; Koelsch, S. Musical training modulates the development of syntax processing in children. Neuroimage 2009, 47, 735–744. [Google Scholar] [CrossRef]
- Kraus, N.; Skoe, E.; Parbery-Clark, A.; Ashley, R. Experience-induced malleability in neural encoding of pitch, timbre, and timing: Implications for language and music. Ann. Acad. Sci. 2009, 1169, 543. [Google Scholar] [CrossRef] [PubMed] [Green Version]
- Moreno, S.; Marques, C.; Santos, A.; Santos, M.; Castro, S.L.; Besson, M. Musical training influences linguistic abilities in 8-year-old children: More evidence for brain plasticity. Cereb. Cortex 2009, 19, 712–723. [Google Scholar] [CrossRef] [Green Version]
- Piro, J.M.; Ortiz, C. The effect of piano lessons on the vocabulary and verbal sequencing skills of primary grade students. Psychol. Music. 2009, 37, 325–347. [Google Scholar] [CrossRef] [Green Version]
- Musso, M.; Fürniss, H.; Glauche, V.; Urbach, H.; Weiller, C.; Rijntjes, M. Musicians use speech-specific areas when processing tones: The key to their superior linguistic competence? Behav. Brain Res. 2020, 390, 112662. [Google Scholar] [CrossRef]
- Jabusch, H.C.; Alpers, H.; Kopiez, R.; Vauth, H.; Altenmuller, E. The influence of practice on the development of motor skills in pianists: A longitudinal study in a selected motor task. Hum. Mov. Sci. 2009, 28, 74–84. [Google Scholar] [CrossRef] [PubMed]
- Overy, K.; Molnar-Szakacs, I. Being together in time: Musical experience and the mirror neuron system. Music. Percept. 2009, 26, 489–504. [Google Scholar] [CrossRef]
- Flaugnacco, E.; Lopez, L.; Terribili, C.; Zoia, S.; Buda, S.; Tilli, S.; Monasta, L.; Montico, M.; Sila, A.; Ronfani, L.; et al. Rhythm perception and production predict reading abilities in developmental dyslexia. Front. Hum. Neurosci. 2014, 8, 392. [Google Scholar] [CrossRef] [PubMed] [Green Version]
- Forgeard, M.; Schlaug, G.; Norton, A.; Rosam, C.; Iyengar, U.; Winner, E. The relation between music and phonological processing in normal-reading children and children with dyslexia. Music. Percept. 2008, 25, 383–390. [Google Scholar] [CrossRef]
- Overy, K.; Nicolson, R.I.; Fawcett, A.J.; Clarke, E.F. Dyslexia and music: Measuring musical timing skills. Dyslexia 2003, 9, 18–36. [Google Scholar] [CrossRef]
- Goswami, U.; Huss, M.; Mead, N.; Fosker, T.; Verney, J.P. Perception of patterns of musical beat distribution in phonological developmental dyslexia: Significant longitudinal relations with word reading and reading comprehension. Cortex 2013, 49, 1363–1376. [Google Scholar] [CrossRef] [PubMed]
- Przybylski, L.; Bedoin, N.; Krifi-Papoz, S.; Herbillon, V.; Roch, D.; Leculier, L.; Kotz, S.A.; Tillmann, B. Rhythmic auditory stimulation influences syntactic processing in children with developmental language disorders. Neuropsychology 2013, 27, 121–131. [Google Scholar] [CrossRef] [Green Version]
- Slater, J.; Tierney, A.; Kraus, N. At-risk elementary school children with one year of classroom music instruction are better at keeping a beat. PLoS ONE 2013, 8, e77250. [Google Scholar] [CrossRef] [Green Version]
- Weiss, A.H.; Granot, R.Y.; Ahissar, M. The enigma of dyslexic musicians. Neuropsychologia 2014, 54, 28–40. [Google Scholar] [CrossRef] [PubMed]
- Bishop-Liebler, P.; Welch, G.; Huss, M.; Thomson, J.M.; Goswami, U. Auditory temporal processing skills in musicians with dyslexia. Dyslexia 2014, 20, 261–279. [Google Scholar] [CrossRef]
- Schellenberg, E.G. Music lessons enhance IQ. Psychol. Sci. 2004, 15, 511–514. [Google Scholar] [CrossRef]
- Hyde, K.L.; Lerch, J.; Norton, A.; Forgeard, M.; Winner, E.; Evans, A.C.; Schlaug, G. Musical training shapes structural brain development. J. Neurosci. 2009, 29, 3019–3025. [Google Scholar] [CrossRef] [PubMed]
- Herholz, S.C.; Zatorre, R.J. Musical training as a framework for brain plasticity: Behavior, function, and structure. Neuron 2012, 76, 486–502. [Google Scholar] [CrossRef] [Green Version]
- Moreno, S.; Bidelman, G.M. Examining neural plasticity and cognitive benefit through the unique lens of musical training. Hear. Res. 2014, 308, 84–97. [Google Scholar] [CrossRef]
- Trainor, L.J.; Shahin, A.J.; Robertsa, L.E. Understanding the Benefits of Musical Training. Neurosci. Music. III: Disord. Plast. 2009, 1169, 133. [Google Scholar] [CrossRef] [PubMed]
- Bangert, M.; Haeusler, U.; Altenmüller, E. On practice: How the brain connects piano keys and piano sounds. Ann. New York Acad. Sci. 2001, 930, 425–428. [Google Scholar] [CrossRef] [PubMed]
- Chen, J.L.; Penhune, V.B.; Zatorre, R.J. Moving on time: Brain network for auditory-motor synchronization is modulated by rhythm complexity and musical training. J. Cogn. Neurosci. 2008, 20, 226–239. [Google Scholar] [CrossRef]
- Jancke, L.; Gaab, N.; Wustenberg, T.; Scheich, H.; Heinze, H.J. Short-term functional plasticity in the human auditory cortex: An fMRI study. Cogn. Brain Re.s 2001, 12, 479–485. [Google Scholar] [CrossRef]
- Jancke, L. The plastic human brain. Restor. Neurol. Neurosci. 2009, 27, 521–538. [Google Scholar] [CrossRef]
- Münte, T.F.; Altenmüller, E.; Jäncke, L. The musician’s brain as a model of neuroplasticity. Nat. Rev. Neurosci. 2002, 3, 473–478. [Google Scholar] [CrossRef] [PubMed]
- Nager, W.; Franke, T.; Wagner-Altendorf, T.; Altenmüller, E.; Münte, T.F. Musical Experience Shapes Neural Processing. Z. Neuropsychol. 2020, 31, 81–85. [Google Scholar] [CrossRef]
- Sluming, V.; Brooks, J.; Howard, M.; Downes, J.J.; Roberts, N. Broca’s area supports enhanced visuospatial cognition in orchestral musicians. J. Neurosci. 2007, 27, 3799–3806. [Google Scholar] [CrossRef] [PubMed]
- Strait, D.L.; Kraus, N. Biological impact of auditory expertise across the life span: Musicians as a model of auditory learning. Hear. Res. 2014, 308, 109–121. [Google Scholar] [CrossRef] [Green Version]
- Vaquero, L.; Hartmann, K.; Ripolles, P.; Rojo, N.; Sierpowska, J.; Francois, C.; Camara, E.; van Vugt, F.T.; Mohammadi, B.; Samii, A.; et al. Structural neuroplasticity in expert pianists depends on the age of musical training onset. Neuroimage 2016, 126, 106–119. [Google Scholar] [CrossRef]
- Vuust, P.; Brattico, E.; Seppanen, M.; Naatanen, R.; Tervaniemi, M. Practiced musical style shapes auditory skills. Ann. Acad. Sci. 2012, 1252, 139–146. [Google Scholar] [CrossRef] [PubMed]
- Wan, C.Y.; Schlaug, G. Music making as a tool for promoting brain plasticity across the life span. Neuroscientist 2010, 16, 566–577. [Google Scholar] [CrossRef] [PubMed] [Green Version]
- Jackson, N.A. A survey of music therapy methods and their role in the treatment of early elementary school children with ADHD. J. Music. Ther. 2003, 40, 302–323. [Google Scholar] [CrossRef]
- Rickson, D.J. Instructional and improvisational models of music therapy with adolescents who have attention deficit hyperactivity disorder (ADHD): A comparison of the effects on motor impulsivity. J. Music. Ther. 2006, 43, 39–62. [Google Scholar] [CrossRef]
- Rothmann, K.; Hillmer, J.M.; Hosser, D. Evaluation of the Musical Concentration Training with Pepe (MusiKo mit Pepe) for children with attention deficits. Z. Kinder. Jugendpsychiatr. Psychother. 2014, 42, 325–335. [Google Scholar] [CrossRef] [PubMed]
- Timmermann, T.; Oberegelsbacher, D. Praxisfelder und Indikation. 2008, 21, pp. 18–21. Available online: https://www.amazon.de/Lehrbuch-Musiktherapie-Hans-Helmut-Decker-Voigt/dp/3825236951 (accessed on 6 December 2021).
- Bosse, J.; Stegemann, T.; Schmidt, H.U.; Timmermann, T. Dem Aufmerksamkeitsdefizit mit Aufmerksamkeit begegnen–was die Musiktherapie Kindern und Jugendlichen mit einer ADHS-Diagnose bieten kann. Musikther. Umsch. 2013, 34, 7–22. [Google Scholar] [CrossRef]
- Neuhaus, C. ADHS bei Kindern, Jugendlichen und Erwachsenen: Symptome, Ursachen, Diagnose und Behandlung; Kohlhammer Verlag: Stuttgart, Germany, 2020. [Google Scholar]
- Overy, K. Dyslexia, temporal processing and music: The potential of music as an early learning aid for dyslexic children. Psychol. Music. 2000, 28, 218–229. [Google Scholar] [CrossRef]
- Habib, M.; Lardy, C.; Desiles, T.; Commeiras, C.; Chobert, J.; Besson, M. Music and Dyslexia: A New Musical Training Method to Improve Reading and Related Disorders. Front. Psychol. 2016, 7, 26. [Google Scholar] [CrossRef] [Green Version]


| Parameters | Categories | Controls | ADHD | ADD | Dyslexic |
|---|---|---|---|---|---|
| Number of subjects | 28 | 19 | 28 | 21 | |
| Age in years | mean ± SD | 14.48 ± 1.12 | 14.05 ± 1.43 | 14.32 ± 1.78 | 13.64 ± 1.17 |
| Musical Status * | mean | 9.73 ± 6.03 | 5.94 ± 6.55 | 7.11 ± 9.02 | 5.74 ± 7.18 |
| Sex | female | 14 | 2 | 8 | 10 |
| male | 14 | 17 | 20 | 11 | |
| Handedness | right | 24 | 16 | 22 | 16 |
| left | 4 | 3 | 6 | 5 |
| Variables | Mean (M) | Standard Error (SE) |
|---|---|---|
| Rhythmic Reproduction (corr/30) | 20.67 | 0.45 |
| Rhythmic Improvisation (corr/30) | 20.93 | 0.47 |
| Musical Expression (corr/30) | 20.66 | 0.44 |
| Pitch Reproduction (corr/30) | 18.03 | 0.52 |
| Pitch Improvisation (corr/30) | 20.71 | 0.53 |
| Rhythmic and Pitch Memorization (corr/30) | 25.51 | 0.32 |
| Variables | F | p | ω |
|---|---|---|---|
| Rhythmic Reproduction | (3, 94) = 8.95 | <0.001 | 0.45 |
| Rhythmic Improvisation | (3, 94) = 12.77 | <0.001 | 0.52 |
| Musical Expression | (3, 94) = 13.09 | <0.001 | 0.53 |
| Pitch Reproduction | (3, 94) = 6.02 | <0.001 | 0.38 |
| Pitch Improvisation | (3, 94) = 4.93 | =0.003 | 0.35 |
| Rhythmic and Pitch Memorization | (3, 94) = 0.25 | =0.862 | -- |
| Variables | Mean (M) | Standard Error (SE) |
|---|---|---|
| P1 latency right and left (mean) | 77.26 | 1.08 |
| absolute P1 latency asynchrony |R-L| | 8.19 | 0.91 |
| N1 latency right and left (mean) | 147.99 | 3.84 |
| absolute N1 latency asynchrony |R-L| | 24.89 | 2.62 |
| Variables | F | p | ω |
|---|---|---|---|
| P1 latency right and left (mean) | (3, 90) = 5.06 | =0.003 | 0.34 |
| absolute P1 latency asynchrony |R-L| | (3, 90) = 11.55 | <0.001 | 0.50 |
| N1 latency right and left (mean) | (3, 90) = 3.64 | =0.016 | 0.28 |
| absolute N1 latency asynchrony |R-L| | (3, 90) = 0.39 | =0.764 | -- |
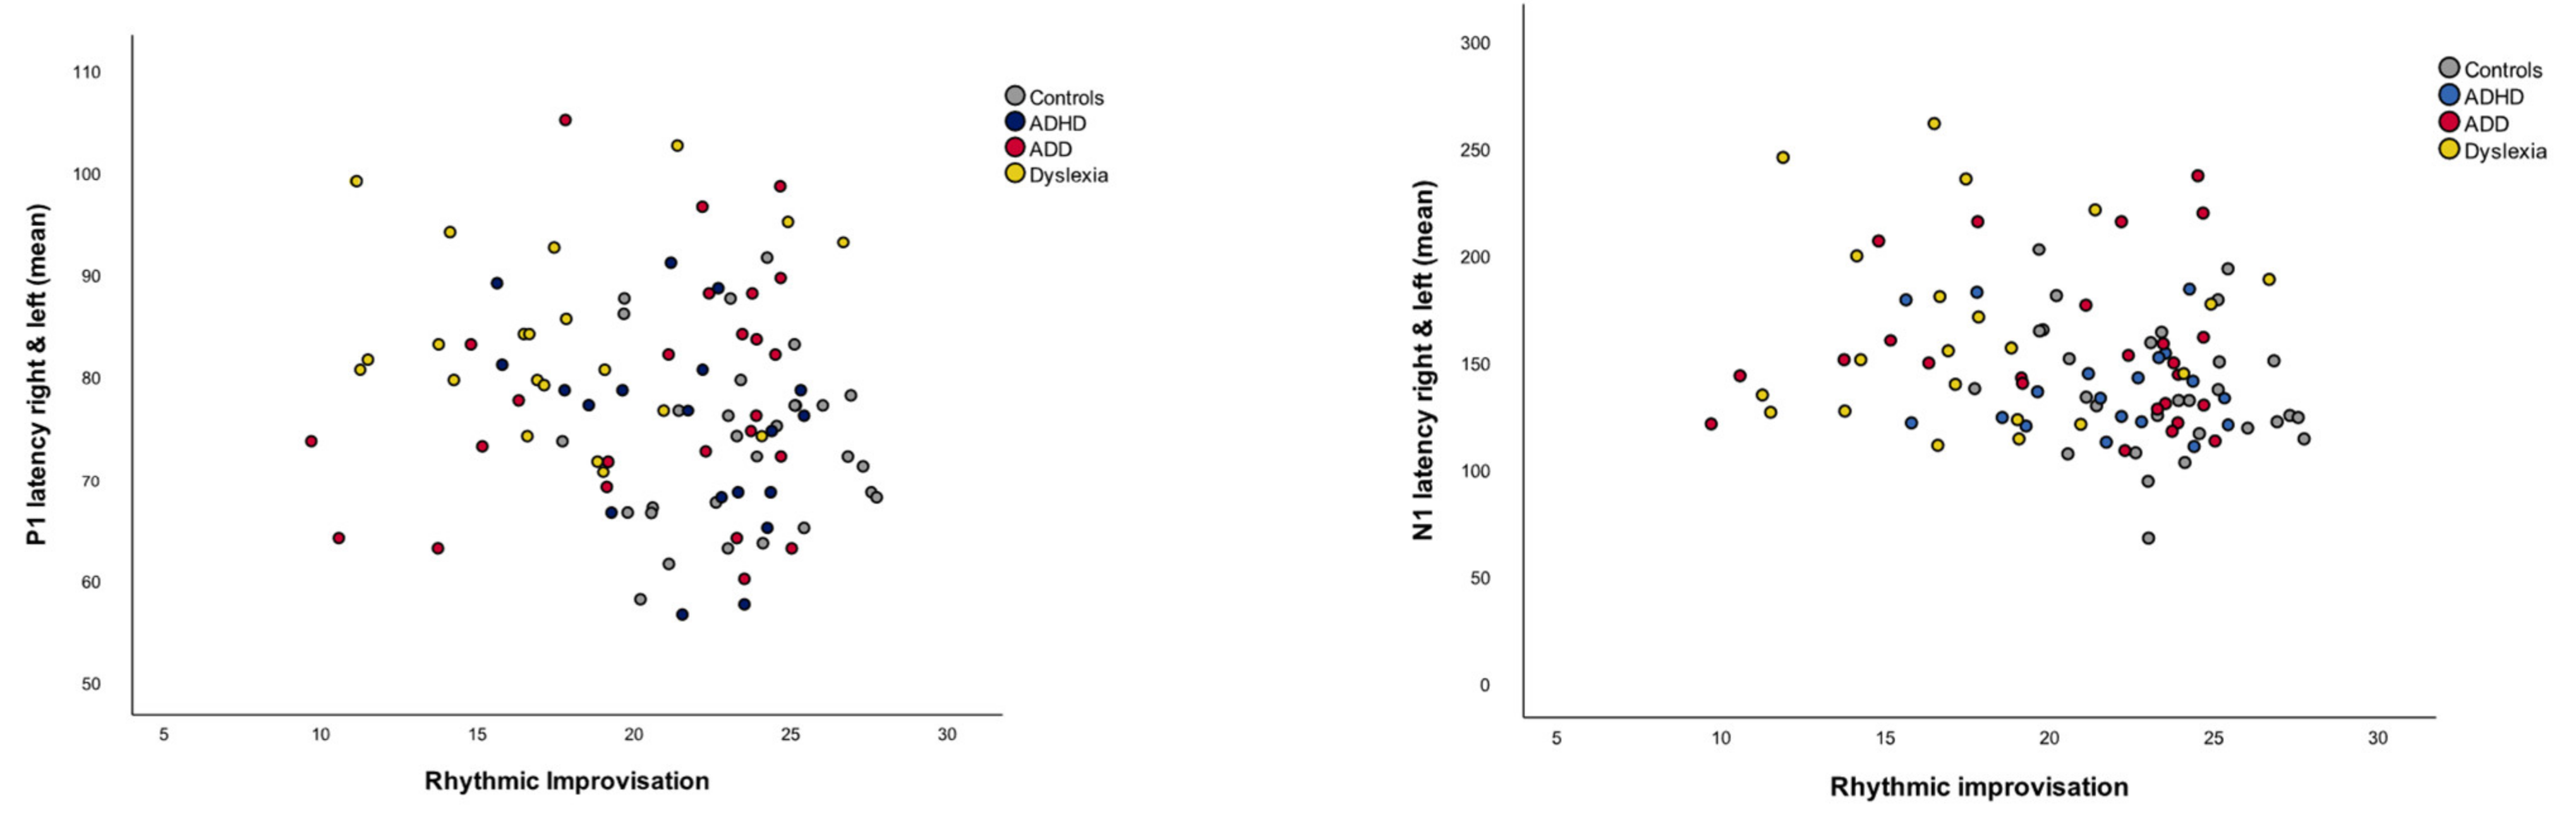
| P1 Latency Right and Left (mean) | Absolute P1 Latency Asynchrony |R-L| | N1 Latency Right and Left (mean) | Absolute N1 Latency Asynchrony |R-L| | |
|---|---|---|---|---|
| Rhythmic Improvisation | −0.290 ** | −0.184 | −0.298 ** | −0.189 |
| Musical Expression | −0.137 | −0.133 | −0.135 | −0.147 |
Publisher’s Note: MDPI stays neutral with regard to jurisdictional claims in published maps and institutional affiliations. |
© 2022 by the authors. Licensee MDPI, Basel, Switzerland. This article is an open access article distributed under the terms and conditions of the Creative Commons Attribution (CC BY) license (https://creativecommons.org/licenses/by/4.0/).
Share and Cite
Groß, C.; Serrallach, B.L.; Möhler, E.; Pousson, J.E.; Schneider, P.; Christiner, M.; Bernhofs, V. Musical Performance in Adolescents with ADHD, ADD and Dyslexia—Behavioral and Neurophysiological Aspects. Brain Sci. 2022, 12, 127. https://doi.org/10.3390/brainsci12020127
Groß C, Serrallach BL, Möhler E, Pousson JE, Schneider P, Christiner M, Bernhofs V. Musical Performance in Adolescents with ADHD, ADD and Dyslexia—Behavioral and Neurophysiological Aspects. Brain Sciences. 2022; 12(2):127. https://doi.org/10.3390/brainsci12020127
Chicago/Turabian StyleGroß, Christine, Bettina L. Serrallach, Eva Möhler, Jachin E. Pousson, Peter Schneider, Markus Christiner, and Valdis Bernhofs. 2022. "Musical Performance in Adolescents with ADHD, ADD and Dyslexia—Behavioral and Neurophysiological Aspects" Brain Sciences 12, no. 2: 127. https://doi.org/10.3390/brainsci12020127
APA StyleGroß, C., Serrallach, B. L., Möhler, E., Pousson, J. E., Schneider, P., Christiner, M., & Bernhofs, V. (2022). Musical Performance in Adolescents with ADHD, ADD and Dyslexia—Behavioral and Neurophysiological Aspects. Brain Sciences, 12(2), 127. https://doi.org/10.3390/brainsci12020127