Abstract
There is large intersubject variability in cerebrovascular hemodynamic and systemic physiological responses induced by a verbal fluency task (VFT) under colored light exposure (CLE). We hypothesized that machine learning would enable us to classify the response patterns and provide new insights into the common response patterns between subjects. In total, 32 healthy subjects (15 men and 17 women, age: 25.5 ± 4.3 years) were exposed to two different light colors (red vs. blue) in a randomized cross-over study design for 9 min while performing a VFT. We used the systemic physiology augmented functional near-infrared spectroscopy (SPA-fNIRS) approach to measure cerebrovascular hemodynamics and oxygenation at the prefrontal cortex (PFC) and visual cortex (VC) concurrently with systemic physiological parameters. We found that subjects were suitably classified by unsupervised machine learning into different groups according to the changes in the following parameters: end-tidal carbon dioxide, arterial oxygen saturation, skin conductance, oxygenated hemoglobin in the VC, and deoxygenated hemoglobin in the PFC. With hard clustering methods, three and five different groups of subjects were found for the blue and red light exposure, respectively. Our results highlight the fact that humans show specific reactivity types to the CLE-VFT experimental paradigm.
1. Introduction
Color and colored light have always fascinated humans and played a vital role in daily life. In our modern society, we are increasingly exposed to various colored light sources, ranging from illuminated advertising boards to computer screens, room lighting, and smartphones. In addition, colors and colored lights can also be parts of different learning environments. It has been demonstrated that colored lights (or colors) have significant effects on students, influencing their emotions, mood, performance, and systemic physiology [1,2,3,4]. Selecting an optimal learning environment with a specific colored light may enhance cognitive performance in the context of education. In spite of the broad range of colored light applications, the influence of colored light on human physiology is still rarely studied and is therefore of substantial interest for science and society.
Systemic physiology augmented functional near-infrared spectroscopy (SPA-fNIRS) is a powerful approach to study the physiological state of a human and body–brain interactions [5]. This approach can also be used to understand how the entire body reacts to stimulus/task paradigms [5]. In our previous studies, we employed this approach to investigate the visual and non-visual effects of colored light exposure (CLE) in humans [6,7,8,9]. In one of our latest studies [9], we investigated a mixed-effect of CLE and a verbal fluency task (VFT; one of the most widely applied tests for the assessment of cognitive function [10,11,12]) by SPA-fNIRS. In this study [9], subjects were manually classified into different groups based on their hemodynamic response patterns of oxygenated hemoglobin ([O2Hb]) in the prefrontal (PFC) and visual cortex (VC). Seven and five different hemodynamic patterns were found for red and blue light exposure, respectively. The manual classification of subjects was the very first step in analyzing such data, providing valuable information about individual differences in hemodynamic responses during a CLE-VFT. However, the impact of systemic physiology was not directly taken into account for such a classification. In fact, considering several parameters, i.e., cerebrovascular and systemic physiological parameters, the manual classification of subjects is complex and not practicable. In the present study, we aimed to extend this approach by using an automatic classification method. More parameters have been considered in the process of automatic classification, which is expected to provide a better overview and understanding of different subjects’ reactions.
Machine learning (ML) algorithms can be used to extract new information from physiological data. Such algorithms can help in the automatic classification of different subjects’ reactions due to a CLE-VFT. Unsupervised ML is a type of algorithm for learning from unlabeled data, which aims to find patterns or intrinsic structures from input features, facilitating flexible, general, and automated methods of ML [13,14]. Clustering analyses, a subsection of unsupervised ML, partition input data into distinct groups based on similarities between observations [15,16].
Using unsupervised ML, we aimed to investigate whether the CLE-VFT causes different subjects’ reactions in cerebrovascular hemodynamics and systemic physiology measured with SPA-fNIRS. Particularly, we analyzed the performance of a variety of different clustering methods. We hypothesized that unsupervised ML would enable the classification of the response patterns, which would provide new insights into the common response patterns between subjects.
2. Materials and Methods
2.1. Subjects
In total, 32 healthy right-handed adults were recruited in this study (15 men and 17 women, age: 25.5 ± 4.3 years). The size of the sample was calculated with a power analysis to detect substantial effects (effect size: d = 0.59; based on our previous study results investigating the different physiological effects of light exposure with two colors) at a p < 0.05 and a power of >0.8. Subjects were all well-educated (i.e., university students or individuals with university degrees), non-smokers, medication-free, and without any significant history of neurological, cardiovascular, or respiratory disease. To avoid physiological changes due to confounders, subjects were asked to refrain from consuming stimulants (e.g., coffee, tea, or energy drinks) and from eating for two hours before the measurements. The study had a quantitative, cross-over, randomized, and semi-blinded design. All measurements were conducted at the Institute of Complementary and Integrative Medicine of the University of Bern. The recruitment and data collection were performed over a time span of 15 months (August 2017–October 2018). Recruitment was conducted via the distribution of flyers and an online advertisement on the University of Bern website as well as inquiries from colleagues, friends, and acquaintances. Subjects were financially compensated for their participation.
2.2. Experimental Protocol and Measurement Setup
Each subject was exposed to two colored lights (red and blue) for 9 min on two different days but at the same time of day (± half an hour). The color order was randomized, and the light illuminance was set at 120 lux for each color. Subjects sat comfortably in a reclining chair and were asked to perform a VFT while they were exposed to the colored light. Before and after the CLE-VFT, subjects were in a rest phase (darkness, without any task) for 8 min and 15 min, respectively. The subjects performed the experiment with their eyes open for both resting sessions as well as the CLE-VFT phase. Subjects produced 58 ± 12 (mean ± SD) correct nouns during the red light exposure and 57 ± 15 during blue light exposure. No significant difference in the VFT performance was found between the red and blue light exposure.
The SPA-fNIRS approach comprised a multi-channel frequency-domain near-infrared spectroscopy (FD-NIRS) device (Imagent, ISS Inc, Champaign, IL, USA) and three devices to measure systemic physiological parameters. FD-NIRS is able to determine the absolute values of [O2Hb], deoxygenated hemoglobin ([HHb]), total hemoglobin ([tHb]), and tissue oxygen saturation (StO2) in the PFC and VC. Our fNIRS was sensitive to the brain and, as a multi-distance system, minimized the impact of extracerebral blood flow changes on the data [17,18,19,20]. Heart rate (HR), mean arterial blood pressure (MAP), and arterial oxygen saturation (SpO2) were measured by a SOMNOtouch NIBP device (SOMNOmedics GmbH, Randersacker, Germany). A NONIN LifeSense (NONIN Medical, Plymouth, MN, USA) device was employed to record the respiration rate (RR) and the end-tidal carbon dioxide (PETCO2). Skin conductance (SC) was determined with a VERIM system (Mind-Reflection, Tallinn, Estonia). All data were recorded simultaneously.
A more detailed description of the experimental protocol, as well as the SPA-fNIRS setup, can be found in our previous studies [8,9].
The planning of the study, the data analysis, and the reporting of the results were conducted according to recently published fNIRS guidelines [21].
2.3. Signal Processing and Machine Learning
To avoid the effects of confounders, a homogenous sample was selected for data analysis. All subjects were Swiss German speakers. To have a sample in a small age range (20 to 30 years), two subjects over 30 years old were excluded from the analysis. By removing these two subjects, we avoided the need to correct for age when performing the statistical analysis. Signal preprocessing was performed according to our previous study [9]. For each time-dependent parameter, the area under the curve (AUC) of the CLE-VFT phase was calculated for each subject in both conditions (red and blue). In total, 15 different parameters (features) were investigated: [O2Hb], [HHb], [tHb], and StO2 in the PFC and VC as well as HR, MAP, SpO2, RR, PETCO2, SC, and task performance. Subsequently, the features were subjected to min–max normalization in order to bring all of them to a comparable scale. Min–max normalization has the advantage of exactly preserving all relationships in the data [22,23]. A principal component analysis (PCA) was applied in order to reduce the dimensionality of the feature space so that unsupervised ML algorithms could be implemented effectively. The observations were projected on the n first principal components of the data, and data in the projected space were used for unsupervised ML. The number of selected principal components was such that around 80% of the variance was kept. This allowed us to significantly reduce the dimensions of the data while not losing much information. It has been demonstrated that for descriptive purposes at least 80% of the variance should be explained by the principal components. In this study, two dimensions were sufficient to account for >80% of the variance in the data, while the variance contributed by other principal components was small [24,25].
The aim of the next step of the data analysis was to select a maximum of five features among the 15 features investigated in this study so that one was chosen from the PFC parameters, one was chosen from the VC, and three were chosen from the systemic physiology. Since all of our subjects were students with almost equal verbal fluency skills, in unsupervised ML the task performance of the subjects had a low and insignificant impact on the classification of subjects. Using an in-house-developed algorithm, all possible combinations of the features were found and scored (silhouette value). Then, all combinations with silhouette values above 0.6, which indicates a good clustering (i.e., clusters are well-separated) [26,27,28], for a range of cluster numbers (k = 2 to k = 9) were selected for both the blue and red light conditions, and the best common combinations in both conditions were identified. Finally, using unsupervised ML, a variety of different clustering methods were used to classify subjects. These methods included k-means, k-medoids, hierarchical clustering, a Gaussian mixture model (GMM), the density-based spatial clustering of applications with noise (DBSCAN), and clustering via self-organizing maps (SOM). Three clustering criteria were used, including the silhouette score [29], the Calinski–Harabasz index [30], and the Davies–Bouldin index [31], in order to evaluate the quality of clustering and the performance [32].
Signal processing steps and machine learning were performed in MATLAB (R2021b, MathWorks, Inc., Natick, MA, USA).
3. Results
Using k-means clustering as a method and the silhouette index as a clustering criterion, the five best combinations of the cerebrovascular and systemic physiological parameters were detected for subject classification (Table 1). SC was the most important and sensitive parameter for the clustering, as observed in all five sets, while SpO2 also played a significant role in subject classification. SpO2 and SC were the common components of the first three categories, together with other parameters, leading to three and five different groups of subjects for the blue and red light exposure, respectively. Moreover, as Table 1 shows, [O2Hb] and [HHb] had greater impacts on the classification of subjects compared to the other two cerebrovascular parameters (i.e., [tHb] and StO2). With these five sets of parameters, subjects were suitably classified into different groups. The best subject classification was obtained according to the changes in the following parameters: [HHb] in the PFC, [O2Hb] in the VC, PETCO2, SC, and SpO2.

Table 1.
Summary of the best five sets of cerebrovascular and systemic physiological parameters for subject classification. The optimal number of clusters with the corresponding silhouette index criterion is shown for both the blue and red light exposure conditions.
For the next data analysis step, the best subject classification set was chosen, and several clustering methods were employed to determine the optimal number of clusters within each condition. Table 2 shows the best number of groups for all clustering algorithms utilized in this study. In almost all methods, two out of three clustering criteria (bold numbers) confirmed that the subjects were classified into three and five groups for the blue and red light exposure, respectively. Moreover, hard clustering algorithms (k-means, k-medoids, and SOM) had higher clustering performance (blue: silhouette index = 0.77, red: silhouette index = 0.88) compared to the soft clustering algorithm (GMM; blue: silhouette index = 0.71, red: silhouette index = 0.53) and the two other methods (hierarchical clustering; blue: silhouette index = 0.63, red: silhouette index = 0.87 and DBSCAN; blue: silhouette index = 0.2, red: silhouette index = 0.87).
Table 2.
The optimal number of clusters for the best set of parameters ([HHb]-PFC, [O2Hb]-VC, PETCO2, SC, and SpO2) using six different clustering methods and evaluated with three clustering criteria.
Considering the best set of parameters ([HHb]-PFC, [O2Hb]-VC, PETCO2, SC, and SpO2), Figure 1 visualizes the PCA scores and silhouette index values, obtained by k-means clustering, of each subject for the blue and red light exposure conditions. Three and five different groups of subjects were found for the blue (silhouette index = 0.77) and red (silhouette index = 0.88) light exposure, respectively. At the individual level, the silhouette plots show that most subjects have a considerable silhouette index value (i.e., >0.6), indicating that the group is relatively well-separated from neighboring groups. In 81% of the subjects, the silhouette index value was >0.6 for the blue light exposure condition, whereas 91% were >0.6 for the red light exposure. This specifies that subjects were well-separated (with distinctive reactions) during the red light exposure compared to blue light exposure. Figure 1a,b depict that some subjects reacted the same, i.e., relatively similar PCA scores, to both colored lights (e.g., subjects #9, #22, #24, and #28) and some others showed completely different reactions (e.g., subjects #16, #21, #23, and #31) to blue and red lights, i.e., dissimilar PCA scores. Considering the first group for both light colors, subjects exposed to blue light showed more scattered reactions than during red light exposure. To some extent, this was also observed in the other groups, as the second group in the blue light condition was relatively equivalent to the integration of the second and fourth groups in red light.
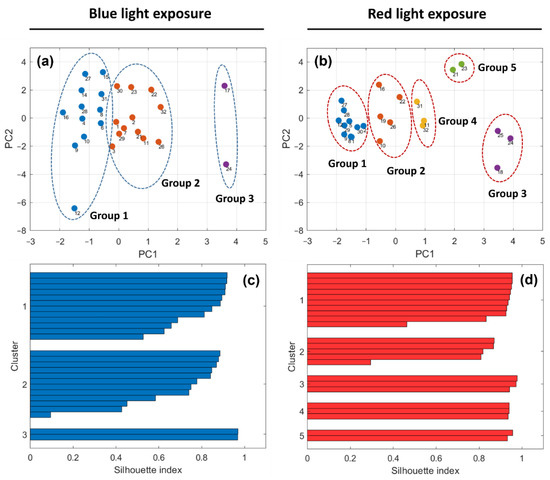
Figure 1.
Classification of subjects based on changes in [HHb]-PFC, [O2Hb]-VC, PETCO2, SC, and SpO2 using k-means clustering: (a,b) PCA scores and (c,d) silhouette values of each individual for the blue and red light exposure. The numbers next to the data points indicate the subjects’ identification codes.
4. Discussion
4.1. Red Light Causes Greater Intersubject Variability in the Physiological Reactions Compared to Blue Light Exposure
In this study, we found that during the CLE-VFT subjects exposed to red light were classified in more groups than those exposed to blue light. This finding aligns with our previous study results, where subjects were manually classified into different groups [9]. A relatively higher number of clusters in red compared to blue implies that red light may cause broader and more varied effects on human physiology compared to blue light. Red is equally associated with both positive (e.g., happiness, joy, and excitement) and negative (e.g., anger, danger, and fear) emotional perceptions, while blue is more associated with positive concepts (e.g., calm, comfort, and contentment) [33,34,35,36,37]. Red, in general, has been known as a unique and special color, and people who like this color are supposed to be active, influential, cheerful, competitive, optimistic, and action-oriented [38,39]. It has been hypothesized that red has negative meanings (failure) and aversive implications (avoidance motivation) in achievement contexts. On the other hand, it also carries positive, appetitive meanings and facilitates approach-relevant responding in relational contexts [39]. Our results imply that red light might lead to various positive and negative reactions in the subjects. These reactions, which were detected by unsupervised ML based on changes in SPA-fNIRS parameters during the CLE-VFT, can be classified into five categories, whereas blue light caused fewer clusters with more dispersed reactions, as blue appeals to almost everyone and carries more general and limited concepts.
4.2. Hard Clustering Methods Have Better Clustering Performance
In the current study, we utilized six different clustering methods in order to explore a wide range of possible solutions for identifying different subjects’ reactions during the CLE-VFT. The optimal number of clusters was determined using three criteria: the silhouette index, the Calinski–Harabasz index, and the Davies–Bouldin index. Using these criteria, the optimal numbers of clusters were generally equal to three and five for the blue and red light exposure, respectively. However, for the DBSCAN method, in the blue light condition the optimal number of clusters was equal to two. DBSCAN is known to be robust to noise points and can exclude data points from being part of any group, which decreases the impacts of outliers on its classification performance [40,41]. It seems that this method sorted two data points from the blue light (#17 and #24) into a separate “noise” cluster since they were too dissimilar to the rest of the dataset. Therefore, this algorithm found “two” to be the optimal number of clusters, which is not necessarily true in our case because we believe that these two data points are not real outliers but two different reactions of subjects to the blue light, which incidentally both belong to the same group (group 3, approved by other unsupervised ML methods). Using a larger number of subjects in future studies would enable the determination of whether such data points are outliers or specific reactions to the blue light. Moreover, we demonstrated that hard clustering algorithms (k-means, k-medoids, and SOM) have a higher clustering performance compared to the soft clustering algorithm (GMM) and the two other methods (hierarchical clustering and DBSCAN). In hard clustering methods, each data point either belongs to a cluster completely or not, while soft clustering methods are more flexible and can assign a data point to more than one cluster. k-means clustering is a simple, powerful, and widely used approach for classification, aiming to classify n observations into k clusters where each observation belongs to the cluster with the nearest mean [42,43]. k-medoids is similar to k-means, but instead of taking the mean value of the data points in a cluster, the most centrally located data point is considered as the reference point [14,44]. SOM is a special class of neural network based on competitive learning, which transforms a dataset into a topology-preserving 2D discrete map [13,14]. By employing all unsupervised ML methods, we found that the clustering performances of k-means, k-medoids, and SOM were the same and were the highest among all other methods for both the red and blue light conditions. Therefore, we can conclude that hard clustering methods suit this type of physiological data best. Compared to the hierarchical clustering method, k-means and k-medoids recover more stable clusters, classify messy high-dimensional data more accurately, and have less computational complexity [14,43,45]. Mangiameli et al. also demonstrated the superior accuracy and robustness of SOM in comparison with hierarchical clustering methods [46]. GMM, a fuzzy or soft clustering method, uses partition-based clustering where data points come from different multi-variate normal distributions with certain probabilities [47]. In line with our findings, Maaoui and Pruski found that k-means and SOM perform better than GMM when clustering physiological signals [48]. Finally, it has frequently been observed (Table 2) that the optimal number of groups evaluated by the Calinski–Harabasz index is higher than for the two other criteria, especially for hard clustering algorithms. This could mainly be attributed to the major drawback of this criterion, which is generally higher for convex globular clusters, namely k-means [49].
4.3. Changes in Systemic Physiological Activity Help to Classify the Individual Physiological Responses to a Task/Stimulation
As the traditional method for data classification, manual classification can be biased and inconsistent but not necessarily worse or less accurate than automatic classification. The data used in the current study had also been analyzed in our previous research [9] where subjects were manually classified into different groups based only on their hemodynamic response patterns of [O2Hb] in the PFC and VC. Although the subject-specific analysis and data classification were successfully performed in the previous study [9], the effects of the systemic physiological parameters on subject clustering were not directly taken into account. Therefore, an automatic classification was needed to provide a meaningful and better classification that considered both the cerebrovascular and systemic physiological data. In the current study, we investigated using unsupervised ML with the SPA-fNIRS approach to find different subjects’ reactions based on changes in both cerebrovascular hemodynamics and systemic physiology. The manual classification of subjects with fNIRS signals was the very first step in analyzing such data, providing valuable information about individual differences in cerebrovascular hemodynamics during a CLE-VFT. However, a reliable and accurate interpretation of the changes in the fNIRS signals and thus a better subject classification cannot be obtained without considering systemic physiological parameters. In terms of classification, taking five features (cerebrovascular and systemic physiological parameters) instead of only two features (cerebrovascular parameters) into account was the main strength of this study compared to the previous one. It definitely facilitates a better understanding of the role and influence of each individual in a cluster. For example, considering the first group of the red exposure, the range of changes in SC during the CLE-VFT was from 0.03 to 1.78 µS, while highly significant positive SC changes were observed for the third cluster (ΔSC > 11 µS). [O2Hb] changes in the VC for the individuals of the first cluster were in the range of positive to insignificant (0.66 ± 1.05 µM), but they were significantly lower for the third group (−0.83 ± 0.29 µM) compared to the first group. In addition, the changes in [HHb] in the PFC for most subjects in the first group were significantly negative, while they were insignificant for the subjects in the third group. Individuals in the first and third groups showed a wide range of changes in PETCO2 and SpO2 during the CLE-VFT. In other words, no specific common PETCO2 and SpO2 patterns were found for these two groups. The findings under the blue light condition were roughly in line with the red light results (first cluster: −0.11 µS < ΔSC < 2.33 µS, Δ[O2Hb]-VC: 1.28 ± 1.23 µM; third cluster: ΔSC > 11.4 µS, Δ[O2Hb]-VC: 0.55 ± 0.37 µM). Unsupervised ML enabled us to provide a better overview and understanding of different subjects’ reactions based on not only the fNIRS signals but also systemic physiology. In our previous study [9], the effect of systemic physiology was not directly taken into account for the classification of subjects due to some limitations of the manual method. However, the current study shows that more parameters can be taken into consideration for subject classification with unsupervised ML. It was also found that one of these systemic physiological parameters, i.e., SC, along with [O2Hb]-VC play the most important roles in the clustering since the individuals of each group had special characteristics for these two parameters. SC reflects the state and activity of the autonomic nervous system. The various forms of SC changes observed among all individuals were associated with the stress that subjects experienced during the VFT task. In other words, subjects experienced different stress levels while performing the task, which was mostly identified by measuring electrodermal activity. On the other hand, PETCO2 and SpO2 were found to be less sensitive parameters for the clustering. Such unique findings cannot be obtained except by an automated method (e.g., unsupervised ML). Moreover, it seems that statistically significant correlations between some cerebrovascular and systemic physiological parameters play a vital role in subject classification. Considering the systemic physiological parameters of the first two categories (PETCO2, SC, SpO2, and MAP), statistically significant correlations were found as follows: (i) blue light exposure: [O2Hb]-VC vs. SC (r = 0.48, p = 0.008), [O2Hb]-VC vs. PETCO2 (r = −0.28, p = 0.014), and [O2Hb]-PFC vs. MAP (r = 0.56, p = 0.002); (ii) red light exposure: [HHb]-PFC vs. SpO2 (r = −0.44, p = 0.015), [O2Hb]-VC vs. PETCO2 (r = −0.4, p = 0.035), [O2Hb]-VC vs. SpO2 (r = 0.61, p < 0.001). In our previous studies, we also showed that changes in PETCO2 have strong effects on cerebrovascular hemodynamics [50,51]. The correlation of SC and cerebrovascular hemodynamics has been reported elsewhere [52,53,54,55,56]. It has also been shown that MAP and SpO2 correlate with the changes in the fNIRS signals in the PFC and the motor cortex [9,57]. Caldwell et al. designed a model providing valuable information regarding the possible confounding factors of fNIRS measurements [58], showing that depending on the degree of the changes in PETCO2 and MAP, specific hemodynamic responses are induced.
4.4. Limitations
The current study has the following limitations: (1) Although the number of participants was calculated with a power analysis, a more optimal number of groups with more subjects in each cluster might have been found if the number of participants had been larger. (2) The fNIRS measurement setup did not cover the entire head, and therefore the whole brain was not measured. (3) Different cognitive tasks might affect subjects differently, depending on the nature of the task. As a very common example, females generally perform better than males in the VFT, finger tapping, and item memory, while males generally perform better in visual-spatial tasks such as mathematical tasks and mental rotation [1,59]. Moreover, non-mathematical tasks activate the whole PFC and the parietal cortex, supporting more general cognitive operations (e.g., attention and emotion) rather than specific modules for calculation, while mathematical processing may recruit only the left frontal cortex and the intraparietal sulcus [60,61,62]. Thus, our results cannot be transferred to other cognitive tasks. However, this will be investigated in future studies in combination with CLE. (4) While red and blue are the most common and widely used colored lights in science and society, other colors should also be investigated with our experimental paradigm and SPA-fNIRS approach.
5. Conclusions
For the first time, we used machine learning to investigate the intersubject variability in hemodynamic and systemic physiological responses due to a VFT under CLE. Since the manual classification of subjects with several parameters is complex and, in most cases, not practical, machine learning is an alternative method to categorize subjects into different groups. Based on the SPA-fNIRS parameters, we suitably classified the subjects into different groups using unsupervised machine learning in which the number of groups was different between the red and the blue light exposure. We showed that SC and [O2Hb]-VC play vital roles for the clustering, as the same response patterns between most subjects in each group were found for these two parameters. Since each individual reacts differently to the CLE, it would be advantageous to generate an algorithm that enables us to understand how each individual responds to the CLE based on cerebrovascular and systemic physiological changes. The newly applied data analysis is the very first step of designing an algorithm to assist in determining who reacts in a specific physiological way to a colored light exposure.
Author Contributions
Conceptualization and methodology, H.Z. and F.S.; data analysis and visualization, H.Z. and L.N.; resources, U.W.; writing—original draft preparation, H.Z. and L.N.; writing—review and editing, F.S. and U.W.; supervision, F.S. and U.W.; funding acquisition, U.W. All authors have read and agreed to the published version of the manuscript.
Funding
This research was funded by the Software AG Foundation (grant number P12117) and the Christophorus Foundation (grant numbers 253CST and 355CST).
Institutional Review Board Statement
The study was conducted in accordance with the World Medical Association Declaration of Helsinki, and the protocol was approved by the Ethics Committee of the Canton of Bern (project identifier: COLOR10; Basec-Nr. 2016-00674).
Informed Consent Statement
Written informed consent was obtained prior to the measurements.
Data Availability Statement
The data that support the findings of this study are available from the corresponding author upon reasonable request.
Acknowledgments
We thank our students for their contribution to the measurements and our subjects for participating in this study. The comprehensive support of the Graduate School for Health Sciences at the University of Bern is gratefully acknowledged.
Conflicts of Interest
The authors declare no potential conflict of interest with respect to the research, authorship, and/or publication of this article.
References
- Mehta, R.; Zhu, R.J. Blue or red? Exploring the effect of color on cognitive task performances. Science 2009, 323, 1226–1229. [Google Scholar] [CrossRef] [PubMed]
- Küller, R.; Mikellides, B.; Janssens, J. Color, arousal, and performance—A comparison of three experiments. Color Res. Appl. 2009, 34, 141–152. [Google Scholar] [CrossRef]
- von Castell, C.; Stelzmann, D.; Oberfeld, D.; Welsch, R.; Hecht, H. Cognitive performance and emotion are indifferent to ambient color. Color Res. Appl. 2018, 43, 65–74. [Google Scholar] [CrossRef]
- Al-Ayash, A.; Kane, R.T.; Smith, D.; Green-Armytage, P. The influence of color on student emotion, heart rate, and performance in learning environments. Color Res. Appl. 2016, 41, 196–205. [Google Scholar] [CrossRef]
- Scholkmann, F.; Tachtsidis, I.; Wolf, M.; Wolf, U. Systemic physiology augmented functional near-infrared spectroscopy: A powerful approach to study the embodied human brain. Neurophotonics 2022, 9, 030801. [Google Scholar] [CrossRef]
- Scholkmann, F.; Hafner, T.; Metz, A.J.; Wolf, M.; Wolf, U. Effect of short-term colored-light exposure on cerebral hemodynamics and oxygenation, and systemic physiological activity. Neurophotonics 2017, 4, 045005. [Google Scholar] [CrossRef]
- Metz, A.J.; Klein, S.D.; Scholkmann, F.; Wolf, U. Continuous coloured light altered human brain haemodynamics and oxygenation assessed by systemic physiology augmented functional near-infrared spectroscopy. Sci. Rep. 2017, 7, 10027. [Google Scholar] [CrossRef] [PubMed]
- Zohdi, H.; Egli, R.; Guthruf, D.; Scholkmann, F.; Wolf, U. Color-dependent changes in humans during a verbal fluency task under colored light exposure assessed by SPA-fNIRS. Sci. Rep. 2021, 11, 9654. [Google Scholar] [CrossRef] [PubMed]
- Zohdi, H.; Scholkmann, F.; Wolf, U. Individual Differences in Hemodynamic Responses Measured on the Head Due to a Long-Term Stimulation Involving Colored Light Exposure and a Cognitive Task: A SPA-fNIRS Study. Brain Sci. 2021, 11, 54. [Google Scholar] [CrossRef]
- Shao, Z.; Janse, E.; Visser, K.; Meyer, A.S. What do verbal fluency tasks measure? Predictors of verbal fluency performance in older adults. Front. Psychol. 2014, 5, 772. [Google Scholar] [CrossRef]
- Yeung, M.K. Frontal cortical activation during emotional and non-emotional verbal fluency tests. Sci. Rep. 2022, 12, 8497. [Google Scholar] [CrossRef] [PubMed]
- Sutin, A.R.; Luchetti, M.; Stephan, Y.; Strickhouser, J.E.; Terracciano, A. The association between purpose/meaning in life and verbal fluency and episodic memory: A meta-analysis of >140,000 participants from up to 32 countries. Int. Psychogeriatr. 2021, 34, 263–273. [Google Scholar] [CrossRef] [PubMed]
- Fiorini, L.; Mancioppi, G.; Semeraro, F.; Fujita, H.; Cavallo, F. Unsupervised emotional state classification through physiological parameters for social robotics applications. Knowl.-Based Syst. 2020, 190, 105217. [Google Scholar] [CrossRef]
- Usama, M.; Qadir, J.; Raza, A.; Arif, H.; Yau, K.L.A.; Elkhatib, Y.; Hussain, A.; Al-Fuqaha, A. Unsupervised Machine Learning for Networking: Techniques, Applications and Research Challenges. IEEE Access 2019, 7, 65579–65615. [Google Scholar] [CrossRef]
- Coombes, C.E.; Abrams, Z.B.; Li, S.; Abruzzo, L.V.; Coombes, K.R. Unsupervised machine learning and prognostic factors of survival in chronic lymphocytic leukemia. J. Am. Med. Inform. Assoc. 2020, 27, 1019–1027. [Google Scholar]
- Baştanlar, Y.; Özuysal, M. Introduction to machine learning. miRNomics MicroRNA Biol. Comput. Anal. 2014, 1107, 105–128. [Google Scholar]
- Fantini, S.; Sassaroli, A. Frequency-Domain Techniques for Cerebral and Functional Near-Infrared Spectroscopy. Front. Neurosci. 2020, 14, 300. [Google Scholar] [CrossRef]
- Choi, J.; Wolf, M.; Toronov, V.; Wolf, U.; Polzonetti, C.; Hueber, D.; Safonova, L.P.; Gupta, R.; Michalos, A.; Mantulin, W.; et al. Noninvasive determination of the optical properties of adult brain: Near-infrared spectroscopy approach. J. Biomed. Opt. 2004, 9, 221–229. [Google Scholar]
- Franceschini, M.A.; Fantini, S.; Paunescu, L.A.; Maier, J.S.; Gratton, E. Influence of a superficial layer in the quantitative Spectroscopic Study of Strongly Scattering Media. Appl. Opt. 1998, 37, 7447–7458. [Google Scholar] [CrossRef]
- Toronov, V.; Webb, A.; Choi, J.H.; Wolf, M.; Michalos, A.; Gratton, E.; Hueber, D. Investigation of human brain hemodynamics by simultaneous near-infrared spectroscopy and functional magnetic resonance imaging. Med. Phys. 2001, 28, 521–527. [Google Scholar]
- Yücel, M.A.; von Lühmann, A.; Scholkmann, F.; Gervain, J.; Dan, I.; Ayaz, H.; Boas, D.; Cooper, R.J.; Culver, J.; Elwell, C.E.; et al. Best Practices for fNIRS publications. Neurophotonics 2021, 8, 012101. [Google Scholar] [CrossRef] [PubMed]
- Jayalakshmi, T.; Santhakumaran, A. Statistical Normalization and Back Propagationfor Classification. Int. J. Comput. Theory Eng. 2011, 3, 1793–8201. [Google Scholar] [CrossRef]
- Singh, D.; Singh, B. Investigating the impact of data normalization on classification performance. Appl. Soft Comput. 2020, 97, 105524. [Google Scholar] [CrossRef]
- Santello, M.; Flanders, M.; Soechting, J.F. Postural hand synergies for tool use. J. Neurosci. 1998, 18, 10105–10115. [Google Scholar] [CrossRef] [PubMed]
- Delmas, M.A.; Etzion, D.; Nairn-Birch, N. Triangulating environmental performance: What do corporate social responsibility ratings really capture? Acad. Manag. Perspect. 2013, 27, 255–267. [Google Scholar] [CrossRef]
- Silverman, B.G.; Bharathy, G.; Pourdehnad, J.; Green, M.; Lowe, D.; Riley, D.; Salisbury, J. Individual Consumer Differences and Design Implications for Web-Based Decision Support; Philadelphia, PA, USA, 2006; Available online: http://www.seas.upenn.edu/~barryg/PersonalityConsumers.pdf (accessed on 20 October 2022).
- Kontaki, M.; Papadopoulos, A.N.; Manolopoulos, Y. Continuous trend-based clustering in data streams. In International Conference on Data Warehousing and Knowledge Discovery; Springer: Berlin/Heidelberg, Germany, 2008; pp. 251–262. [Google Scholar]
- Severeyn, E.; Wong, S.; Velásquez, J.; Perpiñán, G.; Herrera, H.; Altuve, M.; Díaz, J. Diagnosis of Type 2 Diabetes and Pre-diabetes Using Machine Learning. In Latin American Conference on Biomedical Engineering; Springer: Cham, Switzerland, 2019; pp. 792–802. [Google Scholar]
- Rousseeuw, P.J. Silhouettes: A graphical aid to the interpretation and validation of cluster analysis. J. Comput. Appl. Math. 1987, 20, 53–65. [Google Scholar] [CrossRef]
- Caliński, T.; Harabasz, J. A dendrite method for cluster analysis. Commun. Stat. 1974, 3, 1–27. [Google Scholar]
- Davies, D.L.; Bouldin, D.W. A clustering separation measure. IEEE Trans. Pattern Anal. Mach. Intell. 1979, 2, 224–227. [Google Scholar] [CrossRef]
- Arbelaitz, O.; Gurrutxaga, I.; Muguerza, J.; Pérez, J.M.; Perona, I. An extensive comparative study of cluster validity indices. Pattern Recognit. 2013, 46, 243–256. [Google Scholar] [CrossRef]
- Dael, N.; Perseguers, M.N.; Marchand, C.; Antonietti, J.P.; Mohr, C. Put on that colour, it fits your emotion: Colour appropriateness as a function of expressed emotion. Q. J. Exp. Psychol. 2016, 69, 1619–1630. [Google Scholar] [CrossRef]
- Jonauskaite, D.; Dael, N.; Chèvre, L.; Althaus, B.; Tremea, A.; Charalambides, L.; Mohr, C. Pink for Girls, Red for Boys, and Blue for Both Genders: Colour Preferences in Children and Adults. Sex Roles 2019, 80, 630–642. [Google Scholar] [CrossRef]
- Soldat, A.S.; Sinclair, R.C.; Mark, M.M. Color as an environmental processing cue: External affective cues can directly affect processing strategy without affecting mood. Soc. Cogn. 1997, 15, 55–71. [Google Scholar] [CrossRef]
- Jiang, A.; Yao, X.; Hemingray, C.; Westland, S. Young people’s colour preference and the arousal level of small apartments. Color Res. Appl. 2022, 47, 783–795. [Google Scholar] [CrossRef]
- Tofle, R.; Schwartz, B.; Yoon, S.; Max-Royale, A. Color In Healthcare Environments—A Research Report; Health Environments Research (CHER): San Francisco, CA, USA, 2004. [Google Scholar]
- Jonauskaite, D.; Althaus, B.; Dael, N.; Dan-Glauser, E.; Mohr, C. What color do you feel? Color choices are driven by mood. Color Res. Appl. 2019, 44, 272–284. [Google Scholar] [CrossRef]
- Elliot, A.J.; Maier, M.A. Color Psychology: Effects of Perceiving Color on Psychological Functioning in Humans. Annu. Rev. Psychol. 2014, 65, 95–120. [Google Scholar] [CrossRef]
- Dudik, J.M.; Kurosu, A.; Coyle, J.L.; Sejdić, E. A comparative analysis of DBSCAN, K-means, and quadratic variation algorithms for automatic identification of swallows from swallowing accelerometry signals. Comput. Biol. Med. 2015, 59, 10–18. [Google Scholar] [CrossRef]
- Zanna, K.; Neal, T.; Canavan, S. Clustering of Physiological Signals by Emotional State, Race, and Sex. In Proceedings of the Companion Publication of the 2021 International Conference on Multimodal Interaction, Montreal, QC, Canada, 18–22 October 2021; pp. 312–316. [Google Scholar]
- Badillo, S.; Banfai, B.; Birzele, F.; Davydov, I.I.; Hutchinson, L.; Kam-Thong, T.; Siebourg-Polster, J.; Steiert, B.; Zhang, J.D. An Introduction to Machine Learning. Clin. Pharmacol. Ther. 2020, 107, 871–885. [Google Scholar] [CrossRef]
- Pikoula, M.; Quint, J.K.; Nissen, F.; Hemingway, H.; Smeeth, L.; Denaxas, S. Identifying clinically important COPD sub-types using data-driven approaches in primary care population based electronic health records. BMC Med. Inform. Decis. Mak. 2019, 19, 86. [Google Scholar] [CrossRef]
- Chitrakar, R.; Chuanhe, H. Anomaly detection using Support Vector Machine classification with k-Medoids clustering. In Proceedings of the 2012 Third Asian Himalayas International Conference on Internet, Kathmandu, Nepal, 23–25 November 2012; pp. 1–5. [Google Scholar]
- Castaldi, P.J.; Benet, M.; Petersen, H.; Rafaels, N.; Finigan, J.; Paoletti, M.; Marike Boezen, H.; Vonk, J.M.; Bowler, R.; Pistolesi, M.; et al. Do COPD subtypes really exist? COPD heterogeneity and clustering in 10 independent cohorts. Thorax 2017, 72, 998–1006. [Google Scholar] [CrossRef]
- Mangiameli, P.; Chen, S.K.; West, D. A comparison of SOM neural network and hierarchical clustering methods. Eur. J. Oper. Res. 1996, 93, 402–417. [Google Scholar] [CrossRef]
- Borthakur, D.; Peltier, A.; Dubey, H.; Gyllinsky, J.; Mankodiya, K. SmartEAR: Smartwatch-based unsupervised learning for multi-modal signal analysis in opportunistic sensing framework. In Proceedings of the 2018 IEEE/ACM International Conference on Connected Health: Applications, Systems and Engineering Technologies, Washington DC, USA, 26–28 September 2018; pp. 75–80. [Google Scholar]
- Maaoui, C.; Pruski, A. Unsupervised stress detection from remote physiological signal. In Proceedings of the 2018 IEEE International Conference on Industrial Technology (ICIT), Lyon, France, 20–22 February 2018; pp. 1538–1543. [Google Scholar]
- Katarya, R.; Saini, R. Enhancing the wine tasting experience using greedy clustering wine recommender system. Multimed. Tools Appl. 2022, 81, 807–840. [Google Scholar]
- Scholkmann, F.; Gerber, U.; Wolf, M.; Wolf, U. End-tidal CO2: An important parameter for a correct interpretation in functional brain studies using speech tasks. Neuroimage 2013, 66, 71–79. [Google Scholar] [CrossRef] [PubMed]
- Scholkmann, F.; Klein, S.D.; Gerber, U.; Wolf, M.; Wolf, U. Cerebral hemodynamic and oxygenation changes induced by inner and heard speech: A study combining functional near-infrared spectroscopy and capnography. J. Biomed. Opt. 2014, 19, 017002. [Google Scholar] [CrossRef] [PubMed]
- Critchley, H.D.; Elliott, R.; Mathias, C.J.; Dolan, R.J. Neural activity relating to generation and representation of galvanic skin conductance responses: A functional magnetic resonance imaging study. J. Neurosci. 2000, 20, 3033–3040. [Google Scholar]
- Zhang, S.; Hu, S.; Chao, H.H.; Luo, X.; Farr, O.M.; Li, C.S.R. Cerebral correlates of skin conductance responses in a cognitive task. Neuroimage 2012, 62, 1489–1498. [Google Scholar] [CrossRef]
- Nagai, Y.; Critchley, H.D.; Featherstone, E.; Trimble, M.R.; Dolan, R.J. Activity in ventromedial prefrontal cortex covaries with sympathetic skin conductance level: A physiological account of a “default mode” of brain function. Neuroimage 2004, 22, 243–251. [Google Scholar]
- Patterson, J.C.; Ungerleider, L.G.; Bandettini, P.A. Task-independent functional brain activity correlation with skin conductance changes: An fMRI study. Neuroimage 2002, 17, 1797–1806. [Google Scholar] [CrossRef]
- MacIntosh, B.J.; Mraz, R.; McIlroy, W.E.; Graham, S.J. Brain activity during a motor learning task: An fMRI and skin conductance study. Hum. Brain Mapp. 2007, 28, 1359–1367. [Google Scholar]
- Tachtsidis, I.; Leung, T.S.; Tisdall, M.M.; Devendra, P.; Smith, M.; Delpy, D.T.; Elwell, C.E. Investigation of frontal cortex, motor cortex and systemic haemodynamic changes during anagram solving. Adv. Exp. Med. Biol. 2008, 614, 21–28. [Google Scholar]
- Caldwell, M.; Scholkmann, F.; Wolf, U.; Wolf, M.; Elwell, C.; Tachtsidis, I. Modelling confounding effects from extracerebral contamination and systemic factors on functional near-infrared spectroscopy. Neuroimage 2016, 143, 91–105. [Google Scholar] [CrossRef]
- Bell, E.C.; Willson, M.C.; Wilman, A.H.; Dave, S.; Silverstone, P.H. Males and females differ in brain activation during cognitive tasks. Neuroimage 2006, 30, 529–538. [Google Scholar] [CrossRef] [PubMed]
- Tanida, M.; Katsuyama, M.; Sakatani, K. Relation between mental stress-induced prefrontal cortex activity and skin conditions: A near-infrared spectroscopy study. Brain Res. 2007, 1184, 210–216. [Google Scholar] [CrossRef] [PubMed]
- Gruber, O.; Indefrey, P.; Steinmetz, H.; Kleinschmidt, A. Dissociating neural correlates of cognitive components in mental calculation. Cereb. Cortex 2001, 11, 350–359. [Google Scholar] [CrossRef] [PubMed]
- Houdé, O.; Tzourio-mazoyer, N. Neural foundations of logical and mathematical cognition. Nat. Rev. Neurosci. 2003, 4, 507–514. [Google Scholar] [CrossRef] [PubMed]
Publisher’s Note: MDPI stays neutral with regard to jurisdictional claims in published maps and institutional affiliations. |
© 2022 by the authors. Licensee MDPI, Basel, Switzerland. This article is an open access article distributed under the terms and conditions of the Creative Commons Attribution (CC BY) license (https://creativecommons.org/licenses/by/4.0/).