
Reduced Effective Connectivity in the Motor Cortex in Parkinson’s Disease

 ,
,  ,
,  ,
,  ,
,
Abstract
1. Introduction
2. Materials and Methods
2.1. Participants
2.2. EEG Data
MVAR Model and Time-Domain Formulation of Granger Causality Index
2.3. Graph Representation
2.4. Graph Analysis
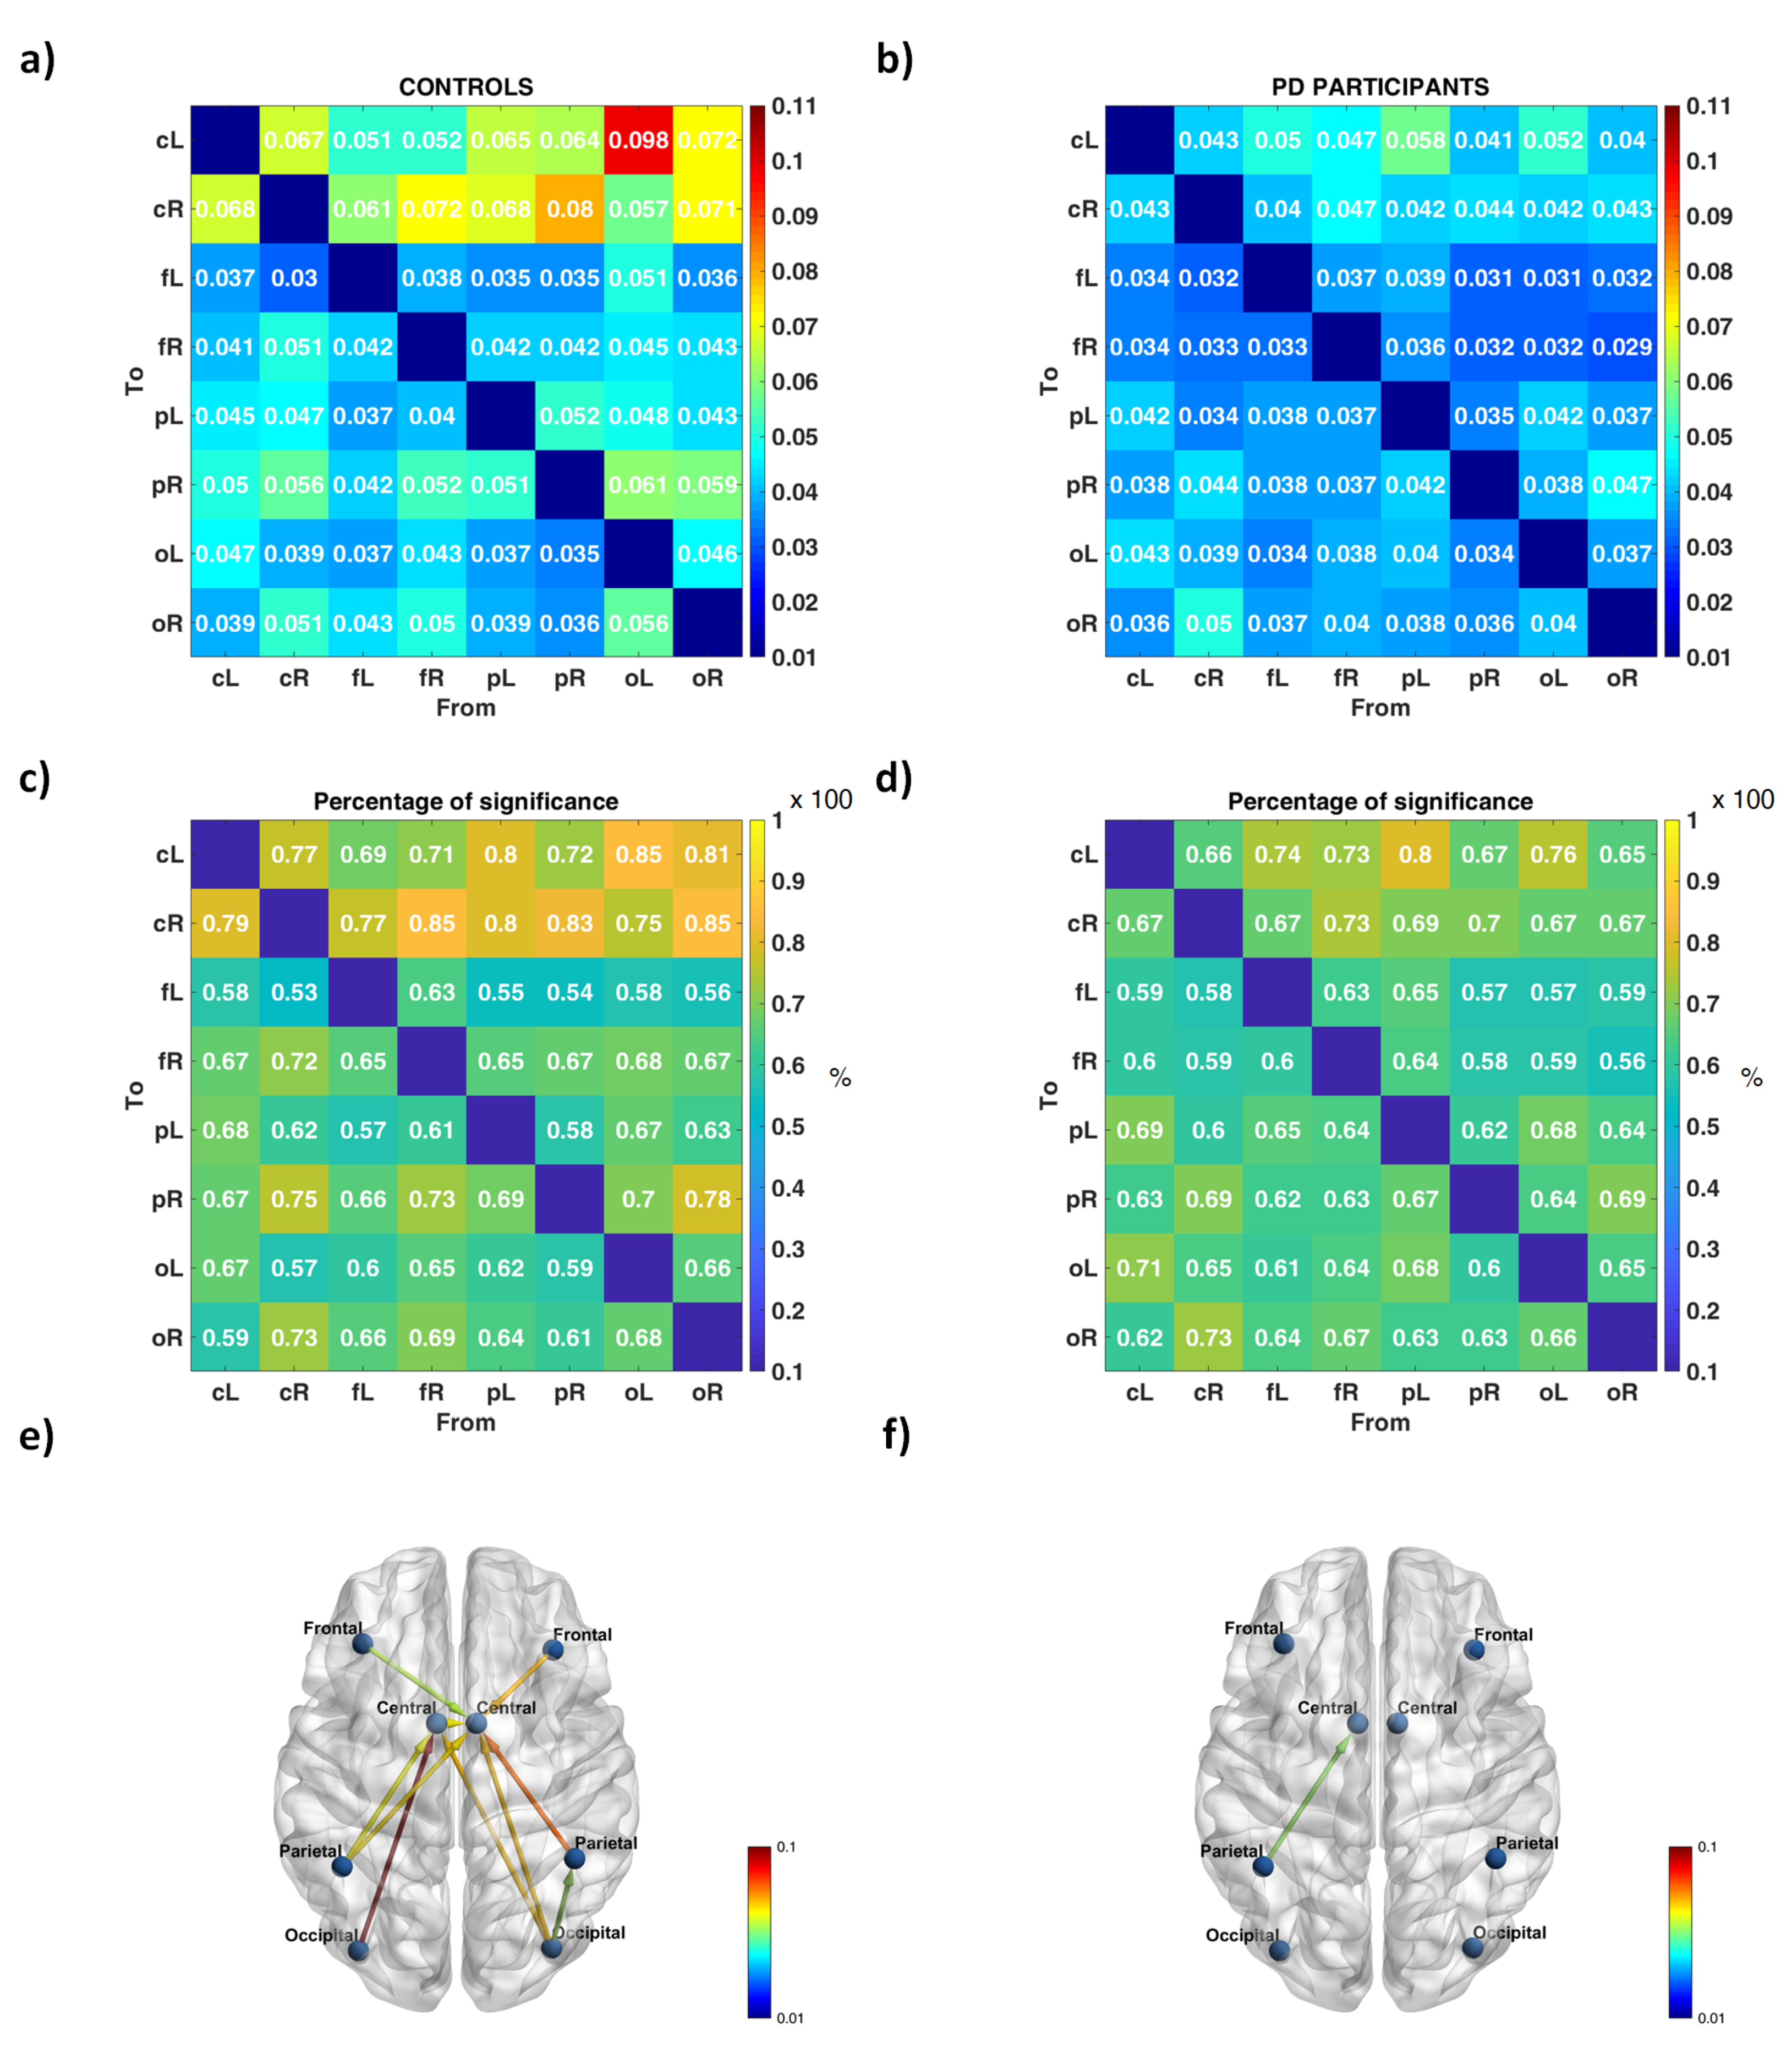
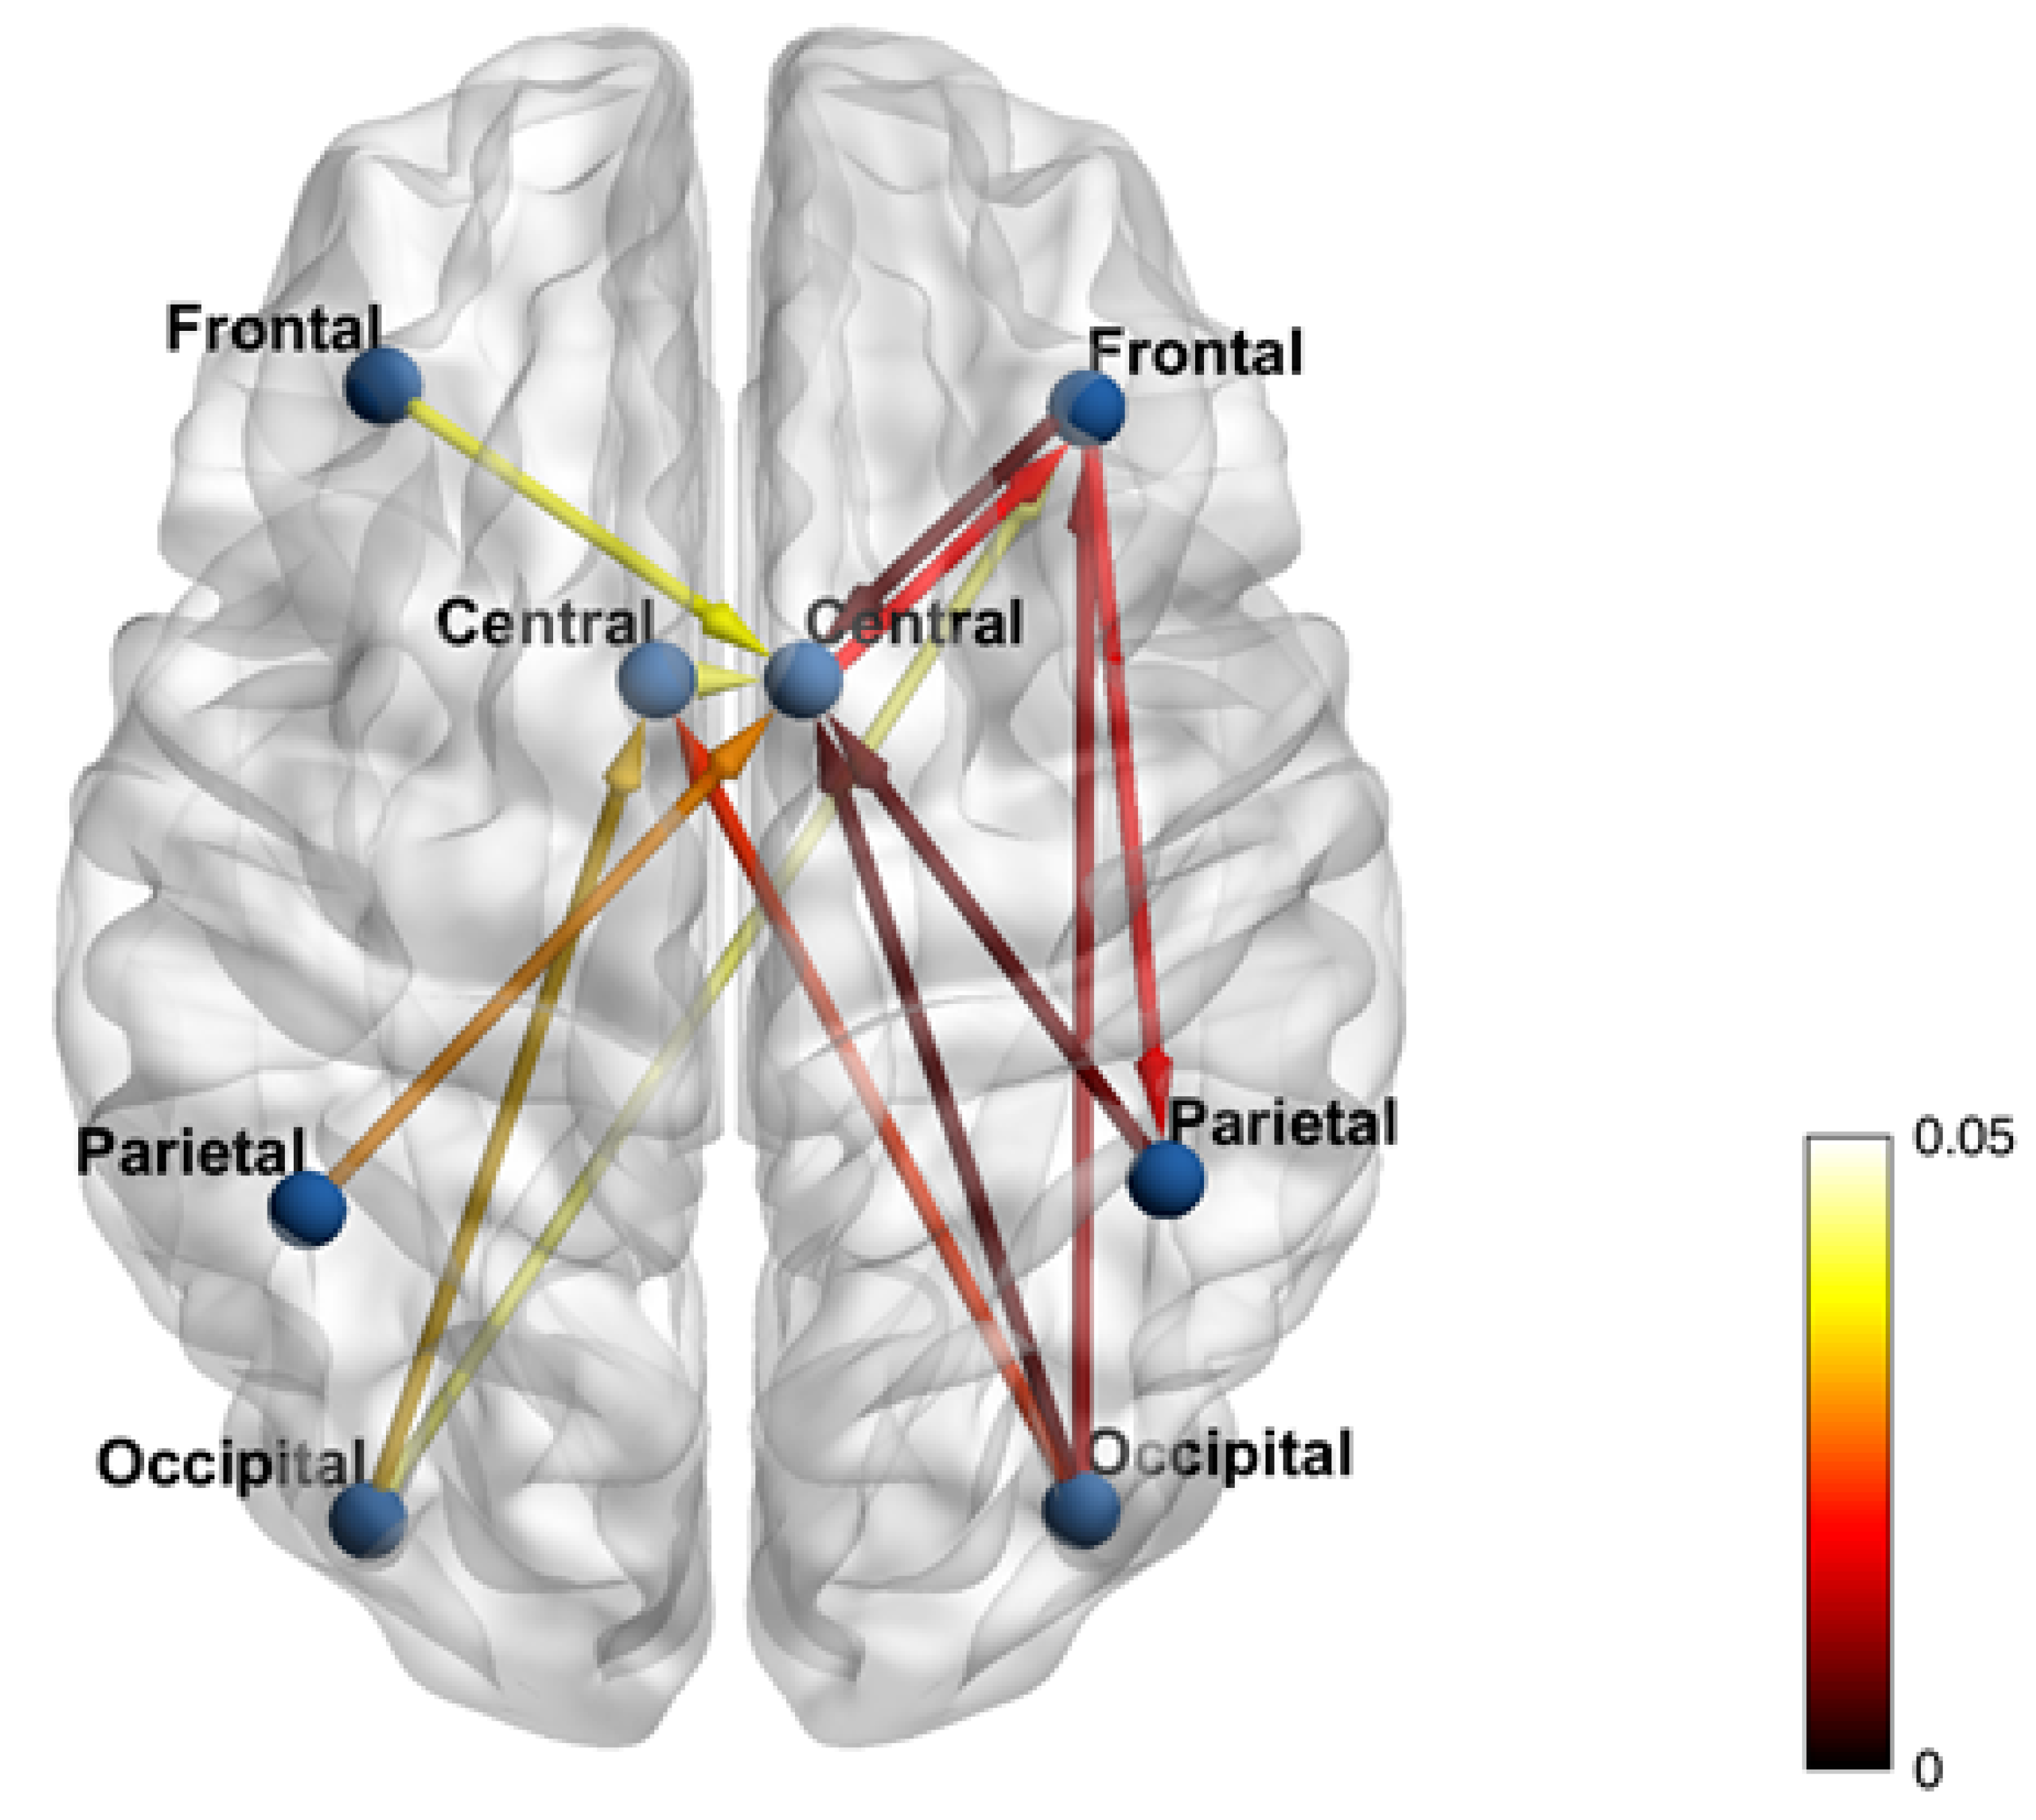
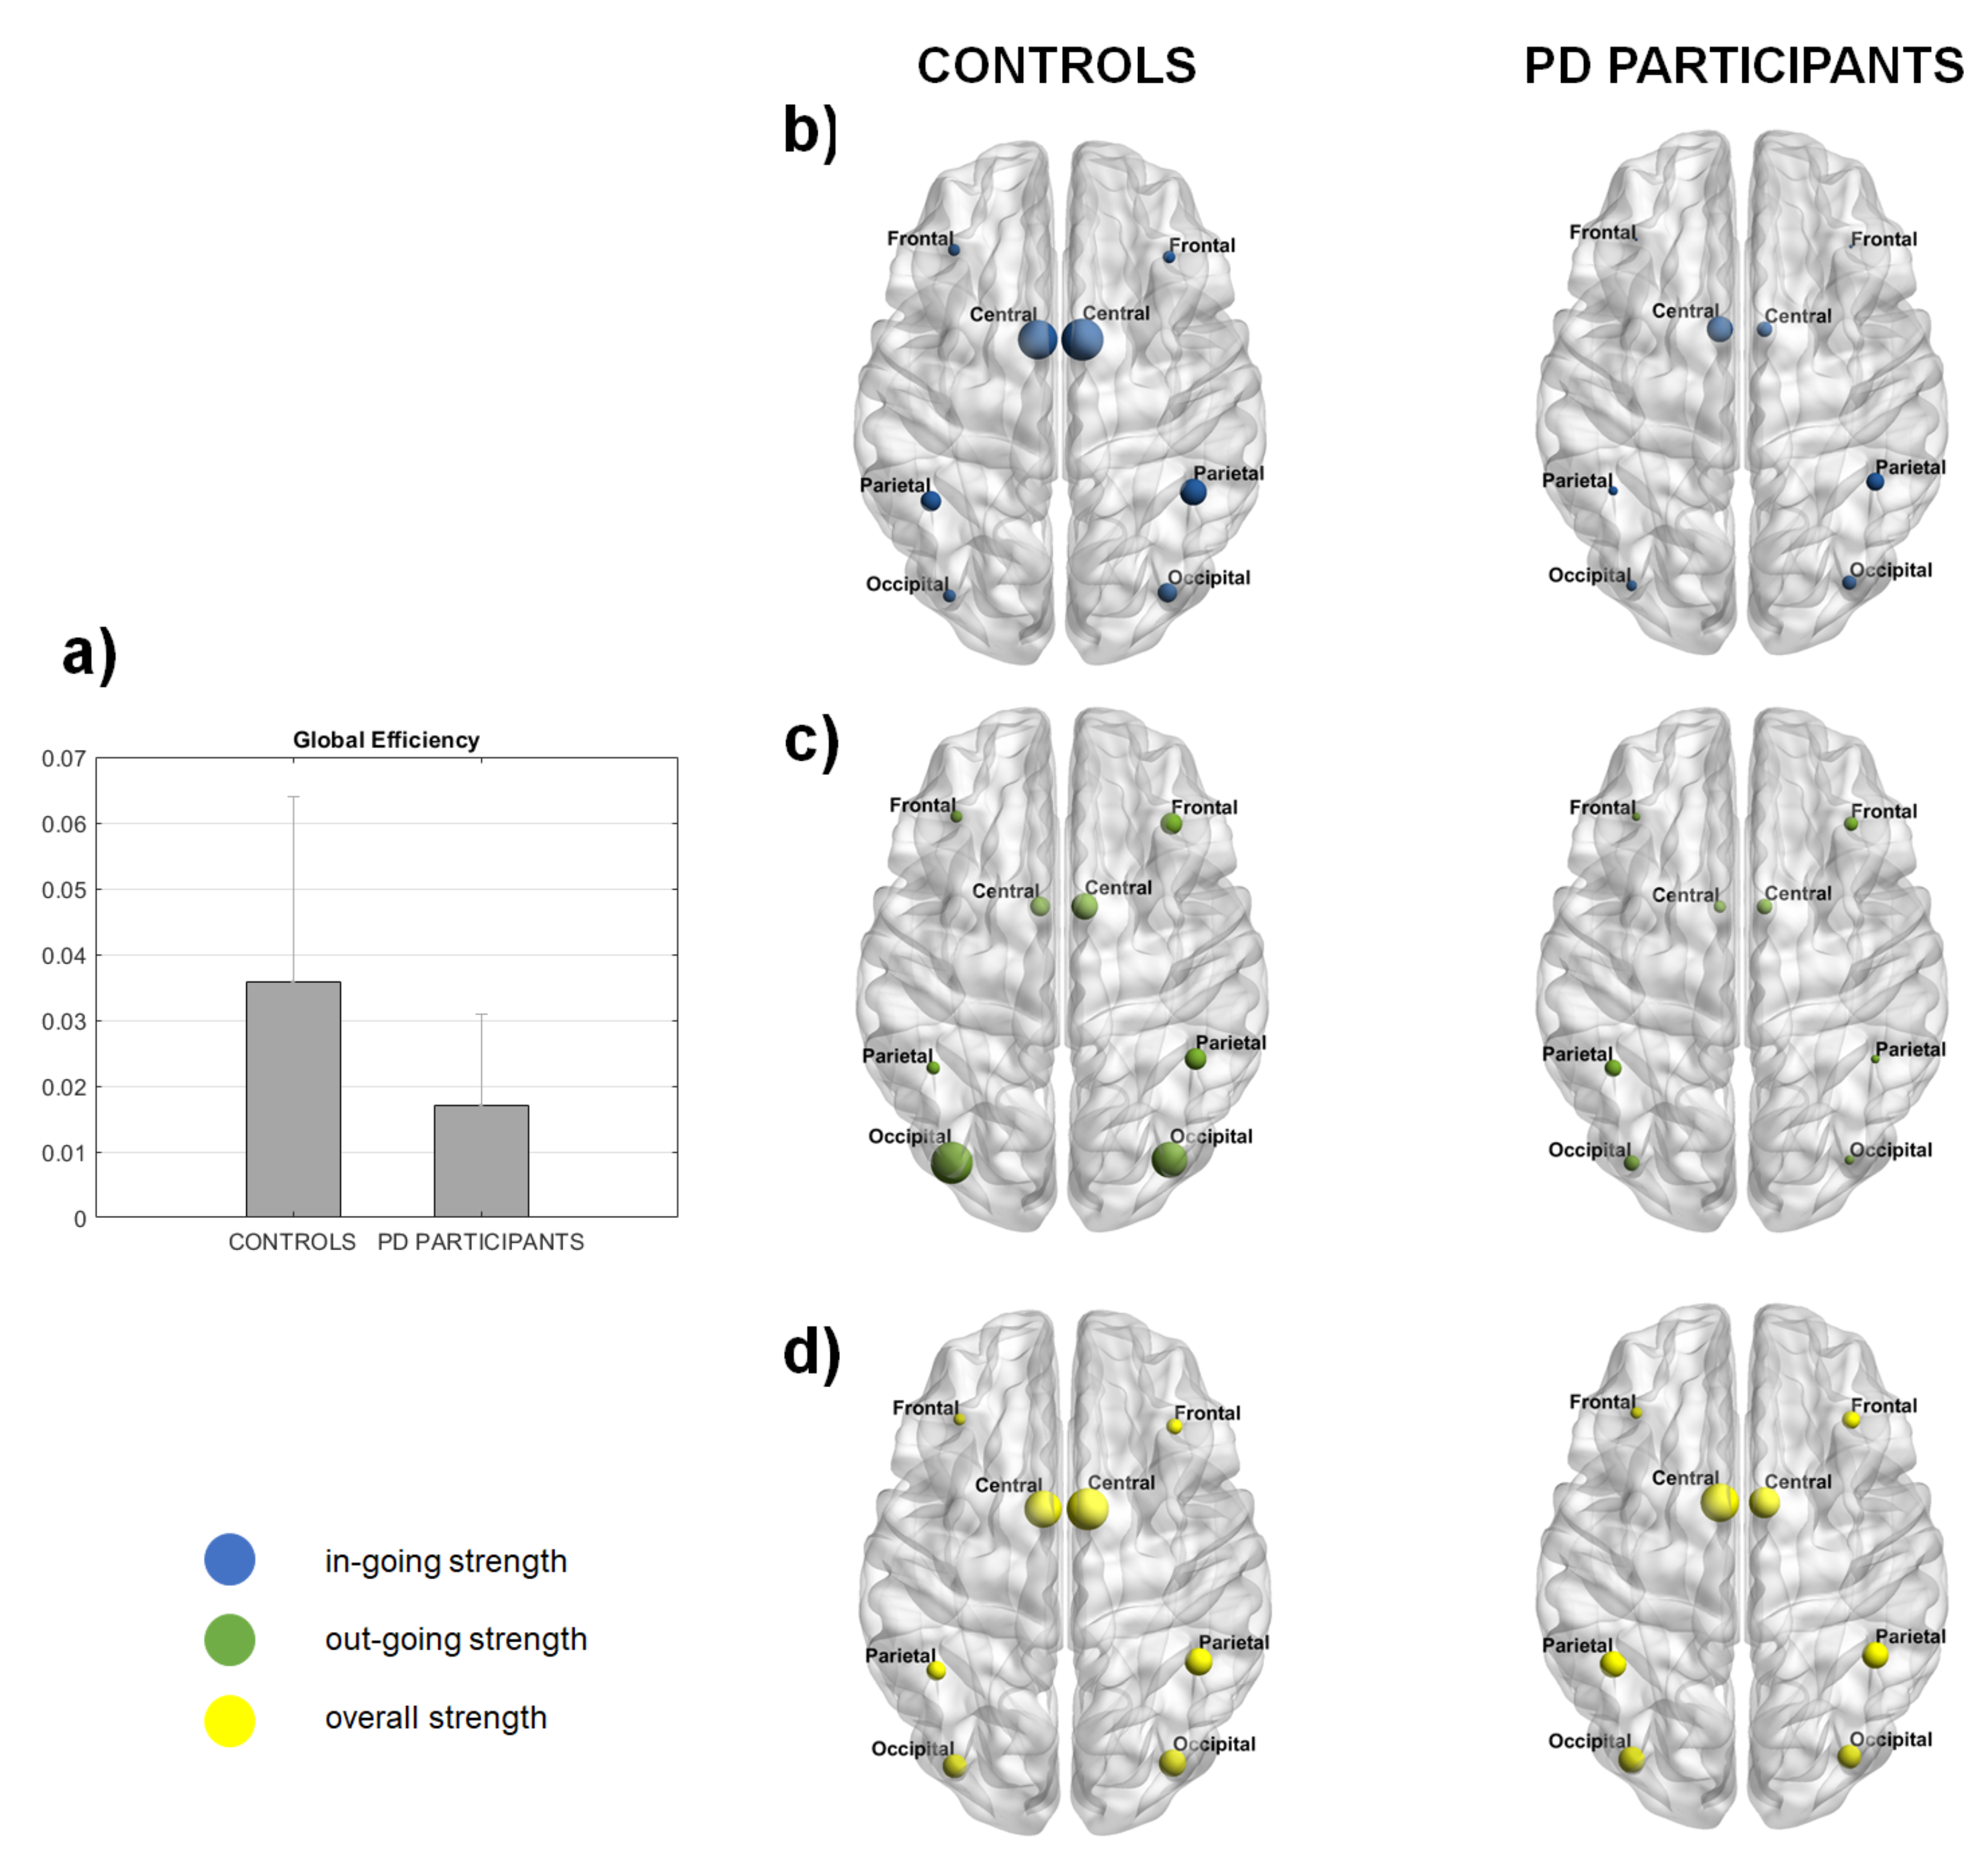
3. Results
4. Discussion
5. Conclusions
Author Contributions
Funding
Institutional Review Board Statement
Informed Consent Statement
Data Availability Statement
Acknowledgments
Conflicts of Interest
Abbreviations
| PD | Parkinson’s Disease |
| EEG | ElectroEncephaloGraphy |
| MVAR | MultiVariate AutoRegressive |
| MRI | Magnetic Resonance Imaging |
| fMRI | functional Magnetic Resonance Imaging |
| PMC | PreMotor Cortex |
| M1 | Primary Motor Cortex |
| GC | Granger Causality |
| MMSE | Mini Mental State Examination |
| ROI | Region Of Interest |
| BA | Brodmann Areas |
| MVGC | MultiVariate Granger Causality |
| AIC | Akaike parsimony criterion |
| FFT | Fast Fourier Transform |
| tDCS/tACS | transcranial Direct Current/Alternating Stimulation |
| rTMS | repetitive Transcranial Magnetic Stimulation |
References
- Sharman, M.; Valabregue, R.; Perlbarg, V.; Marrakchi-Kacem, L.; Vidailhet, M.; Benali, H.; Brice, A.; Lehéricy, S. Parkinson’s disease patients show reduced cortical-subcortical sensorimotor connectivity. Mov. Disord. 2013, 28, 447–454. [Google Scholar] [CrossRef]
- Wong, J.K.; Middlebrooks, E.H.; Grewal, S.S.; Almeida, L.; Hess, C.W.; Okun, M.S. A Comprehensive Review of Brain Connectomics and Imaging to Improve Deep Brain Stimulation Outcomes. Mov. Disord. 2020, 35, 741–751. [Google Scholar] [CrossRef] [PubMed]
- Cassidy, M.; Mazzone, P.; Oliviero, A.; Insola, A.; Tonali, P.; Di Lazzaro, V.; Brown, P. Movement-related changes in synchronization in the human basal ganglia. Brain 2002, 125, 1235–1246. [Google Scholar] [CrossRef]
- Granger, C.W. Investigating causal relations by econometric models and cross-spectral methods. Econom. J. Econom. Soc. 1969, 37, 424–438. [Google Scholar] [CrossRef]
- Damborská, A.; Honzírková, E.; Barteček, R.; Hořínková, J.; Fedorová, S.; Ondruš, Š.; Michel, C.M.; Rubega, M. Altered directed functional connectivity of the right amygdala in depression: High-density EEG study. Sci. Rep. 2020, 10, 4398. [Google Scholar] [CrossRef] [PubMed]
- Del Felice, A.; Magalini, A.; Masiero, S. Brain StimulSlow-oscillatory Transcranial Direct Current Stimulation Modulates Memory in Temporal Lobe Epilepsy by Altering Sleep Spindle Generators: A Possible Rehabilitation Tool. Brain Stimul. 2015, 8, 567–573. [Google Scholar] [CrossRef]
- Kühn, A.A.; Kempf, F.; Brücke, C.; Doyle, L.G.; Martinez-Torres, I.; Pogosyan, A.; Trottenberg, T.; Kupsch, A.; Schneider, G.H.; Hariz, M.I.; et al. High-frequency stimulation of the subthalamic nucleus suppresses oscillatory beta activity in patients with Parkinson’s disease in parallel with improvement in motor performance. J. Neurosci. 2008, 28, 6165–6173. [Google Scholar] [CrossRef]
- Hammond, C.; Bergman, H.; Brown, P. Pathological synchronization in Parkinson’s disease: Networks, models and treatments. Trends Neurosci. 2007, 30, 357–364. [Google Scholar] [CrossRef]
- Nettersheim, F.S.; Loehrer, P.A.; Weber, I.; Jung, F.; Dembek, T.A.; Pelzer, E.A.; Dafsari, H.S.; Huber, C.A.; Tittgemeyer, M.; Timmermann, L. Dopamine substitution alters effective connectivity of cortical prefrontal, premotor, and motor regions during complex bimanual finger movements in Parkinson’s disease. Neuroimage 2019, 190, 118–132. [Google Scholar] [CrossRef]
- Florin, E.; Pfeifer, J.; Visser-Vandewalle, V.; Schnitzler, A.; Timmermann, L. Parkinson subtype-specific Granger-causal coupling and coherence frequency in the subthalamic area. Neuroscience 2016, 332, 170–180. [Google Scholar] [CrossRef]
- Ghasemi, M.; Mahloojifar, A. Disorganization of Equilibrium Directional Interactions in the Brain Motor Network of Parkinson’s disease: New Insight of Resting State Analysis Using Granger Causality and Graphical Approach. J. Med. Signals Sens. 2013, 3, 69–78. [Google Scholar] [CrossRef]
- Hao, L.; Sheng, Z.; Ruijun, W.; Kun, H.Z.; Peng, Z.; Yu, H. Altered Granger causality connectivity within motor-related regions of patients with Parkinson’s disease: A resting-state fMRI study. Neuroradiology 2020, 62, 63–69. [Google Scholar] [CrossRef]
- Del Felice, A.; Castiglia, L.; Formaggio, E.; Cattelan, M.; Scarpa, B.; Manganotti, P.; Tenconi, E.; Masiero, S. Personalized transcranial alternating current stimulation (tACS) and physical therapy to treat motor and cognitive symptoms in Parkinson’s disease: A randomized cross-over trial. Neuroimage Clin. 2019, 22, 101768. [Google Scholar] [CrossRef]
- Delorme, A.; Makeig, S. EEGLAB: An open source toolbox for analysis of single-trial EEG dynamics including independent component analysis. J. Neurosci. Methods 2004, 134, 9–21. [Google Scholar] [CrossRef]
- Tadel, F.; Baillet, S.; Mosher, J.C.; Pantazis, D.; Leahy, R.M. Brainstorm: A user-friendly application for MEG/EEG analysis. Comput. Intell. Neurosci. 2011, 2011, 879716. [Google Scholar] [CrossRef] [PubMed]
- Mazziotta, J.; Toga, A.; Evans, A.; Fox, P.; Lancaster, J.; Zilles, K.; Woods, R.; Paus, T.; Simpson, G.; Pike, B.; et al. A four-dimensional probabilistic atlas of the human brain. J. Am. Med. Inform. Assoc. 2001, 8, 401–430. [Google Scholar] [CrossRef] [PubMed]
- Zilles, K.; Amunts, K.; Brodmann, K. Centenary of Brodmann’s map–conception and fate. Nat. Rev. Neurosci. 2010, 11, 139–145. [Google Scholar] [CrossRef]
- Barnett, L.; Seth, A.K. The MVGC multivariate Granger causality toolbox: A new approach to Granger-causal inference. J. Neurosci. Methods 2014, 223, 50–68. [Google Scholar] [CrossRef] [PubMed]
- Akaike, H. A new look at the statistical model identification. IEEE Trans. Autom. Control 1974, 19, 716–723. [Google Scholar] [CrossRef]
- Sporns, O.; Tononi, G.; Edelman, G.M. Theoretical neuroanatomy: Relating anatomical and functional connectivity in graphs and cortical connection matrices. Cereb. Cortex 2000, 10, 127–141. [Google Scholar] [CrossRef]
- Xia, M.; Wang, J.; He, Y. BrainNet Viewer: A network visualization tool for human brain connectomics. PLoS ONE 2013, 8, e68910. [Google Scholar] [CrossRef]
- Bullmore, E.; Sporns, O. Complex brain networks: Graph theoretical analysis of structural and functional systems. Nat. Rev. Neurosci. 2009, 10, 186–198. [Google Scholar] [CrossRef] [PubMed]
- Carboni, M.; Rubega, M.; Iannotti, G.R.; De Stefano, P.; Toscano, G.; Tourbier, S.; Pittau, F.; Hagmann, P.; Momjian, S.; Schaller, K.; et al. The network integration of epileptic activity in relation to surgical outcome. Clin. Neurophysiol. 2019, 130, 2193–2202. [Google Scholar] [CrossRef] [PubMed]
- Honey, C.J.; Kötter, R.; Breakspear, M.; Sporns, O. Network structure of cerebral cortex shapes functional connectivity on multiple time scales. Proc. Natl. Acad. Sci. USA 2007, 104, 10240–10245. [Google Scholar] [CrossRef] [PubMed]
- Fornito, A.; Zalesky, A.; Bullmore, E. Fundamentals of Brain Network Analysis; Academic Press: Cambridge, MA, USA, 2016. [Google Scholar]
- Fiorenzato, E.; Strafella, A.P.; Kim, J.; Schifano, R.; Weis, L.; Antonini, A.; Biundo, R. BrainDynamic functional connectivity changes associated with dementia in Parkinson’s disease. Brain 2019, 142, 2860–2872. [Google Scholar] [CrossRef]
- Abe, Y.; Kachi, T.; Kato, T.; Arahata, Y.; Yamada, T.; Washimi, Y.; Iwai, K.; Ito, K.; Yanagisawa, N.; Sobue, G. Occipital hypoperfusion in Parkinson’s disease without dementia: Correlation to impaired cortical visual processing. J. Neurol. Neurosurg. Psychiatry 2003, 74, 419–422. [Google Scholar] [CrossRef]
- Kloeters, S.; Hartmann, C.J.; Pundmann, V.D.; Schnitzler, A.; Südmeyer, M.; Lange, J. Impaired perception of human movements in Parkinson’s disease. Behav. Brain Res. 2017, 317, 88–94. [Google Scholar] [CrossRef]
- Tropini, G.; Chiang, J.; Wang, Z.J.; Ty, E.; McKeown, M.J. Altered directional connectivity in Parkinson’s disease during performance of a visually guided task. Neuroimage 2011, 56, 2144–2156. [Google Scholar] [CrossRef]
- Formaggio, E.; Masiero, S.; Bosco, A.; Izzi, F.; Piccione, F.; Del Felice, A. Quantitative EEG Evaluation During Robot-Assisted Foot Movement. IEEE Trans. Neural Syst. Rehabil. Eng. 2017, 25, 1633–1640. [Google Scholar] [CrossRef] [PubMed]
- Molteni, F.; Formaggio, E.; Bosco, A.; Guanziroli, E.; Piccione, F.; Masiero, S.; Del Felice, A. Connectivity Modulation After Exoskeleton-Assisted Gait in Chronic Hemiplegic Stroke Survivors: A Pilot Study. Am. J. Phys. Med. Rehabil. 2020, 99, 694–700. [Google Scholar] [CrossRef]
- Schaefer, S.Y.; Haaland, K.Y.; Sainburg, R.L. Ipsilesional motor deficits following stroke reflect hemispheric specializations for movement control. Brain 2007, 130, 2146–2158. [Google Scholar] [CrossRef] [PubMed]
- Parma, V.; Zanatto, D.; Straulino, E.; Scaravilli, T.; Castiello, U. Kinematics of the Reach-to-Grasp Movement in Vascular Parkinsonism: A Comparison with Idiopathic Parkinson’s Disease Patients. Front. Neurol. 2014, 5, 75. [Google Scholar] [CrossRef] [PubMed]
- Scarpina, F.; Magnani, F.G.; Tagini, S.; Priano, L.; Mauro, A.; Sedda, A. Mental representation of the body in action in Parkinson’s disease. Exp. Brain Res. 2019, 237, 2505–2521. [Google Scholar] [CrossRef]
- Kim, J.; Criaud, M.; Cho, S.S.; Díez-Cirarda, M.; Mihaescu, A.; Coakeley, S.; Ghadery, C.; Valli, M.; Jacobs, M.F.; Houle, S.; et al. Abnormal intrinsic brain functional network dynamics in Parkinson’s disease. Brain 2017, 140, 2955–2967. [Google Scholar] [CrossRef] [PubMed]
- Klobušiaková, P.; Mareček, R.; Fousek, J.; Výtvarová, E.; Rektorová, I. Connectivity Between Brain Networks Dynamically Reflects Cognitive Status of Parkinson’s Disease: A Longitudinal Study. J. Alzheimers Dis. 2019, 67, 971–984. [Google Scholar] [CrossRef] [PubMed]
- Wang, L.; Wang, M.; Si, Q.; Yuan, Y.; Ma, K.; Gan, C.; Zhang, K. Altered brain structural topological properties in Parkinson’s disease with levodopa-induced dyskinesias. Park. Relat. Disord. 2019, 67, 36–41. [Google Scholar] [CrossRef]
- Formaggio, E.; Tonellato, M.; Antonini, A.; Castiglia, L.; Gallo, L.; Manganotti, P.; Masiero, S.; Del Felice, A. Oscillatory EEG-TMS Reactivity in Parkinson Disease. J. Clin. Neurophysiol. Off. Publ. Am. Electroencephalogr. Soc. 2021. [Google Scholar] [CrossRef]
- Chen, C.C.; Hsu, Y.T.; Chan, H.L.; Chiou, S.M.; Tu, P.H.; Lee, S.T.; Tsai, C.H.; Lu, C.S.; Brown, P. Complexity of subthalamic 13–35 Hz oscillatory activity directly correlates with clinical impairment in patients with Parkinson’s disease. Exp. Neurol. 2010, 224, 234–240. [Google Scholar] [CrossRef]
- Little, S.; Pogosyan, A.; Kuhn, A.; Brown, P. Beta band stability over time correlates with Parkinsonian rigidity and bradykinesia. Exp. Neurol. 2012, 236, 383–388. [Google Scholar] [CrossRef]
- Benabid, A.L.; Pollak, P.; Louveau, A.; Henry, S.; de Rougemont, J. Combined (thalamotomy and stimulation) stereotactic surgery of the VIM thalamic nucleus for bilateral Parkinson disease. Appl. Neurophysiol. 1987, 50, 344–346. [Google Scholar] [CrossRef]
- Cilia, R.; Landi, A.; Vergani, F.; Sganzerla, E.; Pezzoli, G.; Antonini, A. Extradural motor cortex stimulation in Parkinson’s disease. Mov. Disord. 2007, 22, 111–114. [Google Scholar] [CrossRef] [PubMed]
- Biundo, R.; Weis, L.; Antonini, A. tDCS effect on cognitive performance in Parkinson’s disease. Mov. Disord. 2016, 31, 1253–1254. [Google Scholar] [CrossRef] [PubMed]
- Delgado-Alvarado, M.; Marano, M.; Santurtún, A.; Urtiaga-Gallano, A.; Tordesillas-Gutierrez, D.; Infante, J. Nonpharmacological, nonsurgical treatments for freezing of gait in Parkinson’s disease: A systematic review. Mov. Disord. 2020, 35, 204–214. [Google Scholar] [CrossRef]
- Pizzo, F.; Roehri, N.; Villalon, S.M.; Trébuchon, A.; Chen, S.; Lagarde, S.; Carron, R.; Gavaret, M.; Giusiano, B.; McGonigal, A.; et al. Author Correction: Deep brain activities can be detected with magnetoencephalography. Nat. Commun. 2021, 12, 2566. [Google Scholar] [CrossRef] [PubMed]
- Seeber, M.; Cantonas, L.M.; Hoevels, M.; Sesia, T.; Visser-Vandewalle, V.; Michel, C.M. Subcortical electrophysiological activity is detectable with high-density EEG source imaging. Nat. Commun. 2019, 10, 753. [Google Scholar] [CrossRef] [PubMed]
- Bastos, A.M.; Schoffelen, J.M. A tutorial review of functional connectivity analysis methods and their interpretational pitfalls. Front. Syst. Neurosci. 2016, 9, 175. [Google Scholar] [CrossRef]
- Song, J.; Davey, C.; Poulsen, C.; Luu, P.; Turovets, S.; Anderson, E.; Li, K.; Tucker, D. EEG source localization: Sensor density and head surface coverage. J. Neurosci. Methods 2015, 256, 9–21. [Google Scholar] [CrossRef]
- Rubega, M.; Carboni, M.; Seeber, M.; Pascucci, D.; Tourbier, S.; Toscano, G.; Van Mierlo, P.; Hagmann, P.; Plomp, G.; Vulliemoz, S.; et al. Estimating EEG Source Dipole Orientation Based on Singular-value Decomposition for Connectivity Analysis. Brain Topogr. 2019, 32, 704–719. [Google Scholar] [CrossRef] [PubMed]
- Guo, S.; Seth, A.K.; Kendrick, K.M.; Zhou, C.; Feng, J. Partial Granger causality–eliminating exogenous inputs and latent variables. J. Neurosci. Methods 2008, 172, 79–93. [Google Scholar] [CrossRef]
- Chen, Y.; Bressler, S.L.; Ding, M. Frequency decomposition of conditional Granger causality and application to multivariate neural field potential data. J. Neurosci. Methods 2006, 150, 228–237. [Google Scholar] [CrossRef] [PubMed]
- Wen, X.; Rangarajan, G.; Ding, M. Multivariate Granger causality: An estimation framework based on factorization of the spectral density matrix. Philos. Trans. A Math. Phys. Eng. Sci. 2013, 371, 20110610. [Google Scholar] [CrossRef] [PubMed]
- Blinowska, K.J. Review of the methods of determination of directed connectivity from multichannel data. Med. Biol. Eng. Comput. 2011, 49, 521–529. [Google Scholar] [CrossRef] [PubMed]
- Baccalá, L.A.; Sameshima, K. Partial directed coherence: A new concept in neural structure determination. Biol. Cybern. 2001, 84, 463–474. [Google Scholar] [CrossRef]
- Pascucci, D.; Rubega, M.; Plomp, G. Modeling time-varying brain networks with a self-tuning optimized Kalman filter. PLoS Comput. Biol. 2020, 16, e1007566. [Google Scholar] [CrossRef] [PubMed]


| Subject (S) | Age | Sex | Education |
|---|---|---|---|
| 1 | 72 y | Male | 16 y |
| 2 | 64 y | Female | 5 y |
| 3 | 73 y | Male | 13 y |
| 4 | 79 y | Male | 5 y |
| 5 | 80 y | Female | 13 y |
| 6 | 69 y | Male | 8 y |
| 7 | 61 y | Female | 11 y |
| 8 | 75 y | Male | 13 y |
| 9 | 71 y | Male | 17 y |
| 10 | 63 y | Male | 10 y |
| 11 | 68 y | Male | 17 y |
| 12 | 60 y | Male | 17 y |
| 13 | 65 y | Female | 5 y |
| 14 | 66 y | Female | 17 y |
| 15 | 83 y | Female | 5 y |
| S | Duration | L-Dopa Dose | UPDRS III | Bradykinesia | Tremor | Axial Symptoms |
|---|---|---|---|---|---|---|
| 1 | 2 y | 800 mg | 36 | 4 | 1 | 1 |
| 2 | 2 y | 450 mg | 28 | 6 | 0 | 1 |
| 3 | 1 y | 200 mg | 30 | 2 | 0 | 1 |
| 4 | 10 y | 300 mg | 31 | 4 | 2 | 0 |
| 5 | 3 y | 300 mg | 37 | 5 | 0 | 0 |
| 6 | 9 y | 750 mg | 35 | 1 | 0 | 2 |
| 7 | 11 y | 600 mg | 36 | 0 | 0 | 0 |
| 8 | 18 y | 600 mg | 29 | 3 | 0 | 1 |
| 9 | 6 y | 400 mg | 35 | 4 | 1 | 1 |
| 10 | 7 y | 450 mg | 32 | 2 | 0 | 2 |
| 11 | 2 y | 300 mg | 27 | 1 | 0 | 2 |
| 12 | 2 y | 200 mg | 38 | 2 | 1 | 1 |
| 13 | 8 y | 400 mg | 32 | 3 | 2 | 1 |
| 14 | 6 y | 600 mg | 35 | 3 | 0 | 0 |
| 15 | 4 y | 400 mg | 36 | 3 | 0 | 1 |
Publisher’s Note: MDPI stays neutral with regard to jurisdictional claims in published maps and institutional affiliations. |
© 2021 by the authors. Licensee MDPI, Basel, Switzerland. This article is an open access article distributed under the terms and conditions of the Creative Commons Attribution (CC BY) license (https://creativecommons.org/licenses/by/4.0/).
Share and Cite
Formaggio, E.; Rubega, M.; Rupil, J.; Antonini, A.; Masiero, S.; Toffolo, G.M.; Del Felice, A. Reduced Effective Connectivity in the Motor Cortex in Parkinson’s Disease. Brain Sci. 2021, 11, 1200. https://doi.org/10.3390/brainsci11091200
Formaggio E, Rubega M, Rupil J, Antonini A, Masiero S, Toffolo GM, Del Felice A. Reduced Effective Connectivity in the Motor Cortex in Parkinson’s Disease. Brain Sciences. 2021; 11(9):1200. https://doi.org/10.3390/brainsci11091200
Chicago/Turabian StyleFormaggio, Emanuela, Maria Rubega, Jessica Rupil, Angelo Antonini, Stefano Masiero, Gianna Maria Toffolo, and Alessandra Del Felice. 2021. "Reduced Effective Connectivity in the Motor Cortex in Parkinson’s Disease" Brain Sciences 11, no. 9: 1200. https://doi.org/10.3390/brainsci11091200
APA StyleFormaggio, E., Rubega, M., Rupil, J., Antonini, A., Masiero, S., Toffolo, G. M., & Del Felice, A. (2021). Reduced Effective Connectivity in the Motor Cortex in Parkinson’s Disease. Brain Sciences, 11(9), 1200. https://doi.org/10.3390/brainsci11091200