Article

Downregulation of CD73/A2AR-Mediated Adenosine Signaling as a Potential Mechanism of Neuroprotective Effects of Theta-Burst Transcranial Magnetic Stimulation in Acute Experimental Autoimmune Encephalomyelitis

1
Department for General Physiology and Biophysics, Faculty of Biology, University of Belgrade, 11000 Belgrade, Serbia
2
Institute for Medical Research, Military Medical Academy, 11000 Belgrade, Serbia
3
Medical Faculty of Military Medical Academy, University of Defense, 11000 Belgrade, Serbia
4
Department of Molecular Biology and Endocrinology, Vinča Institute of Nuclear Sciences-National Institute of the Republic of Serbia, University of Belgrade, 11000 Belgrade, Serbia
5
Medical Faculty, University of Belgrade, 11000 Belgrade, Serbia
6
Clinic of Physical Medicine and Rehabilitation, Clinical Center of Serbia, 11000 Belgrade, Serbia
*
Author to whom correspondence should be addressed.
Brain Sci. 2021, 11(6), 736; https://doi.org/10.3390/brainsci11060736
Submission received: 13 April 2021 / Revised: 12 May 2021 / Accepted: 17 May 2021 / Published: 1 June 2021

Abstract

:
Multiple sclerosis (MS) is a chronic neurodegenerative disease caused by autoimmune-mediated inflammation in the central nervous system. Purinergic signaling is critically involved in MS-associated neuroinflammation and its most widely applied animal model—experimental autoimmune encephalomyelitis (EAE). A promising but poorly understood approach in the treatment of MS is repetitive transcranial magnetic stimulation. In the present study, we aimed to investigate the effect of continuous theta-burst stimulation (CTBS), applied over frontal cranial bone, on the adenosine-mediated signaling system in EAE, particularly on CD73/A2AR/A1R in the context of neuroinflammatory activation of glial cells. EAE was induced in two-month-old female DA rats and in the disease peak treated with CTBS protocol for ten consecutive days. Lumbosacral spinal cord was analyzed immunohistochemically for adenosine-mediated signaling components and pro- and anti-inflammatory factors. We found downregulated IL-1β and NF- κB-ir and upregulated IL-10 pointing towards a reduction in the neuroinflammatory process in EAE animals after CTBS treatment. Furthermore, CTBS attenuated EAE-induced glial eN/CD73 expression and activity, while inducing a shift in A2AR expression from glia to neurons, contrary to EAE, where tight coupling of eN/CD73 and A2AR on glial cells is observed. Finally, increased glial A1R expression following CTBS supports anti-inflammatory adenosine actions and potentially contributes to the overall neuroprotective effect observed in EAE animals after CTBS treatment.

Graphical Abstract

1. Introduction

Multiple sclerosis (MS) is a progressive demyelinating and neurodegenerative disorder driven by the adaptive immune response [1,2] and inflicts primary damage to the myelin sheath [3]. Succeeding inflammation and glial cell activation result in diffuse plaques of demyelination and axonal loss in multiple areas of the brain and spinal cord, which are the main cause of progressive neurological disability and motor dysfunctions in MS [4]. The histopathological deteriorations create many other symptoms, including pain, depression, spasticity, and cognitive deficits, which also progress over time [5]. The most common form of MS is relapse-remitting MS (RRMS), occurring in 85% of patients, characterized by symptomatic loss-of-function periods (relapses), followed by complete or partial remissions. Even though a compelling improvement is made regarding the introduction of new disease-modifying treatments, a significant number of patients will still develop a secondary progressive form of MS (SPMS) [6]. Accordingly, new therapeutic, neuroprotective, and myelination supportive approaches able to ameliorate neuroinflammation and neurotoxic reactive phenotype of astrocytes and microglia are major unmet clinical needs in MS [7].
Neuroinflammation driven by astrocytes and microglia in pathological conditions including MS—and its most widely used animal model experimental autoimmune encephalomyelitis (EAE)—is closely regulated by purinergic signaling. Specifically, the neuroinflammatory responses of glial cells begin with an emergence of danger-associated molecular patterns (DAMP), among which adenosine triphosphate (ATP) plays a particular role. Under the pathological conditions, damaged or dying neurons release large amounts of ATP [8,9], which acts at nucleotide-responsive purinoreceptors, P2X or P2Y, to initiate pro-inflammatory actions of glial cells [8]. The action of extracellular ATP at purinoreceptors is ceased by its sequential hydrolysis, mediated by the ectonucleotidase enzyme chain (CD39/NTPDase1, NTPDase2, and CD73). The last step is the hydrolysis of AMP, mediated via ecto-5′-nucleotidase (eN/Cluster of differentiation 73 (CD73)), resulting in the production of adenosine [10,11]. One longitudinal study in MS patients [12] showed that impaired metabolism of extracellular ATP and drop of adenosine in the cerebrospinal fluid were associated with significantly faster disability progression in MS patients over time. Similarly, reduced production of adenosine in blood serum and increased production in the spinal cord tissue [13] were registered along with a strong upregulation of CD73 by reactive astrocytes during the symptomatic phase of EAE [14].
Adenosine, generated by the catalytic action of CD73, acts at P1 receptor subtypes, A1, A2A, A2B, and A3, which are abundantly expressed in the CNS [15]. Adenosine plays a critical role in the regulation and complex modal changes in glial cells during neuroinflammation [16]. Although it is generally considered that adenosine, unlike ATP, elicits anti-inflammatory and immunosuppressive effects [17], its effects critically depend on a particular P1 receptor subtype(s), which mediates the adenosine [18]. Thus, concerning MS/EAE, evidence suggests that potentiation of A1R and blockade of A2AR-mediated adenosine actions induce strong neuroprotective actions via the attenuation of glial cells’ reactivity [15,18,19,20,21,22].
One promising but poorly exploited clinical approach in MS is repetitive transcranial magnetic stimulation (rTMS). rTMS refers to a non-invasive and painless stimulation protocol designed to modulate excitability and activity in several brain systems, by applying magnetic pulses delivered in predefined administration patterns [23,24,25]. Theta-burst stimulation protocol (TBS) is a highly effective version of rTMS, which affords a short stimulation time, low stimulus intensity, and improved reliability of rTMS [26]. Over the past decade, several studies have shown that rTMS stimulation induces measurable clinical outcomes in several neurological disorders, including depression, schizophrenia, stroke, Alzheimer’s disease, and Parkinson’s disease, and significant improvement of motor and cognitive functions in healthy subjects [27,28,29,30,31,32]. So far, studies have demonstrated limited clinical value of rTMS in MS patients [33,34], particularly regarding motor dysfunction [35,36].
Despite numerous positive neurological outcomes in several neurological disorders, mechanisms underlying the plasticity induced by TBS are poorly understood, which urges the need for preclinical animal testing. Up to date, the efficacy of different TBS protocols has been explored in animal studies using EAE, as an experimental paradigm of RRMS. The studies have demonstrated reduced oxidative stress [37,38], attenuation of gliosis [39], and increased expression of brain-derived neurotrophic factor (BDNF) [40]. Therefore, the present study aims to explore the effect of continuous theta-burst stimulation (CTBS) protocol on purinergic system activity in the context of neuroinflammation associated with experimental autoimmune encephalomyelitis in Dark Agouti rats. If proven effective, these data could incite translation into clinical practice as an early/add-on non-invasive therapeutic intervention.

2. Material and Methods

2.1. Ethical Statement

All experimental procedures were approved by Ethics Comity of Military Medical Academy (Application No. 323-07-00622/2017-05). Care was taken to minimize the pain and discomfort of the experimental animals in accordance with EU Directive 2010/63/EU.

2.2. Animals

This study was performed on two months old female Dark Agouti (DA) rats (150–200 g) acquired from Military Medical Academy local colony. All animas were housed under standardized conditions (constant humidity 55 ± 3%, temperature 23 ± 2 oC, 13/11 h light/dark regime) in polyethylene cages (3 animals per cage) with food and water ad libitum.

2.3. Induction of Experimental Autoimmune Encephalomyelitis

Acute experimental autoimmune encephalomyelitis was induced as previously described [39]. Briefly, animals were anesthetized with sodium pentobarbital (45 mg/kg, Trittay, Germany) and s.c. injected with 0.1 mL of encephalogenic emulsion comprising complete Freund’s Adjuvant (CFA, 1 mg/mL Mycobacterium tuberculosis, Sigma, St. Louis, MO, USA) and rat spinal cord tissue homogenate (50% w/v in saline) in right hind foot.
The animals were weighed and daily scored for neurological signs of EAE for 24 days post-injection (dpi) using the standard EAE scoring scale (0–5): 0 = unaffected/no sign of illness; 0.5 = reduced tail tone; 1 = tail atony; 1.5 = slightly clumsy gait, impaired righting ability or combination; 2 = hind limb paresis; 2.5 = partial hind limb paralysis; 3 = complete hind limb paralysis; 3.5 = complete hind limb paralysis accompanied with forelimb weakness; 4 = tetraplegic; 5 = morbidus state or death [41]. Daily score was averaged taking into account all animals within the experimental group.

2.4. Theta-Burst Stimulation Protocol

In the present study, theta-burst stimulation (TBS) was applied in the form of continuous protocol (CTBS), as previously described [39,40,42]. Briefly, the stimulation was performed using MagStim Rapid2 device via 25 mm figure-of-eight coil (The MagStim Company, Whitland, UK). Continuous protocol was applied according to [43]. The CTBS block was administered as a single 40 s train of bursts repeated at a frequency of 5 Hz, each block containing 600 pulses. Stimulation intensity was set at 30% of maximal output, just below a motor threshold value. The stimulation was applied by holding the center of the coil directly above the frontal cranial bone in close contact with the scalp of a manually immobilized animal. Given that a coil size is larger than cranium of an animal, application over the frontal cranial bone provides equally distributed whole brain stimulation.

2.5. Experimental Groups and Treatment

All animals were divided into four experimental groups: naïve, healthy animals (n = 8), EAE animals (sacrificed on day 24, n = 8), EAE animals subjected to CTBS protocol (n = 8), and animals subjected to sham CTBS noise artifact (n = 8). Animals were subjected to either CTBS or noise artifact for 10 consecutive days, starting at 14 dpi, when clinical scoring showed disease peak (Figure 1). The next day, animals were decapitated using Harvard Apparatus, and spinal cord tissue was processed for immunohistochemistry. Given that sham groups did not produce any qualitative/quantitative change when compared to non-treated animals, those images were not shown.

2.6. Enzyme Histochemistry

Ectonucleotidase enzyme histochemistry based on the AMP-hydrolyzing activities of and eN/CD73 has been applied, as previously described [44]. Briefly, cryosections were preincubated for 30 min at RT in TRIS-maleate sucrose buffer (TMS), containing 0.25 M sucrose, 50 mM TRIS-maleate, 2 mM MgCl2 (pH 7.4), and 2 mM levamisole, to inhibit tissue non-specific alkaline phosphatase. The enzyme reaction was carried out at 37 °C/90 min, in TMS buffer, containing 2 mM Pb(NO3)2, 5 mM MnCl2, 3% dextran T250, and 1 mM substrate (ATP, ADP, or AMP), as substrate. After thorough washing, slides were immersed in 1% (v/v) (NH4)2S, and the product of enzyme reaction was visualized as an insoluble brown precipitate at a site of the enzyme activity. After dehydration in graded ethanol solutions (70–100% EtOH and 100% xylol), slides were mounted with a DPX-mounting medium (Sigma Aldrich, Saint Louise, MO, USA). The sections were examined under LEITZ DM RB light microscope (Leica Mikroskopie and Systems GmbH, Wetzlar, Germany), equipped with LEICA DFC320 CCD camera (Leica Microsystems Ltd., Heerbrugg, Switzerland) and analyzed using LEICA DFC Twain Software (Leica, Wetzlar, Germany).

2.7. Immunofluorescence and Confocal Microscopy

Lumbar areas of the spinal cords (3–4 animals per group) were removed from decapitated animals and fixed in 4% paraformaldehyde (0.1 M PBS, pH 7.4, 12 h at 4 °C) and dehydrated in graded sucrose solution (10–30% in 0.1 M PBS, pH 7.4). After dehydration, 25 µm sections were cut on crytome and collected serially, mounted on supefrost glass slides, air-dried for 1–2 h at room temperature, and stored at 20 °C until staining. After rehydration and washing steps in PBS, sections were blocked with 5% normal donkey serum at room temperature for 1 h, followed by incubation with primary antibodies (Table 1). Slides were then probed with appropriate secondary antibodies (Table 1) for 2 h at room temperature in the dark chamber. Slides were covered using the Mowiol medium (Sigma Aldrich, USA) and left to dry at 4 °C over night. Slides were examined using a confocal laser-scanning microscope (LSM 510, Carl Zeiss, GmbH, Jena, Germany) using Ar multi-line (457, 478, 488, and 514 nm), HeNe (543 nm), HeNe (643 nm) lasers using 63× (×2 digital zoom) DIC oil, 40× and monochrome camera AxioCam ICm1 camera (Carl Zeiss, GmbH, Germany).

2.8. Quantification of Immunofluorescence and Multi-Image Colocalization Analysis

All image quantification and analysis were performed using ImageJ software (free download from https://imagej.net/Dowloads, accessed on 10 April 2021). In order to evaluate a degree of overlap and correlation between multiple channels, we performed multi-image colocalization analysis using the JACoP ImageJ plugin. A degree of overlap and correlation between channels was estimated by calculating Pearson’s correlation coefficient (PCC) and Manders’ correlation coefficient (MCC). We captured 7–9 images/animal of the white matter under the same conditions (1024 × 1024, laser gain and exposure) and performed PCC and MCC analysis. Analysis was performed on 40× magnification for PCC and 63× magnifications for MCC analysis. Given that astrocytes and microglia were closely related and often intermingled without clear borders, especially in EAE group, whole images were used for analysis rather than single cell [45]. PCC is a statistical parameter that reflects co-occurrence and correlation of analyzed channels. On the other hand, MCC measures fractional overlap between two signals, signal 1 and signal 2. MCC1 quantifies the fraction of signal 1 that co-localizes with signal 2, while MCC2 represents the fraction of signal 2 that overlaps with signal 1 [45].

2.9. Statistical Analysis

The values are presented either as mean ± SD or SEM, as indicated. Data were first assessed for normality using Shapiro–Wilk followed by adequate parametric test. One-way ANOVA followed by Tuckey post hoc test were used in GraphPad Prism v. 6.03. The p < 0.05 was considered to be significant (Table 2).

3. Results

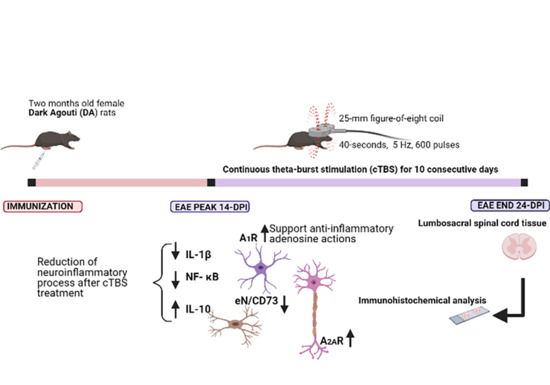
3.1. The Effect of Continuous Theta-Burst Stimulation on the Disease Course

Injection of the encephalitogenic emulsion in susceptible DA rats resulted in a typical acute disease, characterized by gradual neurological deterioration and significant weight loss followed by a spontaneous recovery (Figure 2), as previously reported [39]. Briefly, in the non-treated group (EAE), the first clinical signs of EAE appeared at ~10 post-injection (dpi), peaked at 14 dpi, and withdrew at ~24 dpi. In the group subjected to the CTBS protocol (EAE+CTBS), the stimulation was applied to start from 14 dpi for 10 consecutive days. The effect of the CTBS noise artifact was explored in the sham group of animals (EAE+CTBSpl), which were subjected to the noise artifact according to the same experimental scheme. Significant reduction in duration, disability, and weight loss were observed after CTBS treatment, compared to both sham and naïve animals, as previously published (Figure 2) [37,39].

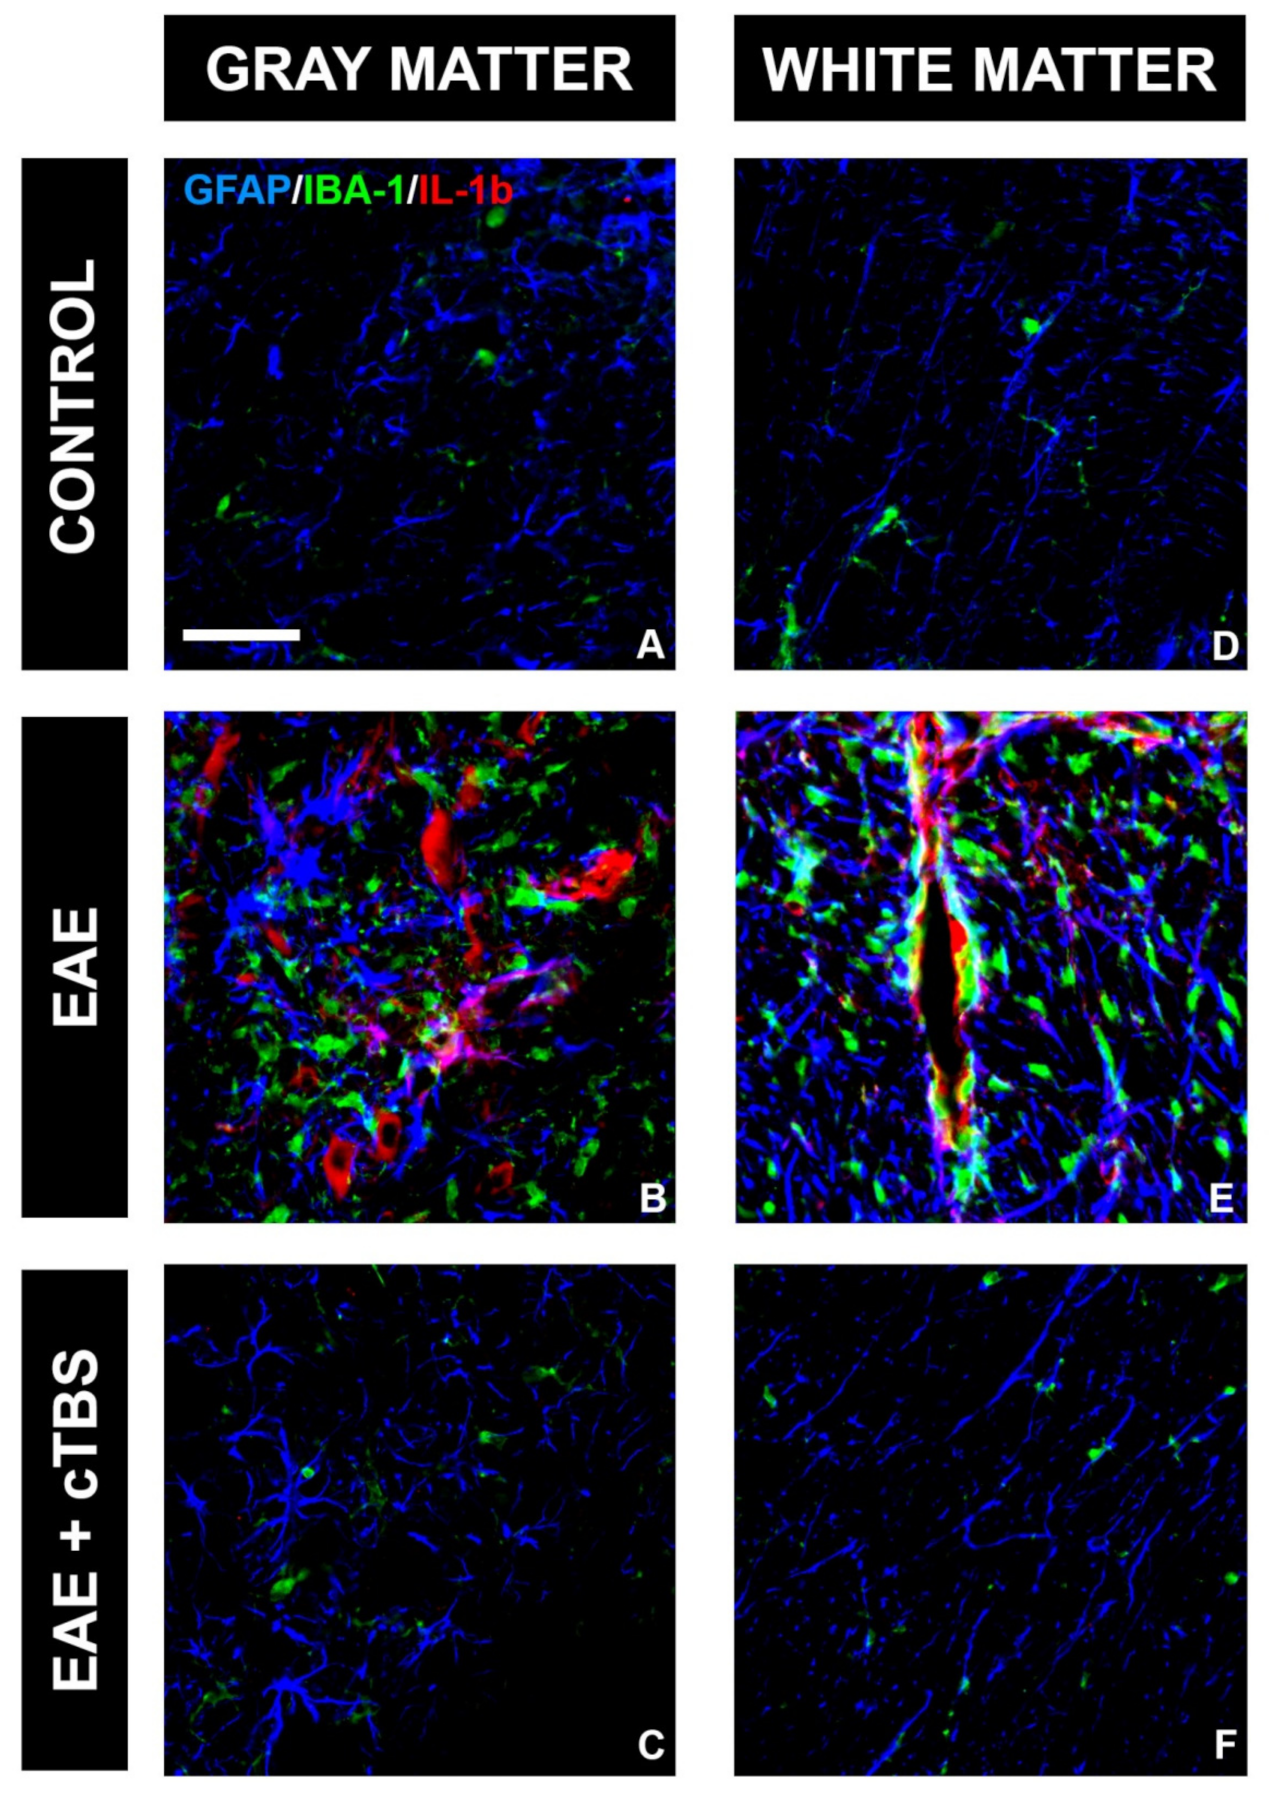
3.2. CTBS Promotes Anti-Inflammatory Milieu in EAE

One of the critical pathological features of EAE/MS is the invasion of peripheral immune cells into the CNS parenchyma and the release of pro-inflammatory mediators, which initiate the neuroinflammatory response of astrocytes and microglia. Therefore, we first examined the effect of CTBS on the inflammatory milieu induced by EAE. IL-1β is a master inflammatory cytokine and the effector molecule in MS/EAE [46]. While control tissue did not express IL-1β-immunoreactive (ir) signal (Figure 3A,D), conspicuous IL-1β-ir, mostly residing at GFAP-ir astrocytes and IBA-1-ir microglial cells, were observed in the gray (Figure 3B) and white matter (Figure 3E) of EAE animals, respectively. Prominent IL-1β-ir was also observed at neuronal cell bodies in both ventral and dorsal gray matter (Figure 3B). However, the upregulation of IL-1β was completely prevented in EAE animals subjected to CTBS, together with the GFAP-ir and Iba-1-ir lowered to the level seen in healthy control (Figure 3C,F). The downstream signaling cascade of IL-1β initiates nuclear factor kappa-light-chain-enhancer of activated B cells (NF-κB) family of transcription factors, which trigger the transcription of proinflammatory genes [47]. Strong NF-κB-ir, mostly residing at GFAP-ir astrocytes cells in EAE animals (Figure 4B, arrowhead), was attenuated to a control level after CTBS treatment protocol (Figure 4C). The cytokine IL-10, on the other hand, exhibits immune response downregulatory properties, which include suppression of the synthesis and release of pro-inflammatory cytokines (PMID: 10320650). Basal IL-10-ir in control sections (Figure 5A) was attenuated in EAE (Figure 5B), while CTBS protocol enhanced the intensity of IL-10-ir in comparison to control (Figure 5C). The IL-10-ir mostly resided at GFAP-ir astrocytes (Figure 5C). Sham-treated animals did not show any observable changes when compared to EAE (not shown).

3.3. CTBS Attenuates EAE-Induced Expression of CD73

The main objective of the present study was to evaluate the effects of CTBS on purinergic system activity in the context of neuroinflammatory activation of astrocytes and microglia. Hence, we first examined the level of expression and cellular localization of CD73 in the spinal cord tissue in control, non-treated, and CTBS-treated EAE animals (Figure 6). The degree of overlap between CD73 and selected fluorescence signals was determined by calculating PCC and MCC coefficients, which reflect the co-occurrence of selected signals and the fraction of pixels with positive values for selected signals, respectively. In control sections, faint CD73-ir was mainly associated with quiescent GFAP-ir cells and only sporadically with IBA-1-ir microglia (Figure 6A,a). A prominent increase in CD73-ir in EAE was mainly associated with IBA-1-ir (Figure 6B), which is reflected with the increase in both PCC and MCC2 for the two signals, and only marginally with GFAP-ir (p < 0.05; Figure 6D). The increase in CD73-ir was completely reversed by the CTBS treatment (Figure 6C,c), which was reflected with a decrease in MCC2 value primarily for CD73-IBA-1, but also for CD73-GFAP overlap (p < 0.05, Figure 6E). The occurrence of CD73-ir with both fluorescence tracers for astrocytes and microglia was confirmed with the Z-stack imaging (Figure 6F). Interestingly, the fraction of the CD73-ir in control and CTBS sections was found without association with GFAP- and IBA-1-ir (Figure 6c, arrowheads).

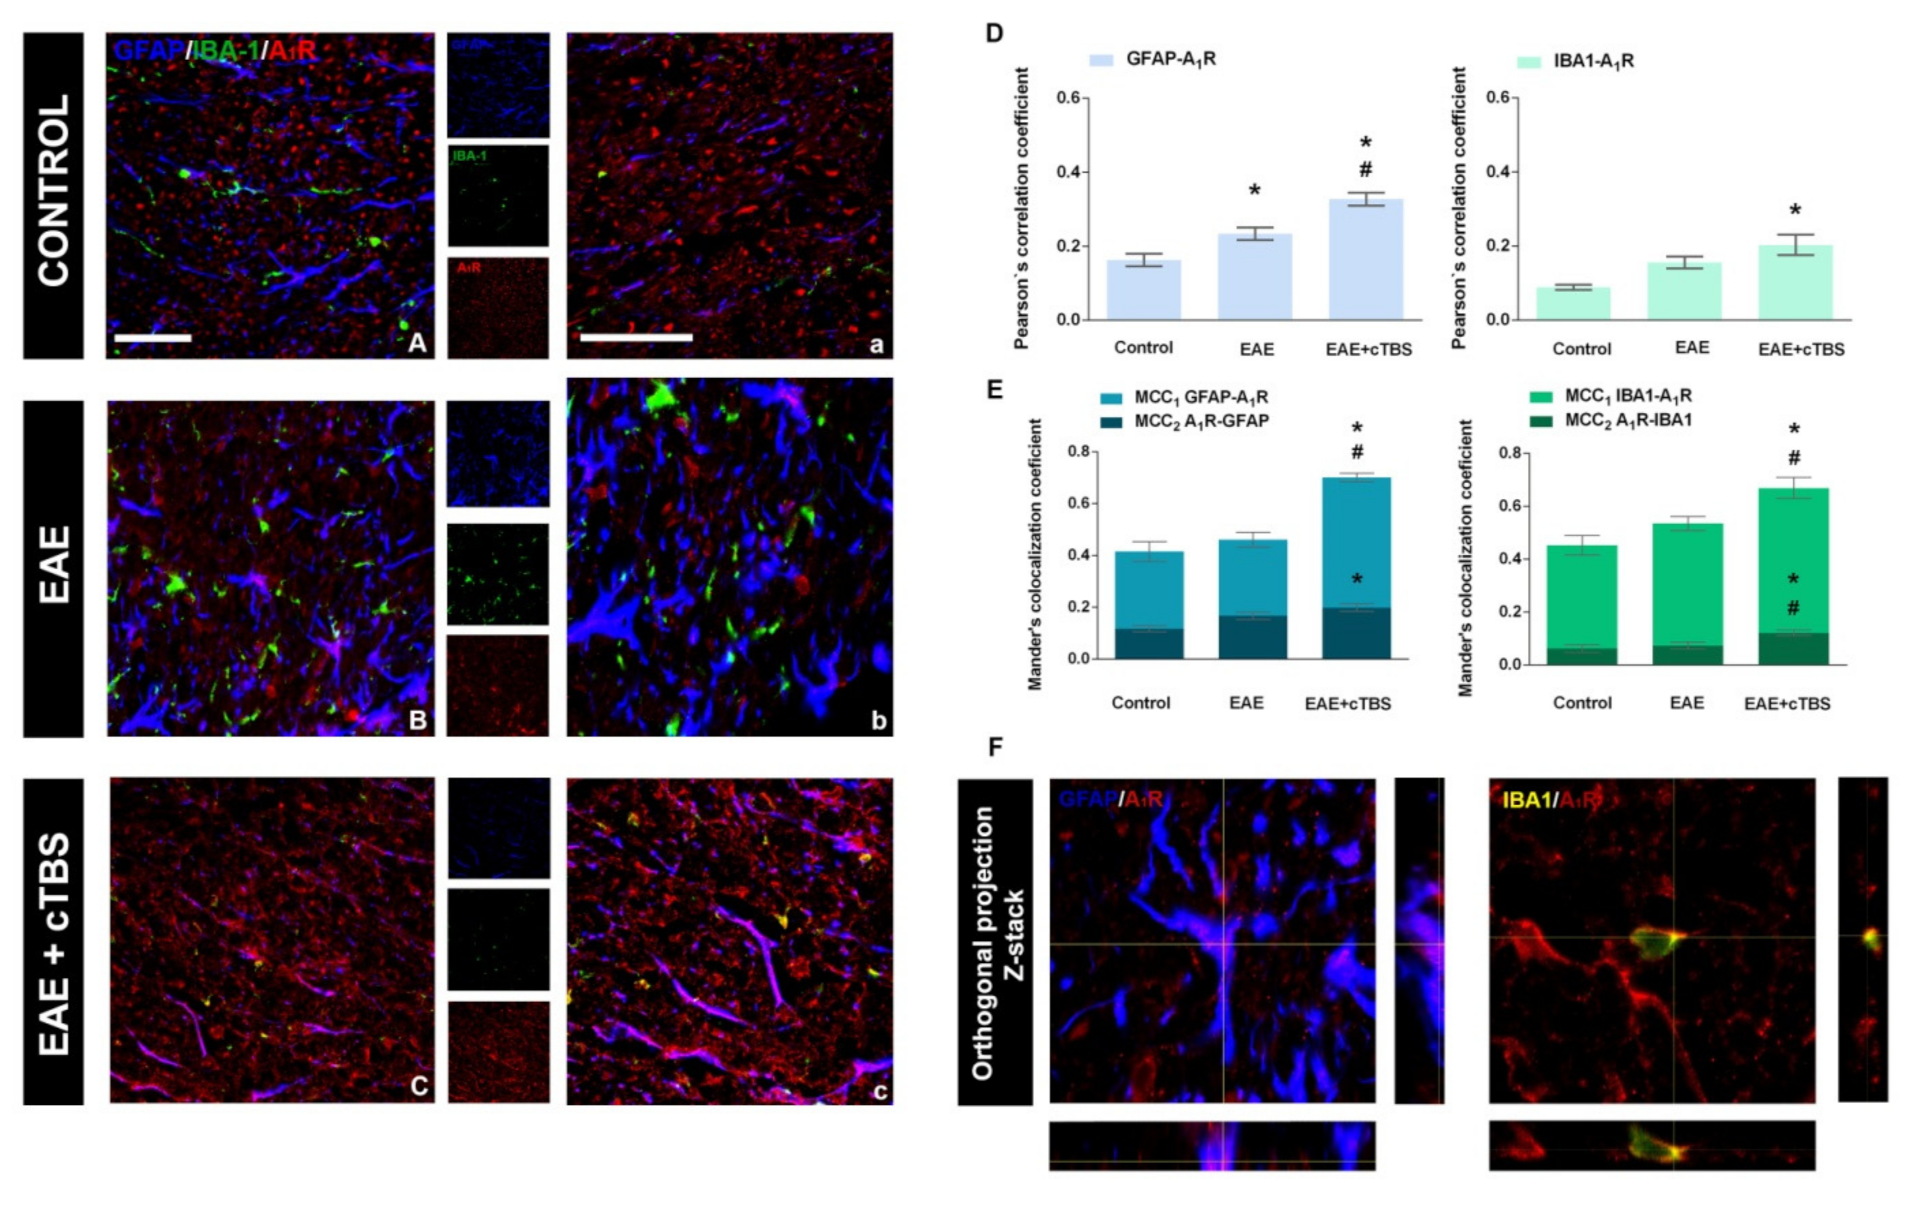
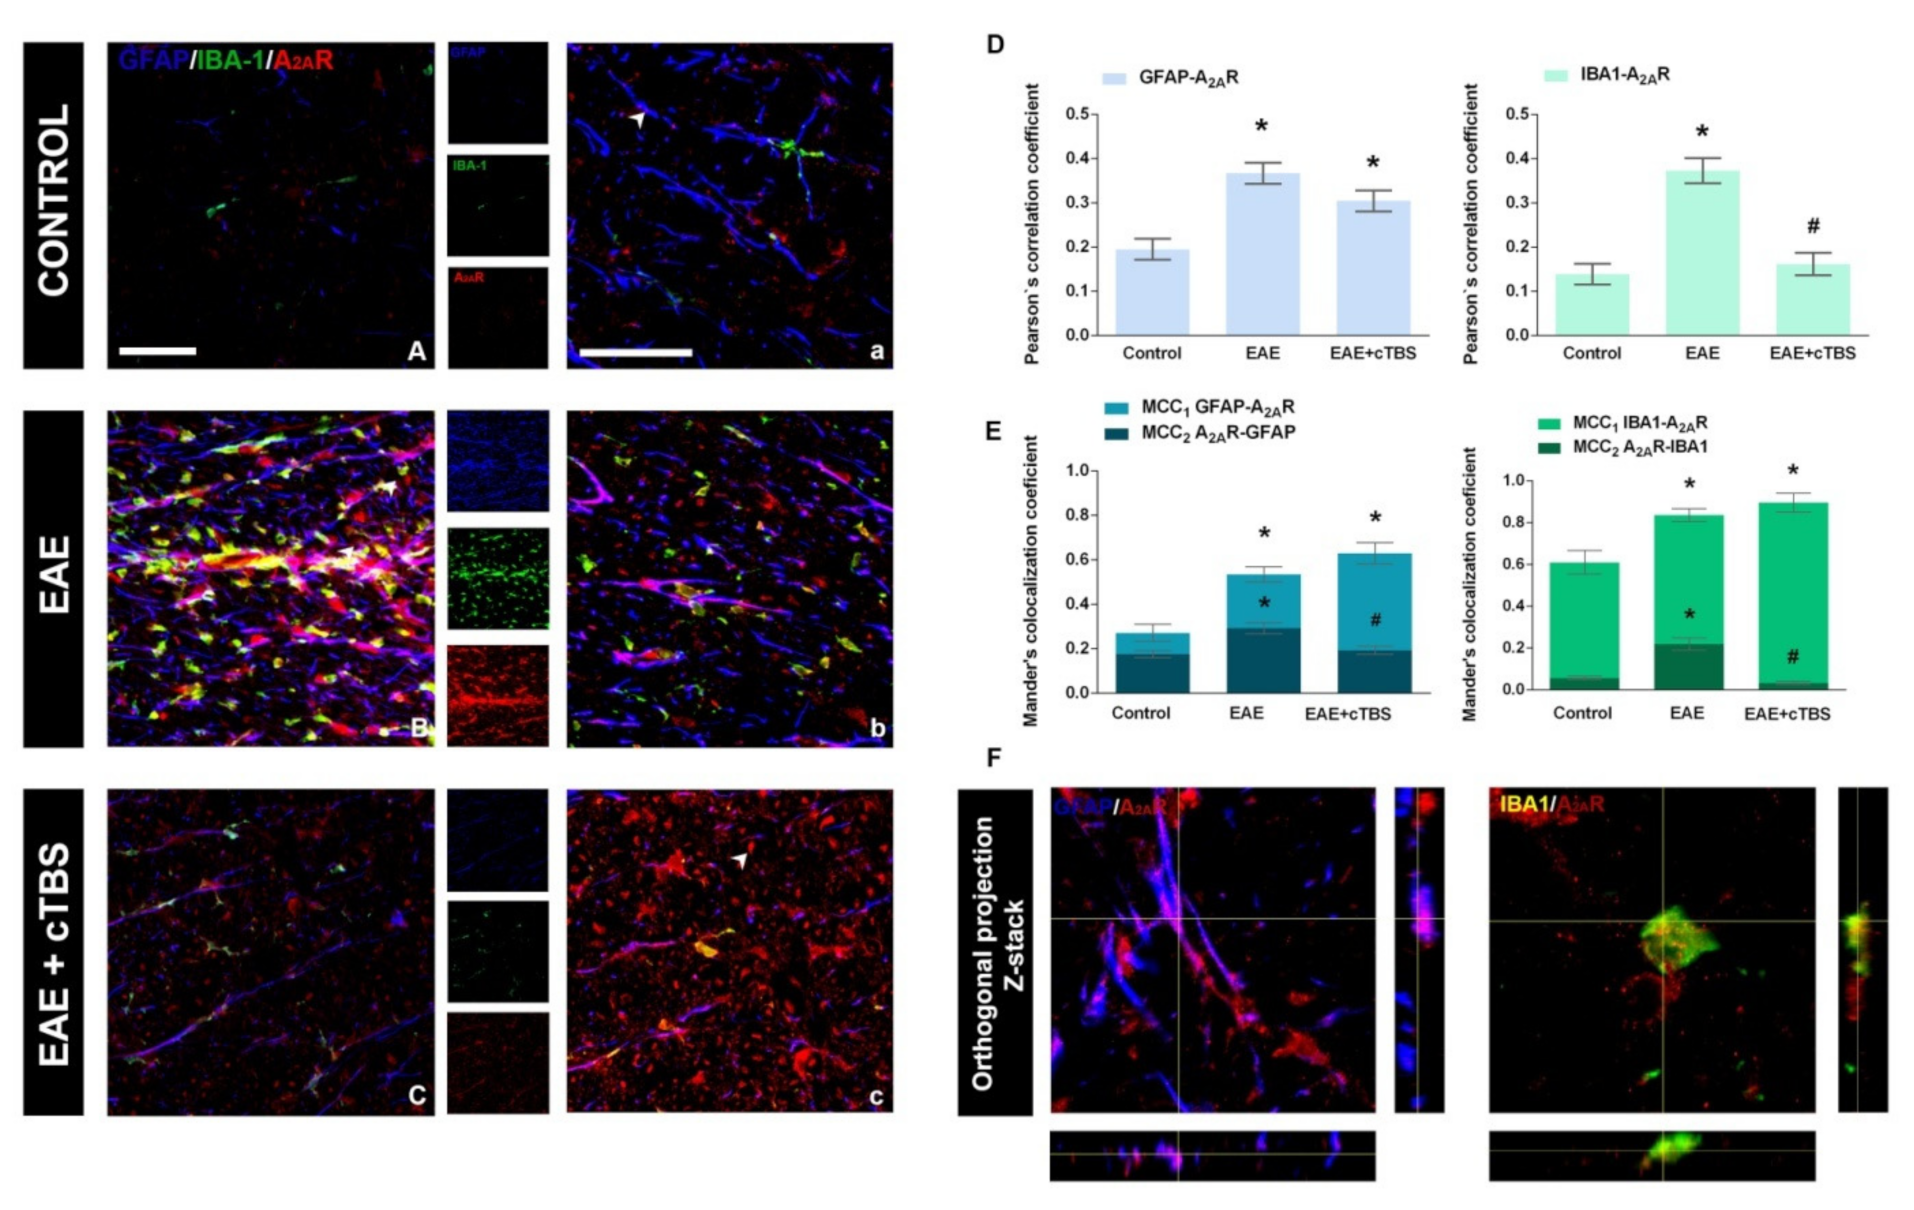
3.4. CTBS Attenuates EAE-Induced Upregulation of CD73 and Shift in A1R-to-A2AR Expression

Altered immunofluorescence imaging directed to CD73 pointed to significant alterations of CD73 expression, both in EAE and after CTBS treatment. Therefore, the expression of the CD73 enzyme activity was shown by AMP-based enzyme histochemistry (Figure 7). The diffuse histochemical reaction produced by CD73-catalyzed hydrolysis of AMP was dominantly observed in the control spinal cord gray matter (Figure 7A,B), whereas the white matter was faintly stained (Figure 7A,C). In EAE sections, an increased reaction was observed in both gray (Figure 7D,E) and white matter (Figure 7D,F), with numerous amoeboid CD73-reactive cells (Figure 7E). Again, CTBS treatment resulted in histochemical staining almost identical to the control (Figure 7G–I). Diffuse staining dominated the ventral and dorsal gray matter (Figure 7G), whereas no infiltrations of amoeboid cells could be found in the white matter (Figure 7H,I).
Signaling actions of adenosine in the CNS are mostly mediated via high-affinity inhibitory A1R and excitatory A2AR receptors, differentially involved in neuroinflammatory processes [15,18]. In physiological conditions, the expression is dominated by A1R mostly found in association with the gray and white matter parenchyma (Figure 8A,a). The induction of EAE is associated with marked loss of A1R-ir, particularly from the white matter projection pathways (Figure 8B,b). However, CTBS treatment restored and even enhanced the intensity of A1R-ir (Figure 8C,c). The determination of PCC and MCC had shown that CTBS increases the proportion of both GFAP-ir astrocytes and IBA-1-ir cells, which expressed A1R-ir, whereas the overall fraction of A1R-ir is expressed by the glial cells (Figure 8D,E; p < 0.05), also confirmed by Z-stack imaging (Figure 8F). Therefore, EAE is associated with the significant axonal loss of A1R-ir, whereas CTBS restores the expression and even potentiates it at responsive glial cells.
Concerning the A2AR, the intensity of ir was weak in control sections, and no significant co-localization was observed with either GFAP-ir or IBA-1 (Figure 9A,a). EAE was associated with significant enhancement of A2AR-ir, particularly co-localized with GFAP- and IBA1-ir (Figure 9B,b), reflected through a significant increase in PCC for the association of A2AR with GFAP and IBA-1 (Figure 9D). Again, CTBS treatment markedly decreased the intensity of A2AR-ir and induced massive dissociation between GFAP- and IBA-1-ir. A significant part of A2AR-ir after CTBS resided at 5–7 µm in diameter ovoid structures, probably axon fibers (Figure 9c, arrowhead). Combined immunofluorescence directed to A2AR and neurofilament H protein showed a strong association of A2AR with neuronal cell bodies in the gray matter and with axonal fibers in the white matter (Figure 10A,B). The CTBS treatment reduced A2AR expression on glial cells and increased it on spinal cord neurons.

4. Discussion

EAE is a widely used experimental model of the autoimmune neurodegenerative pathology driven by an intertwined network of adaptive immune and CNS resident cells and their inflammatory mediators, which reproduce all the critical events in MS. According to current understanding, pro-inflammatory mediator IL-1β and its main downstream target, NF-κB, are critically involved in the pathogenesis of MS/EAE [48], while the induction of anti-inflammatory cytokine IL-10 correlates with the clinical recovery [49]. The involvement of extracellular ATP, adenosine, and their respective P2 and P1 purinoceptors in the neurodegenerative processes associated with MS/EAE is established as well [50]. Several recent reports emphasize the contribution of ectonucleotidases and ATP/ADP- [41,51,52] and adenosine-mediated signaling in the neuroinflammatory process in EAE pathology (Safarzadeh et al., 2016 [53]; Nedeljkovic, 2019 [18], Lavrnja et al., 2015 [14]; Zhou et al., 2019 [54]). Accordingly, the present study shows that the neuroinflammatory process in EAE is associated with prominent upregulation of CD73 in lumbosacral spinal cord tissue, mostly by reactive microglia and astrocytes activated in response to immune cell invasion to the CNS. Given that CD73 is the only adenosine-producing enzyme in the extracellular milieu [55], the strong induction of CD73 corroborates the finding of the substantial accumulation of adenosine in the extracellular space during EAE (Lavrnja et al., 2009 [13]; 2015 [14]). Although adenosine is generally considered a powerful anti-inflammatory and immunosuppressive molecule [56,57], it exerts pleiotropic actions depending on the functional coupling with particular P1 receptor subtype [15,18,20]. Thus, in physiological conditions, extracellular adenosine, present in low micromolar concentrations, mainly activates inhibitory a A1R receptor subtype ubiquitously present in the CNS cell types. However, in neuroinflammatory conditions, the actions of adenosine are mediated largely via excitatory A2AR and low-affinity A2BR receptor subtypes. Indeed, the upregulation of A2AR and its tight spatial coupling with CD73 is another common feature of inflamed tissue in several brain pathologies, including EAE/MS [15,58,59]. Our present study, thus, corroborates the view that the gain-of-function in CD73/A2AR and enhanced adenosine signaling drives neuroinflammation and directs the course of EAE.
By using the pathological context of EAE, the principal goal of our study was to show the ability and efficiency of the CTBS protocol to revert the EAE-induced alterations in adenosine signaling and, thus, to point to potential merit of TBS as a therapeutic approach in MS/EAE. Beneficial and anti-inflammatory actions of TBS have been demonstrated in several neurological and psychiatric disorders and animal models, so far [60,61,62,63,64,65]. In the current study, we have observed that animals subjected to CTBS experienced milder neurological dysfunctions for a shorter time than in the group of non-treated EAE. At the histopathological level, the CTBS protocol prevented the release of IL-1β and reduced NF-κB signaling, while increasing the expression of anti-inflammatory IL-10. These effects altogether suggested that CTBS exerted neuroimmune downregulating properties. Indeed, animals subjected to CTBS exhibited significantly lower numbers of reactive microglial cells and hypertrophied astrocytes, which are the typical histological hallmark of the spinal cord tissue injury in EAE [14,39]. The treatment also decreased both the levels of CD73 enzyme activity and the protein expression, particularly by microglia and astrocytes, suggesting a decrease in the extracellular level of adenosine. Given that CD73 itself is necessary for the peripheral T cells entry and the induction of EAE [66,67], altered expression of CD7 by microglia and astrocytes may be seen as the critical factor of the reduced peripheral immune cell entry and local neuroinflammation [18,66].
Besides CD73, the CTBS treatment completely reverted the expression of adenosine receptors, at least the dominant A1R and A2AR subtypes. Specifically, CTBS prevented the exclusion of A1R-mediated signaling observed in EAE and even enhanced the purinoceptors expression in respect to naïve animals. The enhanced expression was mainly observed at astrocytes and microglia, at which the A1R receptor activation decreases proinflammatory cytokines and chemokines, thus reducing astrocyte ability to interact with autoreactive CD4+ lymphocytes (Liu et al., 2018 [68]; Cunha, 2005 [58]; Liu et al., 2018 [68]; Bijelić et al., 2020 [52]). Furthermore, the CTBS treatment prevented excessive A2AR signaling and decreased the co-occurrence of both the A2AR and CD73 with the glial cells markers. Instead, CTBS induced neuronal expression of A2AR, which is known to regulate the tonic expression and synaptic actions of BDNF [40], thus promoting neuronal survival [69,70,71]. Namely, neuronal A2AR-mediated signaling increases BDNF synthesis and the resulting synaptic efficiency and LTD-induced plasticity [72,73], which may be one of the possible mechanisms of the CTBS-induced protective actions in EAE.
In the end, we would like to point out some limitations of our study. Due to size of the TBS stimulation coil, when applied, the whole brain of DA rats is being stimulated, and therefore, we could not ascribe observed beneficial effects to a specific brain region. The beneficial effects observed in this study are most likely mediated via various descending cerebro-spinal tracts. It is possible that focal stimulation of a specific region would yield even better effects; therefore, further research is required in this direction. Another potential limitation would be the selected time of stimulation, since we chose to stimulate animals in the peak of disease and monitor them until the end of disease. Even though it is more common practice to start treatment in the onset of acute EAE, we wanted to examine beneficial effects that could translate to more real situation, since MS patients seek medical attention usually during the peak of their symptoms, which corresponds to the peak of acute EAE in experimental animals.

5. Conclusions

Our study convincingly demonstrates that the applied CTBS protocol efficiently counteracts the EAE-induced effects on adenosine signaling and attenuates the reactive state of microglia and astrocytes at histological and biochemical levels, thus providing powerful protective and reparative potential in EAE. Given the paucity of effective treatments in MS, the TBS protocols could be a safe and effective complementary therapeutic approach, together with other disease-modifying treatments, that could provide better clinical outcome in MS.

Author Contributions

M.D.: conceptualization, methodology, validation, investigation, writing—original draft; M.Z.: methodology, validation, formal analysis, writing—original draft; I.S.: methodology, validation, investigation, formal analysis, writing—review and editing; M.A.: methodology, validation, formal analysis, writing—review and editing; A.S.: methodology, validation, formal analysis, investigation; K.M.: methodology, validation, formal analysis, investigation; I.G.: methodology, resources, formal analysis, writing—review and editing; N.I.: methodology, investigation, writing—review and editing; T.V.I.: conceptualization, methodology, resources, formal analysis, writing—review and editing; N.N.: methodology, resources, formal analysis, writing—review and editing; M.N.: conceptualization, resources, formal analysis, writing—review and editing. All authors have read and agreed to the published version of the manuscript.

Funding

This work was supported by the Ministry of Education, Science and Technological development, the Republic of Serbia (Grant No. 451-93-9/2021-14/200178) and the University of Defense (Grant No. MFVMA/04/19-21).

Institutional Review Board Statement

The study was conducted according to the guidelines of the Declaration of Helsinki, and approved by The Ethical Community of the Military Medical Academy (Belgrade, Serbia) license no. 323-07-00622/2017-05 (May 2017).

Informed Consent Statement

Not applicable.

Data Availability Statement

The datasets generated during and/or analyzed during the current study are available from the corresponding author on reasonable request.

Conflicts of Interest

The authors declare that they have no conflict of interest.

References

  1. Lassmann, H.; Brück, W.; Lucchinetti, C.F. The immunopathology of multiple sclerosis: An overview. Brain Pathol. 2007, 17, 210–218. [Google Scholar] [CrossRef] [PubMed]
  2. Filippi, M.; Preziosa, P.; Langdon, D.; Lassmann, H.; Paul, F.; Rovira, À.; Schoonheim, M.M.; Solari, A.; Stankoff, B.; Rocca, M.A. Identifying Progression in Multiple Sclerosis: New Perspectives. Ann. Neurol. 2020, 88, 438–452. [Google Scholar] [CrossRef] [PubMed]
  3. Brambilla, R. The contribution of astrocytes to the neuroinflammatory response in multiple sclerosis and experimental autoimmune encephalomyelitis. Acta Neuropathol. 2019, 137, 757–783. [Google Scholar] [CrossRef] [PubMed]
  4. Duffy, S.S.; Lees, J.G.; Moalem-Taylor, G. The contribution of immune and glial cell types in experimental autoimmune encephalomyelitis and multiple sclerosis. Mult. Scler. Int. 2014, 2014, 285245. [Google Scholar] [CrossRef] [PubMed]
  5. Compston, A.; Coles, A. Multiple sclerosis. Lancet 2002, 359, 1221–1231. [Google Scholar] [CrossRef]
  6. Fletcher, J.M.; Lalor, S.J.; Sweeney, C.M.; Tubridy, N.; Mills, K.H.G. T cells in multiple sclerosis and experimental autoimmune encephalomyelitis. Clin. Exp. Immunol. 2010, 162, 1–11. [Google Scholar] [CrossRef] [PubMed]
  7. Sättler, M.B.; Bähr, M. Future neuroprotective strategies. Exp. Neurol. 2010, 225, 40–47. [Google Scholar] [CrossRef] [PubMed]
  8. di Virgilio, F.; Ceruti, S.; Bramanti, P.; Abbracchio, M.P. Purinergic signalling in inflammation of the central nervous system. Trends Neurosci. 2009, 32, 79–87. [Google Scholar] [CrossRef] [PubMed]
  9. Giuliani, A.L.; Sarti, A.C.; di Virgilio, F. Ectonucleotidases in Acute and Chronic Inflammation. Front. Pharmacol. 2020, 11, 619458. [Google Scholar] [CrossRef]
  10. Yegutkin, G.G. Nucleotide- and nucleoside-converting ectoenzymes: Important modulators of purinergic signalling cascade. Biochim. Biophys. Acta 2008, 1783, 673–694. [Google Scholar] [CrossRef] [Green Version]
  11. Adzic, M.; Nedeljkovic, N. Unveiling the Role of Ecto-5′-Nucleotidase/CD73 in Astrocyte Migration by Using Pharmacological Tools. Front. Pharmacol. 2018, 9, 153. [Google Scholar] [CrossRef] [PubMed] [Green Version]
  12. Lazzarino, G.; Amorini, A.M.; Eikelenboom, M.; Killestein, J.; Belli, A.; Di Pietro, V.; Tavazzi, B.; Barkhof, F.; Polman, C.; Uitdehaag, B.; et al. Cerebrospinal fluid ATP metabolites in multiple sclerosis. Mult. Scler. 2010, 16, 549–554. [Google Scholar] [CrossRef] [PubMed]
  13. Lavrnja, I.; Bjelobaba, I.; Stojiljkovic, M.; Pekovic, S.; Mostarica-Stojkovic, M.; Stošić-Grujičić, S.; Nedeljkovic, N. Time-course changes in ectonucleotidase activities during experimental autoimmune encephalomyelitis. Neurochem. Int. 2009, 55, 193–198. [Google Scholar] [CrossRef]
  14. Lavrnja, I.; Laketa, D.; Savić, D.; Bozic, I.; Bjelobaba, I.; Pekovic, S.; Nedeljkovic, N. Expression of a second ecto-5’-nucleotidase variant besides the usual protein in symptomatic phase of experimental autoimmune encephalomyelitis. J. Mol. Neurosci. MN 2015, 55, 898–911. [Google Scholar] [CrossRef]
  15. Cunha, R.A. How does adenosine control neuronal dysfunction and neurodegeneration? J. Neurochem. 2016, 139, 1019–1055. [Google Scholar] [CrossRef]
  16. Abbracchio, M.P.; Ceruti, S. Roles of P2 receptors in glial cells: Focus on astrocytes. Purinergic Signal. 2006, 2, 595–604. [Google Scholar] [CrossRef] [Green Version]
  17. di Virgilio, F.; Vuerich, M. Purinergic signaling in the immune system. Auton. Neurosci. Basic Clin. 2015, 191, 117–123. [Google Scholar] [CrossRef] [Green Version]
  18. Nedeljkovic, N. Complex regulation of ecto-5’-nucleotidase/CD73 and A(2A)R-mediated adenosine signaling at neurovascular unit: A link between acute and chronic neuroinflammation. Pharmacol. Res. 2019, 144, 99–115. [Google Scholar] [CrossRef]
  19. Antonioli, L.; Pacher, P.; Vizi, E.S.; Haskó, G. CD39 and CD73 in immunity and inflammation. Trends Mol. Med. 2013, 19, 355–367. [Google Scholar] [CrossRef] [Green Version]
  20. Fredholm, B.B.; Chen, J.-F.; Cunha, R.A.; Svenningsson, P.; Vaugeois, J.-M. Adenosine and brain function. Int. Rev. Neurobiol. 2005, 63, 191–270. [Google Scholar]
  21. Smith, G.E.; Pankratz, V.S.; Negash, S.; Machulda, M.M.; Petersen, R.C.; Boeve, B.F.; Knopman, D.S.; Lucas, J.A.; Ferman, T.J.; Graff-Radford, N.; et al. A plateau in pre-Alzheimer memory decline: Evidence for compensatory mechanisms? Neurology 2007, 69, 133–139. [Google Scholar] [CrossRef] [PubMed]
  22. Blackburn, M.R.; Vance, C.O.; Morschl, E.; Wilson, C.N. Adenosine receptors and inflammation. Handb. Exp. Pharmacol. 2009, 193, 215–269. [Google Scholar]
  23. Barker, A.T.; Jalinous, R.; Freeston, I.L. Non-invasive magnetic stimulation of human motor cortex. Lancet 1985, 1, 1106–1107. [Google Scholar] [CrossRef]
  24. Hallett, M. Transcranial magnetic stimulation: A primer. Neuron 2007, 55, 187–199. [Google Scholar] [CrossRef] [Green Version]
  25. Lefaucheur, J.-P.; Aleman, A.; Baeken, C.; Benninger, D.H.; Brunelin, J.; Di Lazzaro, V.; Filipović, S.R.; Grefkes, C.; Hasan, A.; Hummel, F.C.; et al. Evidence-based guidelines on the therapeutic use of repetitive transcranial magnetic stimulation (rTMS): An update (2014-2018). Clin. Neurophysiol. Off. J. Int. Fed. Clin. Neurophysiol. 2020, 131, 474–528. [Google Scholar] [CrossRef]
  26. Huang, Y.-Z.; Rothwell, J.C.; Chen, R.-S.; Lu, C.-S.; Chuang, W.-L. The theoretical model of theta burst form of repetitive transcranial magnetic stimulation. Clin. Neurophysiol. Off. J. Int. Fed. Clin. Neurophysiol. 2011, 122, 1011–1018. [Google Scholar] [CrossRef] [Green Version]
  27. Koch, G.; Brusa, L.; Caltagirone, C.; Peppe, A.; Oliveri, M.; Stanzione, P.; Centonze, D. rTMS of supplementary motor area modulates therapy-induced dyskinesias in Parkinson disease. Neurology 2005, 65, 623–625. [Google Scholar] [CrossRef]
  28. George, M.S.; Lisanby, S.H.; Avery, D.; McDonald, W.M.; Durkalski, V.; Pavlicova, M.; Anderson, B.; Nahas, Z.; Bulow, P.; Zarkowski, P.; et al. Daily left prefrontal transcranial magnetic stimulation therapy for major depressive disorder: A sham-controlled randomized trial. Arch. Gen. Psychiatry 2010, 67, 507–516. [Google Scholar] [CrossRef] [Green Version]
  29. Khedr, E.M.; Fetoh, N.A.-E. Short- and long-term effect of rTMS on motor function recovery after ischemic stroke. Restor. Neurol. Neurosci. 2010, 28, 545–559. [Google Scholar] [CrossRef]
  30. Ridding, M.C.; Ziemann, U. Determinants of the induction of cortical plasticity by non-invasive brain stimulation in healthy subjects. J. Physiol. 2010, 588, 2291–2304. [Google Scholar] [CrossRef]
  31. Hasan, A.; Guse, B.; Cordes, J.; Wölwer, W.; Winterer, G.; Gaebel, W.; Langguth, B.; Landgrebe, M.; Eichhammer, P.; Frank, E.; et al. Cognitive Effects of High-Frequency rTMS in Schizophrenia Patients With Predominant Negative Symptoms: Results From a Multicenter Randomized Sham-Controlled Trial. Schizophr. Bull. 2016, 42, 608–618. [Google Scholar] [CrossRef]
  32. Rabey, J.M.; Dobronevsky, E. Repetitive transcranial magnetic stimulation (rTMS) combined with cognitive training is a safe and effective modality for the treatment of Alzheimer’s disease: Clinical experience. J. Neural Transm. 2016, 123, 1449–1455. [Google Scholar] [CrossRef]
  33. Nasios, G.; Messinis, L.; Dardiotis, E.; Papathanasopoulos, P. Repetitive Transcranial Magnetic Stimulation, Cognition, and Multiple Sclerosis: An Overview. Behav. Neurol. 2018, 2018, 8584653. [Google Scholar] [CrossRef] [Green Version]
  34. Liu, M.; Fan, S.; Xu, Y.; Cui, L. Non-invasive brain stimulation for fatigue in multiple sclerosis patients: A systematic review and meta-analysis. Mult. Scler. Relat. Disord. 2019, 36, 101375. [Google Scholar] [CrossRef]
  35. Centonze, D.; Petta, F.; Versace, V.; Rossi, S.; Torelli, F.; Prosperetti, C.; Marfia, G.; Bernardi, G.; Koch, G.; Miano, R.; et al. Effects of motor cortex rTMS on lower urinary tract dysfunction in multiple sclerosis. Mult. Scler. 2007, 13, 269–271. [Google Scholar] [CrossRef]
  36. Mori, T.; Koyama, N.; Guillot-Sestier, M.-V.; Tan, J.; Town, T. Ferulic acid is a nutraceutical β-secretase modulator that improves behavioral impairment and alzheimer-like pathology in transgenic mice. PLoS ONE 2013, 8, e55774. [Google Scholar] [CrossRef] [Green Version]
  37. Stevanovic, I.; Ninkovic, M.; Mancic, B.; Milivojevic, M.; Stojanovic, I.; Ilic, T.; Vujovic, M.; Djukic, M. Compensatory Neuroprotective Response of Thioredoxin Reductase against Oxidative-Nitrosative Stress Induced by Experimental Autoimmune Encephalomyelitis in Rats: Modulation by Theta Burst Stimulation. Molecules 2020, 25, 3922. [Google Scholar] [CrossRef]
  38. Medina-Fernandez, F.J.; Escribano, B.M.; Agüera, E.; Aguilar-Luque, M.; Feijoo, M.; Luque, E.; Garcia-Maceira, F.I.; Pascual-Leone, A.; Drucker-Colin, R.; Tunez, I.; et al. Effects of transcranial magnetic stimulation on oxidative stress in experimental autoimmune encephalomyelitis. Free Radic. Res. 2017, 51, 460–469. [Google Scholar] [CrossRef]
  39. Dragic, M.; Zeljkovic, M.; Stevanovic, I.; Ilic, T.; Ilic, N.; Nedeljkovic, N.; Ninkovic, M. Theta burst stimulation ameliorates symptoms of experimental autoimmune encephalomyelitis and attenuates reactive gliosis. Brain Res. Bull. 2020, 162, 208–217. [Google Scholar] [CrossRef]
  40. Stevanovic, I.; Mancic, B.; Ilic, T.; Milosavljevic, P.; Lavrnja, I.; Stojanovic, I.; Ninkovic, M. Theta burst stimulation influence the expression of BDNF in the spinal cord on the experimental autoimmune encephalomyelitis. Folia Neuropathol. 2019, 57, 129–145. [Google Scholar] [CrossRef]
  41. Jakovljevic, M.; Lavrnja, I.; Bozic, I.; Savic, D.; Bjelobaba, I.; Pekovic, S.; Sévigny, J.; Nedeljkovic, N.; Laketa, D. Down-regulation of NTPDase2 and ADP-sensitive P2 Purinoceptors Correlate with Severity of Symptoms during Experimental Autoimmune Encephalomyelitis. Front. Cell. Neurosci. 2017, 11, 333. [Google Scholar] [CrossRef] [PubMed] [Green Version]
  42. Mancic, B.; Stevanovic, I.; Ilic, T.V.; Djuric, A.; Stojanovic, I.; Milanovic, S.; Ninkovic, M. Transcranial theta-burst stimulation alters GLT-1 and vGluT1 expression in rat cerebellar cortex. Neurochem. Int. 2016, 100, 120–127. [Google Scholar] [CrossRef] [PubMed]
  43. Huang, Y.Z.; Chen, R.S.; Rothwell, J.C.; Wen, H.Y. The after-effect of human theta burst stimulation is NMDA receptor dependent. Clin. Neurophysiol. 2007, 118, 1028–1032. [Google Scholar] [CrossRef] [PubMed]
  44. Dragić, M.; Zarić, M.; Mitrović, N.; Nedeljković, N.; Grković, I. Application of Gray Level Co-Occurrence Matrix Analysis as a New Method for Enzyme Histochemistry Quantification. Microsc. Microanal. 2019, 25, 690–698. [Google Scholar] [CrossRef]
  45. Dunn, K.W.; Kamocka, M.M.; McDonald, J.H. A practical guide to evaluating colocalization in biological microscopy. Am. J. Physiol. Physiol. 2011, 300, C723–C742. [Google Scholar] [CrossRef] [Green Version]
  46. Lin, C.-C.; Edelson, B.T. New Insights into the Role of IL-1β in Experimental Autoimmune Encephalomyelitis and Multiple Sclerosis. J. Immunol. 2017, 198, 4553–4560. [Google Scholar] [CrossRef] [Green Version]
  47. Lin, W.; Yue, Y.; Stone, S. Role of nuclear factor κB in multiple sclerosis and experimental autoimmune encephalomyelitis. Neural Regen. Res. 2018, 13, 1507–1515. [Google Scholar] [CrossRef]
  48. van Loo, G.; De Lorenzi, R.; Schmidt, H.; Huth, M.; Mildner, A.; Schmidt-Supprian, M.; Lassmann, H.; Prinz, M.R.; Pasparakis, M. Inhibition of transcription factor NF-kappaB in the central nervous system ameliorates autoimmune encephalomyelitis in mice. Nat. Immunol. 2006, 7, 954–961. [Google Scholar] [CrossRef]
  49. Ozenci, V.; Kouwenhoven, M.; Huang, Y.M.; Xiao, B.; Kivisäkk, P.; Fredrikson, S.; Link, H. Multiple sclerosis: Levels of interleukin-10-secreting blood mononuclear cells are low in untreated patients but augmented during interferon-beta-1b treatment. Scand. J. Immunol. 1999, 49, 554–561. [Google Scholar] [CrossRef]
  50. Burnstock, G. An introduction to the roles of purinergic signalling in neurodegeneration, neuroprotection and neuroregeneration. Neuropharmacology 2016, 104, 4–17. [Google Scholar] [CrossRef]
  51. Jakovljevic, M.; Lavrnja, I.; Bozic, I.; Milosevic, A.; Bjelobaba, I.; Savic, D.; Sévigny, J.; Pekovic, S.; Nedeljkovic, N.; Laketa, D. Induction of NTPDase1/CD39 by Reactive Microglia and Macrophages Is Associated With the Functional State During EAE. Front. Neurosci. 2019, 13, 410. [Google Scholar] [CrossRef] [Green Version]
  52. Bijelić, D.D.; Milićević, K.D.; Lazarević, M.N.; Miljković, D.M.; Pristov, J.J.B.; Savić, D.Z.; Petković, B.B.; Andjus, P.R.; Momčilović, M.B.; Nikolić, L.M. Central nervous system-infiltrated immune cells induce calcium increase in astrocytes via astroglial purinergic signaling. J. Neurosci. Res. 2020, 98, 2317–2332. [Google Scholar] [CrossRef]
  53. Safarzadeh, E.; Jadidi-Niaragh, F.; Motallebnezhad, M.; Yousefi, M. The role of adenosine and adenosine receptors in the immunopathogenesis of multiple sclerosis. Inflamm. Res. 2016, 65, 511–520. [Google Scholar] [CrossRef]
  54. Zhou, S.; Liu, G.; Guo, J.; Kong, F.; Chen, S.; Wang, Z. Pro-inflammatory Effect of Downregulated CD73 Expression in EAE Astrocytes. Front. Cell. Neurosci. 2019, 13, 233. [Google Scholar] [CrossRef]
  55. Zimmermann, H.; Zebisch, M.; Sträter, N. Cellular function and molecular structure of ecto-nucleotidases. Purinergic Signal. 2012, 8, 437–502. [Google Scholar] [CrossRef] [Green Version]
  56. Haskó, G.; Cronstein, B. Regulation of inflammation by adenosine. Front. Immunol. 2013, 4, 85. [Google Scholar] [CrossRef] [Green Version]
  57. Morandi, F.; Horenstein, A.L.; Rizzo, R.; Malavasi, F. The Role of Extracellular Adenosine Generation in the Development of Autoimmune Diseases. Mediat. Inflamm. 2018, 2018, 1–10. [Google Scholar] [CrossRef]
  58. Cunha, R.A. Neuroprotection by adenosine in the brain: From A1 receptor activation to A2A receptor blockade. Purinergic Signal. 2005, 1, 111–134. [Google Scholar] [CrossRef] [Green Version]
  59. Borroto-Escuela, D.O.; Hinz, S.; Navarro, G.; Franco, R.; Müller, C.E.; Fuxe, K. Understanding the Role of Adenosine A2AR Heteroreceptor Complexes in Neurodegeneration and Neuroinflammation. Front. Neurosci. 2018, 12, 43. [Google Scholar] [CrossRef] [Green Version]
  60. George, M.S.; Wassermann, E.M.; Williams, W.A.; Callahan, A.; Ketter, T.A.; Basser, P.; Hallett, M.; Post, R.M. Daily repetitive transcranial magnetic stimulation (rTMS) improves mood in depression. NeuroReport 1995, 6, 1853–1856. [Google Scholar] [CrossRef]
  61. Siebner, H.R.; Mentschel, C.; Auer, C.; Conrad, B. Repetitive transcranial magnetic stimulation has a beneficial effect on bradykinesia in Parkinson’s disease. Neuroreport 1999, 10, 589–594. [Google Scholar] [CrossRef]
  62. Downar, J.; Daskalakis, Z.J. New Targets for rTMS in Depression: A Review of Convergent Evidence. Brain Stimul. 2013, 6, 231–240. [Google Scholar] [CrossRef]
  63. Okada, K.; Matsunaga, K.; Yuhi, T.; Kuroda, E.; Yamashita, U.; Tsuji, S. The long-term high-frequency repetitive transcranial magnetic stimulation does not induce mRNA expression of inflammatory mediators in the rat central nervous system. Brain Res. 2002, 957, 37–41. [Google Scholar] [CrossRef]
  64. Sasso, V.; Bisicchia, E.; Latini, L.; Ghiglieri, V.; Cacace, F.; Carola, V.; Molinari, M.; Viscomi, M.T. Repetitive transcranial magnetic stimulation reduces remote apoptotic cell death and inflammation after focal brain injury. J. Neuroinflamm. 2016, 13, 150. [Google Scholar] [CrossRef] [Green Version]
  65. Clarke, D.; Beros, J.; Bates, K.A.; Harvey, A.R.; Tang, A.D.; Rodger, J. Low intensity repetitive magnetic stimulation reduces expression of genes related to inflammation and calcium signalling in cultured mouse cortical astrocytes. Brain Stimul. 2021, 14, 183–191. [Google Scholar] [CrossRef]
  66. Mills, J.H.; Thompson, L.F.; Mueller, C.; Waickman, A.T.; Jalkanen, S.; Niemela, J.; Airas, L.; Bynoe, M.S. CD73 is required for efficient entry of lymphocytes into the central nervous system during experimental autoimmune encephalomyelitis. Proc. Natl. Acad. Sci. USA 2008, 105, 9325–9330. [Google Scholar] [CrossRef] [Green Version]
  67. Mills, J.H.; Alabanza, L.M.; Mahamed, D.A.; Bynoe, M.S. Extracellular adenosine signaling induces CX3CL1 expression in the brain to promote experimental autoimmune encephalomyelitis. J. Neuroinflamm. 2012, 9, 193. [Google Scholar] [CrossRef] [PubMed] [Green Version]
  68. Liu, G.; Zhang, W.; Guo, J.; Kong, F.; Zhou, S.; Chen, S.; Wang, Z.; Zang, D. Adenosine binds predominantly to adenosine receptor A1 subtype in astrocytes and mediates an immunosuppressive effect. Brain Res. 2018, 1700, 47–55. [Google Scholar] [CrossRef] [PubMed]
  69. Ramirez, S.H.; Fan, S.; Maguire, C.A.; Perry, S.; Hardiek, K.; Ramkumar, V.; Gelbard, H.A.; Dewhurst, S.; Maggirwar, S.B. Activation of adenosine A2A receptor protects sympathetic neurons against nerve growth factor withdrawal. J. Neurosci. Res. 2004, 77, 258–269. [Google Scholar] [CrossRef] [PubMed]
  70. Wiese, S.; Jablonka, S.; Holtmann, B.; Orel, N.; Rajagopal, R.; Chao, M.V.; Sendtner, M. Adenosine receptor A2A-R contributes to motoneuron survival by transactivating the tyrosine kinase receptor TrkB. Proc. Natl. Acad. Sci. USA 2007, 104, 17210–17215. [Google Scholar] [CrossRef] [PubMed] [Green Version]
  71. Jeon, S.J.; Bak, H.; Seo, J.; Han, S.M.; Lee, S.H.; Han, S.-H.; Kwon, K.J.; Ryu, J.H.; Cheong, J.H.; Ko, K.H.; et al. Oroxylin A Induces BDNF Expression on Cortical Neurons through Adenosine A2A Receptor Stimulation: A Possible Role in Neuroprotection. Biomol. Ther. 2012, 20, 27–35. [Google Scholar] [CrossRef] [Green Version]
  72. Kopec, B.M.; Kiptoo, P.; Zhao, L.; Rosa-Molinar, E.; Siahaan, T.J. Noninvasive Brain Delivery and Efficacy of BDNF to Stimulate Neuroregeneration and Suppression of Disease Relapse in EAE Mice. Mol. Pharm. 2019, 17, 404–416. [Google Scholar] [CrossRef]
  73. Costenla, A.R.; Diógenes, M.J.; Canas, P.M.; Rodrigues, R.J.; Nogueira, C.; Maroco, J.; Agostinho, P.M.; Ribeiro, J.A.; Cunha, R.A.; De Mendonça, A. Enhanced role of adenosine A2A receptors in the modulation of LTP in the rat hippocampus upon ageing. Eur. J. Neurosci. 2011, 34, 12–21. [Google Scholar] [CrossRef]
Figure 1. CTBS treatments of EAE rats. Rats were immunized for EAE at day 0 and scored and weighed every day until day 24. The first symptoms appeared around 10 dpi and peaked around 14 dpi. The animals were subjected to CTBS or sham noise artifact for 10 consecutive days from disease peak and euthanized.
Brainsci 11 00736 g001
Figure 2. Effects of CTBS treatment on the clinical score of EAE and weight of DA rats. Clinical score and weight of EAE (red circles) in DA rats treated with CTBS protocol (blue square) and CTBS sham noise artifact (black triangles). Animals were monitored from 0 dpi when EAE was induced until 24 dpi when animals were sacrificed.
Brainsci 11 00736 g002
Figure 3. Effect of CTBS treatment on IL-1β expression in gray and white matter of EAE rats. Triple immunofluorescence labeling directed to astrocyte marker GFAP (blue), microglial marker IBA-1 (green), and pro-inflammatory cytokine IL-1β (red). Expression of IL-1β was not detected in control sections (A,D). In EAE sections, increased IL-1β immunostaining in gray (B) and white matter (E), colocalizing with both GFAP and IBA-1 cells. After CTBS treatment, no IL-1β-ir was observed (C,F). Scale bar corresponds to 50 μm.
Brainsci 11 00736 g003
Figure 4. Effects of CTBS treatment on NF-κB expression in EAE rats. Triple immunofluorescence labeling directed to astrocyte marker GFAP (blue), microglial marker IBA-1 (green), and NF-κB (red). Faint colocalization of NF-κB-ir and GFAP was observed in control sections (A). In EAE sections, a marked increase in NF-κB-ir was observed predominantly colocalizing with GFAP+ cells (B). CTBS treatment decreased immunostaining of NF-κB, and only scattered NF-κB+/GFAP+ cells were observed (C). Scale bar corresponds to 50 μm.
Brainsci 11 00736 g004
Figure 5. Effects of CTBS treatment on IL-10 expression in EAE rats. Double immunofluorescence labeling directed to astrocyte marker GFAP (blue) and anti-inflammatory cytokine IL-10 (red). Control sections revealed modest colocalization of IL-10 and GFAP (A), which was barely detectable in EAE animas (B). CTBS treatment led to marked increase in immunostaining of IL-10, which was confined to quiescent GFAP+ cells (C). Scale bar corresponds to 50 μm.
Brainsci 11 00736 g005
Figure 6. Effects of CTBS treatment on eN/CD73 expression in EAE rats. Triple immunofluorescence labeling directed to astrocyte marker GFAP (blue), microglial marker IBA-1 (green), and eN/CD73 (red). In control section, faint staining of eN/CD73 was observed colocalizing dominantly with GFAP+ cells (A,a). In EAE sections, a marked increase in eN/CD73 staining was observed colocalizing with GFAP+ and IBA-1+ cells (B,b). After CTBS treatment, a significant reduction in eN/CD73-ir was observed (C,c). Pearson correlation coefficients (PCC) indicating the level of signal overlap between GFAP-ir and eN/CD73-ir and IBA-1-ir and eN/CD73-ir. Bars show mean PCC ± SEM, from 7–9 images/animal (D). Mander’s colocalization coefficient (MCC) indicating level of signal colocalization between GFAP/CD73 (MCC1, light blue), CD73/GFAP (MCC2, dark blue), IBA-1/CD73 (MCC1, light green), and CD73/IBA1 (MCC2, dark green) (E). Orthogonal Z-stack projection of GFAP/CD73 and IBA-1/CD73 (F). Level of significance: * p ˂ 0.05 or less when compared to control, # p ˂ 0.05 when compared to EAE. Scale bar corresponds to 50 μm.
Brainsci 11 00736 g006
Figure 7. Effects of CTBS treatment on AMP-based enzyme histochemistry in lumbar spinal cords of EAE rats. Enzyme histochemistry in the presence of AMP as a substrate labeling structures that exhibit eN/CD73 activity in the spinal cord of control, EAE, and CTBS-treated EAE sections. Control sections (A) exhibited diffuse staining patterns localized mainly in gray matter (B), while white matter was devoid of staining. (C) EAE sections reveled (D) a marked increase in eN/CD73 activity localized in gray (E) and white matter (F). After CTBS protocol (G), faint activity was observed in both gray (H) and white matter (I), similarly to control sections. Scale bar corresponds to 50 μm.
Brainsci 11 00736 g007
Figure 8. Effects of CTBS treatment on A1R expression in lumbar spinal cords of EAE rats. Triple immunofluorescence labeling directed to astrocyte marker GFAP (blue), microglial marker IBA-1 (green), and A2AR (red). In control sections, moderate staining of A1R-ir was observed mostly confined to what appeared to be neuronal elements (A,a). In EAE sections, no apparent change in A1R-ir was observed compared to control (B,b). After CTBS treatment A1R-ir was significantly increased on glial cells (C,c). Pearson correlation coefficients (PCC) indicating the level of signal overlap between GFAP-ir and A1R-ir and IBA-1-ir and A1R-ir. Bars show mean PCC ± SEM, from 7–9 images/animal (D). Mander’s colocalization coefficient (MCC) indicating level of signal colocalization between GFAP/A1R (MCC1, light blue), A1R/GFAP (MCC2, dark blue), IBA-1/A1R (MCC1, light green), and A1R/IBA1 (MCC2, dark green). Bars show mean MCC ± SEM, from 7–9 images/animal (E). Orthogonal Z-stack projection of GFAP/A1R and IBA-1/A1R (F). Level of significance: * p ˂ 0.05 or less when compared to control, # p ˂ 0.05 when compared to EAE. Scale bar corresponds to 50 μm.
Brainsci 11 00736 g008
Figure 9. Effects of CTBS treatment on A2AR expression in lumbar spinal cords of EAE rats. Triple immunofluorescence labeling directed to astrocyte marker GFAP (blue), microglial marker IBA-1 (green), and A2AR (red). In control sections, faint staining of A2AR-ir was observed (A,a). A prominent increase in A2AR-ir was observed in EAE, both in association with GFAP- and IBA-1-ir (B,b). The CTBS treatment decreased the overall intensity of A2AR-ir in the gray matter and was reduced on glial cells, but an increase in staining was detected in non-glial elements (C,c). Pearson correlation coefficients (PCC) indicating the level of signal overlap between GFAP-ir and A2AR-ir and IBA-1-ir and A2AR-ir. Bars show mean PCC ± SEM, from 7–9 images/animal (D). Mander’s colocalization coefficient (MCC) indicating level of signal colocalization between GFAP/A2AR (MCC1, light blue), A2AR/GFAP (MCC2, dark blue), IBA-1/A2AR (MCC1, light green), and A2AR/IBA1 (MCC2, dark green) Bars show mean MCC ± SEM, from 7–9 images/animal (E). Orthogonal Z-stack projection of GFAP/A2AR and IBA-1/A2AR (F). Level of significance: * p ˂ 0.05 or less when compared to control, # p ˂ 0.05 when compared to EAE. Scale bar corresponds to 50 μm.
Brainsci 11 00736 g009
Figure 10. A2AR and CD73 expression in gray and white matter in lumbar spinal cords of CTBS-treated rats. A2AR signal was colocalized with SMI-32: in gray matter, co-staining was observed in neuronal soma (A), whereas in white matter, neuronal axons showed A2AR immunoreactivity (B). CD73 signal was colocalized with SMI-32: in gray matter (C), whereas in white matter, neuronal axons showed SMI-32/CD73 colocalization (D). Scale bar corresponds to 50 μm.
Brainsci 11 00736 g010
Table 1. Antibodies used for immunohistochemistry.
AntibodySource and TypeUsed DilutionManufacturer
Iba-1Goat, polyclonal1:400Abcam ab5076, RRID:AB_2224402
CD73, rNu-9L(I4,I5)Rabbit, polyclonal1:300Ectonucleotidases-ab.com
GFAPRabbit, polyclonal1:500 DAKO, Agilent Z0334, RRID:AB_10013382
IL-10Goat, polyclonal1:100 Santa Cruz Biotechnology, sc-1783, RRID: AB_2125115
NF-kBRabbit, polyclonal1:100 Santa Cruz Biotechnology, sc-109, RRID: AB_632039
IL-1β/IL-1F2Goat, polyclonal1:100 R&D Systems, AF-501-NA, RRID: AB_ 354508
A2ARRabbit, polyclonal1:300 Abcam, ab3461, RRID: AB_303823
A1RRabbit, polyclonal1:200Novus Biologicals, NB300-549, RRID: AB_10002337
Anti-mouse IgG Alexa Fluor 488Donkey, polyclonal1:400 Invitrogen A21202, RRID:AB_141607
Anti-goat IgG Alexa Fluor 488Donkey, polyclonal1:400 Invitrogen A-11055, RRID:AB_142672
Anti-rabbit IgG Alexa Fluor 555Donkey, polyclonal1:400 Invitrogen A-21428, RRID:AB_141784
Anti-mouse IgG Alexa Fluor 647Donkey, polyclonal1:400 Thermo Fisher Scientific A-31571, RRID:AB_162542
Table 2. Results of ANOVA analysis performed for results obtained from image analysis.
Analysis PerformedANOVA Resultsp Values
PCC GFAP–CD73F(2, 28) = 0.7792p = 0.4736
PCC IBA1–CD73F(2, 31) = 33.48p < 0.0001
MCC1 GFAP–CD73F(2, 28) = 3.228p = 0.0648
MCC2 CD73-GFAPF(2, 28) = 4.975p < 0.05
MCC1 IBA1–CD73F(2, 27) = 5.482p < 0.05
MCC2 CD73–IBA1F(2, 27) = 17.05p < 0.0001
PCC A1R–CD73F(2, 30) = 22.19p < 0.0001
PCC IBA1–A1RF(2, 28) = 9.155p < 0.01
MCC1 GFAP–A1R F(2, 27) = 24.45p < 0.0001
MCC2 A1R-GFAPF(2, 27) = 9.217p < 0.01
MCC1 IBA1–A1RF(2, 28) = 9.502p < 0.01
MCC2 A1R–IBA1F(2, 28) = 5.458p < 0.05
PCC GFAP–A2ARF(2, 33) = 12.74p < 0.001
PCC IBA1–A2ARF(2, 32) = 25.23p < 0.0001
MCC1 GFAP–A2AR F(2, 26) = 20.86p < 0.0001
MCC2 A2AR-GFAPF(2, 27) = 8.629p < 0.01
MCC1 IBA1–A2ARF(2, 29) = 10.93p < 0.001
MCC2 A2AR–IBA1F(2, 29) = 31.472p < 0.0001
Publisher’s Note: MDPI stays neutral with regard to jurisdictional claims in published maps and institutional affiliations.

