
Comparing Neural Correlates of Human Emotions across Multiple Stimulus Presentation Paradigms

Abstract
1. Introduction
- We have presented a novel dataset that records EEG data for fear, neutral, and joy human emotional states evoked with four different stimuli presentation paradigms;
- Identification of the most relevant spectral bands and brain regions with respect to each paradigm;
- CSP has been widely used in different scenarios of EEG-based BCI applications such as motor imagery; therefore, this work attempts to investigate if it is also a good choice for emotion recognition.
2. Related Work
2.1. Cortical Activity Perspective
2.1.1. Delta Band
2.1.2. Theta Band
2.1.3. Alpha Band
2.1.4. Beta Band
2.1.5. Gamma Band
2.2. Classification Performance Perspective
3. Methodology
3.1. EEG Data Acquisition
- Paradigm1—EI (Emotional Imagery/Self-Induced)
- Paradigm2—VI (Video-Induced)
- Paradigm3—SI (Sound-Induced)
- Paradigm4—PI (Picture-Induced)
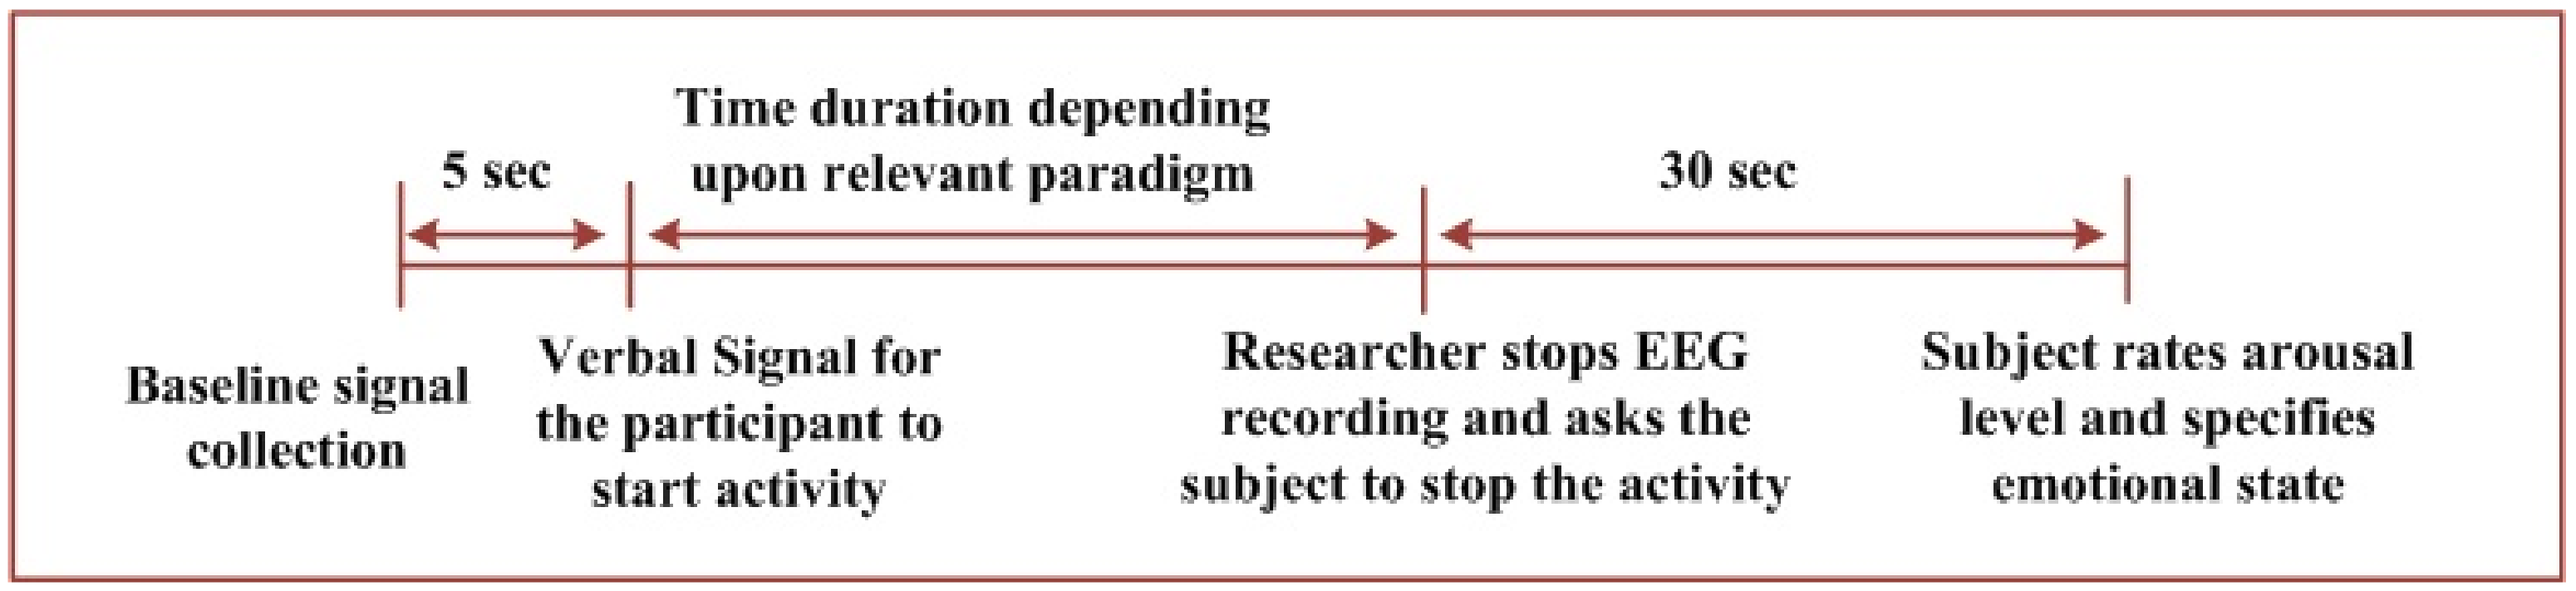
3.1.1. Paradigm1—EI (Experiments Performed Based on Emotional Imagery)
- Baseline signal collection for 5 s;
- The activity is initiated after a verbal signal;
- The incident/memory/imagination mentioned in the questionnaire is recalled by the participant;
- The activity is stopped after 60 s;
- A time of 30 s is provided to rate the arousal level and specify the emotional state.
3.1.2. Paradigm2—VI (Experiments Performed While Viewing Videos)
- Baseline signal collection for 5 s;
- Video clip is displayed after verbal signal. The activity is initiated;
- Participant views the movie clip being displayed for 120–180 s;
- The activity is stopped;
- A time of 30 s is provided to rate the arousal level and specify the emotional state.
3.1.3. Paradigm3—SI (Experiments Performed While Listening Sounds)
- Baseline signal collection for 5 s;
- The activity is initiated after a verbal signal and the sound is played;
- Sound continues for 5–10 s;
- The activity is stopped;
- A time of 30 s is provided to rate the arousal level and specify the emotional state.
3.1.4. Paradigm4—PI (Experiments Performed While Viewing Pictures/Images)
- Baseline signal collection for 5 s;
- The activity is initiated after a verbal signal;
- The picture/image is displayed for 5–7 s;
- Picture disappears;
- A time of 30 s is provided to rate the arousal level and specify the emotional state.
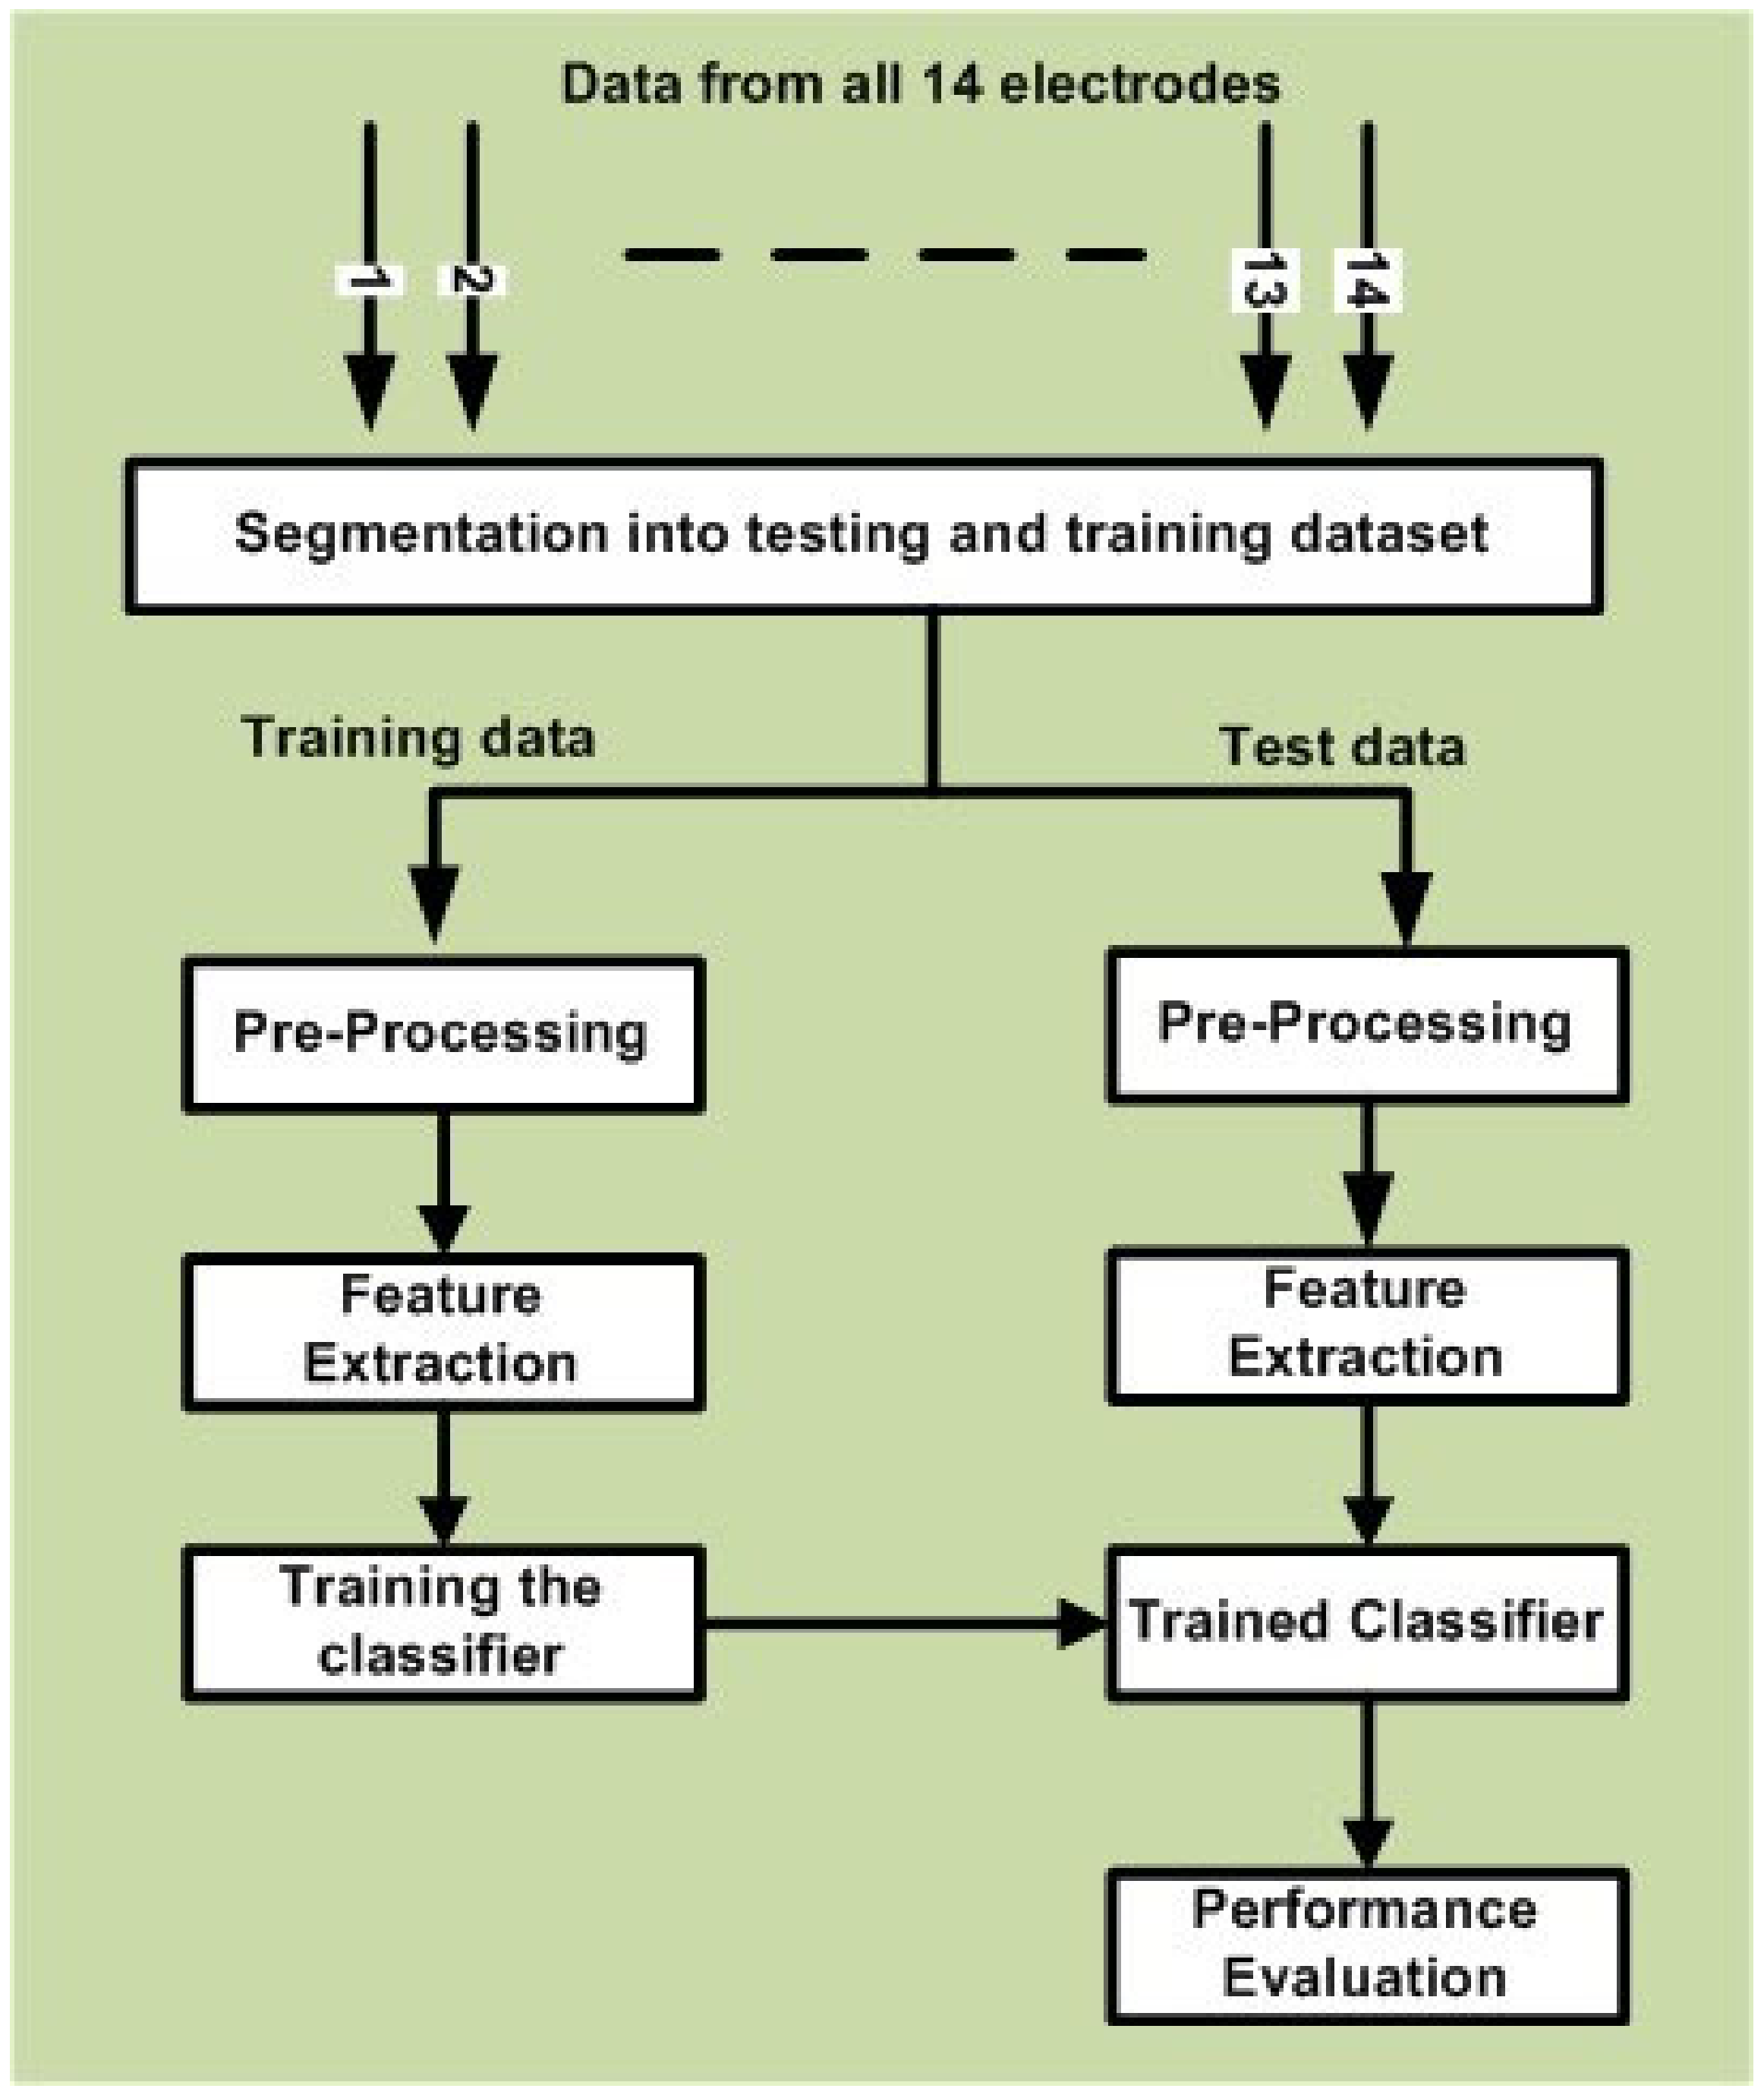
3.2. Data Analysis
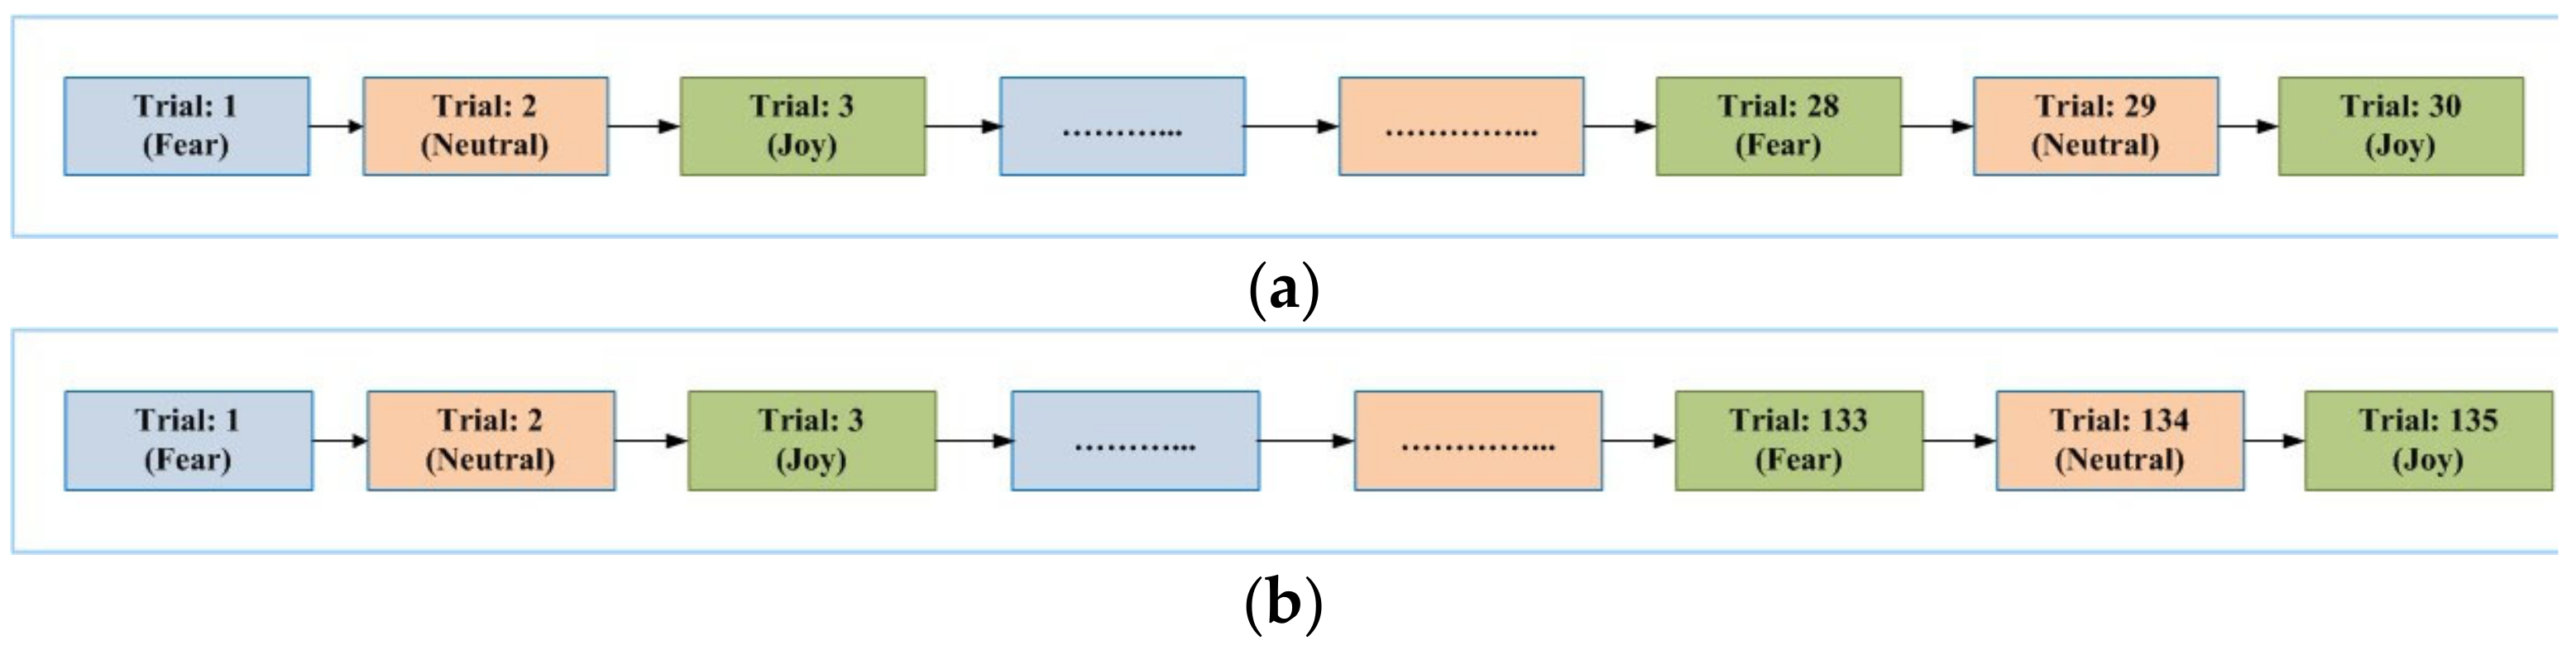
3.2.1. Segmentation of Recorded EEG Data into Trials and Epochs
3.2.2. Pre-Processing (Filtering, Artifact Removal and Epochs Rejection)
3.2.3. Feature Extraction Based on CSP
3.2.4. Classification with Linear Discriminant Analysis
3.3. Statistical Analysis
4. Experimental Results
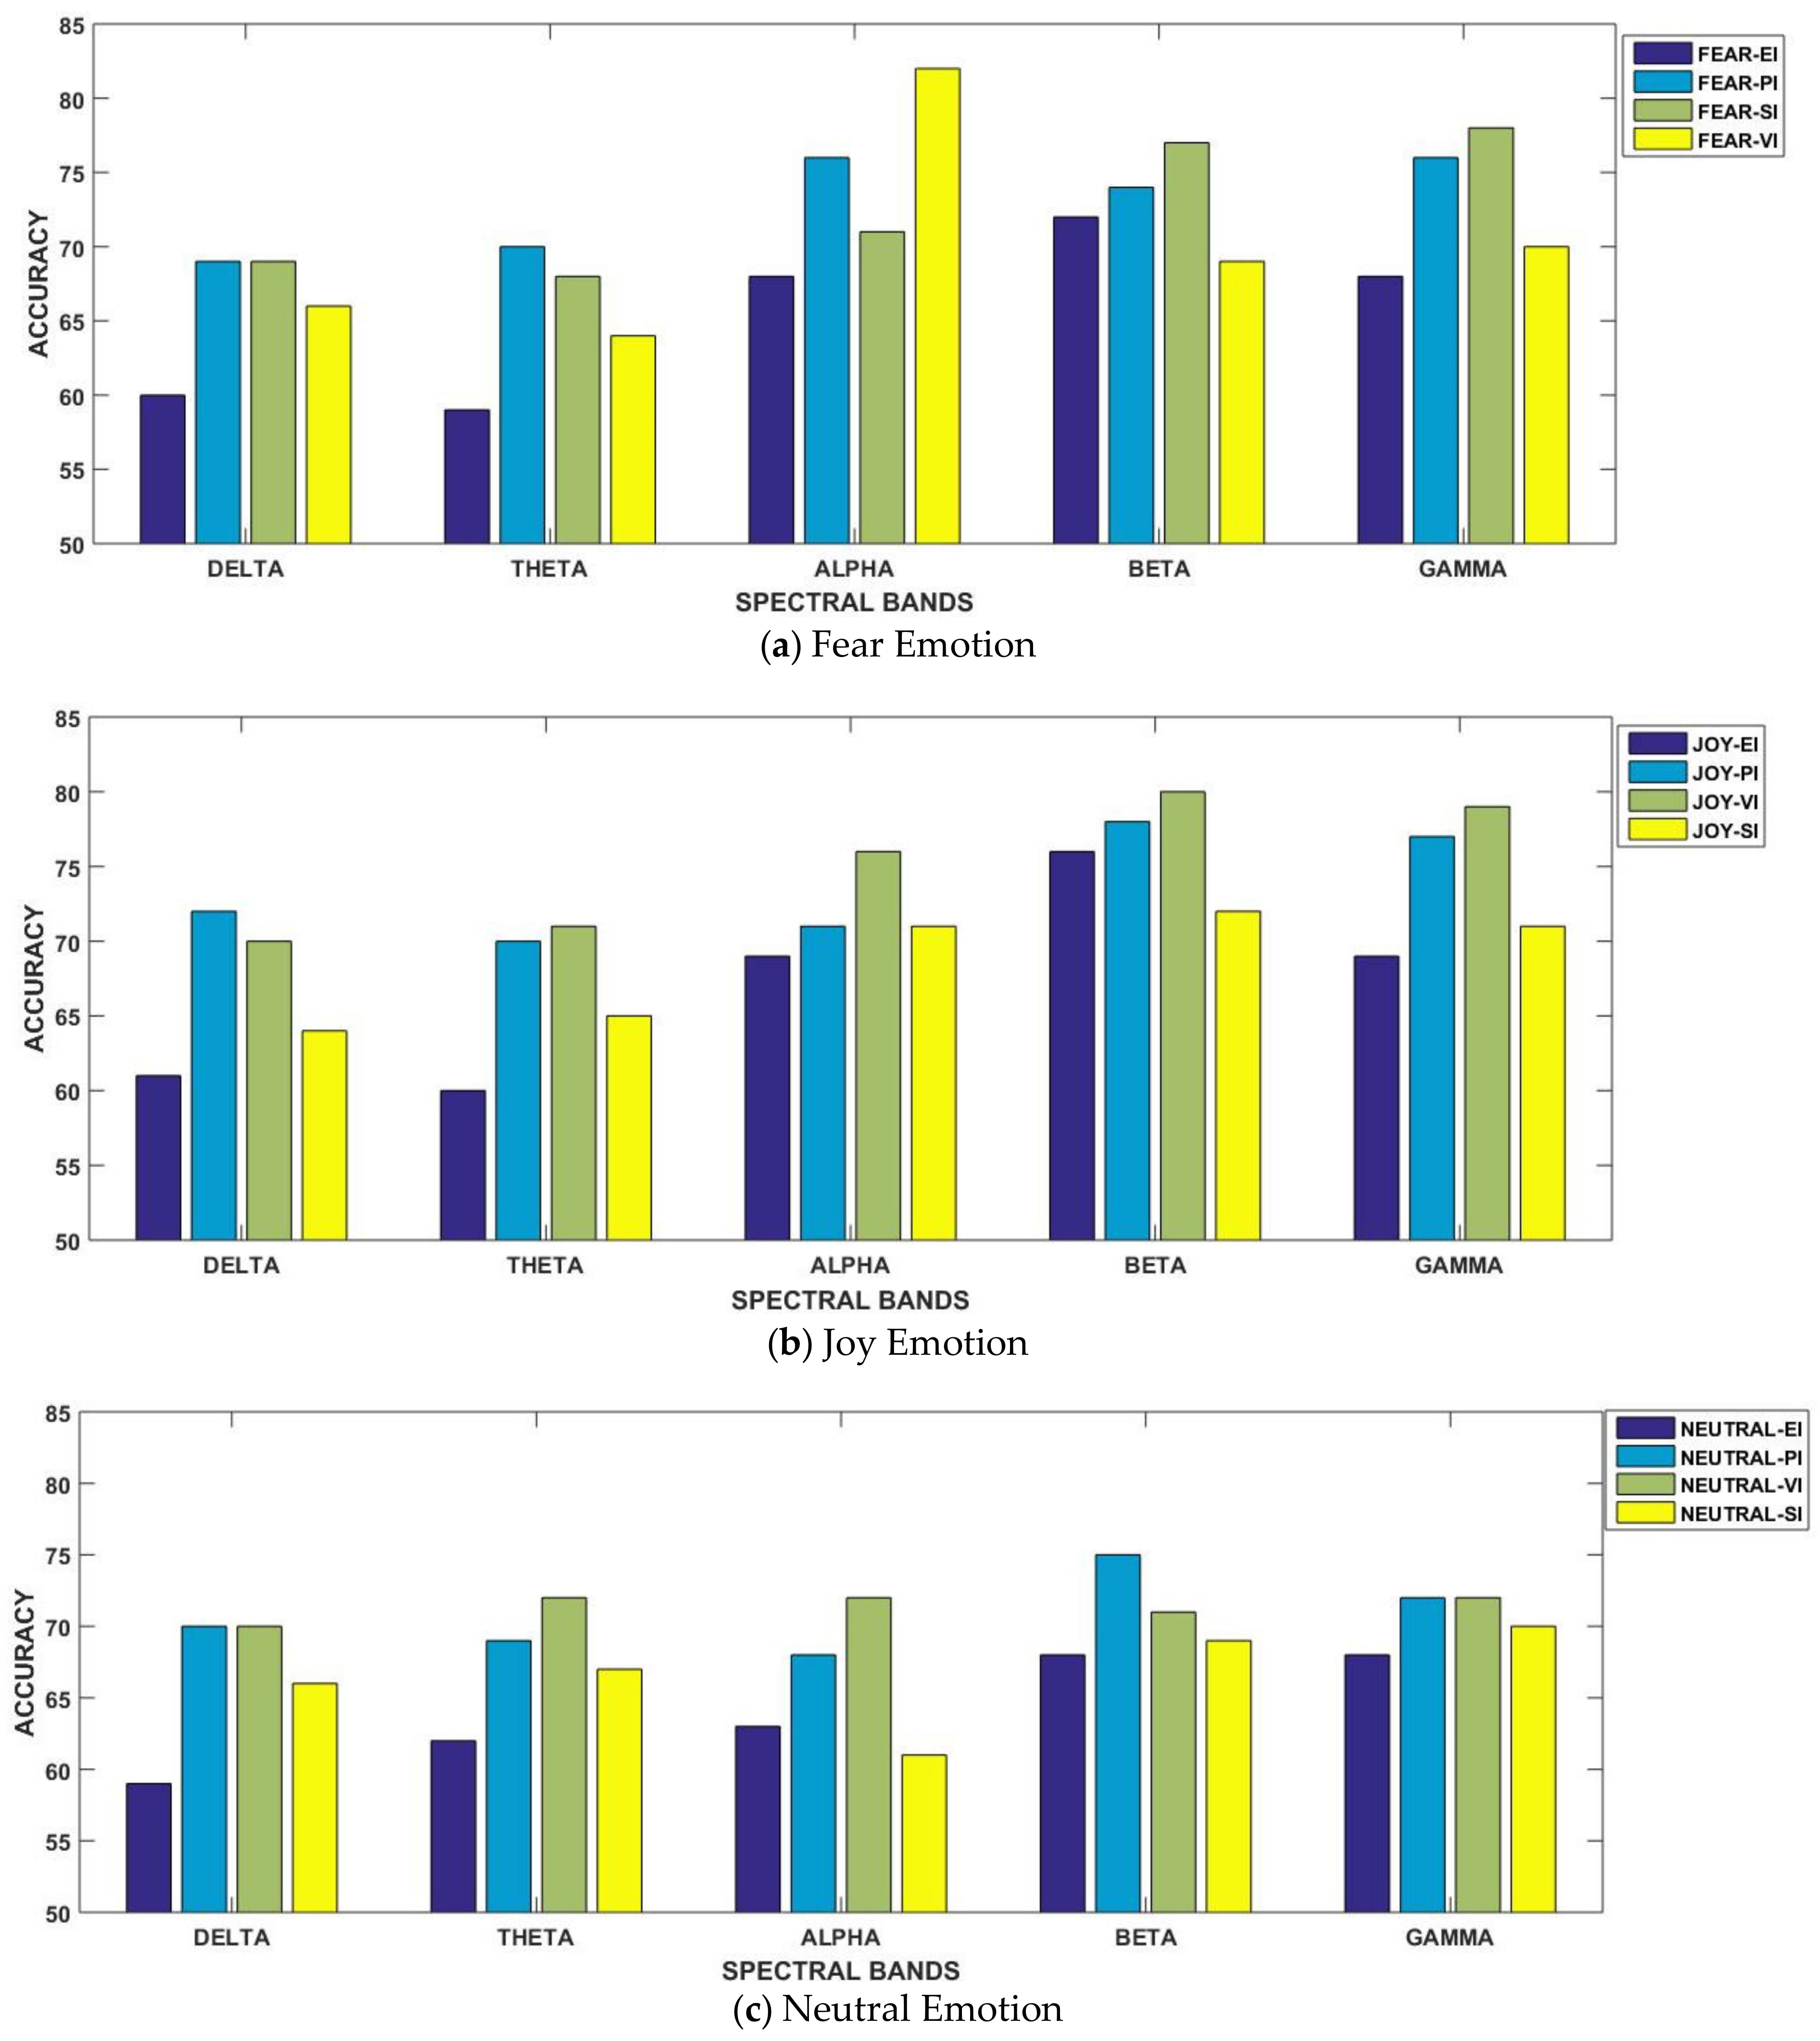
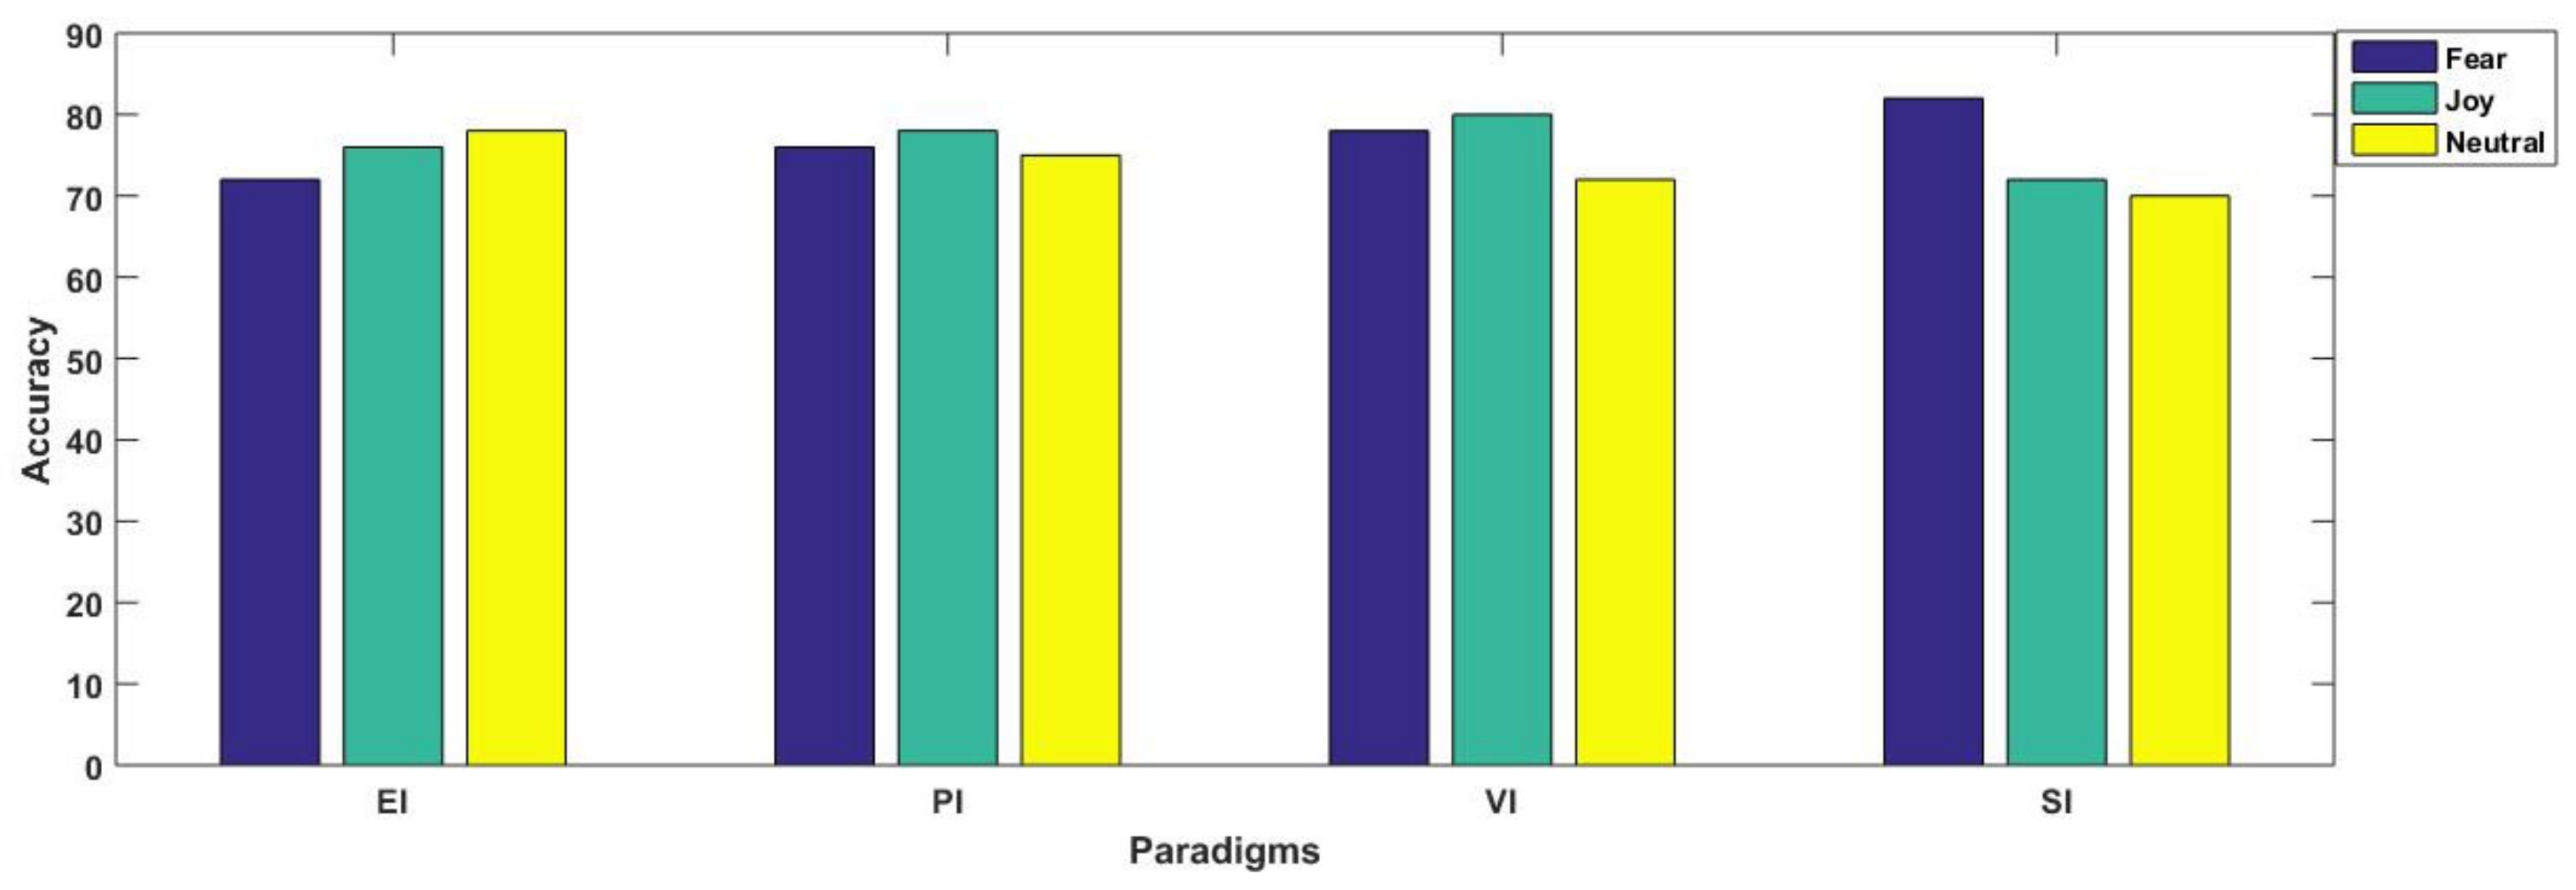
4.1. Classification with Respect to Specific Stimulus Presentation Paradigm
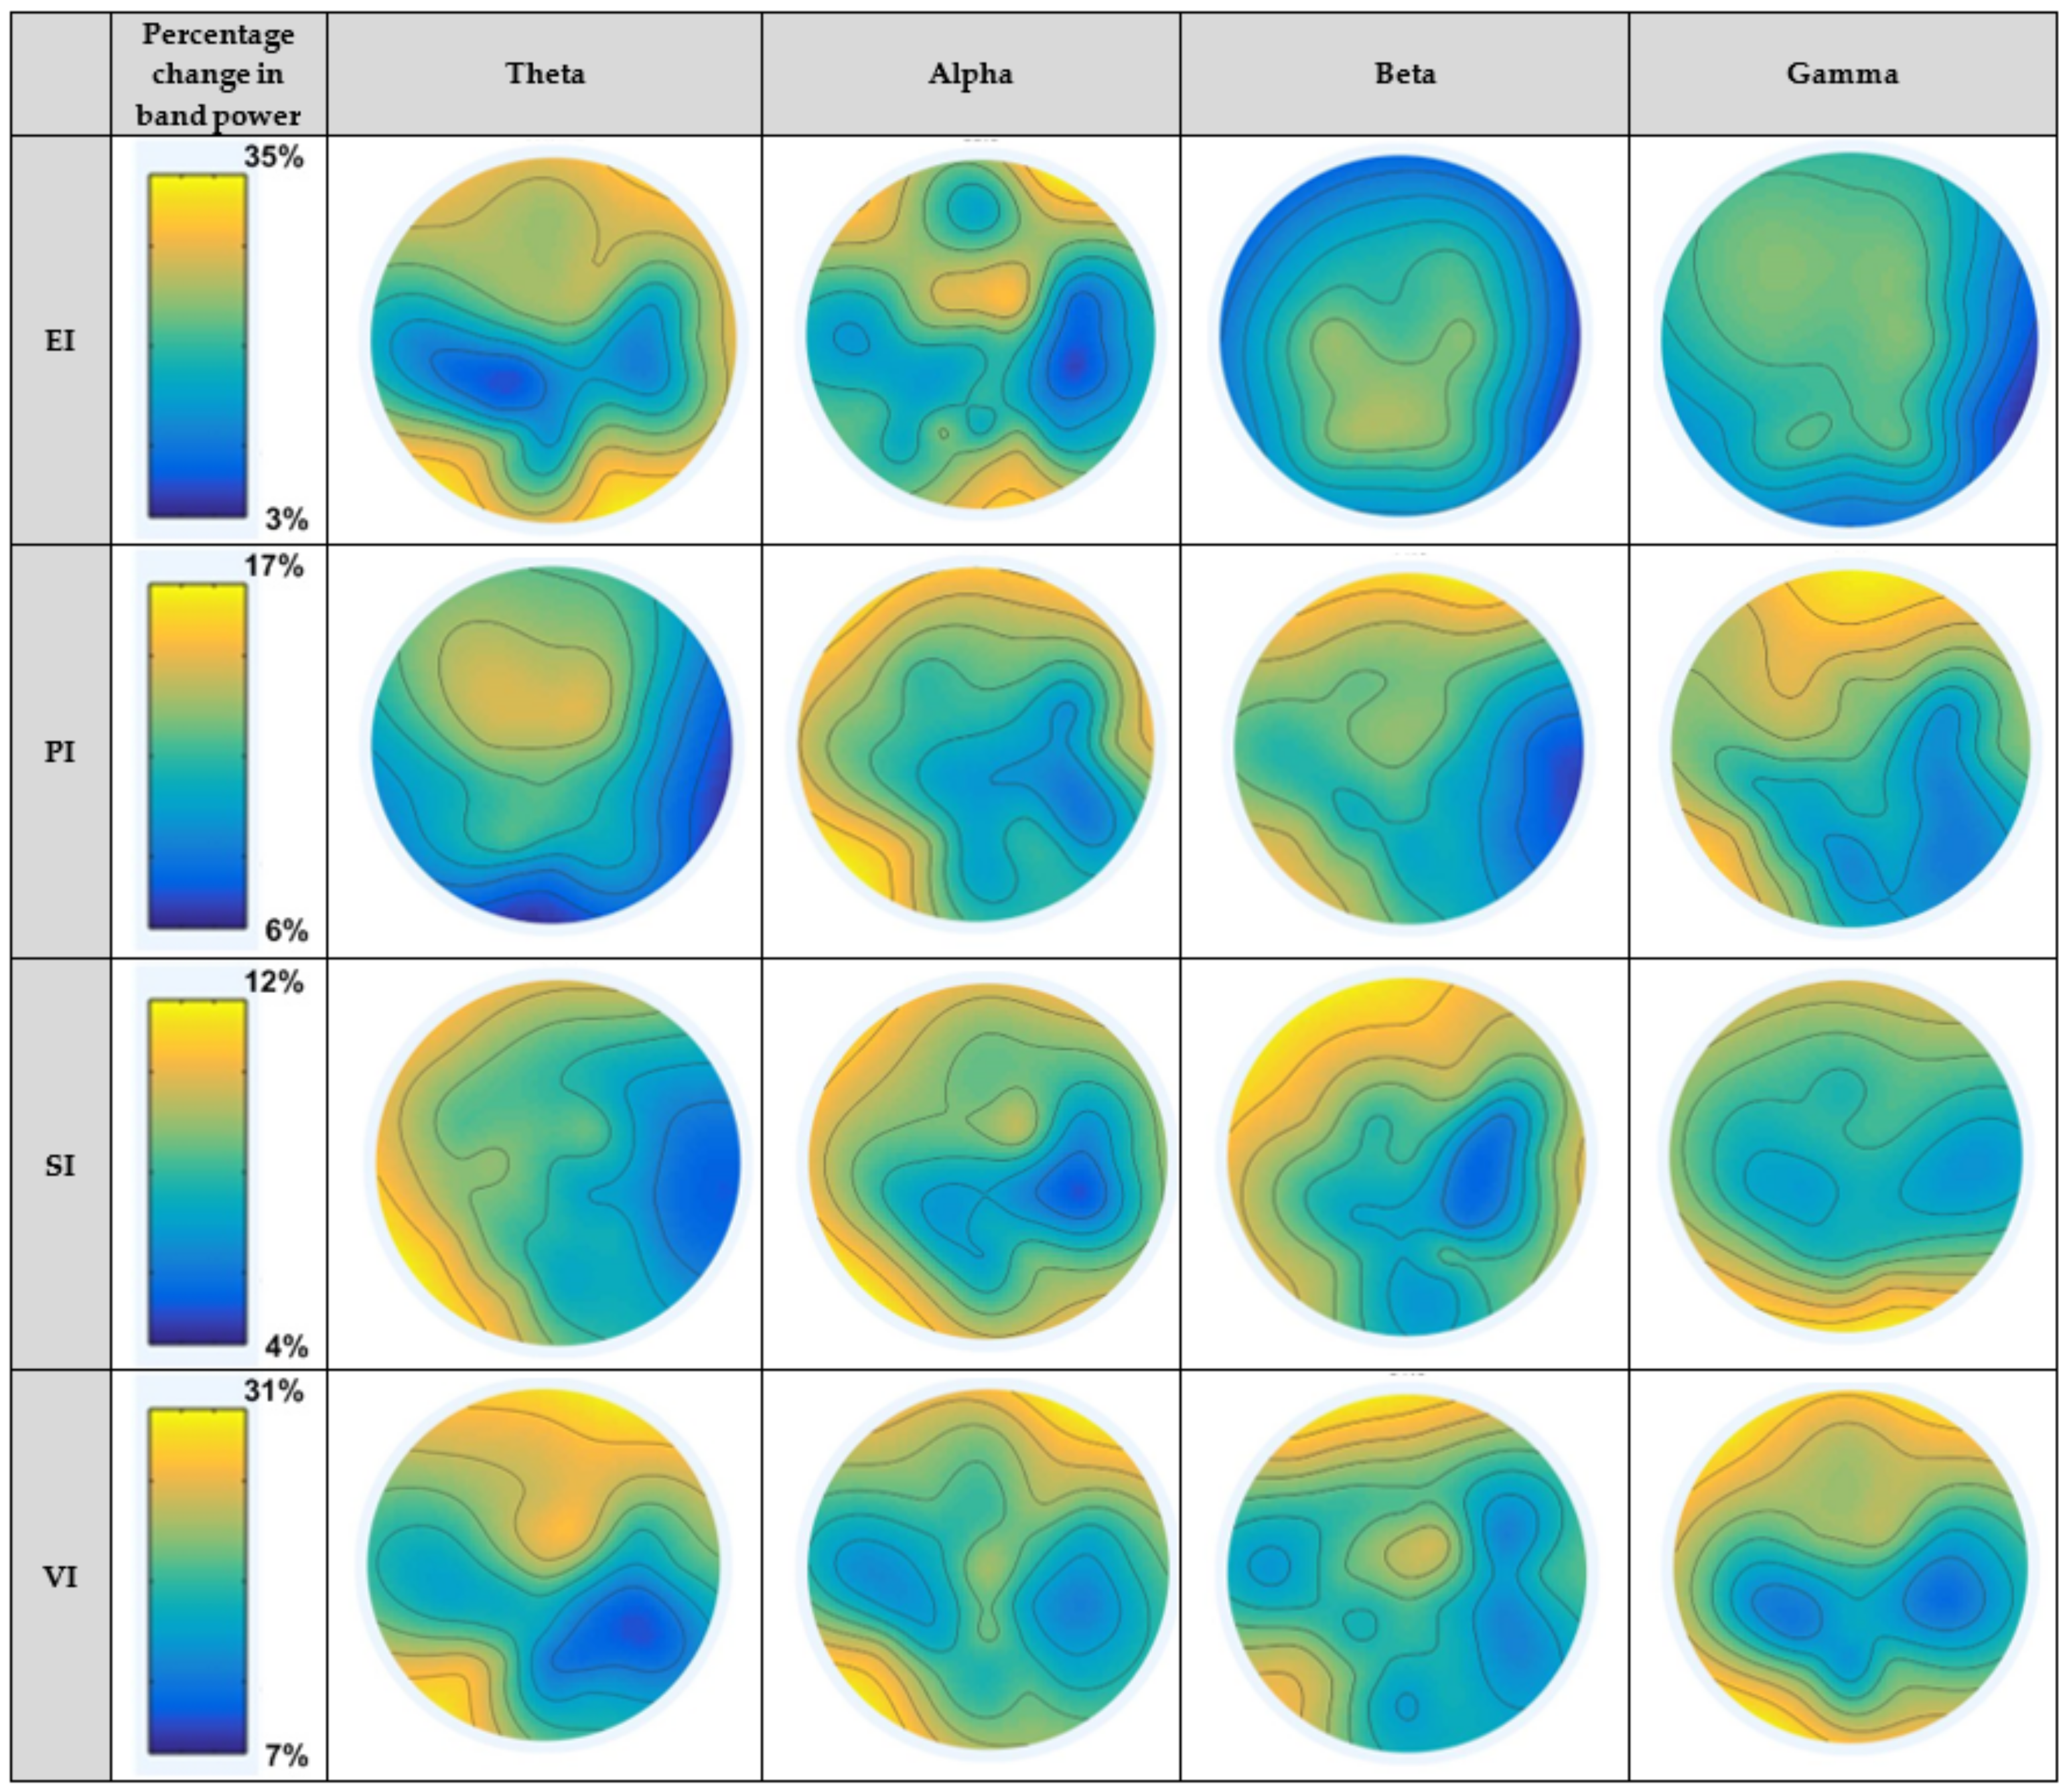
4.2. EEG Dynamics/Cortical Activations
4.2.1. Within Theta Band
4.2.2. Within Alpha Band
4.2.3. Within Beta Band
4.2.4. Within Gamma Band
5. Discussion
5.1. Classification Performance Analysis
5.2. Cortical Dynamics with Respect to Stimulus Paradigms
5.2.1. SI Paradigm
5.2.2. VI Paradigm
5.2.3. EI Paradigm
5.2.4. PI Paradigm
6. Highlights and Conclusions
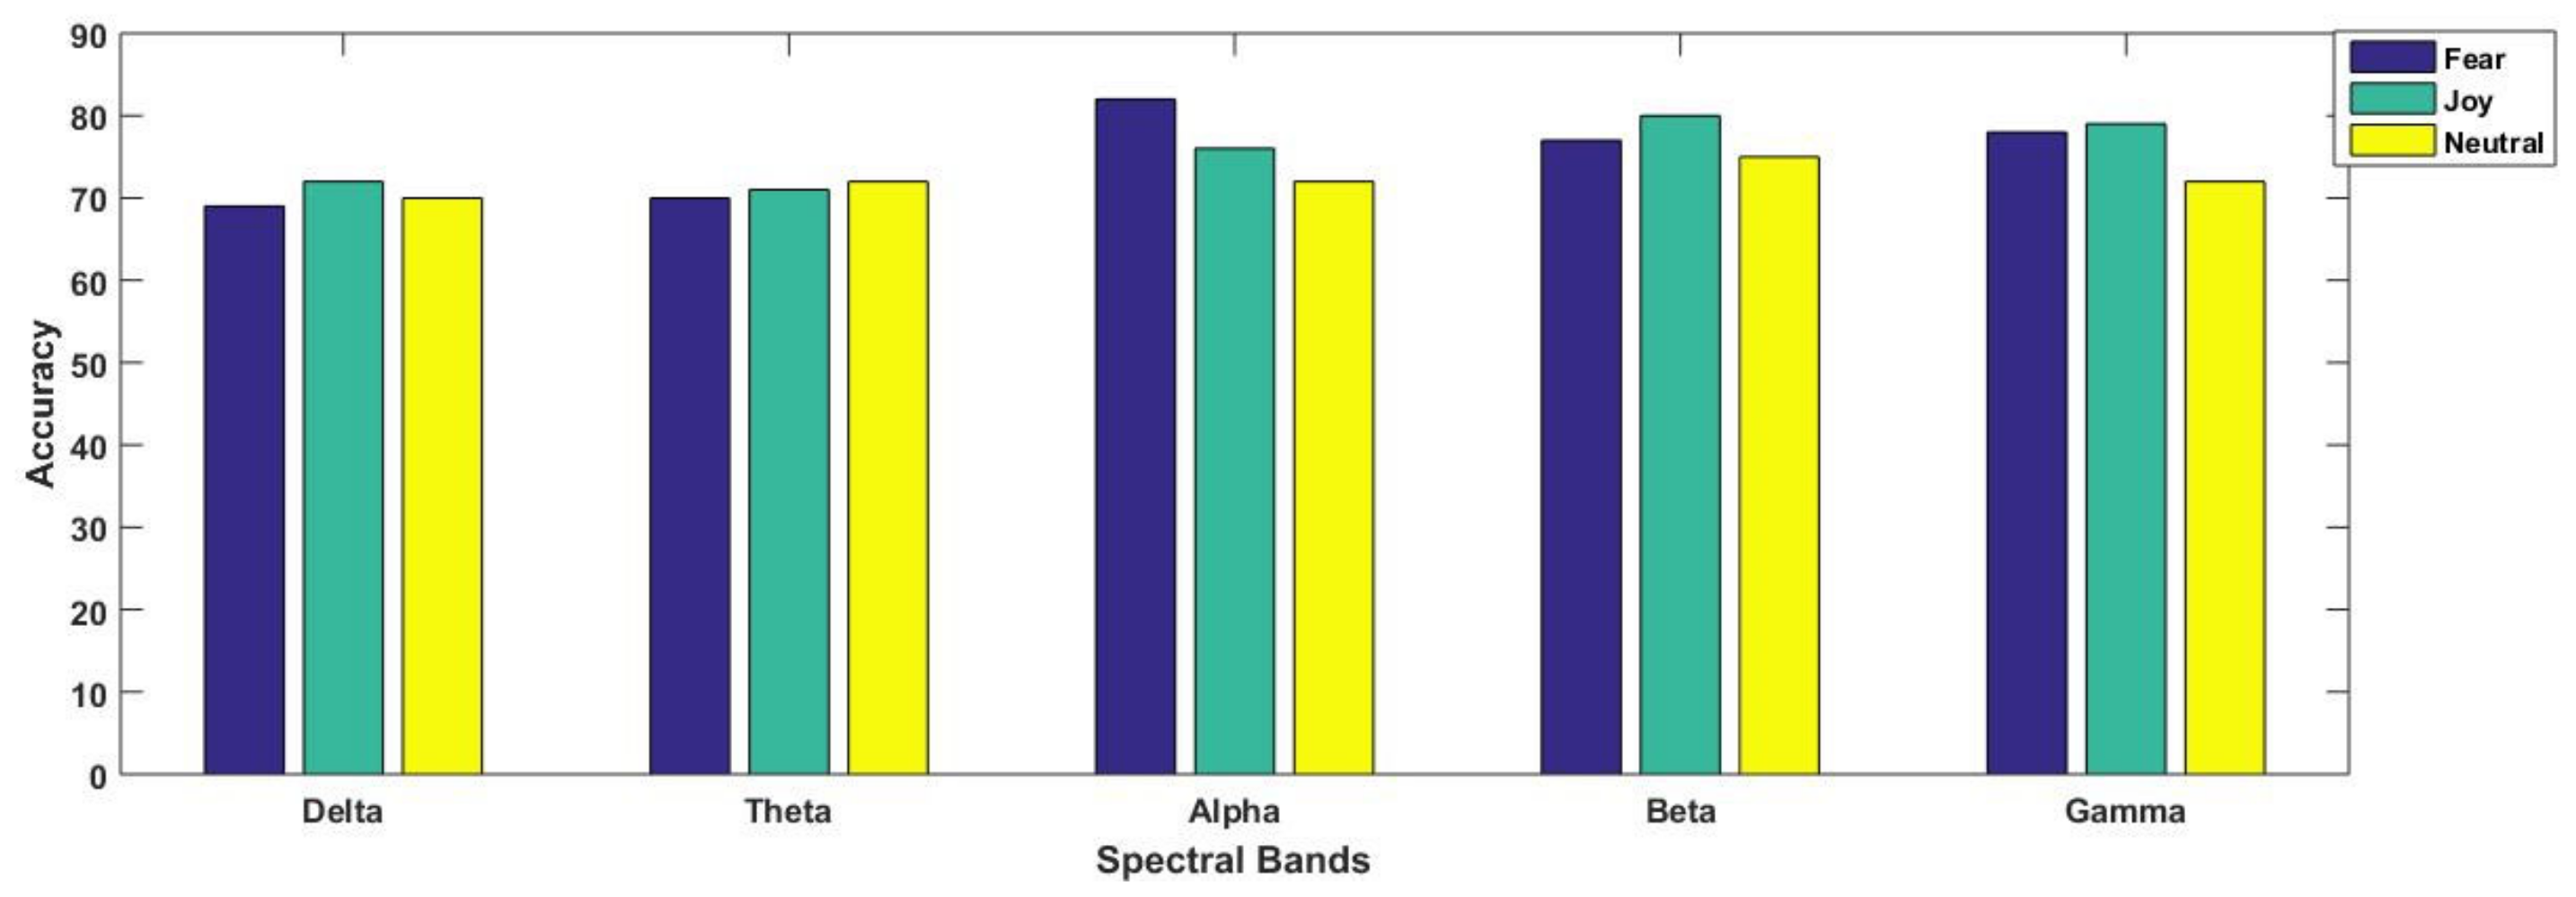
- With respect to the spectral band, beta and alpha oscillation responses have produced the highest number of significant results considering all the paradigms under consideration. Theta and gamma responses produced significant results, although not greater than alpha and beta;
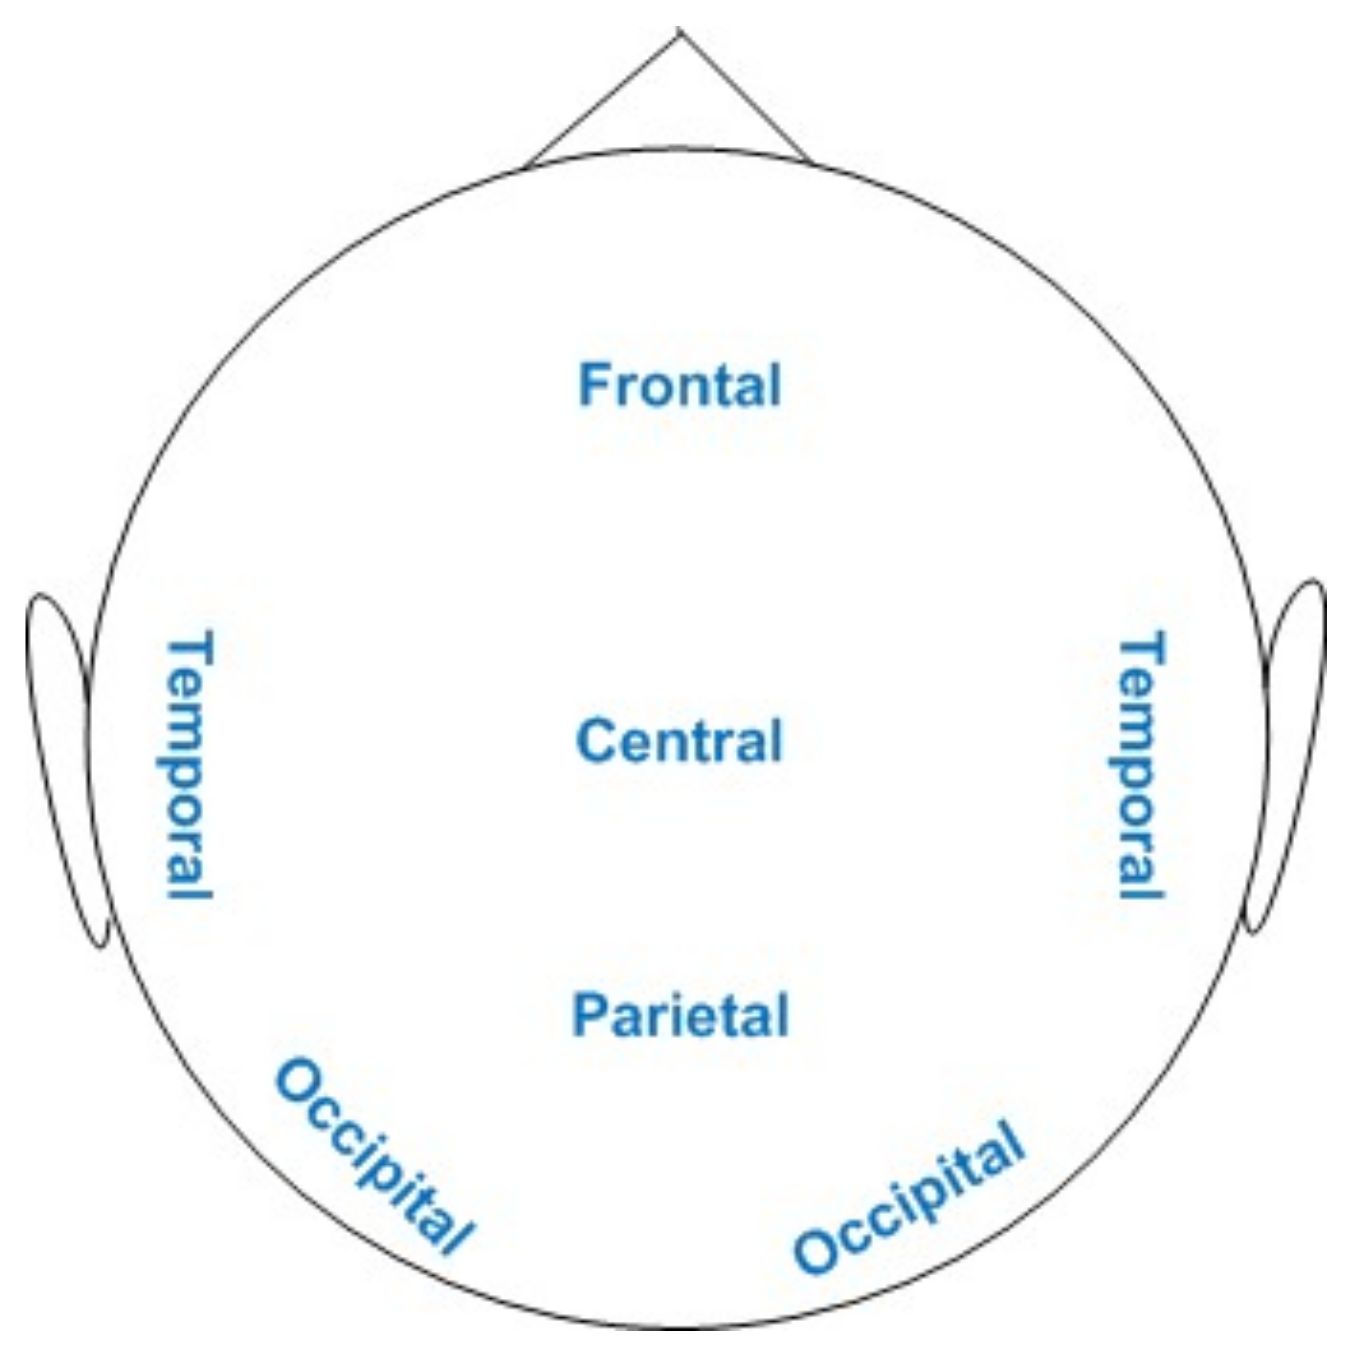
- With respect to brain region, the frontal lobe produced the most significant results, irrespective of paradigms and spectral bands. After frontal, the temporal site played an effective role in generating statistically significant findings;
- With respect to stimulus presentation paradigms, video-based stimuli produced the highest number of statistically significant features. After VI, pictures produced better results as compared to the remaining paradigms of EI and SI. This shows that the visual appearance of a stimulus plays an effective role in emotion recognition;
- With respect to emotional states, the negative emotion of fear produced stronger band power changes as compared to the joy state, irrespective of spectral band and stimulus presentation paradigm.
- The positive emotional state of joy was better classified as compared to fear and neutral states in most of the paradigms;
- Beta and gamma oscillations reported higher accuracies as compared to other spectral bands in most of the paradigms;
- No specific stimulus could outperform others with respect to classification accuracy.
Author Contributions
Funding
Institutional Review Board Statement
Informed Consent Statement
Data Availability Statement
Conflicts of Interest
Appendix A

| S. No. | Videos | Emotional State |
|---|---|---|
| 1. | Lights Out movie trailer | Fear |
| 2. | Best Vacations: Jumping | Joy |
| 3. | Earth/Moon Orbit 3D Animation | Neutral |
| 4. | Video clip from Insidious movie | Fear |
| 5. | Caught red-handed | Joy |
| 6. | Solar System Video | Neutral |
| 7. | Conjuring official trailer | Fear |
| 8. | Stunning China—UNESCO World Heritage | Joy |
| 9. | Box Plant Basics—Corrugated Box Basics | Neutral |
| 10. | Die in Disaster Movies | Fear |
| 11. | Tourism Sites in Pakistan | Joy |
| 12. | Planet Earth Rotation 3D | Neutral |
| 13. | Scene from The Eye—Horror movie | Fear |
| 14. | Berlin City Tour | Joy |
| 15. | Glow-effect Neon | Neutral |
| 16. | Snake catcher in Indian forest | Fear |
| 17. | BBC nature documentary, 2016 | Joy |
| 18. | Earth/Moon Orbit 3D Animation | Neutral |
| 19. | Female Restroom—Horror clip | Fear |
| 20. | Nat Geo Wild HD Ocean of Giants | Joy |
| 21. | Box Plant Basics–Corrugated Box Basics | Neutral |
| 22. | Frightening Creepy Clown | Fear |
| 23. | 10-month-old babies | Joy |
| 24. | Solar System Video | Neutral |
| 25. | Scene from The Conjuring 2 | Fear |
| 26. | Roller Coaster & Candy Coaster | Joy |
| 27. | Planet Earth Rotation 3D | Neutral |
| 28. | Fear of Snakes | Fear |
| 29. | Army Man surprises his 8-year-old daughter | Joy |
| 30. | Box Plant Basics—Corrugated Box Basics | Neutral |
References
- Hockenbury, D.H.; Hockenbury, S.E. Discovering Psychology; Macmillan: New York, NY, USA, 2010. [Google Scholar]
- Poria, S.; Cambria, E.; Bajpai, R.; Hussain, A. A review of affective computing: From unimodal analysis to multimodal fusion. Inf. Fusion 2017, 37, 98–125. [Google Scholar] [CrossRef]
- Alimardani, F.; Boostani, R.; Blankertz, B. Weighted spatial based geometric scheme as an efficient algorithm for analyzing single-trial EEGS to improve cue-based BCI classification. Neural Netw. 2017, 92, 69–76. [Google Scholar] [CrossRef]
- Gao, Z.; Cui, X.; Wan, W.; Gu, Z. Recognition of Emotional States using Multiscale Information Analysis of High Frequency EEG Oscillations. Entropy 2019, 21, 609. [Google Scholar] [CrossRef]
- Ekman, P.E.; Davidson, R.J. The Nature of Emotion: Fundamental Questions; Oxford University Press: Oxford, UK, 1994. [Google Scholar]
- Spezialetti, M.; Cinque, L.; Tavares, J.M.R.; Placidi, G. Towards EEG-based BCI driven by emotions for addressing BCI-Illiteracy: A meta-analytic review. Behav. Inf. Technol. 2018, 37, 855–871. [Google Scholar] [CrossRef]
- Porges, S.W. Social engagement and attachment. Ann. N. Y. Acad. Sci. 2003, 1008, 31–47. [Google Scholar] [CrossRef] [PubMed]
- Zhuang, N.; Zeng, Y.; Yang, K.; Zhang, C.; Tong, L.; Yan, B. Investigating patterns for self-induced emotion recognition from EEG signals. Sensors 2018, 18, 841. [Google Scholar] [CrossRef]
- Chanel, G.; Kierkels, J.J.; Soleymani, M.; Pun, T. Short-term emotion assessment in a recall paradigm. Int. J. Hum. Comput. Stud. 2009, 67, 607–627. [Google Scholar] [CrossRef]
- Kothe, C.A.; Makeig, S.; Onton, J.A. Emotion recognition from EEG during self-paced emotional imagery. In Proceedings of the 2013 Humaine Association Conference on Affective Computing and Intelligent Interaction (ACII), Geneva, Switzerland, 2–5 September 2013; IEEE: Piscataway Township, NY, USA, 2013. [Google Scholar]
- Iacoviello, D.; Petracca, A.; Spezialetti, M.; Placidi, G. A classification algorithm for electroencephalography signals by self-induced emotional stimuli. IEEE Trans. Cybern. 2016, 46, 3171–3180. [Google Scholar] [CrossRef]
- Li, J.; Zhang, Z.; He, H. Hierarchical convolutional neural networks for EEG-based emotion recognition. Cogn. Comput. 2018, 10, 368–380. [Google Scholar] [CrossRef]
- Hiyoshi-Taniguchi, K.; Kawasaki, M.; Yokota, T.; Bakardjian, H.; Fukuyama, H.; Cichocki, A.; Vialatte, F.B. EEG correlates of voice and face emotional judgments in the human brain. Cogn. Comput. 2015, 7, 11–19. [Google Scholar] [CrossRef]
- Hu, X.; Yu, J.; Song, M.; Yu, C.; Wang, F.; Sun, P.; Wang, D.; Zhang, D. EEG correlates of ten positive emotions. Front. Hum. Neurosci. 2017, 11, 26. [Google Scholar] [CrossRef]
- Alarcao, S.M.; Fonseca, M.J. Emotions recognition using EEG signals: A survey. IEEE Trans. Affect. Comput. 2017, 10, 374–393. [Google Scholar] [CrossRef]
- Wang, Z.-M.; Zhou, R.; He, Y.; Guo, X.-M. Functional Integration and Separation of Brain Network Based on Phase Locking Value During Emotion Processing. IEEE Trans. Cogn. Dev. Syst. 2020. [Google Scholar] [CrossRef]
- Djemal, R.; Bazyed, A.G.; Belwafi, K.; Gannouni, S.; Kaaniche, W. Three-class EEG-based motor imagery classification using phase-space reconstruction technique. Brain Sci. 2016, 6, 36. [Google Scholar] [CrossRef] [PubMed]
- Dornhege, G.; Blankertz, B.; Curio, G.; Muller, K.-R. Boosting bit rates in noninvasive EEG single-trial classifications by feature combination and multiclass paradigms. IEEE Trans. Biomed. Eng. 2004, 51, 993–1002. [Google Scholar] [CrossRef]
- Ruiz-Gómez, S.J.; Gómez, C.; Poza, J.; Gutiérrez-Tobal, G.C.; Tola-Arribas, M.A.; Cano, M.; Hornero, R. Automated multiclass classification of spontaneous EEG activity in Alzheimer’s disease and mild cognitive impairment. Entropy 2018, 20, 35. [Google Scholar] [CrossRef] [PubMed]
- Khan, J.; Bhatti, M.H.; Khan, U.G.; Iqbal, R. Multiclass EEG motor-imagery classification with sub-band common spatial patterns. EURASIP J. Wirel. Commun. Netw. 2019, 2019, 1–9. [Google Scholar] [CrossRef]
- Song, T.; Zheng, W.; Song, P.; Cui, Z. EEG emotion recognition using dynamical graph convolutional neural networks. IEEE Trans. Affect. Comput. 2018, 11, 532–541. [Google Scholar] [CrossRef]
- Nakisa, B.; Rastgoo, M.N.; Tjondronegoro, D.; Chandran, V. Evolutionary computation algorithms for feature selection of EEG-based emotion recognition using mobile sensors. Expert Syst. Appl. 2018, 93, 143–155. [Google Scholar] [CrossRef]
- Piho, L.; Tjahjadi, T. A mutual information based adaptive windowing of informative EEG for emotion recognition. IEEE Trans. Affect. Comput. 2018, 11, 722–735. [Google Scholar] [CrossRef]
- Ullah, H.; Uzair, M.; Mahmood, A.; Ullah, M.; Khan, S.D.; Cheikh, F.A. Internal emotion classification using eeg signal with sparse discriminative ensemble. IEEE Access 2019, 7, 40144–40153. [Google Scholar] [CrossRef]
- Eijlers, E.; Smidts, A.; Boksem, M.A. Implicit measurement of emotional experience and its dynamics. PLoS ONE 2019, 14, e0211496. [Google Scholar] [CrossRef] [PubMed]
- Lee, M.; Shin, G.-H.; Lee, S.-W. Frontal EEG Asymmetry of Emotion for the Same Auditory Stimulus. IEEE Access 2020, 8, 107200–107213. [Google Scholar] [CrossRef]
- Meng, X.; Liu, W.; Zhang, L.; Li, X.; Yao, B.; Ding, X.; Yuan, J.; Yang, J. EEG oscillation evidences of enhanced susceptibility to emotional stimuli during adolescence. Front. Psychol. 2016, 7, 616. [Google Scholar] [CrossRef] [PubMed]
- Mennella, R.; Sarlo, M.; Messerotti Benvenuti, S.; Buodo, G.; Mento, G.; Palomba, D. The two faces of avoidance: Time-frequency correlates of motivational disposition in blood phobia. Psychophysiology 2017, 54, 1606–1620. [Google Scholar] [CrossRef]
- Güntekin, B.; Başar, E. Brain oscillations are highly influenced by gender differences. Int. J. Psychophysiol. 2007, 65, 294–299. [Google Scholar] [CrossRef] [PubMed]
- Uusberg, A.; Uibo, H.; Kreegipuu, K.; Allik, J. EEG alpha and cortical inhibition in affective attention. Int. J. Psychophysiol. 2013, 89, 26–36. [Google Scholar] [CrossRef]
- Güntekin, B.; Başar, E. A review of brain oscillations in perception of faces and emotional pictures. Neuropsychologia 2014, 58, 33–51. [Google Scholar] [CrossRef] [PubMed]
- Höller, Y.; Thomschewski, A.; Schmid, E.V.; Höller, P.; Crone, J.S.; Trinka, E. Individual brain-frequency responses to self-selected music. Int. J. Psychophysiol. 2012, 86, 206–213. [Google Scholar] [CrossRef] [PubMed]
- Ara, A.; Marco-Pallarés, J. Fronto-temporal theta phase-synchronization underlies music-evoked pleasantness. NeuroImage 2020, 212, 116665. [Google Scholar] [CrossRef] [PubMed]
- Balconi, M.; Lucchiari, C. EEG correlates (event-related desynchronization) of emotional face elaboration: A temporal analysis. Neurosci. Lett. 2006, 392, 118–123. [Google Scholar] [CrossRef]
- Zhang, D.; Wang, L.; Luo, Y.; Luo, Y. Individual differences in detecting rapidly presented fearful faces. PLoS ONE 2012, 7, e49517. [Google Scholar] [CrossRef] [PubMed]
- Knyazev, G.; Slobodskoj-Plusnin, J.Y.; Bocharov, A. Event-related delta and theta synchronization during explicit and implicit emotion processing. Neuroscience 2009, 164, 1588–1600. [Google Scholar] [CrossRef]
- Güntekin, B.; Başar, E. Event-related beta oscillations are affected by emotional eliciting stimuli. Neurosci. Lett. 2010, 483, 173–178. [Google Scholar] [CrossRef]
- Schutter, D.J.; Putman, P.; Hermans, E.; van Honk, J. Parietal electroencephalogram beta asymmetry and selective attention to angry facial expressions in healthy human subjects. Neurosci. Lett. 2001, 314, 13–16. [Google Scholar] [CrossRef]
- Li, M.; Lu, B.-L. Emotion classification based on gamma-band EEG. In Proceedings of the 2009 Annual International Conference of the IEEE Engineering in Medicine and Biology Society, St. Paul, MN, USA, 2–6 September 2009; IEEE: Piscataway Township, NY, USA, 2009. [Google Scholar]
- Li, P.; Liu, H.; Si, Y.; Li, C.; Li, F.; Zhu, X.; Huang, X.; Zeng, Y.; Yao, D.; Zhang, Y.; et al. EEG based emotion recognition by combining functional connectivity network and local activations. IEEE Trans. Biomed. Eng. 2019, 66, 2869–2881. [Google Scholar] [CrossRef]
- Zhang, J.; Chen, M.; Zhao, S.; Hu, S.; Shi, Z.; Cao, Y. ReliefF-based EEG sensor selection methods for emotion recognition. Sensors 2016, 16, 1558. [Google Scholar] [CrossRef] [PubMed]
- Jatupaiboon, N.; Pan-ngum, S.; Israsena, P. Emotion classification using minimal EEG channels and frequency bands. In Proceedings of the 2013 10th International Joint Conference on Computer Science and Software Engineering (JCSSE), Khon Kaen, Thailand, 29–31 May 2013; IEEE: Piscataway Township, NY, USA, 2013. [Google Scholar]
- Zheng, W.-L.; Lu, B.-L. Investigating critical frequency bands and channels for EEG-based emotion recognition with deep neural networks. IEEE Trans. Auton. Ment. Dev. 2015, 7, 162–175. [Google Scholar] [CrossRef]
- Shahabi, H.; Moghimi, S. Toward automatic detection of brain responses to emotional music through analysis of EEG effective connectivity. Comput. Hum. Behav. 2016, 58, 231–239. [Google Scholar] [CrossRef]
- Costa, T.; Rognoni, E.; Galati, D. EEG phase synchronization during emotional response to positive and negative film stimuli. Neurosci. Lett. 2006, 406, 159–164. [Google Scholar] [CrossRef]
- Lee, Y.-Y.; Hsieh, S. Classifying different emotional states by means of EEG-based functional connectivity patterns. PLoS ONE 2014, 9, e95415. [Google Scholar] [CrossRef]
- Aftanas, L.; Golosheykin, S. Impact of regular meditation practice on EEG activity at rest and during evoked negative emotions. Int. J. Neurosci. 2005, 115, 893–909. [Google Scholar] [CrossRef] [PubMed]
- Masood, N.; Farooq, H. Investigating EEG patterns for dual-stimuli induced human fear emotional state. Sensors 2019, 19, 522. [Google Scholar] [CrossRef]
- Lang, P.J. International Affective Picture System (IAPS): Affective Ratings of Pictures and Instruction Manual; Technical report; University of Florida: Gainesville, FL, USA, 2005. [Google Scholar]
- Bradley, M.M.; Lang, P.J. The International Affective Digitized Sounds (IADS-2): Affective Ratings of Sounds and Instruction Manual; University of Florida: Gainesville, FL, USA, 2007. [Google Scholar]
- Li, M.; Xu, H.; Liu, X.; Lu, S. Emotion recognition from multichannel EEG signals using K-nearest neighbor classification. Technol. Health Care 2018, 26, 509–519. [Google Scholar] [CrossRef] [PubMed]
- Otten, M.; Jonas, K.J. Humiliation as an intense emotional experience: Evidence from the electro-encephalogram. Soc. Neurosci. 2014, 9, 23–35. [Google Scholar] [CrossRef] [PubMed]
- Schubring, D.; Schupp, H.T. Affective picture processing: Alpha-and lower beta-band desynchronization reflects emotional arousal. Psychophysiology 2019, 56, e13386. [Google Scholar] [CrossRef] [PubMed]
- Sato, W.; Kochiyama, T.; Uono, S.; Matsuda, K.; Usui, K.; Inoue, Y.; Toichi, M. Rapid amygdala gamma oscillations in response to fearful facial expressions. Neuropsychologia 2011, 49, 612–617. [Google Scholar] [CrossRef] [PubMed]
- Jung, J.; Bayle, D.; Jerbi, K.; Vidal, J.R.; Hénaff, M.A.; Ossandon, T.; Bertrand, O.; Mauguière, F.; Lachaux, J.P. Intracerebral gamma modulations reveal interaction between emotional processing and action outcome evaluation in the human orbitofrontal cortex. Int. J. Psychophysiol. 2011, 79, 64–72. [Google Scholar] [CrossRef]
- Yang, K.; Tong, L.; Shu, J.; Zhuang, N.; Yan, B.; Zeng, Y. High Gamma Band EEG Closely Related to Emotion: Evidence from Functional Network. Front. Hum. Neurosci. 2020, 14, 89. [Google Scholar] [CrossRef]
- Delorme, A.; Makeig, S. EEGLAB: An open source toolbox for analysis of single-trial EEG dynamics including independent component analysis. J. Neurosci. Methods 2004, 134, 9–21. [Google Scholar] [CrossRef]
- Heunis, C. Export and Analysis of Emotiv Insight EEG Data via EEGLAB. 2016. Available online: https://www.researchgate.net/profile/Christoff-Heunis/publication/303810882_Export_and_Analysis_of_Emotiv_Insight_EEG_Data_via_EEGLAB/links/57547bd808ae10d9337a3e01/Export-and-Analysis-of-Emotiv-Insight-EEG-Data-via-EEGLAB.pdf (accessed on 25 May 2021).
- Lotte, F.; Guan, C. Regularizing common spatial patterns to improve BCI designs: Unified theory and new algorithms. IEEE Trans. Biomed. Eng. 2010, 58, 355–362. [Google Scholar] [CrossRef]
- Lan, Z. EEG-Based Emotion Recognition Using Machine Learning Techniques. Ph.D. Thesis, Nanyang Technological University, Singapore, 2018. [Google Scholar]
- Lan, Z.; Sourina, O.; Wang, L.; Liu, Y. Real-time EEG-based emotion monitoring using stable features. Vis. Comput. 2016, 32, 347–358. [Google Scholar] [CrossRef]
- Scharinger, C.; Soutschek, A.; Schubert, T.; Gerjets, P. Comparison of the working memory load in n-back and working memory span tasks by means of EEG frequency band power and P300 amplitude. Front. Hum. Neurosci. 2017, 11, 6. [Google Scholar] [CrossRef] [PubMed]
- Blankertz, B.; Lemm, S.; Treder, M.; Haufe, S.; Müller, K.-R. Single-trial analysis and classification of ERP components—A tutorial. NeuroImage 2011, 56, 814–825. [Google Scholar] [CrossRef] [PubMed]
- Scholkopft, B.; Mullert, K.-R. Fisher discriminant analysis with kernels. Neural Netw. Signal Process. IX 1999, 1, 1. [Google Scholar]
- Miskovic, V.; Schmidt, L.A. Cross-regional cortical synchronization during affective image viewing. Brain Res. 2010, 1362, 102–111. [Google Scholar] [CrossRef] [PubMed]


| Study | Emotional States/Stimulus Presentation Paradigms | Synchronization/De-Synchronization | Frequency Band |
|---|---|---|---|
| Knyazev et al. [36] | angry, happiness and neutral conditions | Synchronization | Delta |
| Alberto Ara and Marco-Pallares [33] | music-evoked pleasantness | Synchronization | Theta |
| Balconi and Lucchiari [34] | emotional stimuli as compared to neutral one | Synchronization | Theta |
| Zhang et al. [35] | frightening facial stimuli in comparison to neutral ones | Synchronization | Theta |
| Lee et al. [26] | De- Synchronization | Alpha | |
| Otten and Jonas [52] | using emotion-evoking words and compared pleasant, unpleasant, and neutral conditions | De- Synchronization | Alpha |
| Meng et al. [27] | displaying pictures from International Affective Picture System (IAPS) database | De- Synchronization | Alpha |
| Mennella et al. [28] | displaying pictures from International Affective Picture System (IAPS) database | De- Synchronization | Alpha |
| Uusberg, A. et al. [29] | - | Synchronization | Alpha |
| Güntekin et al. [31] | - | Synchronization | Alpha |
| Schubring and Schupp [53] | erotic and romantic pictures | De- Synchronization | Alpha and Beta |
| Schutter, Putman, Hermans, and van Honk [38] | angry faces | Synchronization | Beta |
| Güntekin and Başar [37] | negative emotions in comparison to positive while subjects were viewing IAPS images | Synchronization | Beta |
| Eijlers et al. [25] | happy emotions | De- Synchronization | Gamma |
| Sato et al. [54] | negative emotions as compared to neutral and happy states | Synchronization | Gamma |
| Jung et al. [55] | negative states vs. neutral | Synchronization | Gamma |
| Paradigms | EI | PI | VI | SI | ||||||||
|---|---|---|---|---|---|---|---|---|---|---|---|---|
| Emotion | F | J | N | F | J | N | F | J | N | F | J | N |
| No. of Trials | 10 | 10 | 10 | 45 | 45 | 45 | 10 | 10 | 10 | 45 | 45 | 45 |
| Total no. of Trials for each paradigm | 30 | 135 | 30 | 135 | ||||||||
| Duration of each trial | 60 s | 60 s | 60 s | 7 s | 7 s | 7 s | 60–180 s | 60–180 s | 60–180 s | 6–10 s | 6–10 s | 6–10 s |
| Time duration considered for each trial | last 55 s | last 55 s | last 55 s | last 5 s | last 5 s | last 5 s | last 55 s | last 55 s | last 55 s | last 5 s | last 5 s | last 5 s |
| Time window length (s) for each epoch | 1 s | 1 s | 1 s | 1 s | 1 s | 1 s | 1 s | 1 s | 1 s | 1 s | 1 s | 1 s |
| No. of epochs | 550 | 550 | 550 | 225 | 225 | 225 | 550 | 550 | 550 | 225 | 225 | 225 |
| Total no. of epochs for each paradigm | 1650 | 675 | 1650 | 675 | ||||||||
| Paradigm | EI | PI | VI | SI | ||||||||
|---|---|---|---|---|---|---|---|---|---|---|---|---|
| Emotional State/Spectral Band | Fear vs. Rest | Happy vs. Rest | Neutral vs. Rest | Fear vs. Rest | Happy vs. Rest | Neutral vs. Rest | Fear vs. Rest | Happy vs. Rest | Neutral vs. Rest | Fear vs. Rest | Happy vs. Rest | Neutral vs. Rest |
| (1–3 Hz) | 60 | 61 | 59 | 69 | 72 | 70 | 69 | 70 | 70 | 66 | 64 | 66 |
| (4–7 Hz) | 59 | 60 | 62 | 70 | 70 | 69 | 68 | 71 | 72 | 64 | 65 | 67 |
| (8–13 Hz) | 68 | 69 | 63 | 76 | 71 | 68 | 71 | 76 | 72 | 82 | 71 | 61 |
| (14–30 Hz) | 72 | 76 | 68 | 74 | 78 | 75 | 77 | 80 | 71 | 69 | 72 | 69 |
| (31–50 Hz) | 68 | 69 | 68 | 76 | 77 | 72 | 78 | 79 | 72 | 70 | 71 | 70 |
| Study | Type of Study (Emotion Recognition/Others) | Emotion-Inducing Paradigm | Classifier | Classification Performance | Relevant Frequency Band/Brain Regions |
|---|---|---|---|---|---|
| Gao et al. [4] | Valence and Arousal | Videos | SVM | 62.01% | Gamma frequency band from frontal and temporal regions |
| Zhuang et al. [8] | Joy, neutrality, sadness, disgust, anger and fear | Self-induced | SVM | 54.52% | Higher frequency band/temporal, frontal and occipital sites. |
| Li et al. [51] | Valence and Arousal | Music | KNN | 95.70% 95.69% | Gamma frequency band |
| Jatupaiboon et al. [42] | Positive vs. negative emotional states | Pictures | SVM | 85.41% | Gamma frequency band at frontal region |
| Zhang et al. [41] | Four emotional states (joy, fear, sadness and relaxation) | Videos | SVM | 59.13% | Beta and gamma bands/frontal and parietal sites |
| Zheng et al. [43] | Positive, neutral and negative | Videos | KNN, SVM, DBNs | 83.99% | Beta and gamma bands |
| Kothe et al. [10] | Positive vs. negative | Self-induced | Logistic Regression | 71.3% | - |
| Lacoviello et al. [11] | Disgust vs. relax | Self-induced | SVM | >90% | - |
| Li and Lu [39] | Happiness vs. Sadness | Pictures | Linear SVM | 93.5% | Gamma band (30–100 Hz) |
| Author’s work | Fear vs. Rest | Self-induced | LDA | 72% | Beta |
| Joy vs. Rest | 76% | Beta | |||
| Neutral vs. Rest | 68% | Beta/gamma | |||
| Fear vs. Rest | Picture-Induced | LDA | 76% | Gamma | |
| Joy vs. Rest | 78% | Beta | |||
| Neutral vs. Rest | 75% | Beta | |||
| Fear vs. Rest | Video-Induced | LDA | 78% | Gamma | |
| Joy vs. Rest | 80% | Beta | |||
| Neutral vs. Rest | 72% | Gamma/theta/alpha | |||
| Fear vs. Rest | Sound-Induced | LDA | 82% | Alpha | |
| Joy vs. Rest | 72% | Beta | |||
| Neutral vs. Rest | 70% | Gamma |
| EI | PI | SI | VI | |||||||||||||||||
|---|---|---|---|---|---|---|---|---|---|---|---|---|---|---|---|---|---|---|---|---|
| F | O | C | Te | Pa | F | O | C | Te | Pa | F | O | C | Te | Pa | F | O | C | Te | Pa | |
| θ | ** 0.004 | ** 0.003 | ** 0.03 | ** 0.01 | ||||||||||||||||
| α | ** 0.001 | ** 0.01 | ** 0.005 | ** 0.001 | ** 0.02 | ** 0.003 | ** 0.02 | |||||||||||||
| β | ** 0.01 | ** 0.02 | ** 0.01 | ** 0.03 | ** | ** 0.004 | ** 0.001 | ** 0.04 | ||||||||||||
| γ | ** 0.003 | ** 0.02 | ** 0.004 | ** 0.01 | ** 0.005 | |||||||||||||||
Publisher’s Note: MDPI stays neutral with regard to jurisdictional claims in published maps and institutional affiliations. |
© 2021 by the authors. Licensee MDPI, Basel, Switzerland. This article is an open access article distributed under the terms and conditions of the Creative Commons Attribution (CC BY) license (https://creativecommons.org/licenses/by/4.0/).
Share and Cite
Masood, N.; Farooq, H. Comparing Neural Correlates of Human Emotions across Multiple Stimulus Presentation Paradigms. Brain Sci. 2021, 11, 696. https://doi.org/10.3390/brainsci11060696
Masood N, Farooq H. Comparing Neural Correlates of Human Emotions across Multiple Stimulus Presentation Paradigms. Brain Sciences. 2021; 11(6):696. https://doi.org/10.3390/brainsci11060696
Chicago/Turabian StyleMasood, Naveen, and Humera Farooq. 2021. "Comparing Neural Correlates of Human Emotions across Multiple Stimulus Presentation Paradigms" Brain Sciences 11, no. 6: 696. https://doi.org/10.3390/brainsci11060696
APA StyleMasood, N., & Farooq, H. (2021). Comparing Neural Correlates of Human Emotions across Multiple Stimulus Presentation Paradigms. Brain Sciences, 11(6), 696. https://doi.org/10.3390/brainsci11060696