
Data Processing in Functional Near-Infrared Spectroscopy (fNIRS) Motor Control Research


Abstract
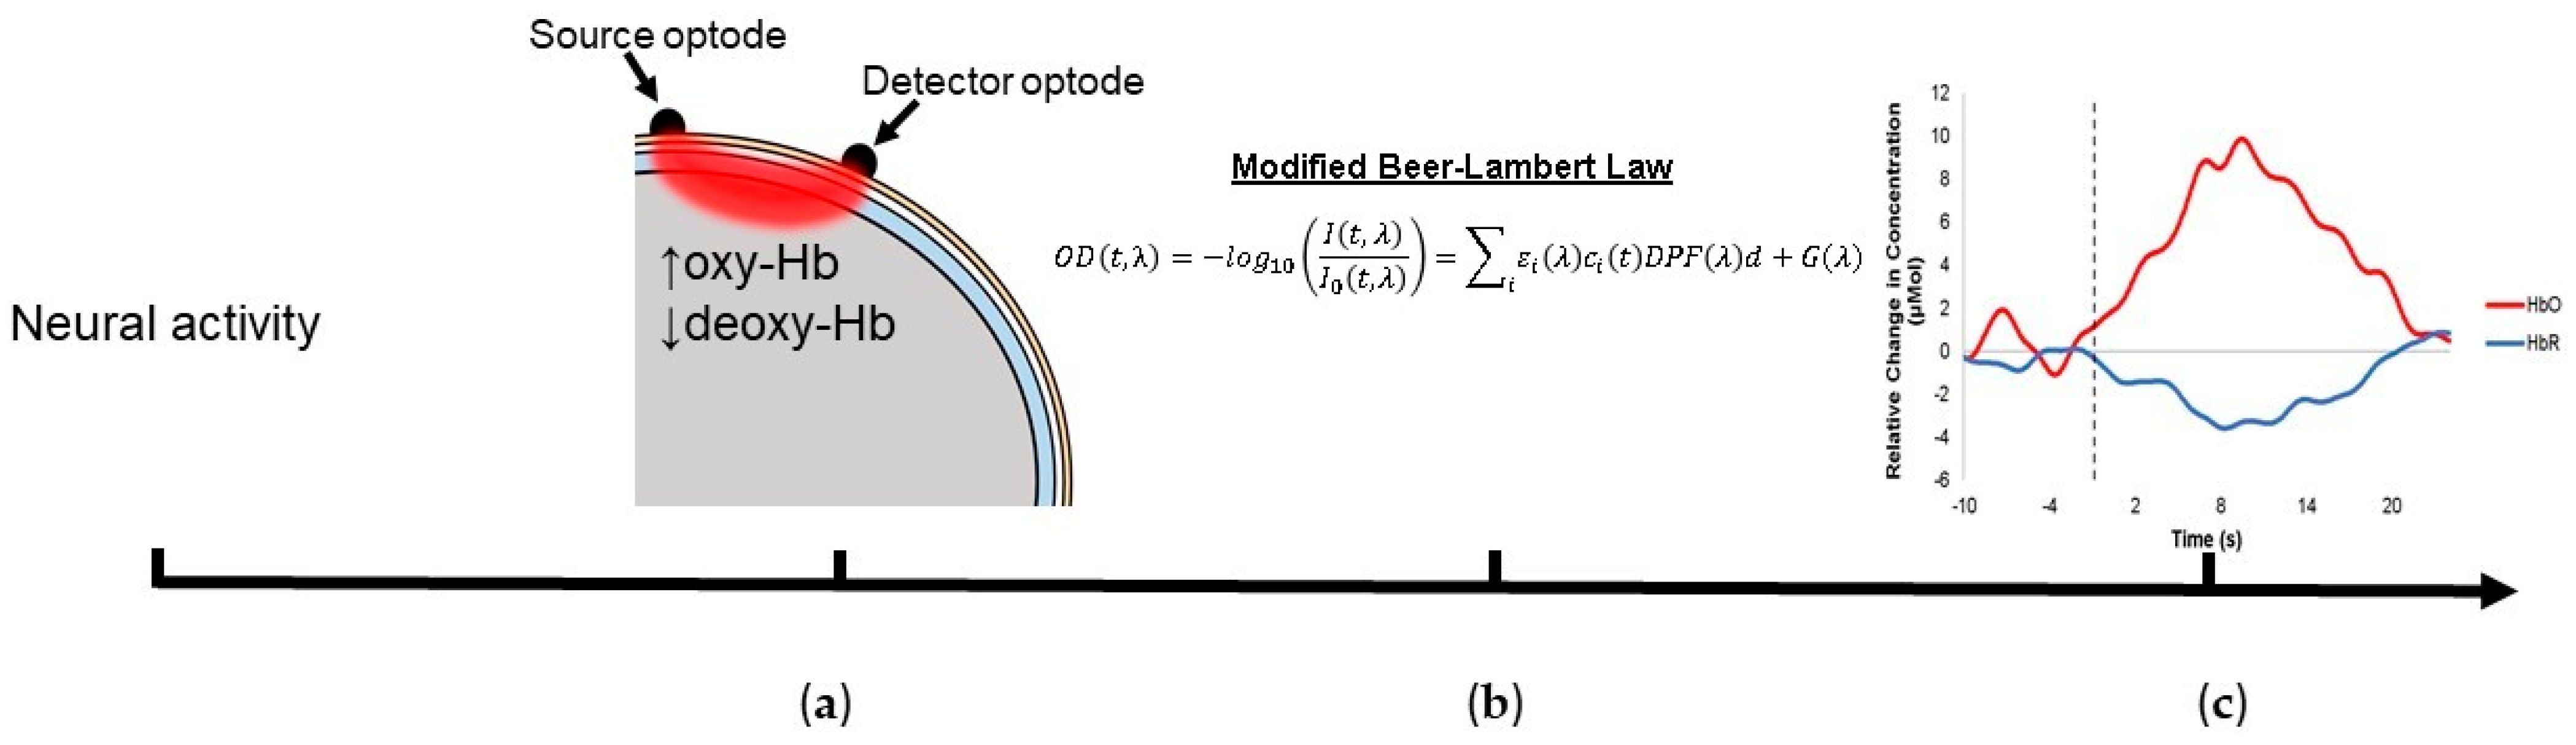
1. Introduction
2. Materials and Methods
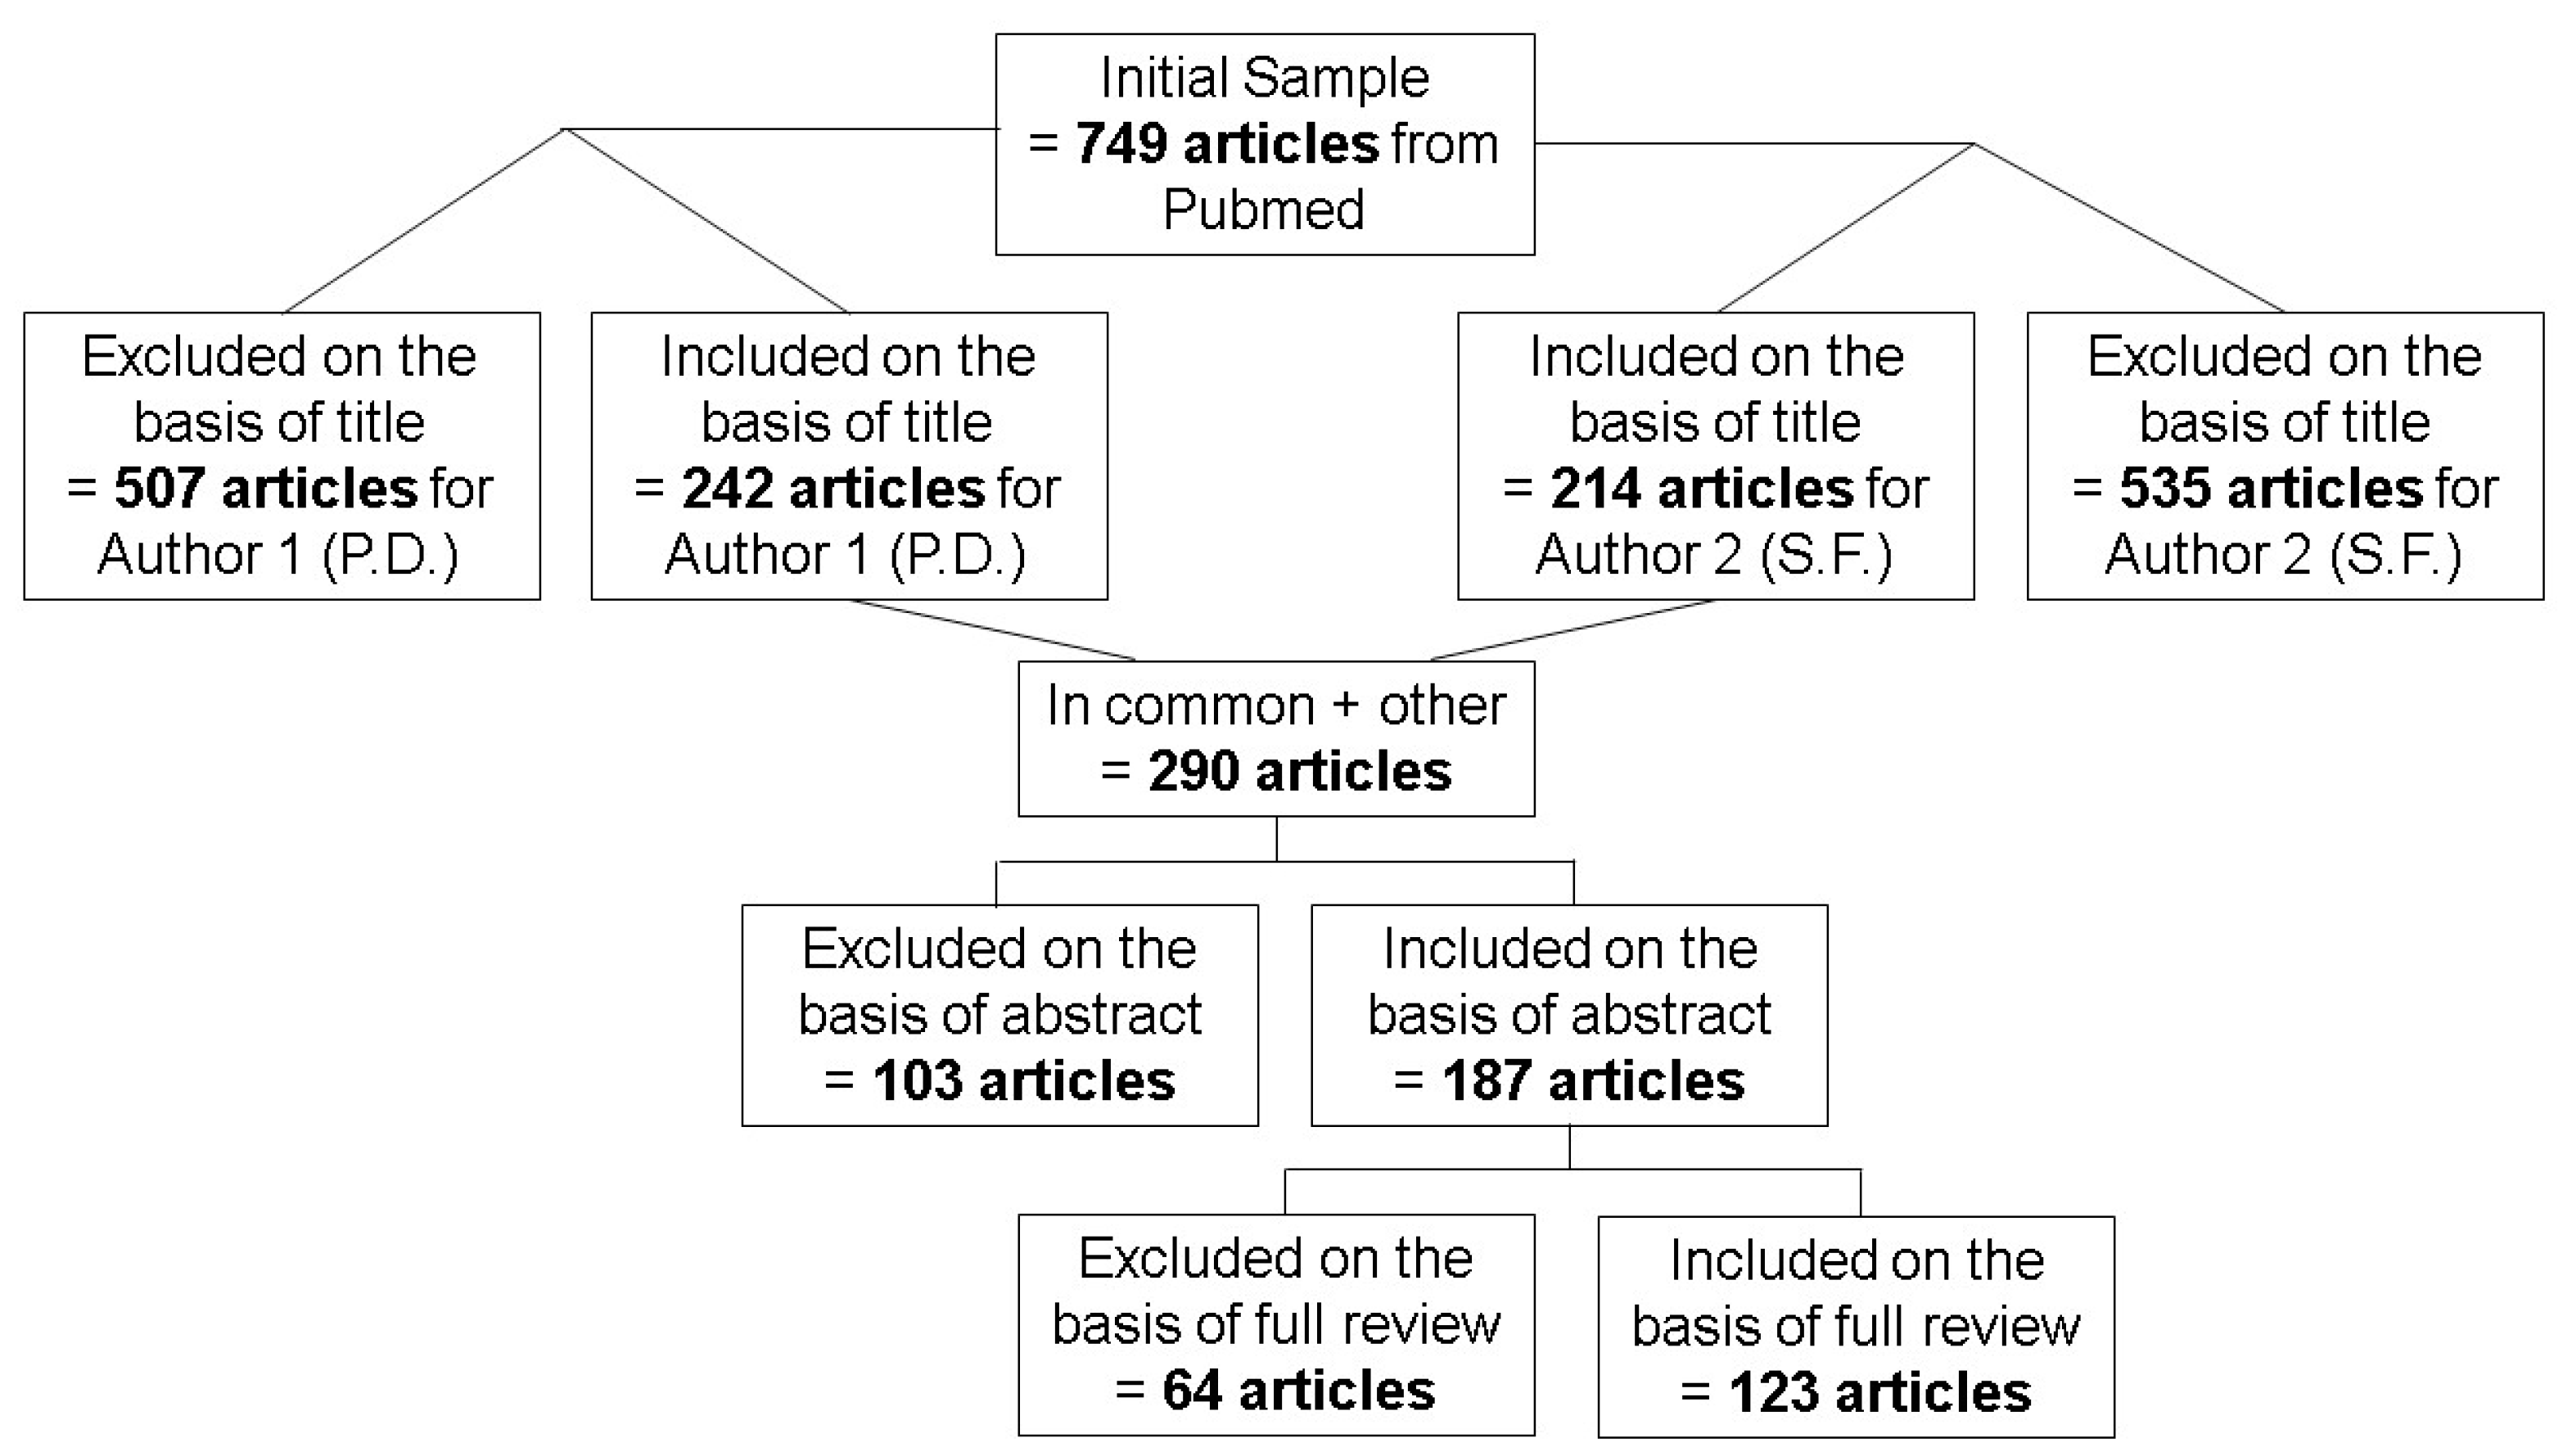
2.1. Literature Search Criteria and Data Extraction
2.2. Inclusion/Exclusion Criteria
3. Results
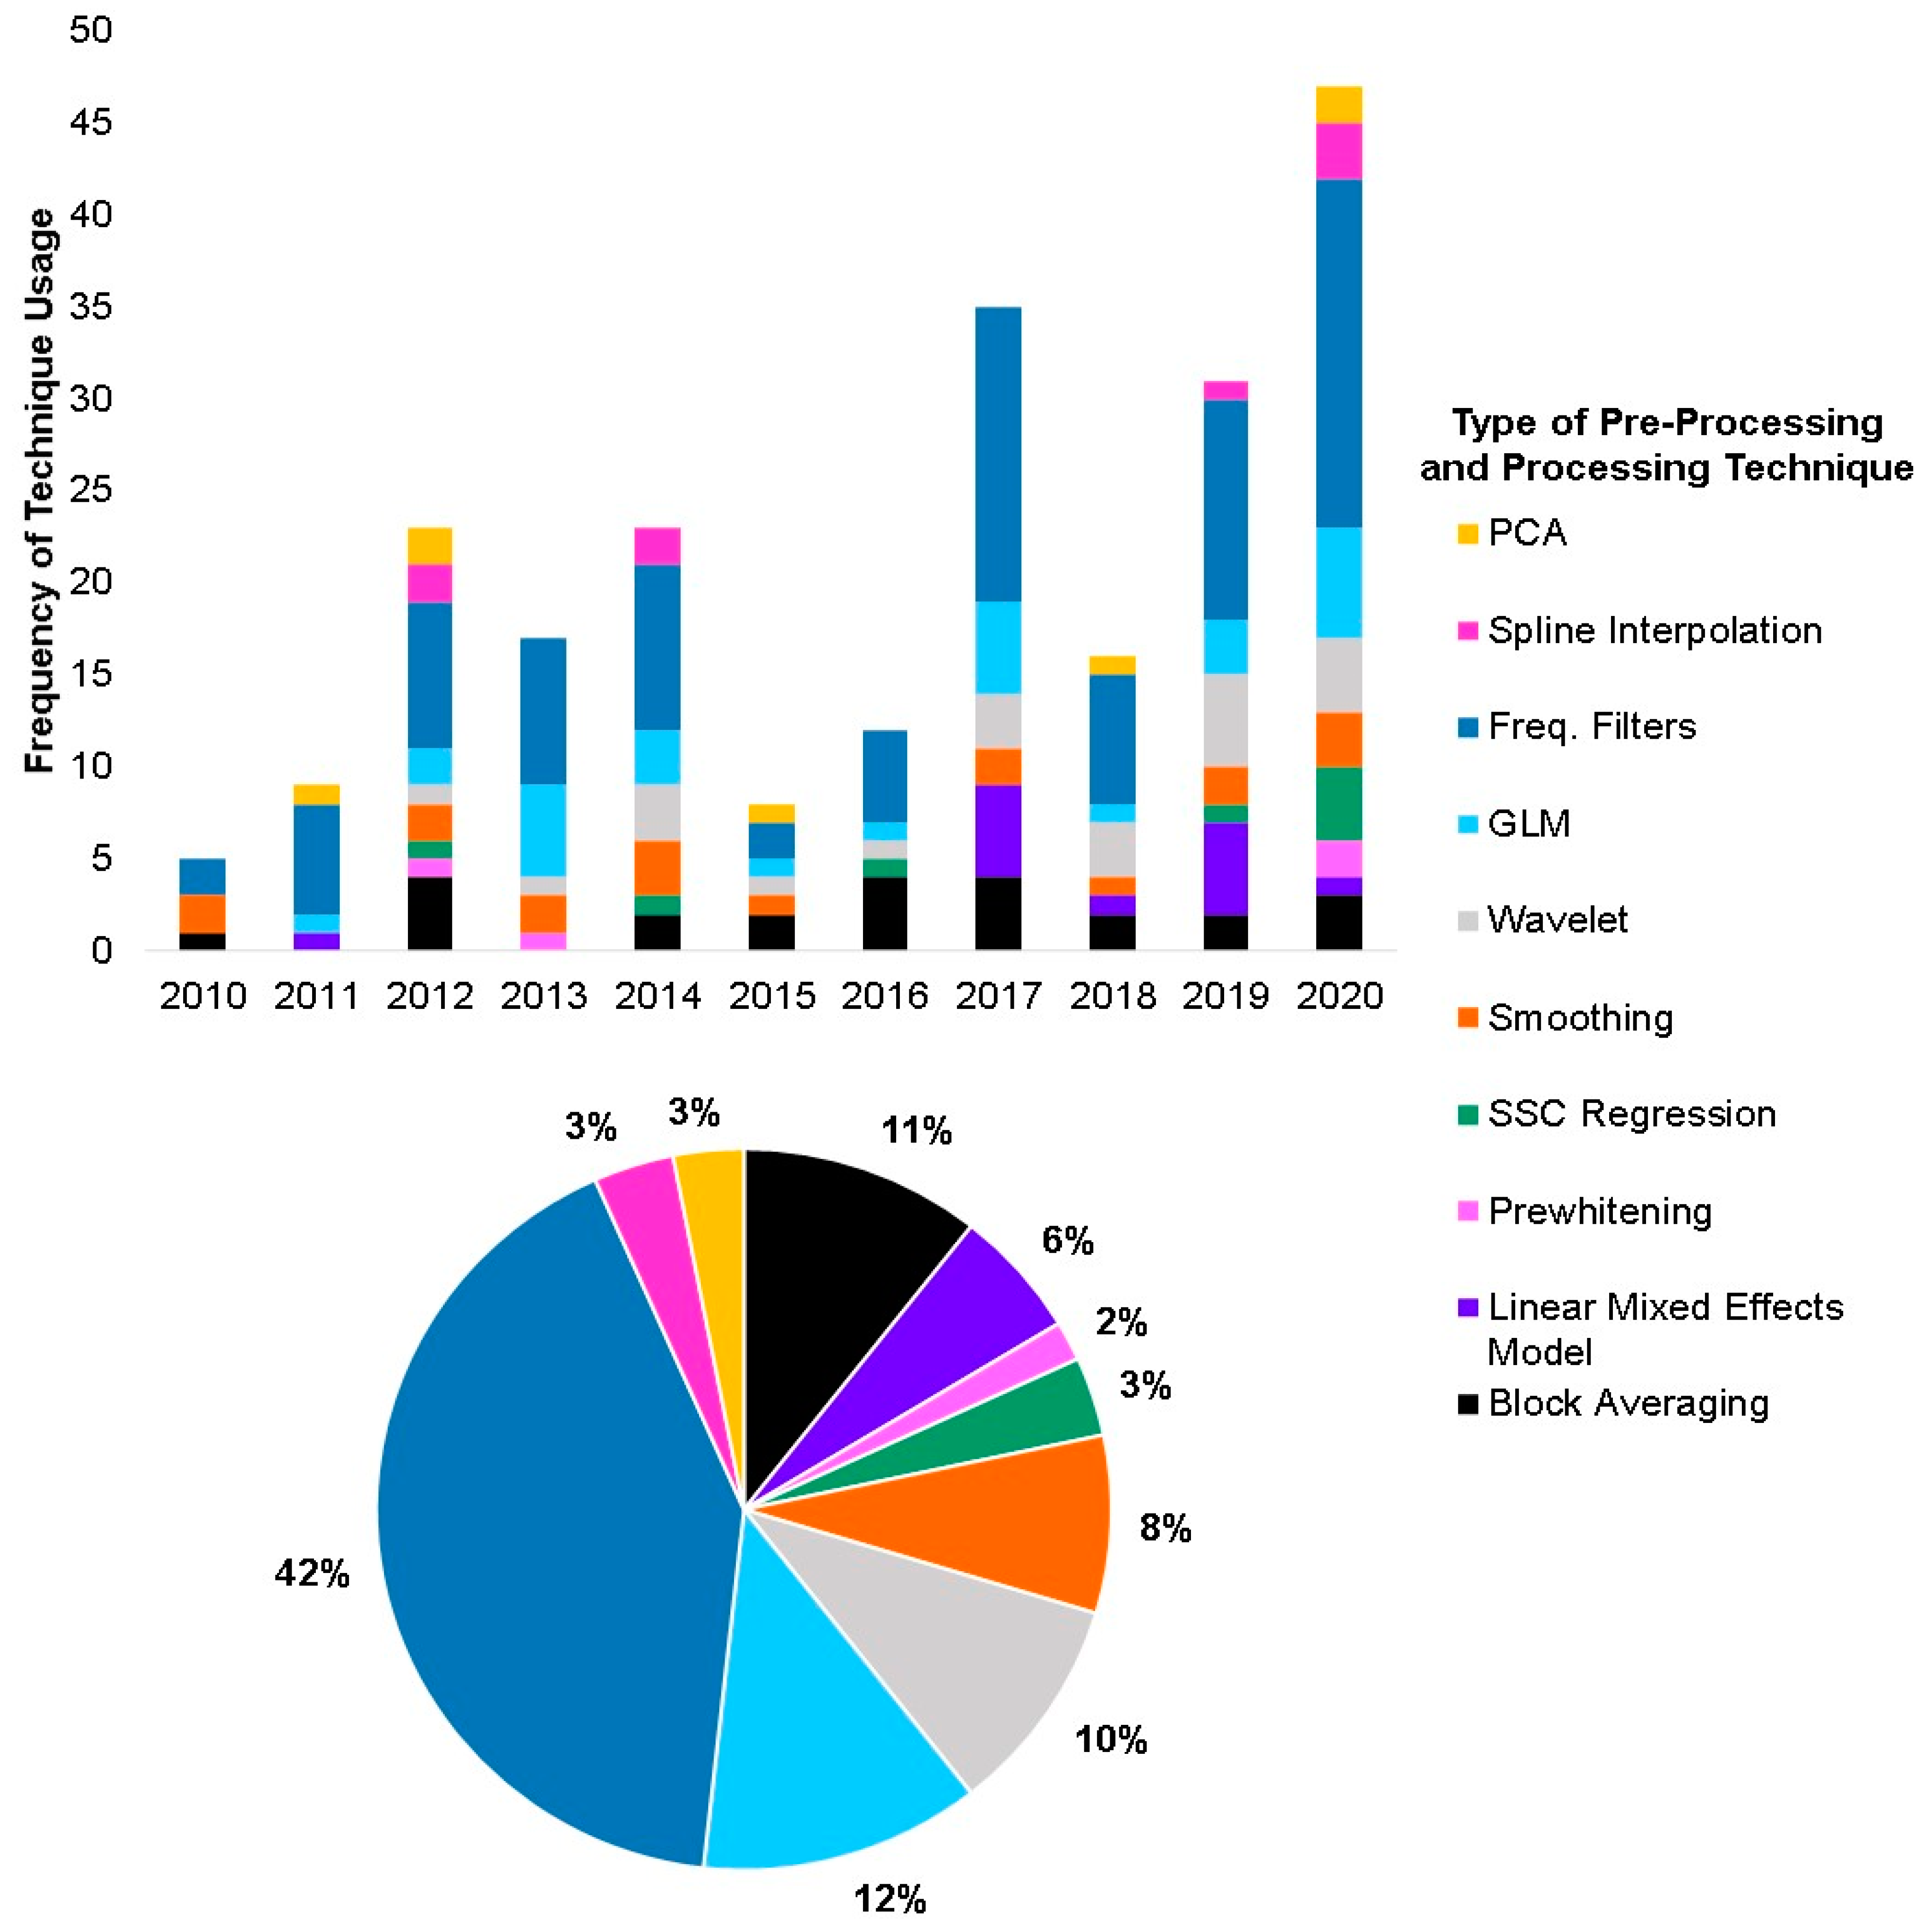
3.1. Stages of Data Pre-Processing and Processing
3.2. Pre-Processing Techniques
3.2.1. Systematic Noise Removal
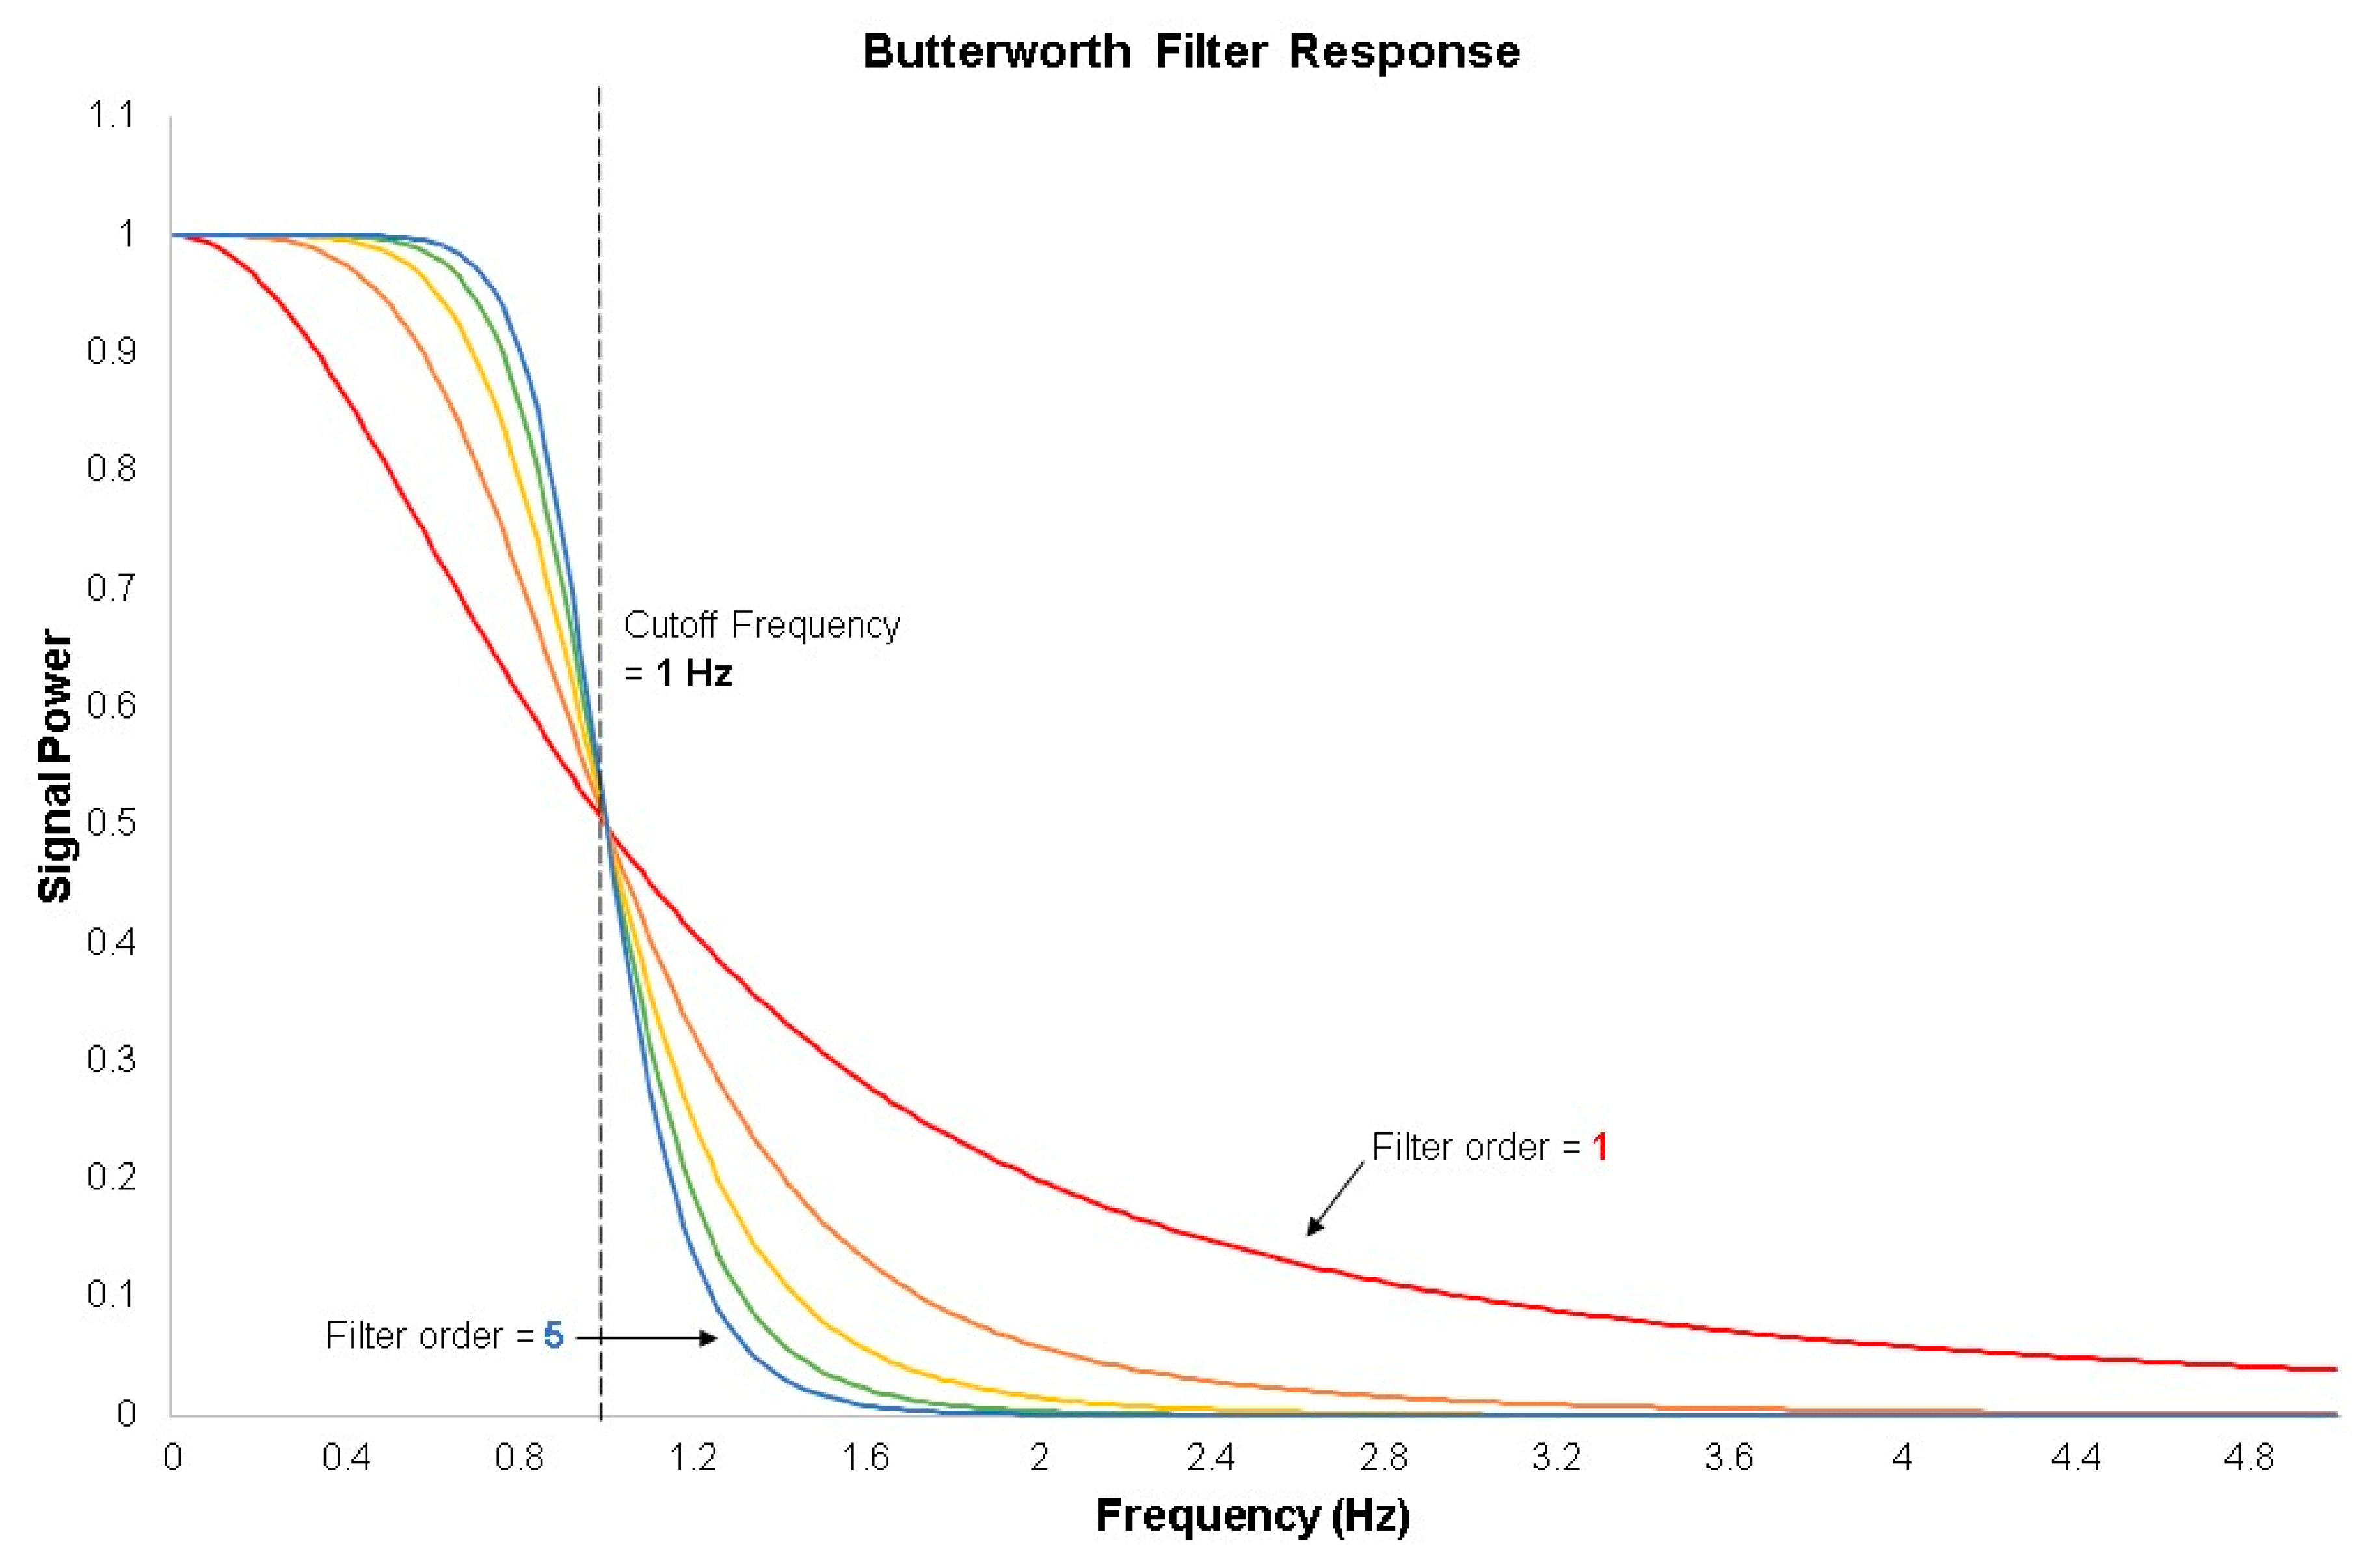
3.2.2. Low-Pass, High-Pass, and Bandpass Filters
3.2.3. Smoothing Filters
3.3. Additional Techniques to Remove Systematic Noise, Pre-Whitening
3.4. Motion Artefact Correction, Wavelet Filter
3.5. Alternatives for Motion Artefact Correction: Principal Component Analysis
3.6. Processing Techniques
3.6.1. General Linear Model
- Task responses are non-stochastic (non-random) and are the same across trials of the same task.
- Noise is independently and identically distributed, with a mean of zero and with some amount of variance around that point.
- Noise is homoscedastic, meaning there is noise from only one distribution in the data.
- Noise is not serially correlated, meaning that past noise does not affect future noise.
- Predictors are not linear derivations of each other.
3.6.2. Block Averaging
3.6.3. Linear Mixed Models
4. Discussion
5. Conclusions
Supplementary Materials
Author Contributions
Funding
Institutional Review Board Statement
Informed Consent Statement
Conflicts of Interest
References
- Irani, F.; Platek, S.M.; Bunce, S.; Ruocco, A.C.; Chute, D. Functional near Infrared Spectroscopy (FNIRS): An Emerging Neuroimaging Technology with Important Applications for the Study of Brain Disorders. Clin. Neuropsychol. 2007, 21, 9–37. [Google Scholar] [CrossRef] [PubMed]
- Attwell, D.; Laughlin, S.B. An Energy Budget for Signaling in the Grey Matter of the Brain. Br. J. Pharmacol. 2001, 21, 1133–1145. [Google Scholar] [CrossRef] [PubMed]
- Gratton, G.; Goodman-wood, M.R.; Fabiani, M. Comparison of Neuronal and Hemodynamic Measures of the Brain Response to Visual Stimulation : An Optical Imaging Study. Hum. Brain Mapp. 2001, 25, 13–25. [Google Scholar] [CrossRef]
- Gratton, G.; Maier, J.S.; Fabiani, M.; Mantulin, W.W.; Gratton, E. Feasibility of Intracranial Near-Infrared Optical Scanning; Cambridge University Press: Cambridge, MA, USA, 1994; pp. 211–215. [Google Scholar]
- Cope, M.; Delpy, D.T. System for Long-Term Measurement of Cerebral Blood and Tissue Oxygenation on Newborn Infants by near Infra-Red Transillumination. Med. Biol. Eng. Comput. 1988, 26, 289–294. [Google Scholar] [CrossRef]
- Cope, M. The Development of a near Infrared Spectroscopy System and Its Application for Non Invasive Monitory of Cerebral Blood and Tissue Oxygenation in the Newborn Infants. Ph.D. Thesis, University of London, London, UK, 1991. [Google Scholar]
- Scholkmann, F.; Kleiser, S.; Jaakko, A.; Zimmermann, R.; Mata, J.; Wolf, U.; Wolf, M. A Review on Continuous Wave Functional Near-Infrared Spectroscopy and Imaging Instrumentation and Methodology. Neuroimage 2014, 85, 6–27. [Google Scholar] [CrossRef] [PubMed]
- Delpy, D.T.; Cope, M.; Van Der Zee, P.; Arridge, S.; Wray, S.; Wyatt, J. Estimation of Optical Pathlength through Tissue from Direct Time of Flight Measurement. Phys. Med. Biol. 1988, 33, 1433–1442. [Google Scholar] [CrossRef]
- Boas, D.A.; Dale, A.M.; Franceschini, M.A. Diffuse Optical Imaging of Brain Activation : Approaches to Optimizing Image Sensitivity, Resolution, and Accuracy. Neuroimage 2004, 23, S275–S288. [Google Scholar] [CrossRef] [PubMed]
- Strangman, G.; Culver, J.P.; Thompson, J.H.; Boas, D.A. A Quantitative Comparison of Simultaneous BOLD FMRI and NIRS Recordings during Functional Brain Activation. Neuroimage 2002, 17, 719–731. [Google Scholar] [CrossRef]
- Huppert, T.J.; Hoge, R.D.; Diamond, S.G.; Franceschini, M.A.; Boas, D.A. A Temporal Comparison of BOLD, ASL, and NIRS Hemodynamic Responses to Motor Stimuli in Adult Humans. NeuroImage 2006, 29, 368–382. [Google Scholar] [CrossRef]
- Schroeter, M.L.; Kupka, T.; Mildner, T.; Von Cramon, D.Y. Investigating the Post-Stimulus Undershoot of the BOLD Signal—A Simultaneous FMRI and FNIRS Study. NeuroImage 2006, 30, 349–358. [Google Scholar] [CrossRef]
- Plichta, M.M.; Herrmann, M.J.; Baehne, C.G.; Ehlis, A.C.; Richter, M.M.; Pauli, P.; Fallgatter, A.J. Event-Related Functional near-Infrared Spectroscopy (FNIRS): Are the Measurements Reliable? Neuroimage 2006, 31, 116–124. [Google Scholar] [CrossRef] [PubMed]
- Plichta, M.M.; Herrmann, M.J.; Baehne, C.G.; Ehlis, A.C.; Richter, M.M.; Pauli, P.; Fallgatter, A.J. Event-Related Functional near-Infrared Spectroscopy (FNIRS) Based on Craniocerebral Correlations: Reproducibility of Activation? Hum. Brain Mapp. 2007, 28, 733–741. [Google Scholar] [CrossRef] [PubMed]
- Sato, H.; Kiguchi, M.; Maki, A.; Fuchino, Y.; Obata, A.; Yoro, T.; Koizumi, H. Within-Subject Reproducibility of near-Infrared Spectroscopy Signals in Sensorimotor Activation after 6 Months. J. Biomed. Opt. 2006, 11, 014021. [Google Scholar] [CrossRef] [PubMed]
- Strangman, G.; Franceschini, M.A.; Boas, D.A. Factors Affecting the Accuracy of Near-Infrared Spectroscopy Concentration Calculations for Focal Changes in Oxygenation Parameters. Neuroimage 2003, 18, 865–879. [Google Scholar] [CrossRef]
- Strangman, G.; Goldstein, R.; Rauch, S.L.; Stein, J. Near-Infrared Spectroscopy and Imaging for Investigating Stroke Rehabilitation: Test-Retest Reliability and Review of the Literature. Arch. Phys. Med. Rehabil. 2006, 87, 12–19. [Google Scholar] [CrossRef]
- Leff, D.R.; Orihuela-Espina, F.; Elwell, C.E.; Athanasiou, T.; Delpy, D.T.; Darzi, A.W.; Yang, G.Z. Assessment of the Cerebral Cortex during Motor Task Behaviours in Adults: A Systematic Review of Functional near Infrared Spectroscopy (FNIRS) Studies. Neuroimage 2011, 54, 2922–2936. [Google Scholar] [CrossRef] [PubMed]
- Elwell, C.E.; Springett, R.; Hillmann, E.; Delpy, D.T. Oscillations in Cerebral Haemodynamics. In Oxygen Transport to Tissue XXI; Springer: Boston, MA, USA, 1999; pp. 57–65. [Google Scholar]
- Saager, R.B.; Berger, A. Measurement of Layer-like Hemodynamic Trends in Scalp and Cortex : Implications for Physiological Baseline Suppression in Functional near-Infrared Spectroscopy. J. Biomed. Opt. 2008, 13, 1–10. [Google Scholar] [CrossRef]
- Gregg, N.M.; White, B.R.; Zeff, B.W.; Berger, A.J.; Joseph, P. Brain Specificity of Diffuse Optical Imaging : Improvements from Superficial Signal Regression and Tomography. Front. Neuroenergetics 2010, 2, 1–8. [Google Scholar] [CrossRef]
- Cooper, R.J.; Selb, J.; Gagnon, L.; Phillip, D.; Schytz, H.W.; Iversen, H.K.; Ashina, M.; Boas, D.A. A Systematic Comparison of Motion Artifact Correction Techniques for Functional Near-Infrared Spectroscopy. Front. Neurosci. 2012, 6, 1–10. [Google Scholar] [CrossRef]
- Brigadoi, S.; Ceccherini, L.; Cutini, S.; Scarpa, F.; Scatturin, P.; Selb, J.; Gagnon, L.; Boas, D.A.; Cooper, R.J. NeuroImage Motion Artifacts in Functional Near-Infrared Spectroscopy : A Comparison of Motion Correction Techniques Applied to Real Cognitive Data. Neuroimage 2014, 85, 181–191. [Google Scholar] [CrossRef] [PubMed]
- Huppert, T.J. Commentary on the Statistical Properties of Noise and Its Implication on General Linear Models in Functional Near-Infrared Spectroscopy near-Infrared Spectroscopy. Neurophotonics 2016, 3, 010401. [Google Scholar] [CrossRef] [PubMed]
- Kaiser, V.; Bauernfeind, G.; Kreilinger, A.; Kaufmann, T.; Kübler, A.; Neuper, C.; Müller-Putz, G.R. Cortical Effects of User Training in a Motor Imagery Based Brain-Computer Interface Measured by FNIRS and EEG. Neuroimage 2014, 85, 432–444. [Google Scholar] [CrossRef] [PubMed]
- Yucel, M.A.; Selb, J.; Cooper, R.J.; Boas, D.A. Targeted Principle Component Analysis : A New Motion Artifact Correction Approach for near-Infrared Spectroscopy. J. Innov. Opt. Health Sci. 2014, 7, 1–8. [Google Scholar] [CrossRef]
- Hofmann, M.J.; Herrmann, M.J.; Dan, I.; Obrig, H.; Conrad, M.; Kuchinke, L.; Jacobs, A.M.; Fallgatter, A.J. Differential Activation of Frontal and Parietal Regions during Visual Word Recognition: An Optical Topography Study. Neuroimage 2008, 40, 1340–1349. [Google Scholar] [CrossRef][Green Version]
- Winter, D.A. Biomechanics and Motor Control of Human Movement, 4th ed.; John Wiley and Sons, Inc.: Hoboken, NJ, USA, 2009. [Google Scholar]
- Pinti, P.; Scholkmann, F.; Hamilton, A.; Burgess, P.; Tachtsidis, I. Current Status and Issues Regarding Pre-Processing of FNIRS Neuroimaging Data: An Investigation of Diverse Signal Filtering Methods Within a General Linear Model Framework. Front. Hum. Neurosci. 2019, 12, 1–21. [Google Scholar] [CrossRef]
- Ifeachor, E.C.; Jervis, B.W. Digital Signal Processing: A Practical Approach; Pearson Education: New York, NY, USA, 2002. [Google Scholar]
- Naseer, N.; Hong, K.S. FNIRS-Based Brain-Computer Interfaces: A Review. Front. Hum. Neurosci. 2015, 9, 3. [Google Scholar] [CrossRef] [PubMed]
- Barak, O.F.; Ovcin, Z.B.; Jakovljevic, D.G.; Lozanov-Crvenkovic, Z.; Brodie, D.A.; Grujic, N.G. Heart Rate Recovery after Submaximal Exercise in Four Different Recovery Protocols in Male Athletes and Non-Athletes. J. Sport. Sci. Med. 2011, 10, 369–375. [Google Scholar]
- Turner, J.R.; Carroll, D. Heart Rate and Oxygen Consumption during Mental Arithmetic, a Video Game, and Graded Exercise: Further Evidence of Metabolically-exaggerated Cardiac Adjustments? Psychophysiology 1985, 22, 261–267. [Google Scholar] [CrossRef] [PubMed]
- Huppert, T.J.; Diamond, S.G.; Franceschini, M.A.; Boas, D.A. HomER : A Review of Time-Series Analysis Methods for near-Infrared Spectroscopy of the Brain. Appl. Opt. 2009, 48, D280–D298. [Google Scholar] [CrossRef] [PubMed]
- Duan, L.; Zhao, Z.; Lin, Y.; Wu, X.; Luo, Y.; Xu, P. Wavelet-Based Method for Removing Global Physiological Noise in Functional near-Infrared Spectroscopy. Biomed. Opt. Express 2018, 9, 3805–3820. [Google Scholar] [CrossRef]
- Ferrari, M.; Quaresima, V. A Brief Review on the History of Human Functional Near-Infrared Spectroscopy (FNIRS) Development and Fields of Application. NeuroImage 2012, 63, 921–935. [Google Scholar] [CrossRef]
- Kawala-sterniuk, A.; Podpora, M.; Pelc, M.; Blaszczyszyn, M.; Gorzelanczyk, E.J.; Martinek, R.; Ozana, S. Comparison of Smoothing Filters in Analysis of EEG Data for the Medical Diagnostics Purposes. Sensors 2020, 20, 807. [Google Scholar] [CrossRef] [PubMed]
- Amemiya, K.; Ishizu, T.; Ayabe, T.; Kojima, S. Effects of Motor Imagery on Intermanual Transfer: A near-Infrared Spectroscopy and Behavioural Study. Brain Res. 2010, 1343, 93–103. [Google Scholar] [CrossRef] [PubMed]
- Button, C.; Croft, J.L.; Cotter, J.D.; Graham, M.J.; Lucas, S.J.E. Integrative Physiological and Behavioural Responses to Sudden Cold-Water Immersion Are Similar in Skilled and Less-Skilled Swimmers. Physiol. Behav. 2015, 138, 254–259. [Google Scholar] [CrossRef] [PubMed]
- Groff, B.R.; Antonellis, P.; Schmid, K.K.; Knarr, B.A.; Stergiou, N. Stride-Time Variability Is Related to Sensorimotor Cortical Activation during Forward and Backward Walking. Neurosci. Lett. 2019, 692, 150–158. [Google Scholar] [CrossRef] [PubMed]
- Chacaroun, S.; Vega-Escamilla y Gonzalez, I.; Flore, P.; Doutreleau, S.; Verges, S. Physiological Responses to Hypoxic Constant-Load and High-Intensity Interval Exercise Sessions in Healthy Subjects. Eur. J. Appl. Physiol. 2019, 119, 123–134. [Google Scholar] [CrossRef]
- Funane, T.; Atsumori, H.; Katura, T.; Obata, A.N.; Sato, H.; Tanikawa, Y.; Okada, E.; Kiguchi, M. Quantitative Evaluation of Deep and Shallow Tissue Layers’ Contribution to FNIRS Signal Using Multi-Distance Optodes and Independent Component Analysis. Neuroimage 2014, 85, 150–165. [Google Scholar] [CrossRef]
- Kim, H.Y.; Kim, E.J.; You, J.H. Adaptive Locomotor Network Activation during Randomized Walking Speeds Using Functional Near-Infrared Spectroscopy. Technol. Health Care 2017, 25, S93–S98. [Google Scholar] [CrossRef]
- Holper, L.; Wolf, M. Motor Imagery in Response to Fake Feedback Measured by Functional Near-Infrared Spectroscopy. Neuroimage 2010, 50, 190–197. [Google Scholar] [CrossRef]
- Shin, J.; Jeong, J. Multiclass Classification of Hemodynamic Responses for Performance Improvement of Functional Near-Infrared Spectroscopy-Based Brain–Computer Interface. J. Biomed. Opt. 2014, 19, 067009. [Google Scholar] [CrossRef] [PubMed]
- Wriessnegger, S.C.; Bauernfeind, G.; Kurz, E.M.; Raggam, P.; Müller-Putz, G.R. Imagine Squeezing a Cactus: Cortical Activation during Affective Motor Imagery Measured by Functional near-Infrared Spectroscopy. Brain Cogn. 2018, 126, 13–22. [Google Scholar] [CrossRef]
- Mivule, K.; Turner, C. Applying Moving Average Filtering for Non-Interactive Differential Privacy Settings. Procedia Comput. Sci. 2014, 36, 409–415. [Google Scholar] [CrossRef][Green Version]
- Ye, J.C.; Tak, S.; Jang, K.E.; Jung, J.; Jang, J. NeuroImage NIRS-SPM : Statistical Parametric Mapping for near-Infrared Spectroscopy. Neuroimage 2009, 44, 428–447. [Google Scholar] [CrossRef] [PubMed]
- Khan, R.A.; Naseer, N.; Qureshi, N.K.; Noori, F.M.; Nazeer, H.; Khan, M.U. FNIRS-Based Neurorobotic Interface for Gait Rehabilitation. J. Neuroeng. Rehabil. 2018, 15, 1–17. [Google Scholar] [CrossRef] [PubMed]
- Savitzky, A.; Golay, M.J.E. Smoothing and Differentiation of Data by Simplified Least Squares Procedures. Anal. Chem. 1964, 36, 1627–1639. [Google Scholar] [CrossRef]
- Rahman, M.A.; Rashid, M.A.; Ahmad, M. Selecting the Optimal Conditions of Savitzky–Golay Filter for FNIRS Signal. Biocybern. Biomed. Eng. 2019, 39, 624–637. [Google Scholar] [CrossRef]
- Nguyen, H.T.; Ngo, C.Q.; Truong, Q.D.K.; Vo, V.T. Temporal Hemodynamic Classification of Two Hands Tapping Using Functional Near-Infrared Spectroscopy. Front. Hum. Neurosci. 2013, 7, 1–12. [Google Scholar]
- Jahani, S.; Setarehdan, S.K.; Boas, D.A.; Yücel, M.A. Motion Artifact Detection and Correction in Functional Near-Infrared Spectroscopy: A New Hybrid Method Based on Spline Interpolation Method and Savitzky–Golay Filtering. Neurophotonics 2018, 5, 015003. [Google Scholar] [CrossRef]
- Bullmore, E.; Brammer, M.; Williams, S.C.R.; Rabe-Hesketh, S.; Janot, N.; David, A.; Mellers, J.; Howard, R.; Sham, P. Statistical Methods of Estimation and Inference for Functional MR Image Analysis. Magn. Reson. Med. 1996, 35, 261–277. [Google Scholar] [CrossRef]
- Barker, J.W.; Aarabi, A.; Huppert, T.J. Autoregressive Model Based Algorithm for Correcting Motion and Serially Correlated Errors in FNIRS. Biomed. Opt. Express 2013, 4, 1186–1192. [Google Scholar] [CrossRef]
- Friston, K.J.; Josephs, O.; Zarahn, E.; Holmes, A.P.; Rouquette, S.; Poline, J.B. To Smooth or Not to Smooth? Bias and Efficiency in FMRI Time-Series Analysis. Neuroimage 2000, 12, 196–208. [Google Scholar] [CrossRef] [PubMed]
- Tak, S.; Ye, J.C. Statistical Analysis of FNIRS Data: A Comprehensive Review. Neuroimage 2014, 85, 72–91. [Google Scholar] [CrossRef] [PubMed]
- Robertson, F.C.; Douglas, T.S.; Meintjes, E.M. Motion Artifact Removal for Functional near Infrared Spectroscopy: A Comparison of Methods. IEEE Trans. Biomed. Eng. 2010, 57, 1377–1387. [Google Scholar] [CrossRef] [PubMed]
- Vitorio, R.; Stuart, S.; Rocherster, L.; Alcock, L.; Pantall, A. fNIRS responses during walking - Artefact or cortical activity? A systematic review. Neurosci. Biobehav. Rev. 2017, 83, 160–172. [Google Scholar] [CrossRef]
- Molavi, B.; Dumont, G.A. Wavelet-Based Motion Artifact Removal for Functional near-Infrared Spectroscopy Wavelet-Based Motion Artifact Removal for Functional near-Infrared Spectroscopy. Physiol. Meas. 2012, 33, 259. [Google Scholar] [CrossRef]
- Gurley, K.; Kareem, A. Applications of Wavelet Transforms in Earthquake, Wind and Ocean Engineering. Eng. Struct. 1999, 21, 149–167. [Google Scholar]
- Sato, H.; Tanaka, N.; Uchida, M.; Hirabayashi, Y.; Kanai, M.; Ashida, T.; Konishi, I.; Maki, A. Wavelet Analysis for Detecting Body-Movement Artifacts in Optical Topography Signals. Neuroimage 2006, 33, 580–587. [Google Scholar] [CrossRef]
- Jang, K.E.; Tak, S.; Jung, J.; Jang, J.; Jeong, Y. Wavelet Minimum Description Length Detrending for Near-Infrared Spectroscopy. J. Biomed. Opt. 2009, 14, 1–13. [Google Scholar] [CrossRef]
- Daubechies, I. Orthonormal Bases of Compactly Supported Wavelets. Commun. Pure Appl. Math. 1988, 41, 909–996. [Google Scholar] [CrossRef]
- Aslin, R.N.; Mehler, J. Near-Infrared Spectroscopy for Functional Studies of Brain Activity in Human Infants: Promise, Prospects, and Challenges. J. Biomed. Opt. 2005, 10, 011009. [Google Scholar] [CrossRef]
- Zhang, Y.; Brooks, D.H.; Franceschini, M.A.; Boas, D.A. Eigenvector-Based Spatial Filtering for Reduction of Physiological Interference in Diffuse Optical Imaging. J. Biomed. Opt. 2005, 10, 011014. [Google Scholar] [CrossRef] [PubMed]
- Monti, M.M.; Simpson, S.L.; Forest, W. Statistical Analysis of FMRI Time-Series : A Critical Review of the GLM Approach. Front. Hum. Neurosci. 2011, 5, 1–13. [Google Scholar] [CrossRef] [PubMed]
- de Lima-Pardini, A.C.; Zimeo Morais, G.A.; Balardin, J.B.; Coelho, D.B.; Azzi, N.M.; Teixeira, L.A.; Sato, J.R. Measuring Cortical Motor Hemodynamics during Assisted Stepping–An FNIRS Feasibility Study of Using a Walker. Gait Posture 2017, 56, 112–118. [Google Scholar] [CrossRef]
- Dresler, M.; Koch, S.P.; Wehrle, R.; Spoormaker, V.I.; Holsboer, F.; Steiger, A.; Sämann, P.G.; Obrig, H.; Czisch, M. Dreamed Movement Elicits Activation in the Sensorimotor Cortex. Curr. Biol. 2011, 21, 1833–1837. [Google Scholar] [CrossRef]
- Jang, S.H.; Jang, W.H.; Chang, P.H.; Lee, S.H.; Jin, S.H.; Kim, Y.G.; Yeo, S.S. Cortical Activation Change Induced by Neuromuscular Electrical Stimulation during Hand Movements: A Functional NIRS Study. J. Neuroeng. Rehabil. 2014, 11, 1–7. [Google Scholar] [CrossRef]
- Moro, S.B.; Carrieri, M.; Avola, D.; Brigadoi, S.; Lancia, S.; Petracca, A.; Spezialetti, M.; Ferrari, M.; Placidi, G.; Quaresima, V. A Novel Semi-Immersive Virtual Reality Visuo-Motor Task Activates Ventrolateral Prefrontal Cortex: A Functional near-Infrared Spectroscopy Study. J. Neural Eng. 2016, 13, 036002. [Google Scholar] [CrossRef]
- Hoshi, Y. Functional Near-Infrared Spectroscopy : Current Status and Future Prospects. J. Biomed. Opt. 2007, 12, 062106. [Google Scholar] [CrossRef]
- Kamran, M.A.; Mannann, M.M.N.; Jeong, M.Y. Differential Path-Length Factor’s Effect on the Characterization of Brain’s Hemodynamic Response Function: A Functional near-Infrared Study. Front. Neuroinform. 2018, 12, 1–15. [Google Scholar] [CrossRef]
- Duncan, A.; Meek, J.H.; Clemence, M.; Elwell, C.E.; Fallon, P.; Tyszczuk, L.; Delpy, D.T. Measurement of Cranial Optical Path Length as a Function of Age Using Phase Resolved near Infrared Spectroscopy. Pediatric Res. 1996, 39, 889–894. [Google Scholar] [CrossRef] [PubMed]
- Zhao, H.; Tanikawa, Y.; Gao, F.; Onodera, Y.; Sassaroli, A.; Tanaka, K.; Yamada, Y. Maps of Optical Differential Pathlength Factor of Human Adult Forehead, Somatosensory Motor and Occipital Regions at Multi-Wavelengths in NIR. Phys. Med. Biol. 2002, 47, 2075–2093. [Google Scholar] [CrossRef] [PubMed]
- von Lühmann, A.; Ortega-Martinez, A.; Boas, D.A.; Yücel, M.A. Using the General Linear Model to Improve Performance in FNIRS Single Trial Analysis and Classification: A Perspective. Front. Hum. Neurosci. 2020, 14, 1–17. [Google Scholar] [CrossRef] [PubMed]
- Barker, J.W.; Rosso, A.L.; Sparto, P.J.; Huppert, T.J.; Barker, J.W.; Rosso, A.L.; Sparto, P.J.; Huppert, T.J. Correction of Motion Artifacts and Serial Correlations for Real-Time Functional near-Infrared Spectroscopy. Neurophotonics 2016, 3, 031410. [Google Scholar] [CrossRef]
- Dale, A.M.; Buckner, R.L. Selective Averaging of Individual Trials Using FMRI. Neuroimage 1997, 5, 329–340. [Google Scholar]
- Pfeifer, M.D.; Scholkmann, F.; Labruyère, R. Signal Processing in Functional Near-Infrared Spectroscopy (FNIRS): Methodological Differences Lead to Different Statistical Results. Front. Hum. Neurosci. 2018, 11, 1–12. [Google Scholar] [CrossRef] [PubMed]
- von Lühmann, A.; Li, X.; Müller, K.R.; Boas, D.A.; Yücel, M.A. Improved Physiological Noise Regression in FNIRS: A Multimodal Extension of the General Linear Model Using Temporally Embedded Canonical Correlation Analysis. Neuroimage 2020, 208, 116472. [Google Scholar] [CrossRef]
- Diamond, S.G.; Huppert, T.J.; Kolehmainen, V.; Franceschini, M.A.; Kaipio, J.P.; Arridge, S.R.; Boas, D.A. Dynamic Physiological Modeling for Functional Diffuse Optical Tomography. Neuroimage 2006, 30, 88–101. [Google Scholar] [CrossRef] [PubMed]
- Kirilina, E.; Yu, N.; Jelzow, A.; Wabnitz, H.; Jacobs, A.M.; Tachtsidis, L. Identifying and Quantifying Main Components of Physiological Noise in Functional near Infrared Spectroscopy on the Prefrontal Cortex. Front. Hum. Neurosci. 2013, 7, 1–17. [Google Scholar]
- Yücel, M.A.; Lühmann, A.; Scholkmann, F.; Gervain, J.; Dan, I.; Ayaz, H.; Boas, D.; Cooper, R.J.; Culver, J.; Elwell, C.E.; et al. Best Practices for FNIRS Publications. Neurophotonics 2021, 8, 1–34. [Google Scholar]
- McKendrick, R.; Ayaz, H.; Olmstead, R.; Parasuraman, R. Enhancing Dual-Task Performance with Verbal and Spatial Working Memory Training: Continuous Monitoring of Cerebral Hemodynamics with NIRS. Neuroimage 2014, 85, 1014–1026. [Google Scholar] [CrossRef]
- Saager, R.B.; Berger, A.J. Direct Characterization and Removal of Interfering Absorption Trends in Two-Layer Turbid Media. JOSA A 2005, 22, 1874–1882. [Google Scholar] [CrossRef] [PubMed]
- Yamada, T.; Umeyama, S.; Matsuda, K. Multidistance Probe Arrangement to Eliminate Artifacts in Functional Near-Infrared Spectroscopy. J. Biomed. Opt. 2009, 14, 064034. [Google Scholar] [CrossRef]
- Gagnon, L.; Yucel, M.A.; Dehaes, M.; Cooper, R.J.; Perdue, K.L.; Selb, J.; Huppert, T.J.; Hoge, R.D.; Boas, D.A. Quantification of the Cortical Contribution to the NIRS Signal over the Motor Cortex Using Concurrent NIRS-FMRI Measurements. Neuroimage 2012, 59, 3933–3940. [Google Scholar] [CrossRef] [PubMed]
- Almulla, L.; Al-Naib, I.; Althobaiti, M. Hemodynamic Responses during Standing and Sitting Activities: A Study toward FNIRS-BCI. Biomed. Phys. Eng. Express 2020, 6, 055005. [Google Scholar] [CrossRef]
- Anwar, A.R.; Muthalib, M.; Perrey, S.; Galka, A.; Granert, O.; Wolff, S.; Heute, U.; Deuschl, G.; Raethjen, J.; Muthuraman, M. Effective Connectivity of Cortical Sensorimotor Networks During Finger Movement Tasks: A Simultaneous FNIRS, FMRI, EEG Study. Brain Topogr. 2016, 29, 645–660. [Google Scholar] [CrossRef]
- Anwar, A.R.; Muthalib, M.; Perrey, S.; Galka, A.; Granert, O.; Wolff, S.; Deuschl, G.; Raethjen, J.; Heute, U.; Muthuraman, M. Comparison of Causality Analysis on Simultaneously Measured FMRI and NIRS Signals during Motor Tasks. In Proceedings of the 2013 35th Annual International Conference of the IEEE Engineering in Medicine and Biology Society (EMBC), Osaka, Japan, 3–7 July 2013; pp. 2628–2631. [Google Scholar]
- Asahara, R.; Endo, K.; Liang, N.; Matsukawa, K. An Increase in Prefrontal Oxygenation at the Start of Voluntary Cycling Exercise Was Observed Independently of Exercise Effort and Muscle Mass. Eur. J. Appl. Physiol. 2018, 118, 1689–1702. [Google Scholar] [CrossRef]
- Asahara, R.; Matsukawa, K. Decreased Prefrontal Oxygenation Elicited by Stimulation of Limb Mechanosensitive Afferents during Cycling Exercise. Am. J. Physiol. Regul. Integr. Comp. Physiol. 2018, 315, R230–R240. [Google Scholar] [CrossRef]
- Aumen, A.M.; Oberg, K.J.; Mingils, S.M.; Berkner, C.B.; Tracy, B.L.; Stephens, J.A. Revised and Neuroimaging-Compatible Versions of the Dual Task Screen. J. Vis. Exp. 2020, 2020, 1–18. [Google Scholar] [CrossRef] [PubMed]
- Bai, Z.; Fong, K.N.K.; Zhang, J.; Hu, Z. Cortical Mapping of Mirror Visual Feedback Training for Unilateral Upper Extremity: A Functional near-Infrared Spectroscopy Study. Brain Behav. 2020, 10, 1–13. [Google Scholar] [CrossRef]
- Banville, H.; Gupta, R.; Falk, T.H. Mental Task Evaluation for Hybrid NIRS-EEG Brain-Computer Interfaces. Comput. Intell. Neurosci. 2017, 2017, 1–24. [Google Scholar] [CrossRef]
- Batula, A.M.; Kim, Y.E.; Ayaz, H. Virtual and Actual Humanoid Robot Control with Four-Class Motor-Imagery-Based Optical Brain-Computer Interface. Biomed Res. Int. 2017, 2017, 1–24. [Google Scholar] [CrossRef]
- Batula, A.M.; Mark, J.A.; Kim, Y.E.; Ayaz, H. Comparison of Brain Activation during Motor Imagery and Motor Movement Using FNIRS. Comput. Intell. Neurosci. 2017, 2017, 1–12. [Google Scholar] [CrossRef]
- Beurskens, R.; Helmich, I.; Rein, R.; Bock, O. Age-Related Changes in Prefrontal Activity during Walking in Dual-Task Situations: A FNIRS Study. Int. J. Psychophysiol. 2014, 92, 122–128. [Google Scholar] [CrossRef]
- Brigadoi, S.; Cutini, S.; Scarpa, F.; Scatturin, P.; Dell’Acqua, R. Exploring the Role of Primary and Supplementary Motor Areas in Simple Motor Tasks with FNIRS. Cogn. Process. 2012, 13, 97–101. [Google Scholar] [CrossRef]
- Bruno, J.L.; Baker, J.M.; Gundran, A.; Harbott, L.K.; Stuart, Z.; Piccirilli, A.M.; Hosseini, S.M.H.; Gerdes, J.C.; Reiss, A.L. Mind over Motor Mapping: Driver Response to Changing Vehicle Dynamics. Hum. Brain Mapp. 2018, 39, 3915–3927. [Google Scholar] [CrossRef]
- Buccino, A.P.; Keles, H.O.; Omurtag, A. Hybrid EEG-FNIRS Asynchronous Brain-Computer Interface for Multiple Motor Tasks. PLoS ONE 2016, 11, e0146610. [Google Scholar] [CrossRef]
- Chen, M.; Pillemer, S.; England, S.; Izzetoglu, M.; Mahoney, J.R.; Holtzer, R. Neural Correlates of Obstacle Negotiation in Older Adults: An FNIRS Study. Gait Posture 2017, 58, 130–135. [Google Scholar] [CrossRef]
- Choi, D.S.; Lee, H.J.; Shin, Y.I.; Lee, A.; Kim, H.G.; Kim, Y.H. Modulation of Cortical Activity by High-Frequency Whole-Body Vibration Exercise: An FNIRS Study. J. Sport Rehabil. 2019, 28, 665–670. [Google Scholar] [CrossRef]
- Crivelli, D.; Sabogal Rueda, M.D.; Balconi, M. Linguistic and Motor Representations of Everyday Complex Actions: An FNIRS Investigation. Brain Struct. Funct. 2018, 223, 2989–2997. [Google Scholar] [CrossRef]
- Derosière, G.; Alexandre, F.; Bourdillon, N.; Mandrick, K.; Ward, T.E.; Perrey, S. Similar Scaling of Contralateral and Ipsilateral Cortical Responses during Graded Unimanual Force Generation. Neuroimage 2014, 85, 471–477. [Google Scholar] [CrossRef]
- Ferrari, M.; Bisconti, S.; Spezialetti, M.; Moro, S.B.; Di Palo, C.; Placidi, G.; Quaresima, V. Prefrontal Cortex Activated Bilaterally by a Tilt Board Balance Task: A Functional near-Infrared Spectroscopy Study in a Semi-Immersive Virtual Reality Environment. Brain Topogr. 2014, 27, 353–365. [Google Scholar] [CrossRef]
- Fu, Y.; Xiong, X.; Jiang, C.; Xu, B.; Li, Y.; Li, H. Imagined Hand Clenching Force and Speed Modulate Brain Activity and Are Classified by NIRS Combined with EEG. IEEE Trans. Neural Syst. Rehabil. Eng. 2017, 25, 1641–1652. [Google Scholar] [CrossRef]
- Harrison, S.J.; Hough, M.; Schmid, K.; Groff, B.R.; Stergiou, N. When Coordinating Finger Tapping to a Variable Beat the Variability Scaling Structure of the Movement and the Cortical BOLD Signal Are Both Entrained to the Auditory Stimuli. Neuroscience 2018, 392, 203–218. [Google Scholar] [CrossRef] [PubMed]
- Heinze, R.A.; Vanzella, P.; Zimeo Morais, G.A.; Sato, J.R. Hand Motor Learning in a Musical Context and Prefrontal Cortex Hemodynamic Response: A Functional near-Infrared Spectroscopy (FNIRS) Study. Cogn. Process. 2019, 20, 507–513. [Google Scholar] [CrossRef]
- Hernandez, A.R.; Winesett, S.P.; Federico, Q.P.; Williams, S.A.; Burke, S.N.; Clark, D.J. A Cross-Species Model of Dual-Task Walking in Young and Older Humans and Rats. Front. Aging Neurosci. 2020, 12, 1–12. [Google Scholar] [CrossRef]
- Herold, F.; Aye, N.; Hamacher, D.; Schega, L. Towards the Neuromotor Control Processes of Steady-State and Speed-Matched Treadmill and Overground Walking. Brain Topogr. 2019, 32, 472–476. [Google Scholar] [CrossRef]
- Herold, F.; Orlowski, K.; Börmel, S.; Müller, N.G. Cortical Activation during Balancing on a Balance Board. Hum. Mov. Sci. 2017, 51, 51–58. [Google Scholar] [CrossRef]
- Holper, L.; Kobashi, N.; Kiper, D.; Scholkmann, F.; Wolf, M.; Eng, K. Trial-to-Trial Variability Differentiates Motor Imagery during Observation between Low versus High Responders: A Functional near-Infrared Spectroscopy Study. Behav. Brain Res. 2012, 229, 29–40. [Google Scholar] [CrossRef]
- Holper, L.; Muehlemann, T.; Scholkmann, F.; Eng, K.; Kiper, D.; Wolf, M. Testing the Potential of a Virtual Reality Neurorehabilitation System during Performance of Observation, Imagery and Imitation of Motor Actions Recorded by Wireless Functional near-Infrared Spectroscopy (FNIRS). J. Neuroeng. Rehabil. 2010, 7, 57. [Google Scholar] [CrossRef]
- Holper, L.; Scholkmann, F.; Wolf, M. The Relationship between Sympathetic Nervous Activity and Cerebral Hemodynamics and Oxygenation: A Study Using Skin Conductance Measurement and Functional near-Infrared Spectroscopy. Behav. Brain Res. 2014, 270, 95–107. [Google Scholar] [CrossRef]
- Holper, L.; Wolf, M. Single-Trial Classification of Motor Imagery Differing in Task Complexity: A Functional near-Infrared Spectroscopy Study. J. Neuroeng. Rehabil. 2011, 8, 1–13. [Google Scholar] [CrossRef]
- Holtzer, R.; Kraut, R.; Izzetoglu, M.; Ye, K. The Effect of Fear of Falling on Prefrontal Cortex Activation and Efficiency during Walking in Older Adults. GeroScience 2019, 41, 89–100. [Google Scholar] [CrossRef]
- Holtzer, R.; Mahoney, J.R.; Izzetoglu, M.; Izzetoglu, K.; Onaral, B.; Verghese, J. FNIRS Study of Walking and Walking While Talking in Young and Old Individuals. J. Gerontol. Ser. A Biol. Sci. Med. Sci. 2011, 66, 879–887. [Google Scholar] [CrossRef] [PubMed]
- Holtzer, R.; Ross, D.; Izzetoglu, M. Intraindividual Variability in Neural Activity in the Prefrontal Cortex during Active Walking in Older Adults. Psychol. Aging 2020, 35, 1201–1214. [Google Scholar] [CrossRef] [PubMed]
- Holtzer, R.; Yuan, J.; Verghese, J.; Mahoney, J.R.; Izzetoglu, M.; Wang, C. Interactions of Subjective and Objective Measures of Fatigue Defined in the Context of Brain Control of Locomotion. J. Gerontol. Ser. A Biol. Sci. Med. Sci. 2017, 72, 417–423. [Google Scholar] [CrossRef] [PubMed]
- Hong, K.S.; Naseer, N. Reduction of Delay in Detecting Initial Dips from Functional Near-Infrared Spectroscopy Signals Using Vector-Based Phase Analysis. Int. J. Neural Syst. 2016, 26, 1–16. [Google Scholar] [CrossRef]
- Hu, X.-S.; Hong, K.-S.; Ge, S.S. Reduction of Trial-to-Trial Variability in Functional near-Infrared Spectroscopy Signals by Accounting for Resting-State Functional Connectivity. J. Biomed. Opt. 2013, 18, 017003. [Google Scholar] [CrossRef] [PubMed]
- Huppert, T.J.; Schmidt, B.; Beluk, N.; Furman, J.; Sparto, P. Measurement of Brain Activation During an Upright Stepping Reaction Task Using Functional Near-Infrared Spectroscopy. Hum. Brain Mapp. 2013, 34, 2817–2828. [Google Scholar] [CrossRef]
- Ishii, K.; Liang, N.; Asahara, R.; Takahashi, M.; Matsukawa, K. Feedforward- and Motor Effort-Dependent Increase in Prefrontal Oxygenation during Voluntary One-Armed Cranking. J. Physiol. 2018, 596, 5099–5118. [Google Scholar] [CrossRef]
- Jin, H.; Li, C.; Xu, J. Pilot Study on Gait Classification Using FNIRS Signals. Comput. Intell. Neurosci. 2018, 2018, 1–9. [Google Scholar] [CrossRef] [PubMed]
- Karim, H.; Schmidt, B.; Dart, D.; Beluk, N.; Huppert, T. Functional Near-Infrared Spectroscopy (FNIRS) of Brain Function during Active Balancing Using a Video Game System. Gait Posture 2012, 35, 367–372. [Google Scholar] [CrossRef] [PubMed]
- Kobashi, N.; Holper, L.; Scholkmann, F.; Kiper, D.; Eng, K. Enhancement of Motor Imagery-Related Cortical Activation during First-Person Observation Measured by Functional near-Infrared Spectroscopy. Eur. J. Neurosci. 2012, 35, 1513–1521. [Google Scholar] [CrossRef]
- Koehler, S.; Egetemeir, J.; Stenneken, P.; Koch, S.P.; Pauli, P.; Fallgatter, A.J.; Herrmann, M.J. The Human Execution/Observation Matching System Investigated with a Complex Everyday Task: A Functional near-Infrared Spectroscopy (FNIRS) Study. Neurosci. Lett. 2012, 508, 73–77. [Google Scholar] [CrossRef]
- Koenraadt, K.L.M.; Duysens, J.; Smeenk, M.; Keijsers, N.L.W. Multi-Channel NIRS of the Primary Motor Cortex to Discriminate Hand from Foot Activity. J. Neural Eng. 2012, 9, 046010. [Google Scholar] [CrossRef] [PubMed]
- Koenraadt, K.L.M.; Duysens, J.; Meddeler, B.M.; Keijsers, N.L.W. Hand Tapping at Mixed Frequencies Requires More Motor Cortex Activity Compared to Single Frequencies: An FNIRS Study. Exp. Brain Res. 2013, 231, 231–237. [Google Scholar] [CrossRef]
- Koenraadt, K.L.M.; Roelofsen, E.G.J.; Duysens, J.; Keijsers, N.L.W. Cortical Control of Normal Gait and Precision Stepping: An FNIRS Study. Neuroimage 2014, 85, 415–422. [Google Scholar] [CrossRef]
- Koren, Y.; Parmet, Y.; Bar-Haim, S. Treading on the Unknown Increases Prefrontal Activity: A Pilot FNIRS Study. Gait Posture 2019, 69, 96–100. [Google Scholar] [CrossRef] [PubMed]
- Kotegawa, K.; Yasumura, A.; Teramoto, W. Activity in the Prefrontal Cortex during Motor Imagery of Precision Gait: An FNIRS Study. Exp. Brain Res. 2020, 238, 221–228. [Google Scholar] [CrossRef] [PubMed]
- Kurz, M.J.; Wilson, T.W.; Arpin, D.J. Stride-Time Variability and Sensorimotor Cortical Activation during Walking. Neuroimage 2012, 59, 1602–1607. [Google Scholar] [CrossRef]
- Lachert, P.; Janusek, D.; Pulawski, P.; Liebert, A.; Milej, D.; Blinowska, K.J. Coupling of Oxy- and Deoxyhemoglobin Concentrations with EEG Rhythms during Motor Task. Sci. Rep. 2017, 7, 1–9. [Google Scholar] [CrossRef]
- Lee, B.C.; Choi, J.; Martin, B.J. Roles of the Prefrontal Cortex in Learning to Time the Onset of Pre-Existing Motor Programs. PLoS ONE 2020, 15, e0241562. [Google Scholar] [CrossRef] [PubMed]
- Li, C.; Su, M.; Xu, J.; Jin, H.; Sun, L. A Between-Subject FNIRS-BCI Study on Detecting Self-Regulated Intention. IEEE Trans. Neural Syst. Rehabil. Eng. 2020, 28, 531–540. [Google Scholar] [CrossRef]
- Li, C.; Xu, J.; Zhu, Y.; Kuang, S.; Qu, W.; Sun, L. Detecting Self-Paced Walking Intention Based on FNIRS Technology for the Development of BCI. Med. Biol. Eng. Comput. 2020, 58, 933–941. [Google Scholar] [CrossRef] [PubMed]
- Li, C.; Zhu, Y.; Qu, W.; Sun, L. Research on Blood Oxygen Activity in Cerebral Cortical Motor Function Areas with Adjustment Intention during Gait. Technol. Health Care 2020, 1–10. [Google Scholar]
- Li, X.; Krol, M.A.; Jahani, S.; Boas, D.A.; Tager-Flusberg, H.; Yücel, M.A. Brain Correlates of Motor Complexity during Observed and Executed Actions. Sci. Rep. 2020, 10, 1–15. [Google Scholar] [CrossRef] [PubMed]
- Lin, P.Y.; Lin, S.I.; Chen, J.J.J. Functional near Infrared Spectroscopy Study of Age-Related Difference in Cortical Activation Patterns during Cycling with Speed Feedback. IEEE Trans. Neural Syst. Rehabil. Eng. 2012, 20, 78–84. [Google Scholar] [CrossRef] [PubMed]
- Lin, T.Y.; Wu, J.S.; Lin, L.L.; Ho, T.C.; Lin, P.Y.; Chen, J.J.J. Assessments of Muscle Oxygenation and Cortical Activity Using Functional Near-Infrared Spectroscopy in Healthy Adults during Hybrid Activation. IEEE Trans. Neural Syst. Rehabil. Eng. 2016, 24, 1–9. [Google Scholar] [CrossRef] [PubMed]
- Lu, C.F.; Liu, Y.C.; Yang, Y.R.; Wu, Y.T.; Wang, R.Y. Maintaining Gait Performance by Cortical Activation during Dual-Task Interference: A Functional near-Infrared Spectroscopy Study. PLoS ONE 2015, 10, e0129390. [Google Scholar] [CrossRef]
- Lu, C.F.; Teng, S.; Wu, Y.T. Dynamics of Hemoglobin States in the Sensorimotor Cortex during Motor Tasks: A Functional near Infrared Spectroscopy Study. In Proceedings of the 2013 35th Annual International Conference of the IEEE Engineering in Medicine and Biology Society (EMBC), Osaka, Japan, 3–7 July 2013; pp. 1803–1806. [Google Scholar]
- Lu, F.M.; Wang, Y.F.; Zhang, J.; Chen, H.F.; Yuan, Z. Optical Mapping of the Dominant Frequency of Brain Signal Oscillations in Motor Systems. Sci. Rep. 2017, 7, 1–13. [Google Scholar] [CrossRef] [PubMed]
- Lucas, M.; Wagshul, M.E.; Izzetoglu, M.; Holtzer, R. Moderating Effect of White Matter Integrity on Brain Activation during Dual-Task Walking in Older Adults. J. Gerontol. Ser. A Biol. Sci. Med. Sci. 2019, 74, 435–441. [Google Scholar] [CrossRef] [PubMed]
- Maidan, I.; Shustak, S.; Sharon, T.; Bernad-Elazari, H.; Geffen, N.; Giladi, N.; Hausdorff, J.M.; Mirelman, A. Prefrontal Cortex Activation during Obstacle Negotiation: What’s the Effect Size and Timing? Brain Cogn. 2018, 122, 45–51. [Google Scholar] [CrossRef] [PubMed]
- Mandrick, K.; Derosiere, G.; Dray, G.; Coulon, D.; Micallef, J.P.; Perrey, S. Prefrontal Cortex Activity during Motor Tasks with Additional Mental Load Requiring Attentional Demand: A near-Infrared Spectroscopy Study. Neurosci. Res. 2013, 76, 156–162. [Google Scholar] [CrossRef]
- Mehnert, J.; Brunetti, M.; Steinbrink, J.; Niedeggen, M.; Dohle, C. Effect of a Mirror-like Illusion on Activation in the Precuneus Assessed with Functional near-Infrared Spectroscopy. J. Biomed. Opt. 2013, 18, 066001. [Google Scholar] [CrossRef]
- Mehta, R.K.; Rhee, J. Age-Specific Neural Strategies to Maintain Motor Performance after an Acute Social Stress Bout. Exp. Brain Res. 2017, 235, 2049–2057. [Google Scholar] [CrossRef]
- Metzger, F.G.; Ehlis, A.C.; Haeussinger, F.B.; Schneeweiss, P.; Hudak, J.; Fallgatter, A.J.; Schneider, S. Functional Brain Imaging of Walking While Talking–An FNIRS Study. Neuroscience 2017, 343, 85–93. [Google Scholar] [CrossRef]
- Mirelman, A.; Maidan, I.; Bernad-Elazari, H.; Nieuwhof, F.; Reelick, M.; Giladi, N.; Hausdorff, J.M. Increased Frontal Brain Activation during Walking While Dual Tasking: An FNIRS Study in Healthy Young Adults. J. Neuroeng. Rehabil. 2014, 11, 1–7. [Google Scholar] [CrossRef]
- Mirelman, A.; Maidan, I.; Bernad-Elazari, H.; Shustack, S.; Giladi, N.; Hausdorff, J.M. Effects of Aging on Prefrontal Brain Activation during Challenging Walking Conditions. Brain Cogn. 2017, 115, 41–46. [Google Scholar] [CrossRef]
- Muthalib, M.; Besson, P.; Rothwell, J.; Ward, T.; Perrey, S. Effects of Anodal High-Definition Transcranial Direct Current Stimulation on Bilateral Sensorimotor Cortex Activation during Sequential Finger Movements: An FNIRS Study. Adv. Exp. Med. Biol. 2016, 876, 351–359. [Google Scholar]
- Muthalib, M.; Ferrari, M.; Quaresima, V.; Kerr, G.; Perrey, S. Functional Near-Infrared Spectroscopy to Probe Sensorimotor Region Activation during Electrical Stimulation-Evoked Movement. Clin. Physiol. Funct. Imaging 2018, 38, 816–822. [Google Scholar] [CrossRef] [PubMed]
- Muthalib, M.; Re, R.; Zucchelli, L.; Perrey, S.; Contini, D.; Caffini, M.; Spinelli, L.; Kerr, G.; Quaresima, V.; Ferrari, M.; et al. Effects of Increasing Neuromuscular Electrical Stimulation Current Intensity on Cortical Sensorimotor Network Activation: A Time Domain FNIRS Study. PLoS ONE 2015, 10, e0131951. [Google Scholar] [CrossRef] [PubMed]
- Nagasawa, T.; Sato, T.; Nambu, I.; Wada, Y. FNIRS-GANs: Data Augmentation Using Generative Adversarial Networks for Classifying Motor Tasks from Functional near-Infrared Spectroscopy. J. Neural Eng. 2020, 17, 016068. [Google Scholar] [CrossRef] [PubMed]
- Naseer, N.; Hong, K.S. Classification of Functional Near-Infrared Spectroscopy Signals Corresponding to the Right- and Left-Wrist Motor Imagery for Development of a Brain-Computer Interface. Neurosci. Lett. 2013, 553, 84–89. [Google Scholar] [CrossRef] [PubMed]
- Nazeer, H.; Naseer, N.; Khan, R.A.; Noori, F.M.; Qureshi, N.K.; Khan, U.S.; Khan, M.J. Enhancing Classification Accuracy of FNIRS-BCI Using Features Acquired from Vector-Based Phase Analysis. J. Neural Eng. 2020, 17, 056025. [Google Scholar] [CrossRef]
- Nazeer, H.; Naseer, N.; Mehboob, A.; Khan, M.J.; Khan, R.A.; Khan, U.S.; Ayaz, Y. Enhancing Classification Performance of FNIRS-BCI by Identifying Cortically Active Channels Using the Z-Score Method. Sensors 2020, 20, 6995. [Google Scholar] [CrossRef]
- Novi, S.L.; Forero, E.J.; Rubianes Silva, J.A.I.; de Souza, N.G.S.R.; Martins, G.G.; Quiroga, A.; Wu, S.T.; Mesquita, R.C. Integration of Spatial Information Increases Reproducibility in Functional Near-Infrared Spectroscopy. Front. Neurosci. 2020, 14, 1–12. [Google Scholar] [CrossRef]
- Peters, S.; Lim, S.B.; Louie, D.R.; Yang, C.L.; Eng, J.J. Passive, yet Not Inactive: Robotic Exoskeleton Walking Increases Cortical Activation Dependent on Task. J. Neuroeng. Rehabil. 2020, 17, 1–12. [Google Scholar] [CrossRef]
- Pfurtscheller, G.; Klobassa, D.S.; Altstatter, C.; Bauernfeind, G.; Neuper, C. About the Stability of Phase Shifts between Slow Oscillations around 0.1 Hz in Cardiovascular and Cerebral Systems. IEEE Trans. Biomed. Eng. 2011, 58, 2064–2071. [Google Scholar] [CrossRef]
- Pittaccio, S.; Garavaglia, L.; Molteni, E.; Guanziroli, E.; Zappasodi, F.; Beretta, E.; Strazzer, S.; Molteni, F.; Villa, E.; Passaretti, F. Can Passive Mobilization Provide Clinically-Relevant Brain Stimulation? A Pilot Eeg and Nirs Study on Healthy Subjects. In Proceedings of the 2013 35th Annual International Conference of the IEEE Engineering in Medicine and Biology Society (EMBC), Osaka, Japan, 3–7 July 2013; pp. 3547–3550. [Google Scholar]
- Polskaia, N.; St-Amant, G.; Fraser, S.; Lajoie, Y. A Functional Near-Infrared Spectroscopy (FNIRS) Examination of How Self-Initiated Sequential Movements Become Automatic. Exp. Brain Res. 2020, 238, 657–666. [Google Scholar] [CrossRef]
- Propper, R.E.; Dodd, K.; Christman, S.D.; Brunyé, T.T. Relationship between Sustained Unilateral Hand Clench, Emotional State, Line Bisection Performance, and Prefrontal Cortical Activity: A Functional near-Infrared Spectroscopy Study. Laterality 2017, 22, 671–689. [Google Scholar] [CrossRef] [PubMed]
- Rahimpour, A.; Pollonini, L.; Comstock, D.; Balasubramaniam, R.; Bortfeld, H. Tracking Differential Activation of Primary and Supplementary Motor Cortex across Timing Tasks: An FNIRS Validation Study. J. Neurosci. Methods 2020, 341, 108790. [Google Scholar] [CrossRef]
- Rosner, A.O.; Barlow, S.M. Hemodynamic Changes in Cortical Sensorimotor Systems Following Hand and Orofacial Motor Tasks and Pulsed Pneumotactile Stimulation. Somatosens. Mot. Res. 2016, 33, 145–155. [Google Scholar] [CrossRef] [PubMed]
- Rosso, A.L.; Cenciarini, M.; Sparto, P.J.; Loughlin, P.J.; Furman, J.M.; Huppert, T.J. Neuroimaging of an Attention Demanding Dual-Task during Dynamic Postural Control. Gait Posture 2017, 57, 193–198. [Google Scholar] [CrossRef] [PubMed]
- Sagari, A.; Iso, N.; Moriuchi, T.; Ogahara, K.; Kitajima, E.; Tanaka, K.; Tabira, T.; Higashi, T. Changes in Cerebral Hemodynamics during Complex Motor Learning by Character Entry into Touch-Screen Terminals. PLoS ONE 2015, 10, e0140552. [Google Scholar] [CrossRef]
- Sagari, A.; Kanao, H.; Mutai, H.; Iwanami, J.; Sato, M.; Kobayashi, M. Cerebral Hemodynamics During a Cognitive-Motor Task Using the Limbs. Front. Hum. Neurosci. 2020, 14, 1–8. [Google Scholar] [CrossRef] [PubMed]
- Schurholz, M.; Rana, M.; Robinson, N.; Ramos-Murguialday, A.; Cho, W.; Rohm, M.; Rupp, R.; Birbaumer, N.; Sitaram, R. Differences in Hemodynamic Activations between Motor Imagery and Upper Limb FES with NIRS. In Proceedings of the 2012 Annual International Conference of the IEEE Engineering in Medicine and Biology Society (EMBC), San Diego, CA, USA, 28 August–1 September 2012; pp. 4728–4731. [Google Scholar]
- Seidel, O.; Carius, D.; Kenville, R.; Ragert, P. Motor Learning in a Complex Balance Task and Associated Neuroplasticity: A Comparison between Endurance Athletes and Nonathletes. J. Neurophysiol. 2017, 118, 1849–1860. [Google Scholar] [CrossRef]
- Seidel, O.; Carius, D.; Roediger, J.; Rumpf, S.; Ragert, P. Changes in Neurovascular Coupling during Cycling Exercise Measured by Multi-Distance FNIRS: A Comparison between Endurance Athletes and Physically Active Controls. Exp. Brain Res. 2019, 237, 2957–2972. [Google Scholar] [CrossRef]
- Shibuya, K. The Activity of the Primary Motor Cortex Ipsilateral to the Exercising Hand Decreases during Repetitive Handgrip Exercise. Physiol. Meas. 2011, 32, 1929–1939. [Google Scholar] [CrossRef] [PubMed]
- Shibuya, K.; Kuboyama, N.; Tanaka, J. Changes in Ipsilateral Motor Cortex Activity during a Unilateral Isometric Finger Task Are Dependent on the Muscle Contraction Force. Physiol. Meas. 2014, 35, 417–428. [Google Scholar] [CrossRef]
- Shibuya, K.; Kuboyama, N.; Yamada, S. Complementary Activation of the Ipsilateral Primary Motor Cortex during a Sustained Handgrip Task. Eur. J. Appl. Physiol. 2016, 116, 171–178. [Google Scholar] [CrossRef] [PubMed]
- Stuart, S.; Alcock, L.; Rochester, L.; Vitorio, R.; Pantall, A. Monitoring Multiple Cortical Regions during Walking in Young and Older Adults: Dual-Task Response and Comparison Challenges. Int. J. Psychophysiol. 2019, 135, 63–72. [Google Scholar] [CrossRef]
- Tempest, G.D.; Reiss, A.L. The Utility of Functional Near-Infrared Spectroscopy for Measuring Cortical Activity during Cycling Exercise. Med. Sci. Sports Exerc. 2019, 51, 979–987. [Google Scholar] [CrossRef]
- Urquhart, E.L.; Wang, X.; Liu, H.; Fadel, P.J.; Alexandrakis, G. Differences in Net Information Flow and Dynamic Connectivity Metrics Between Physically Active and Inactive Subjects Measured by Functional Near-Infrared Spectroscopy (FNIRS) During a Fatiguing Handgrip Task. Front. Neurosci. 2020, 14, 1–16. [Google Scholar] [CrossRef] [PubMed]
- Vasta, R.; Cerasa, A.; Gramigna, V.; Augimeri, A.; Olivadese, G.; Pellegrino, G.; Martino, I.; Machado, A.; Cai, Z.; Caracciolo, M.; et al. The Movement Time Analyser Task Investigated with Functional near Infrared Spectroscopy: An Ecologic Approach for Measuring Hemodynamic Response in the Motor System. Aging Clin. Exp. Res. 2017, 29, 311–318. [Google Scholar] [CrossRef]
- Waldert, S.; Tüshaus, L.; Kaller, C.P.; Aertsen, A.; Mehring, C. FNIRS Exhibits Weak Tuning to Hand Movement Direction. PLoS ONE 2012, 7, e0049266. [Google Scholar] [CrossRef]
- Willis, S.J.; Borrani, F.; Millet, G.P. Leg- vs Arm-Cycling Repeated Sprints with Blood Flow Restriction and Systemic Hypoxia. Eur. J. Appl. Physiol. 2019, 119, 1819–1828. [Google Scholar] [CrossRef]
- Wolf, U.; Toronov, V.; Choi, J.H.; Gupta, R.; Michalos, A.; Gratton, E.; Wolf, M. Correlation of Functional and Resting State Connectivity of Cerebral Oxy-, Deoxy-, and Total Hemoglobin Concentration Changes Measured by near-Infrared Spectrophotometry. J. Biomed. Opt. 2011, 16, 087013. [Google Scholar] [CrossRef]
- Woorons, X.; Dupuy, O.; Mucci, P.; Millet, G.P.; Pichon, A. Cerebral and Muscle Oxygenation during Repeated Shuttle Run Sprints with Hypoventilation. Int. J. Sports Med. 2019, 40, 376–384. [Google Scholar] [CrossRef]
- Wriessnegger, S.C.; Kirchmeyr, D.; Bauernfeind, G.; Müller-Putz, G.R. Force Related Hemodynamic Responses during Execution and Imagery of a Hand Grip Task: A Functional near Infrared Spectroscopy Study. Brain Cogn. 2017, 117, 108–116. [Google Scholar] [CrossRef] [PubMed]
- Xu, Z.; Wang, Z.R.; Li, J.; Hu, M.; Xiang, M.Q. Effect of Acute Moderate-Intensity Exercise on the Mirror Neuron System: Role of Cardiovascular Fitness Level. Front. Psychol. 2020, 11, 1–11. [Google Scholar] [CrossRef]
- Yang, C.L.; Lim, S.B.; Peters, S.; Eng, J.J. Cortical Activation During Shoulder and Finger Movements in Healthy Adults: A Functional Near-Infrared Spectroscopy (FNIRS) Study. Front. Hum. Neurosci. 2020, 14, 1–12. [Google Scholar] [CrossRef]
- Yeo, S.S.; Chang, P.H.; Jang, S.H. The Cortical Activation Differences between Proximal and Distal Joint Movements of the Upper Extremities: A Functional NIRS Study. NeuroRehabilitation 2013, 32, 861–866. [Google Scholar] [CrossRef] [PubMed]
- Yin, X.; Xu, B.; Jiang, C.; Fu, Y.; Wang, Z.; Li, H.; Shi, G. A Hybrid BCI Based on EEG and FNIRS Signals Improves the Performance of Decoding Motor Imagery of Both Force and Speed of Hand Clenching. J. Neural Eng. 2015, 12, 036004. [Google Scholar] [CrossRef] [PubMed]
- Yokoyama, N.; Ohtaka, C.; Kato, K.; Kubo, H.; Nakata, H. The Difference in Hemodynamic Responses between Dominant and Non-Dominant Hands during Muscle Contraction and Relaxation: An FNIRS Study. PLoS ONE 2019, 14, e0220100. [Google Scholar] [CrossRef]
- Yozu, A.; Obayashi, S.; Nakajima, K.; Hara, Y. Hemodynamic Response of the Supplementary Motor Area during Locomotor Tasks with Upright versus Horizontal Postures in Humans. Neural Plast. 2016, 2016, 1–8. [Google Scholar] [CrossRef] [PubMed]
- Yu, J.; Ang, K.K.; Yang, H.; Guan, C. Cortical Activation of Passive Hand Movement Using Haptic Knob: A Preliminary Multi-Channel FNIRS Study. In Proceedings of the 2014 36th Annual International Conference of the IEEE Engineering in Medicine and Biology Society, Chicago, IL, USA, 26–30 August 2014; IEEE: Piscataway, NJ, USA, 2014; pp. 2097–2100. [Google Scholar]
- Zafar, A.; Hong, K.S. Reduction of Onset Delay in Functional Near-Infrared Spectroscopy: Prediction of HbO/HbR Signals. Front. Neurorobot. 2020, 14, 10. [Google Scholar] [CrossRef]
- Zimmermann, R.; Marchal-Crespo, L.; Edelmann, J.; Lambercy, O.; Fluet, M.C.; Riener, R.; Wolf, M.; Gassert, R. Detection of Motor Execution Using a Hybrid FNIRS-Biosignal BCI: A Feasibility Study. J. Neuroeng. Rehabil. 2013, 10, 1–15. [Google Scholar] [CrossRef] [PubMed]


Publisher’s Note: MDPI stays neutral with regard to jurisdictional claims in published maps and institutional affiliations. |
© 2021 by the authors. Licensee MDPI, Basel, Switzerland. This article is an open access article distributed under the terms and conditions of the Creative Commons Attribution (CC BY) license (https://creativecommons.org/licenses/by/4.0/).
Share and Cite
Dans, P.W.; Foglia, S.D.; Nelson, A.J. Data Processing in Functional Near-Infrared Spectroscopy (fNIRS) Motor Control Research. Brain Sci. 2021, 11, 606. https://doi.org/10.3390/brainsci11050606
Dans PW, Foglia SD, Nelson AJ. Data Processing in Functional Near-Infrared Spectroscopy (fNIRS) Motor Control Research. Brain Sciences. 2021; 11(5):606. https://doi.org/10.3390/brainsci11050606
Chicago/Turabian StyleDans, Patrick W., Stevie D. Foglia, and Aimee J. Nelson. 2021. "Data Processing in Functional Near-Infrared Spectroscopy (fNIRS) Motor Control Research" Brain Sciences 11, no. 5: 606. https://doi.org/10.3390/brainsci11050606
APA StyleDans, P. W., Foglia, S. D., & Nelson, A. J. (2021). Data Processing in Functional Near-Infrared Spectroscopy (fNIRS) Motor Control Research. Brain Sciences, 11(5), 606. https://doi.org/10.3390/brainsci11050606