
Cuprizone-Induced Neurotoxicity in Human Neural Cell Lines Is Mediated by a Reversible Mitochondrial Dysfunction: Relevance for Demyelination Models

 , , , , ,
  and
and 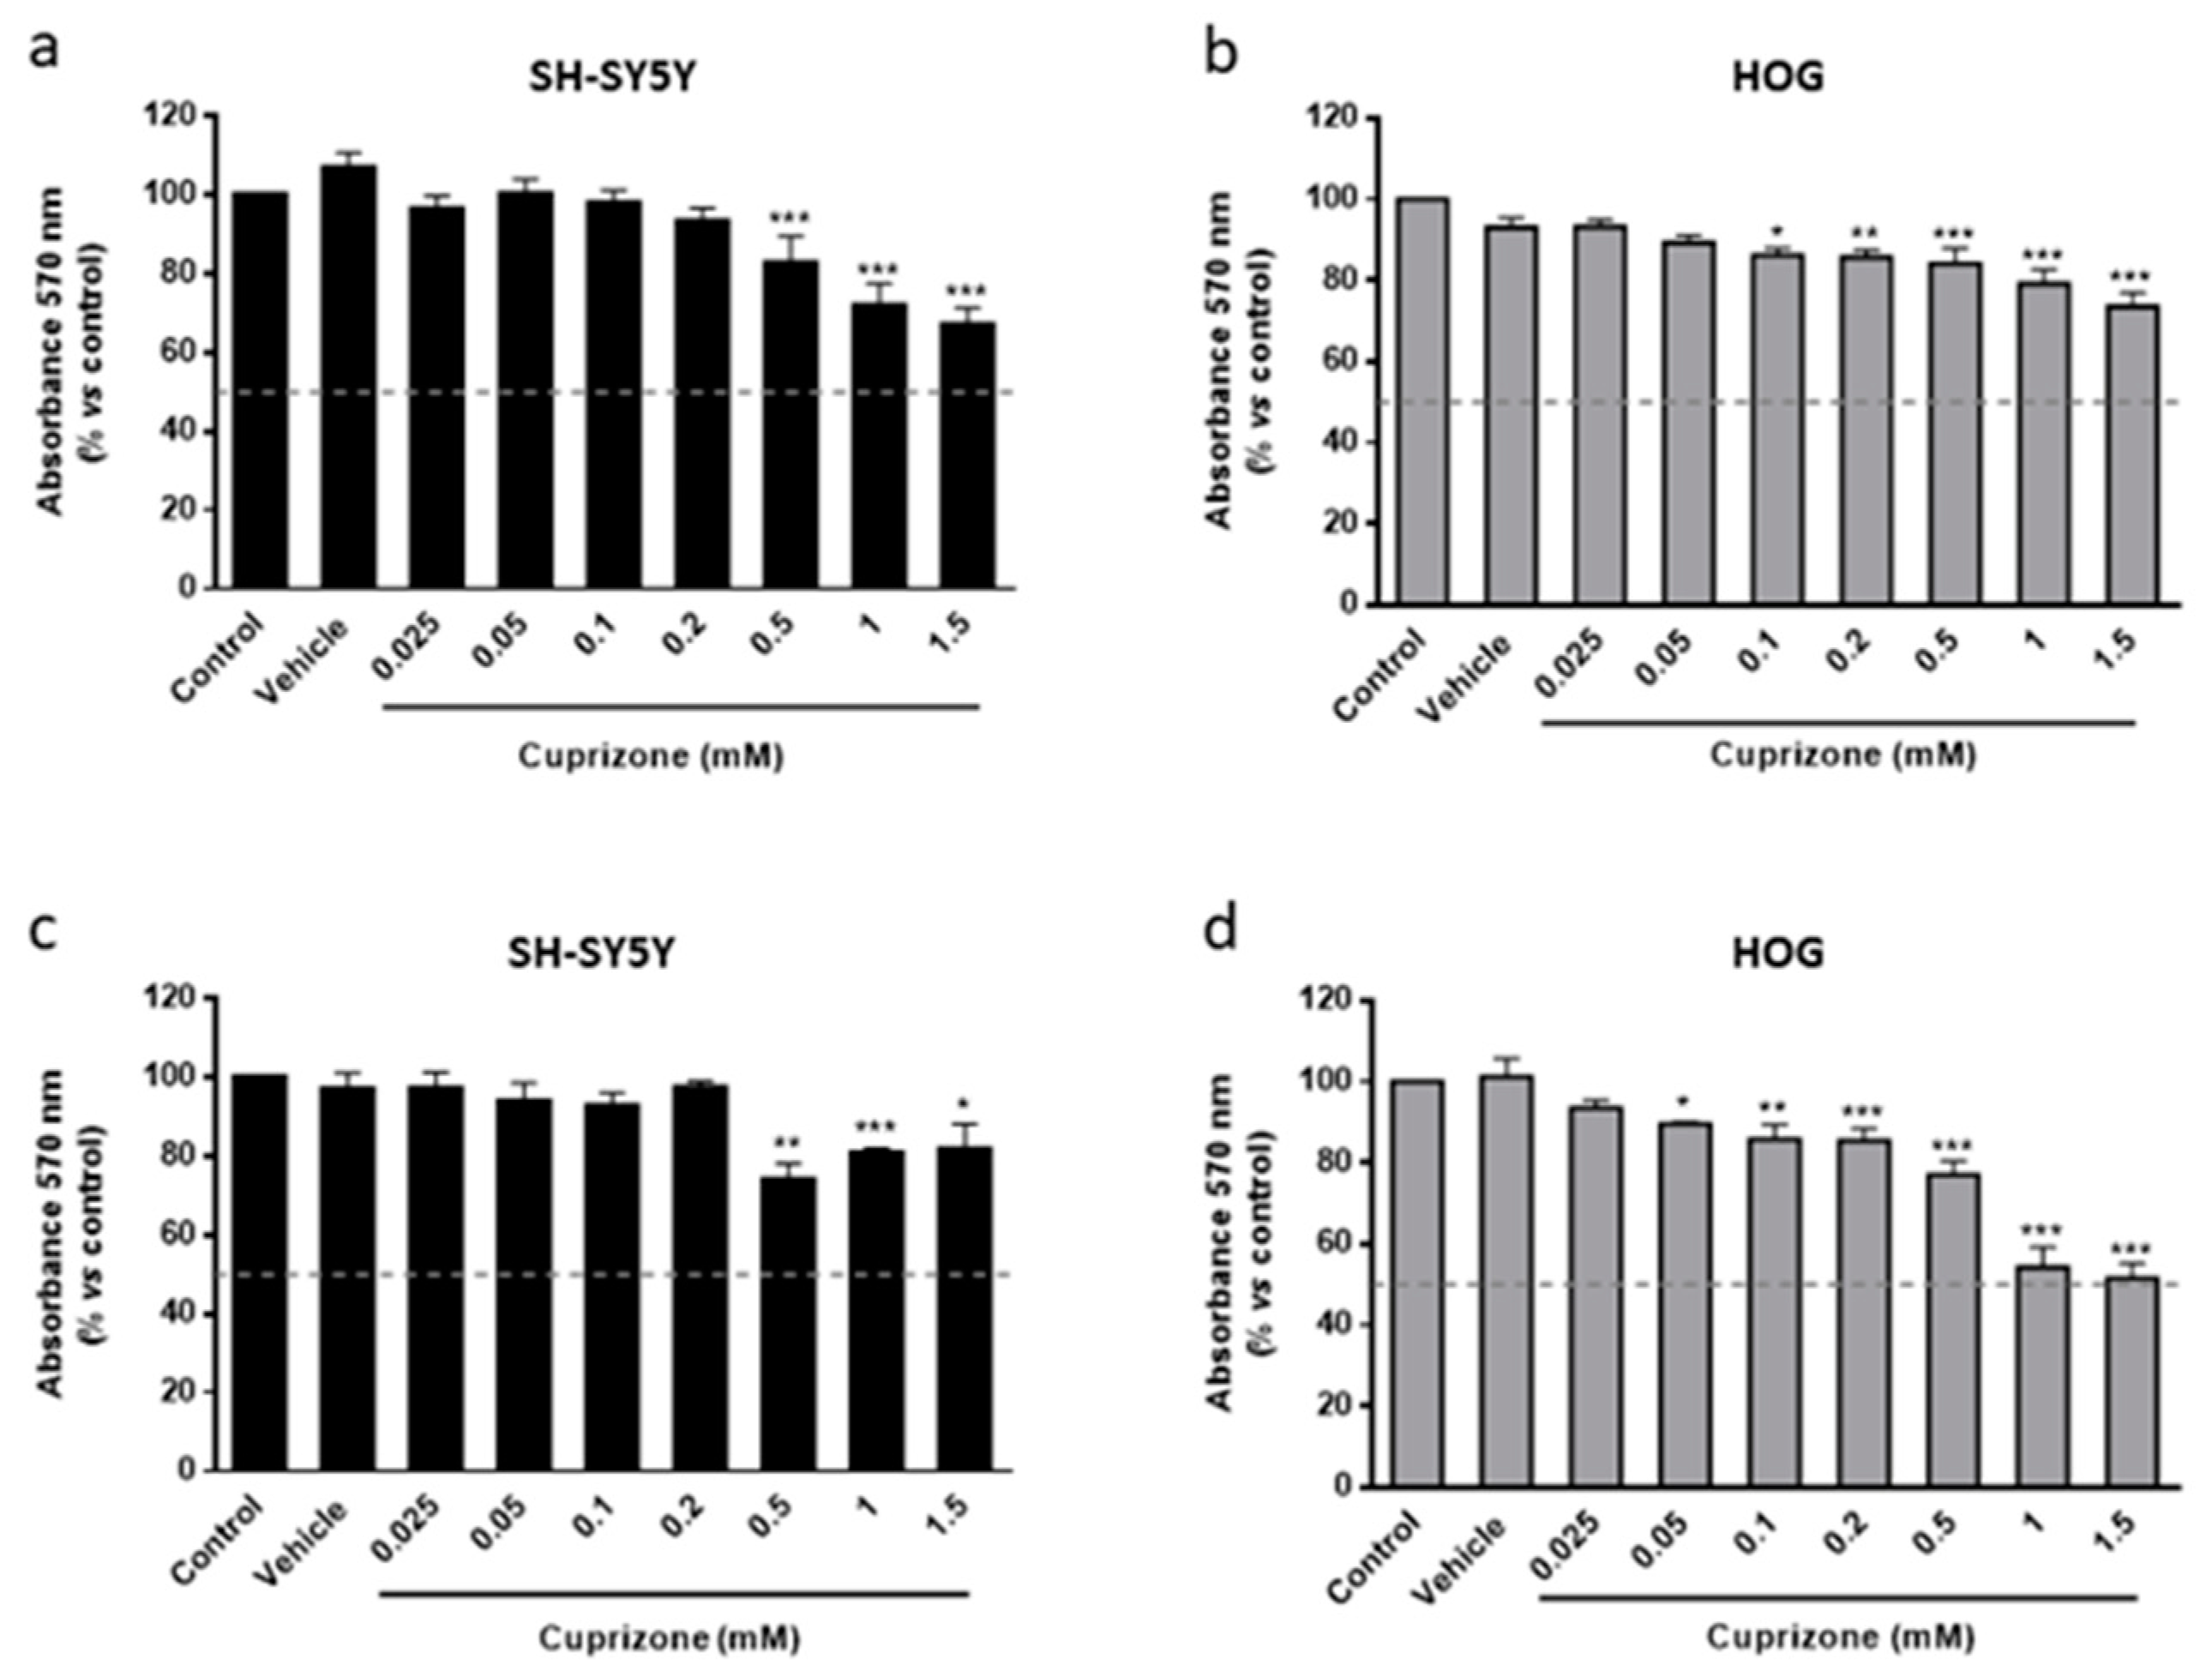
Abstract
1. Introduction
2. Materials and Methods
2.1. Cell Lines
2.2. Co-Cultures
2.3. Primary Cultures of Neurons
2.4. Cell Treatments
2.5. Oxygen Consumption Rate (OCR) Assay
2.6. MTT Reduction Assay
2.7. Trypan Blue Exclusion Assay
2.8. Microscopy Observation
2.9. Data Analysis
3. Results
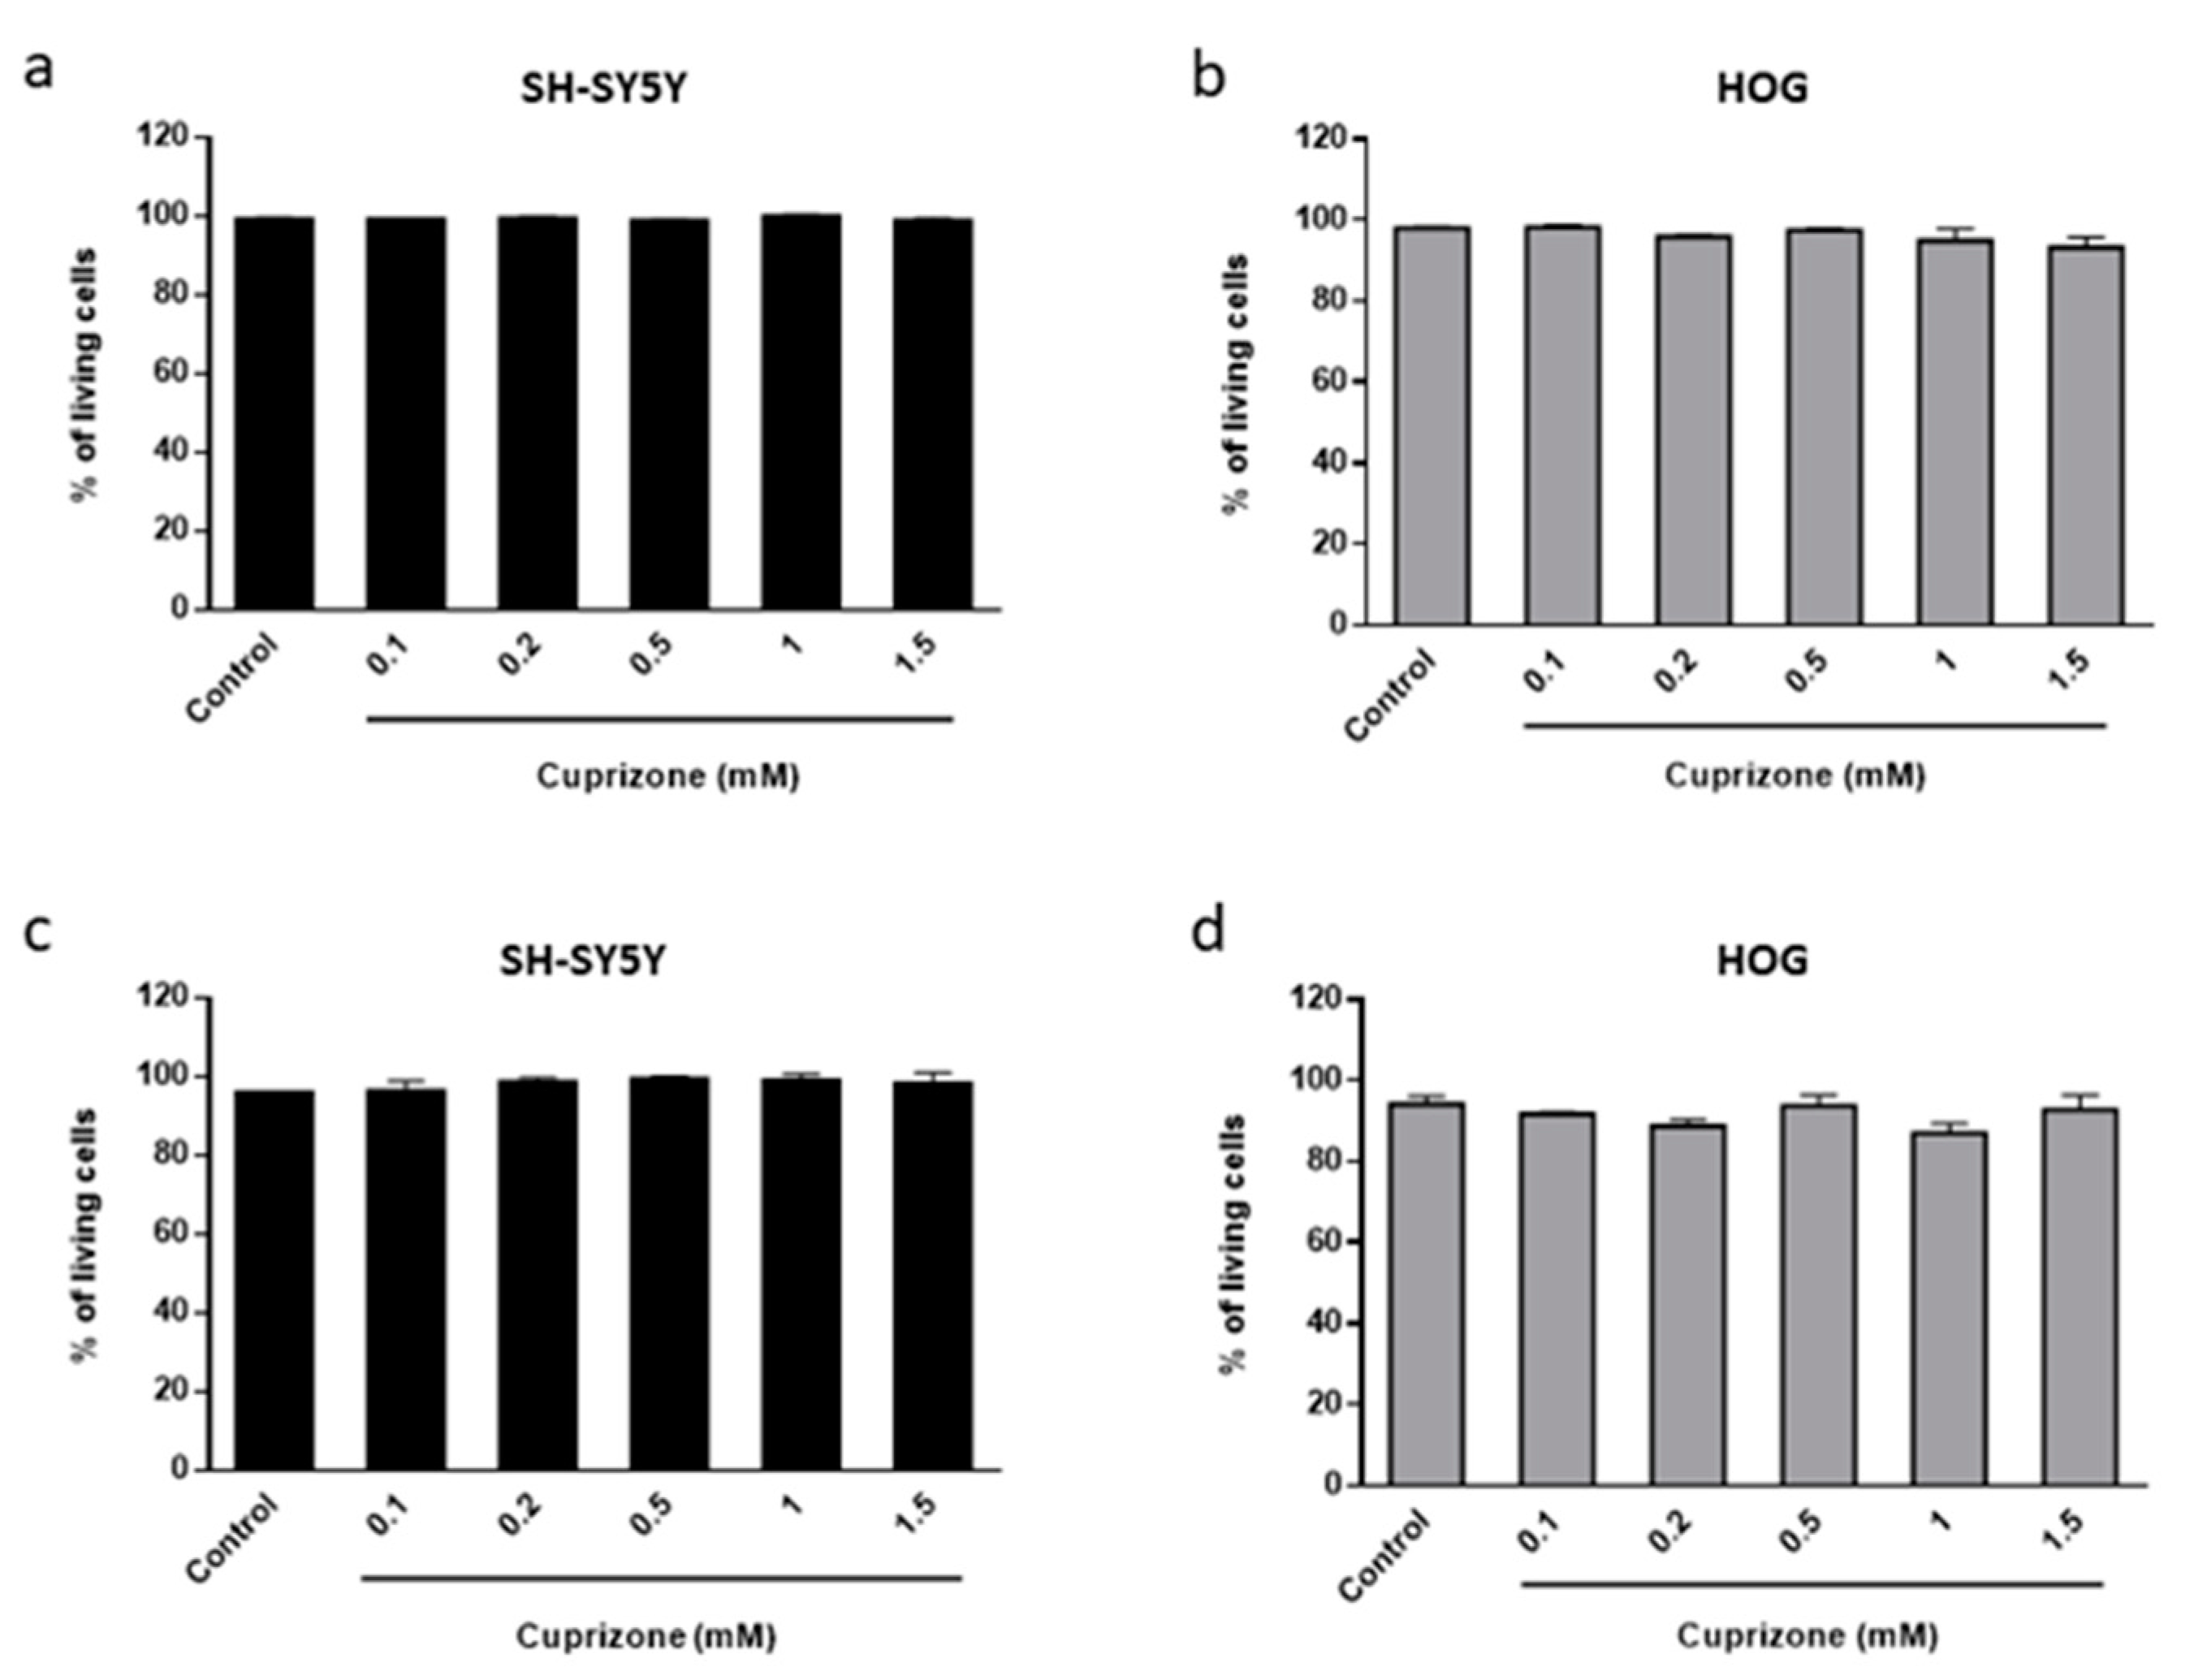
3.1. Cuprizone Decreases Cell Growth but Does Not Cause Death in HOG Cells
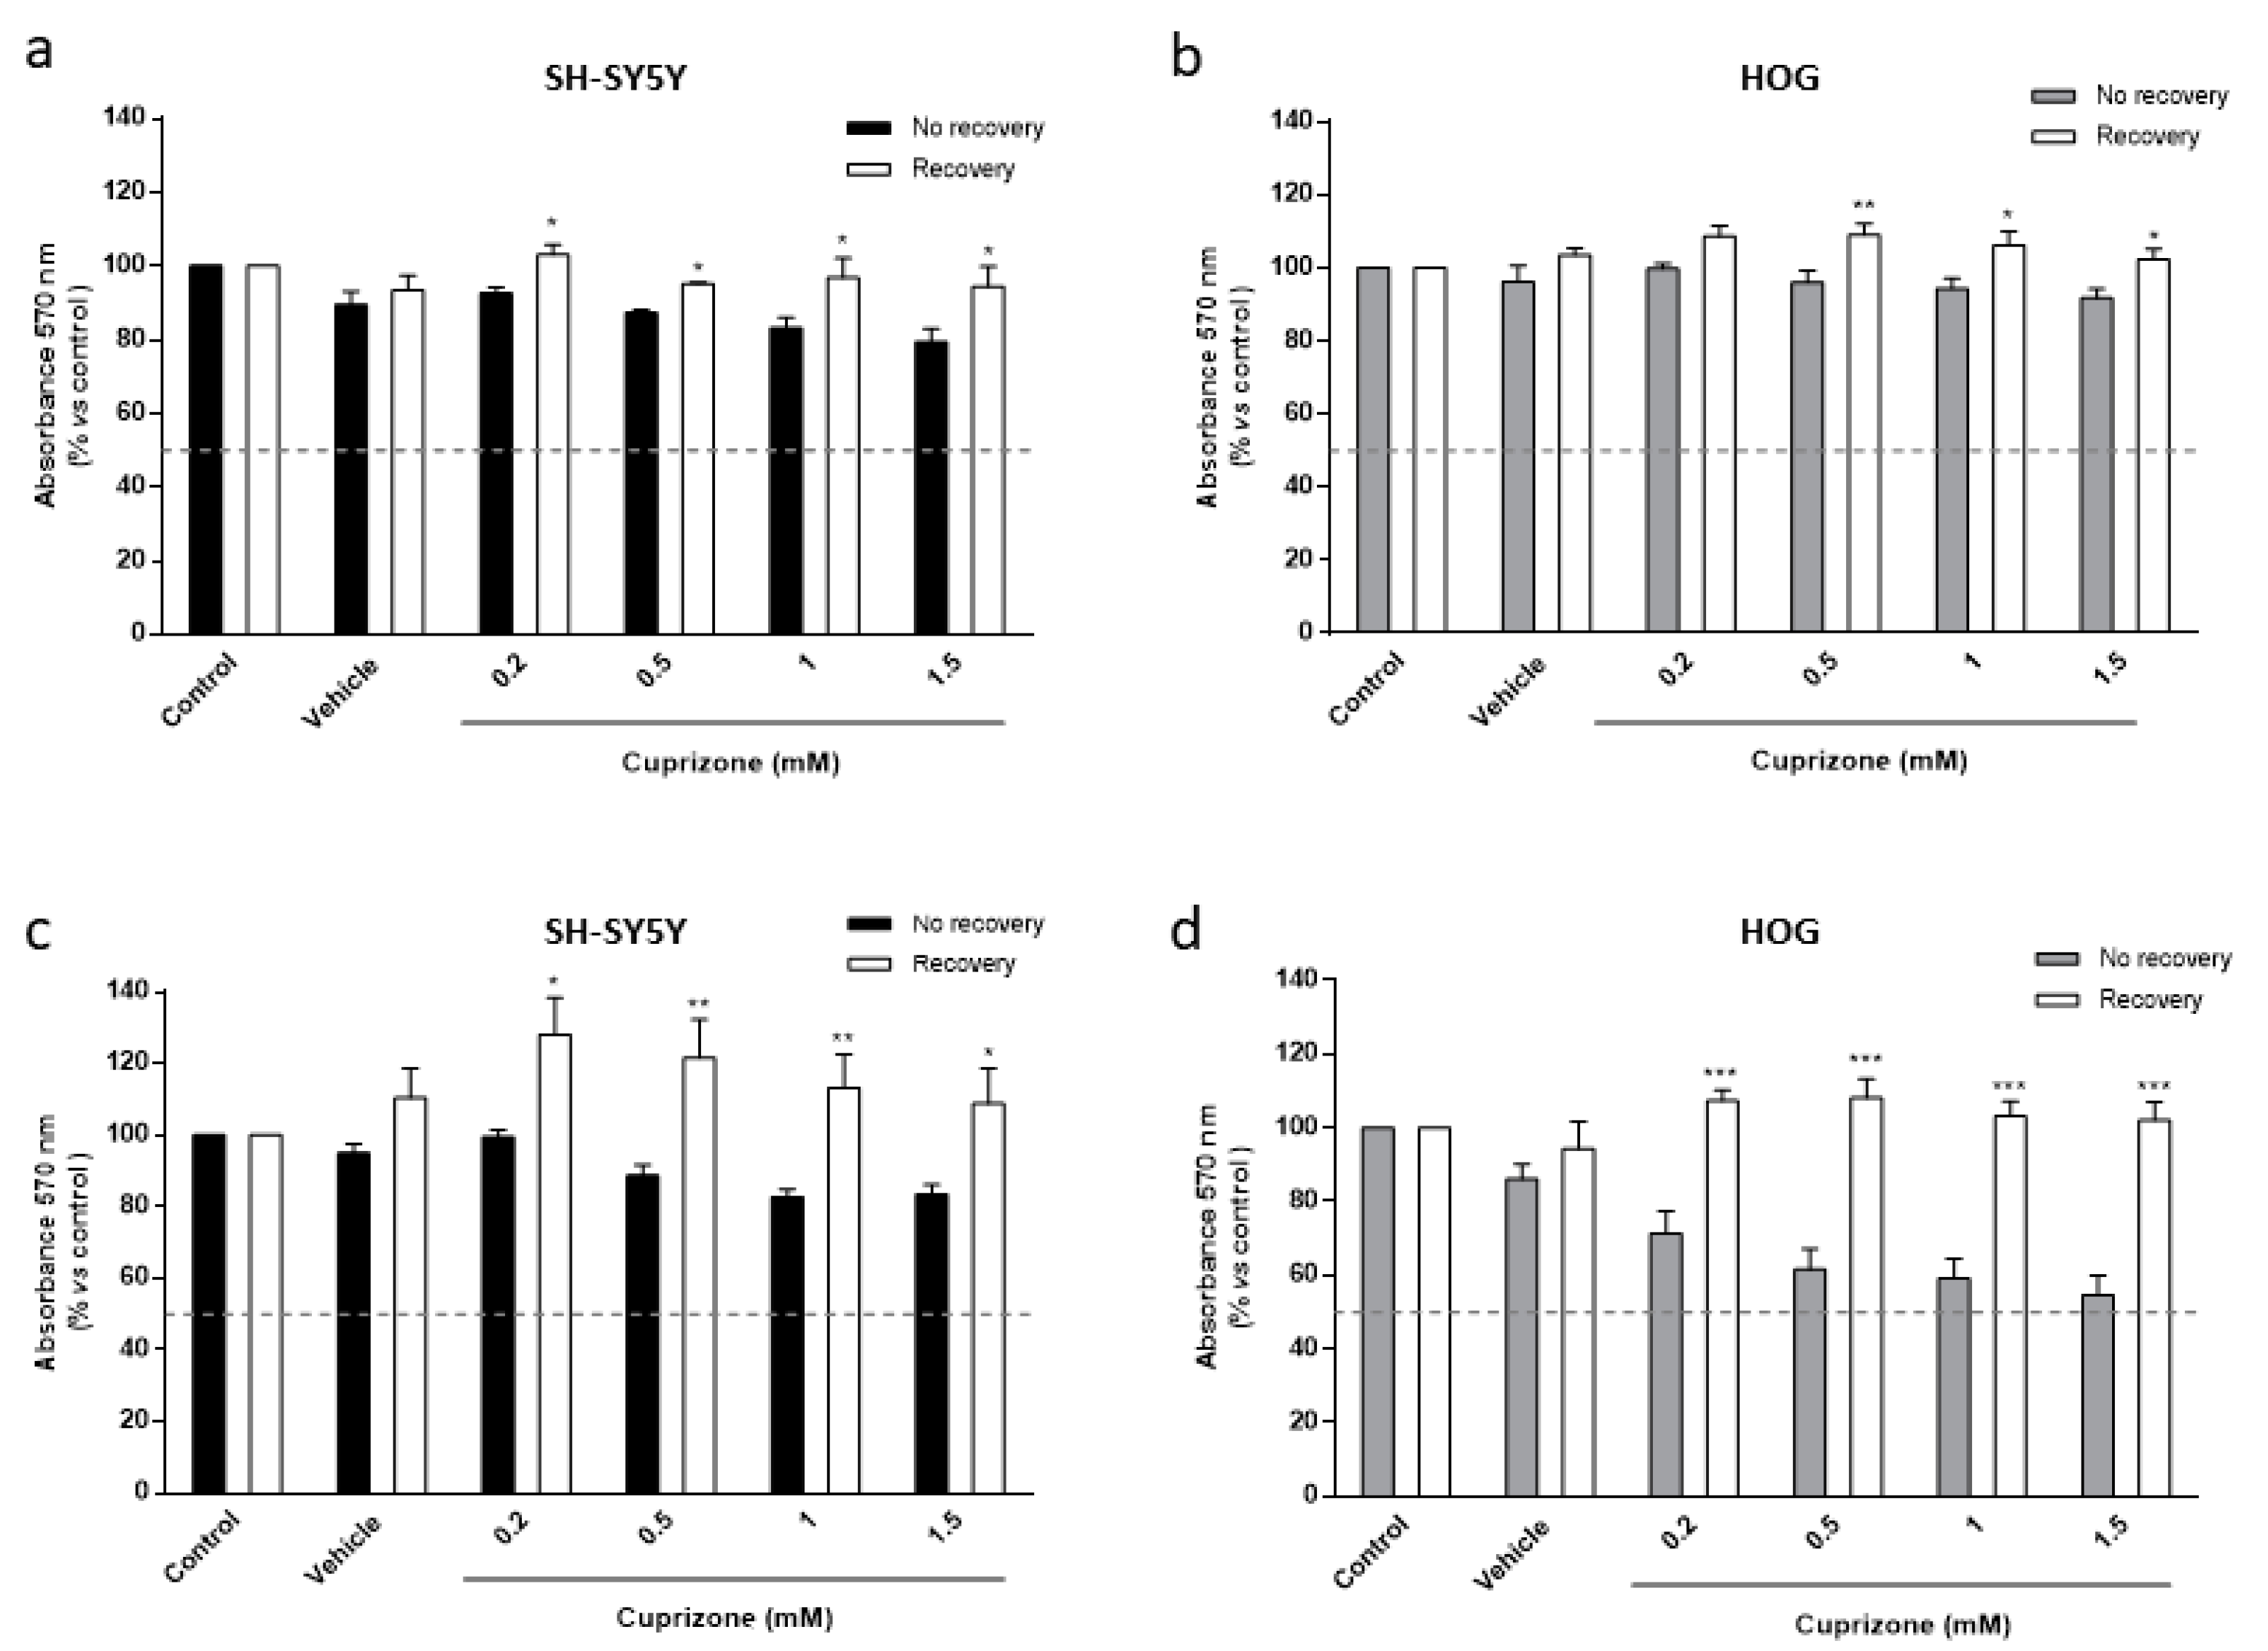
3.2. The Toxic Effect on HOG and SH-SY5Y Cells Is Both Mediated by Mitochondria and Reverted Once the CPZ Treatment Is Interrupted
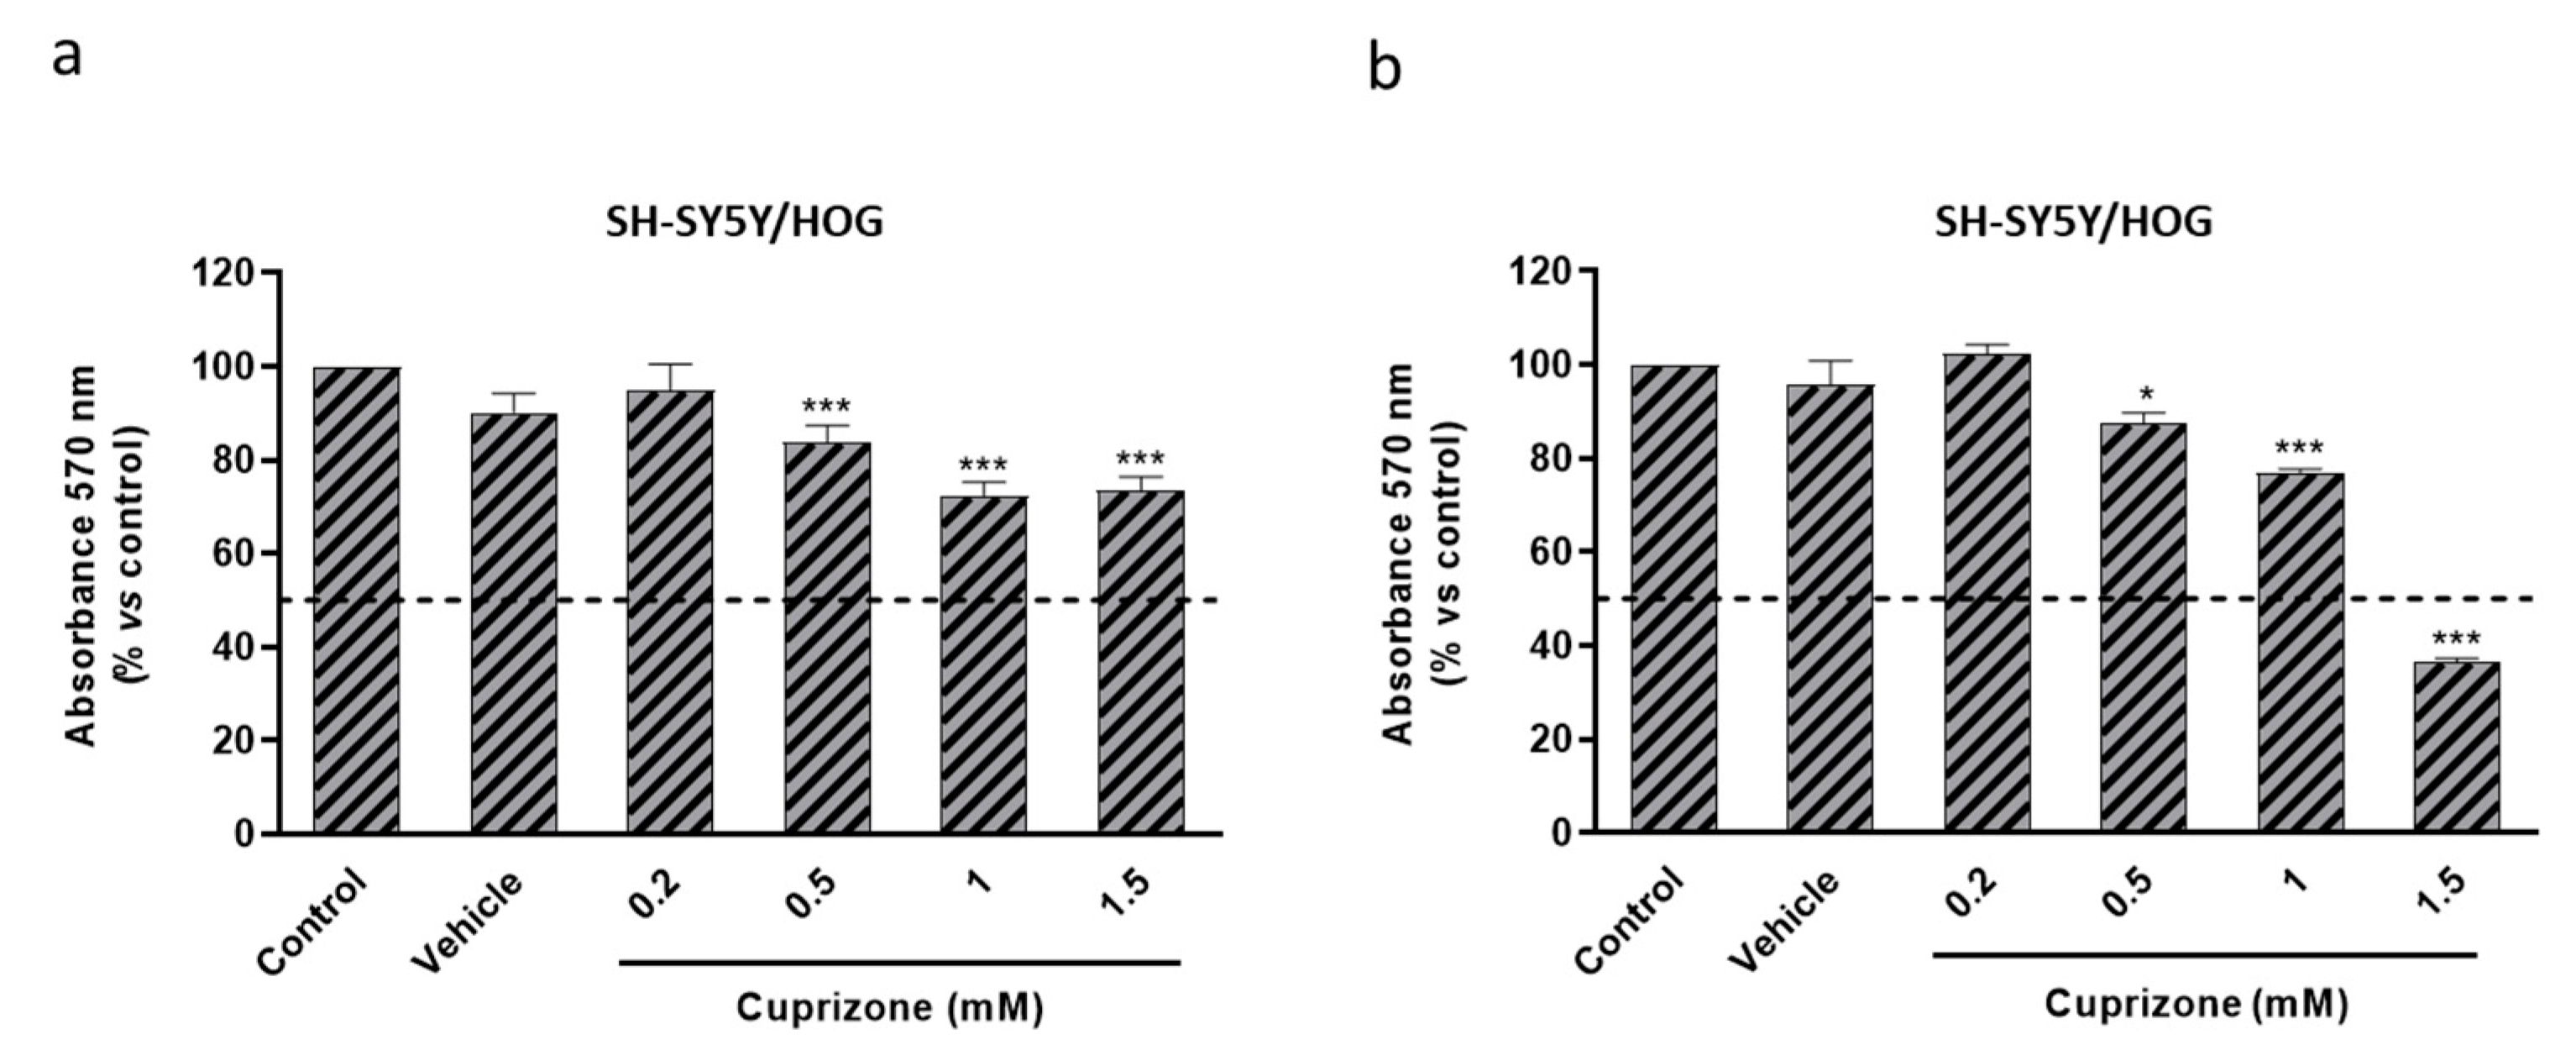
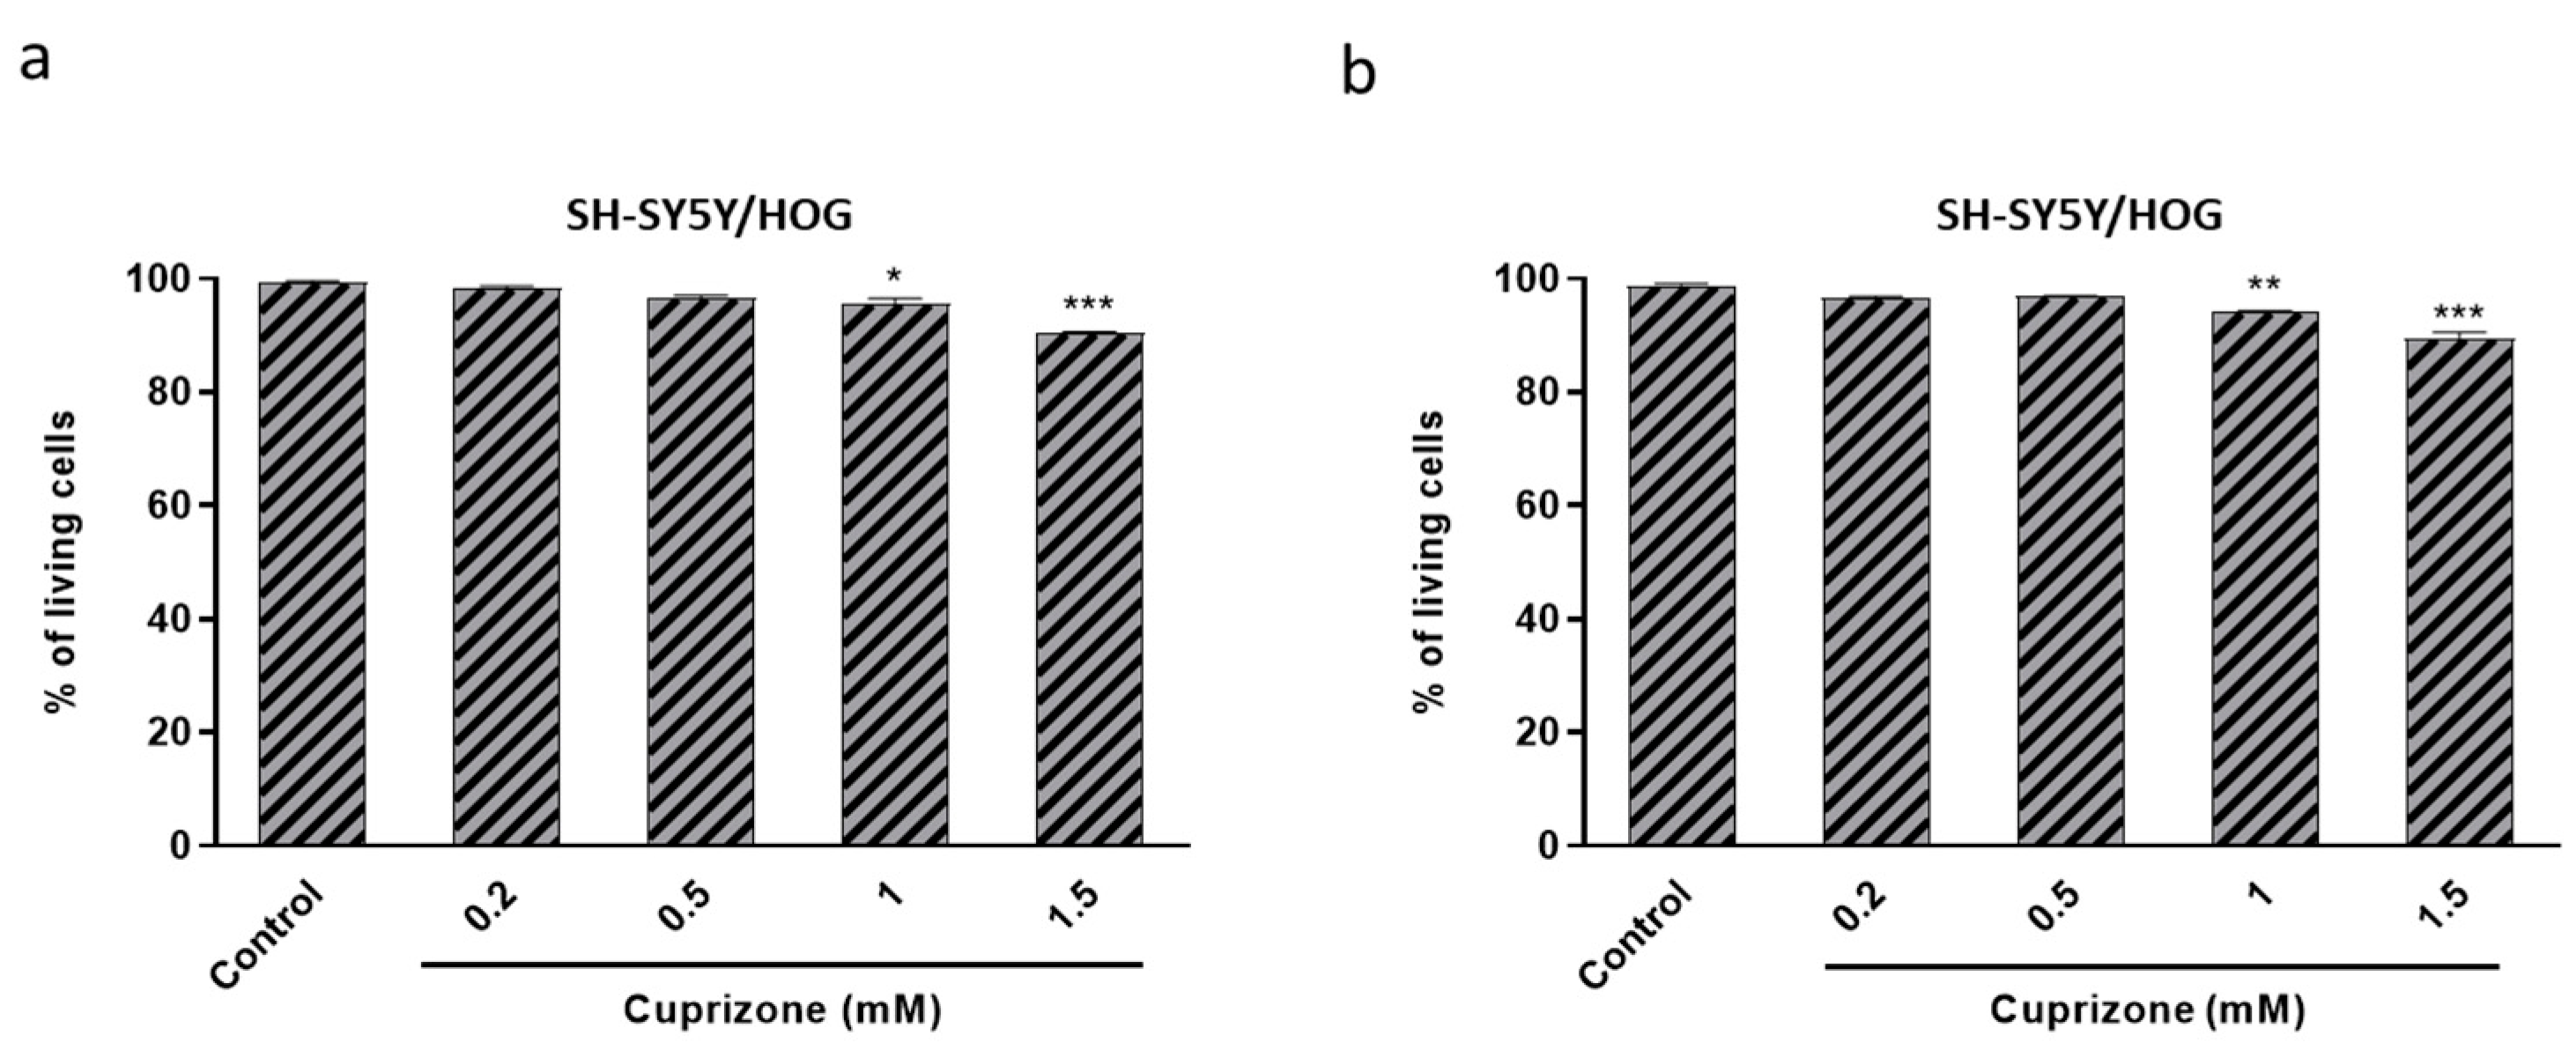
3.3. Cuprizone Alters Mitochondrial Function but Does Not Cause Death in SH-SY5Y/HOG Co-Cultures
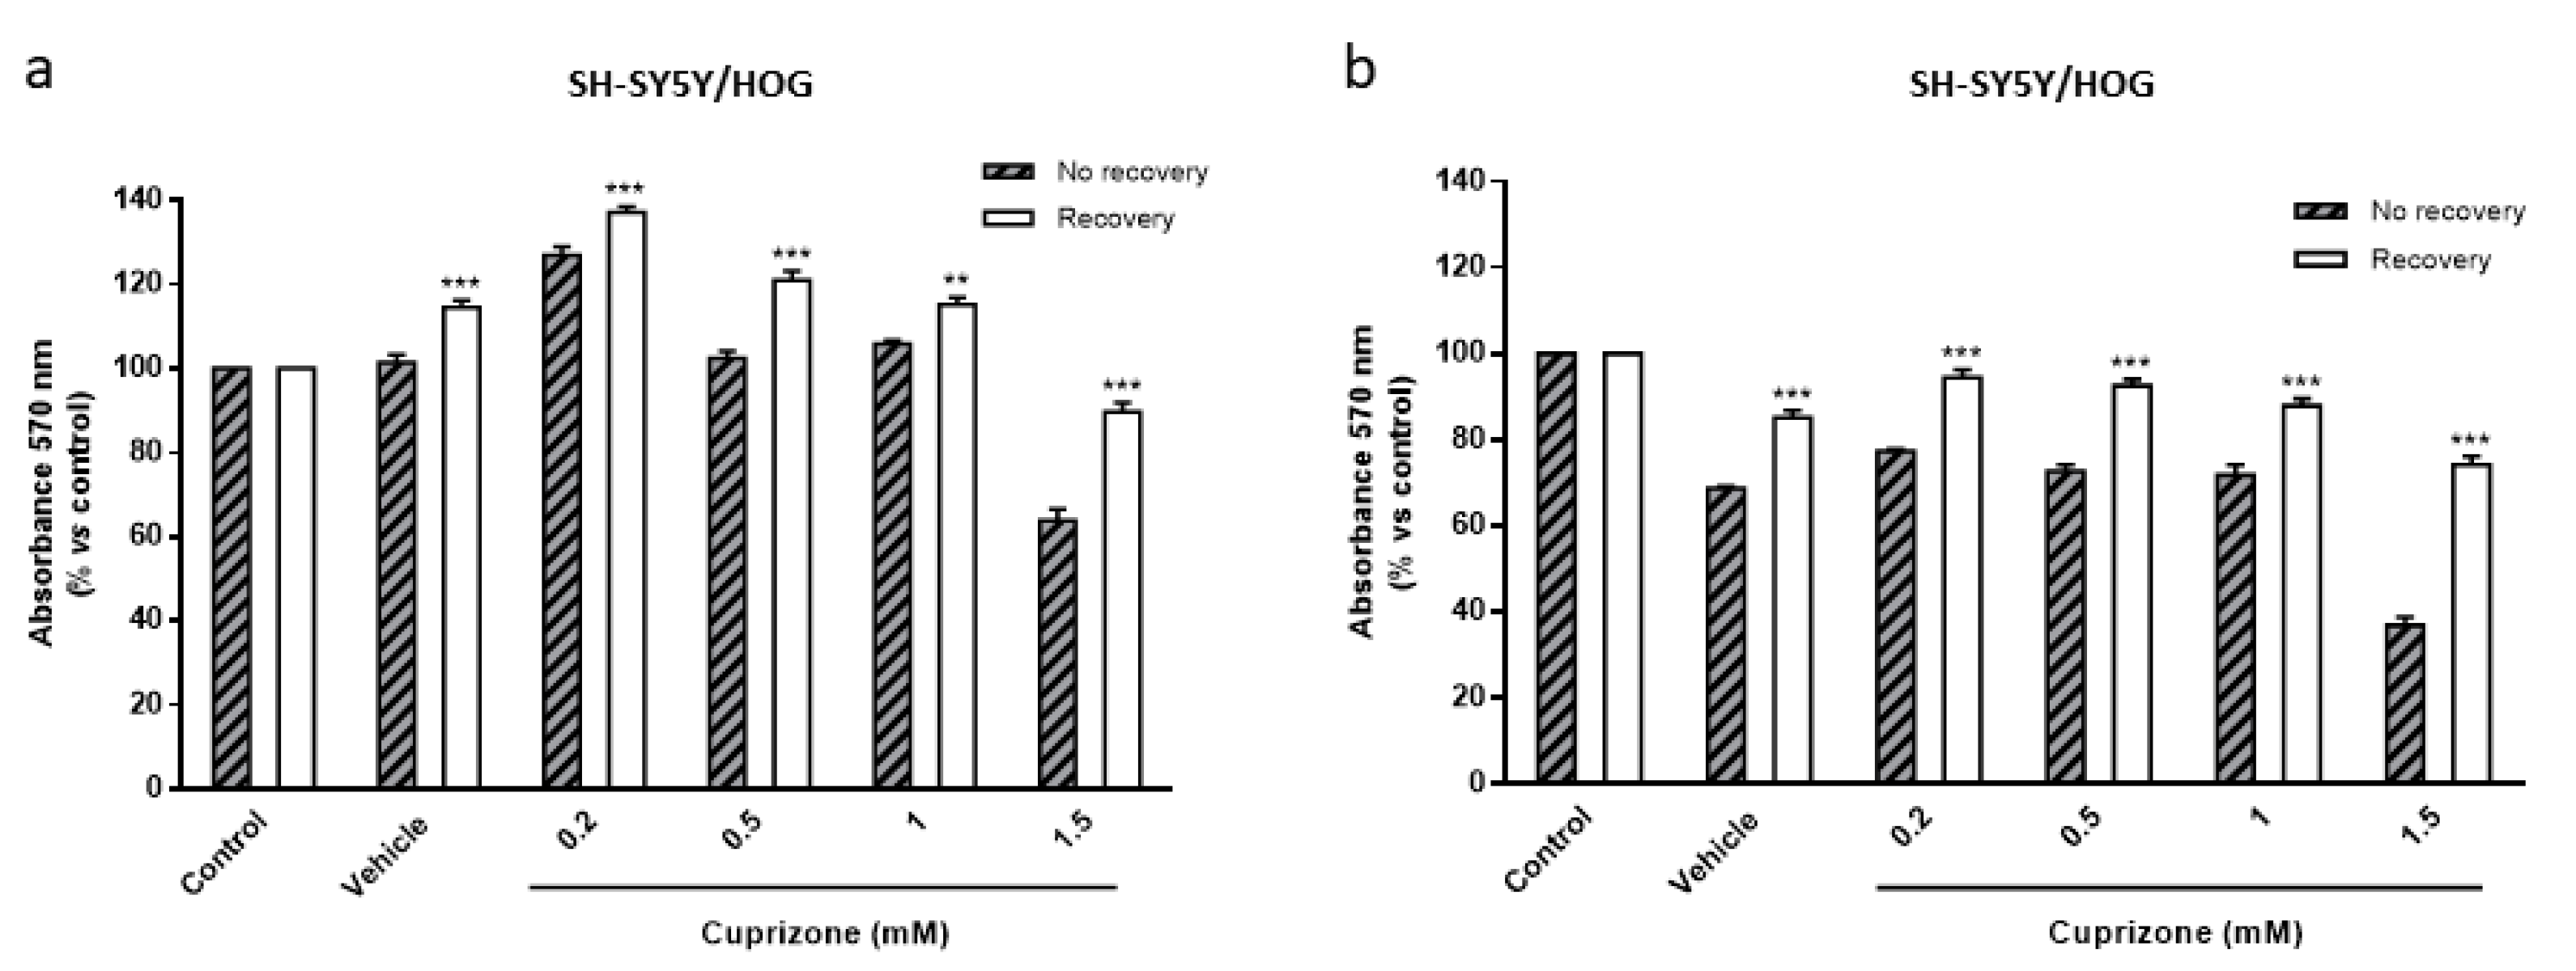
3.4. The Loss of Cell Viability Caused by Cuprizone in SH-SY5Y/HOG Co-Cultures Is Reverted Once the Treatment Is Suspended
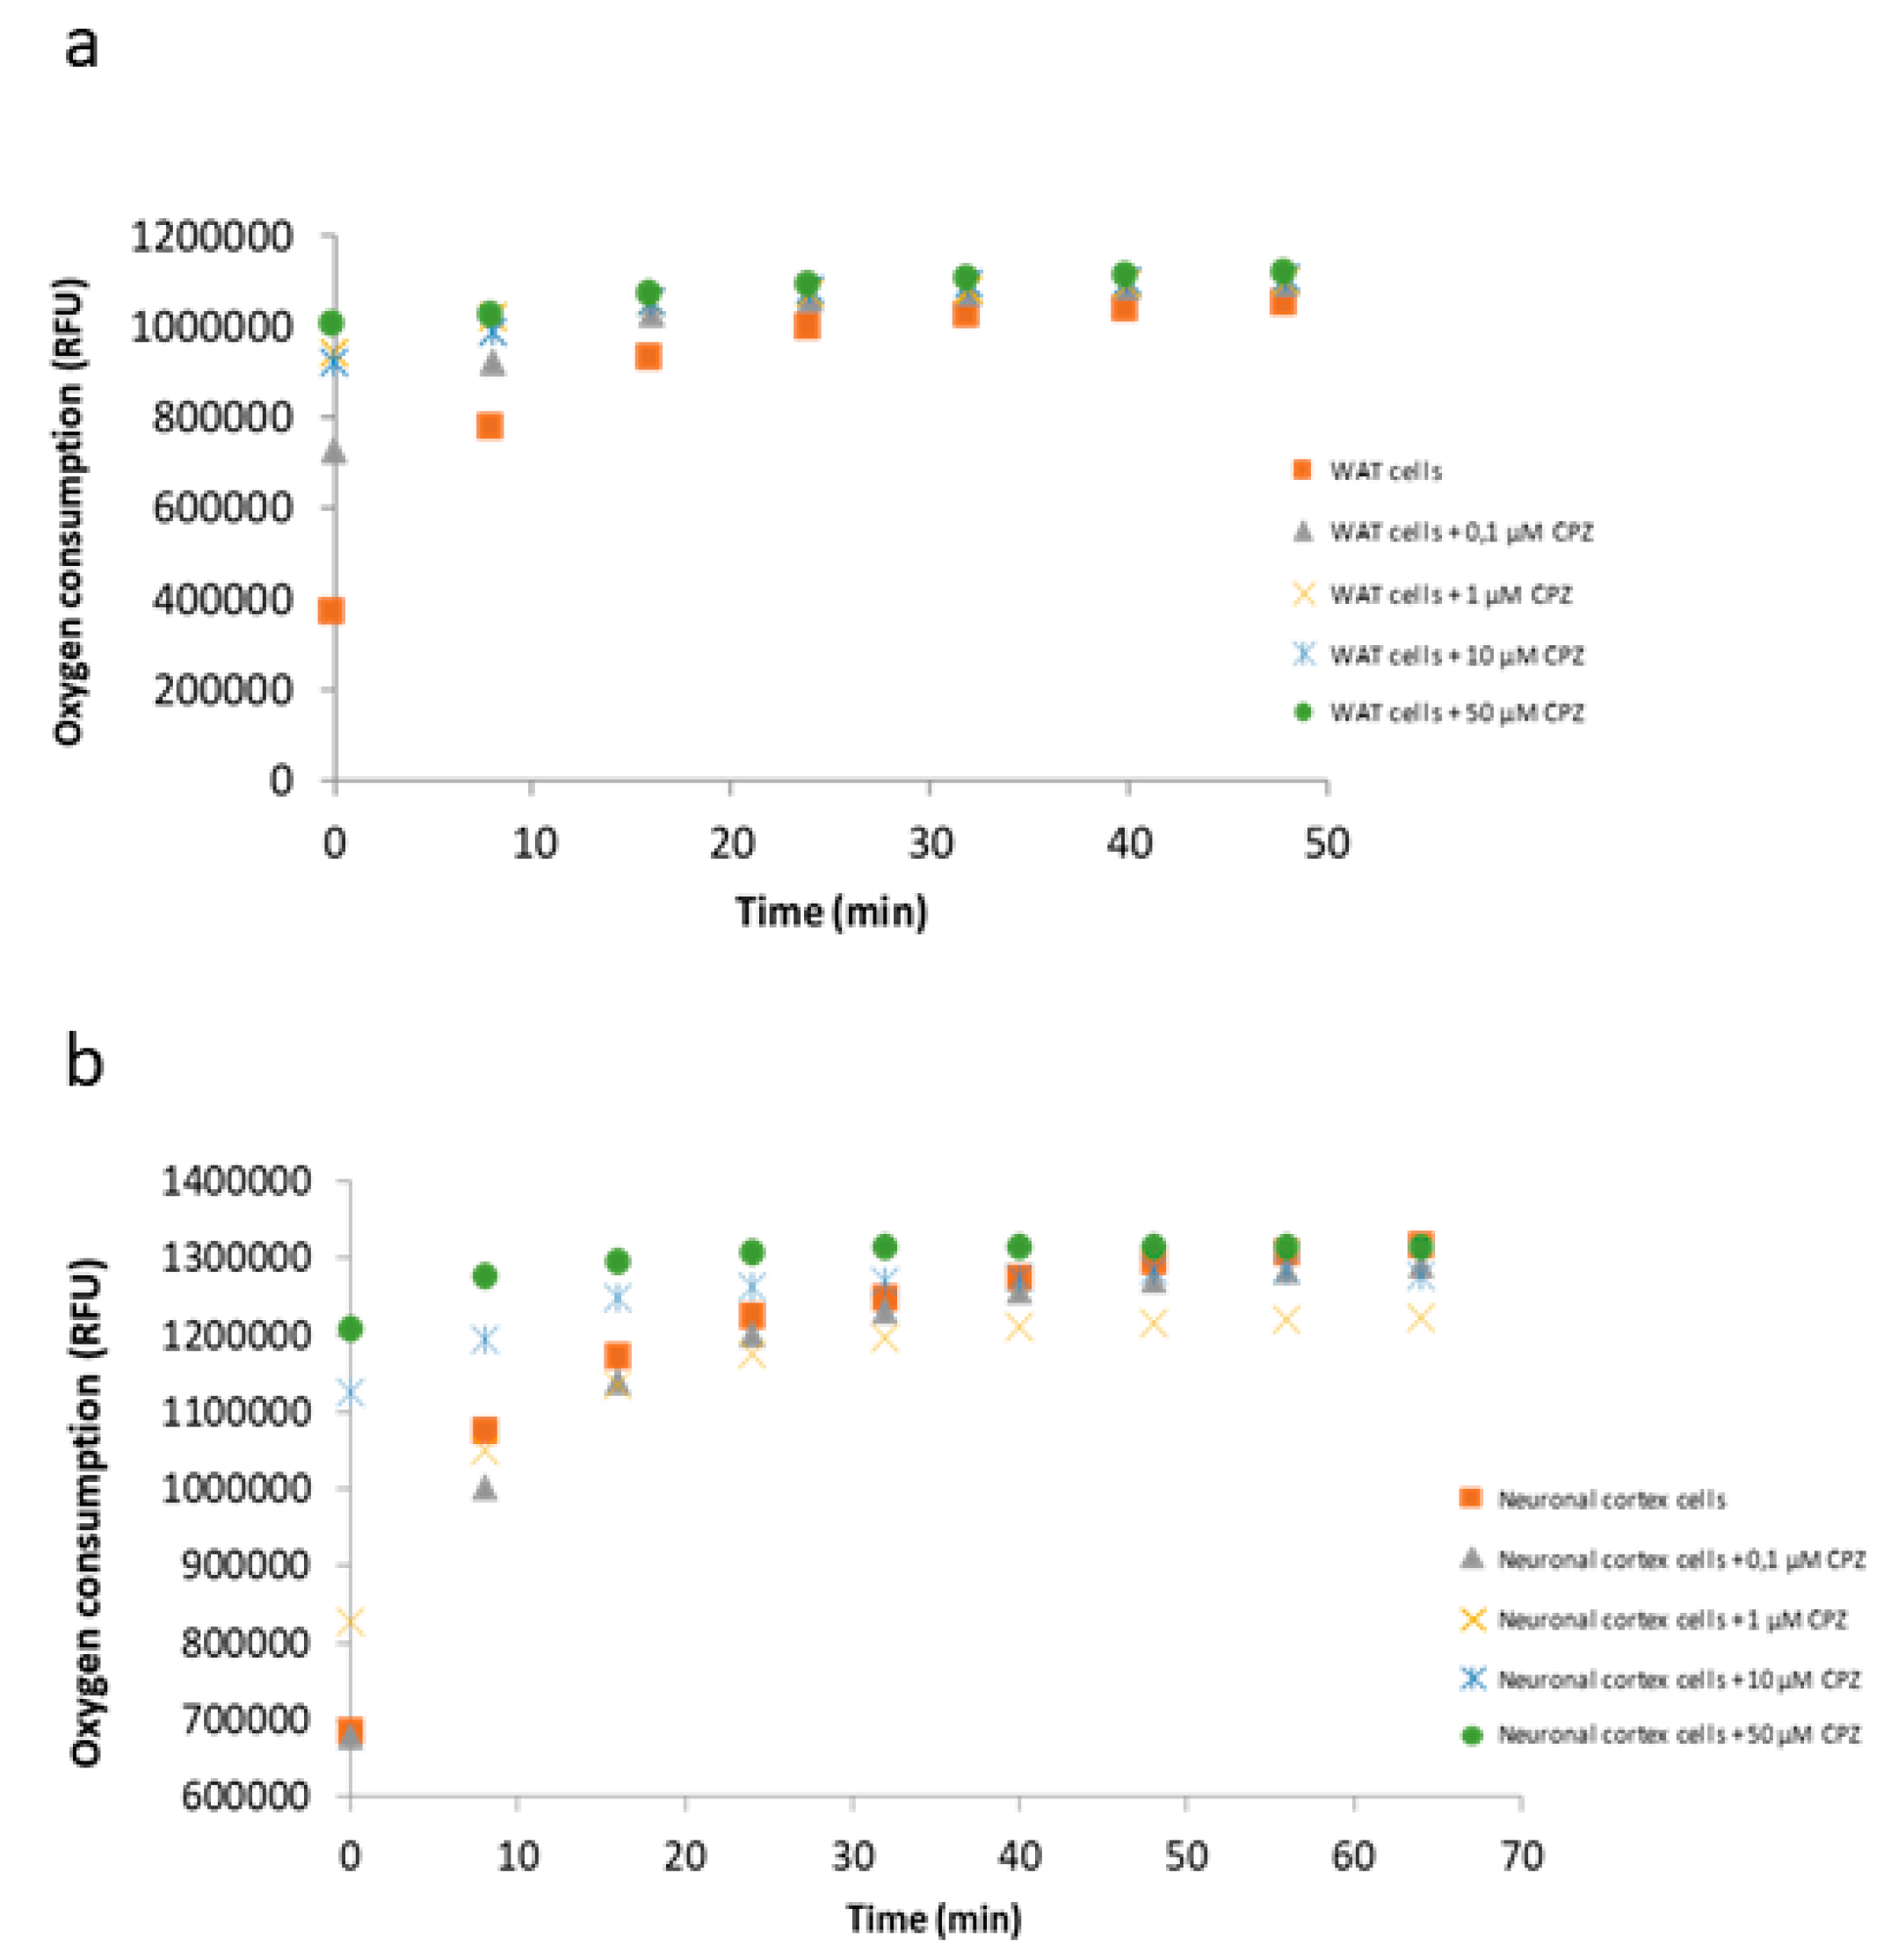
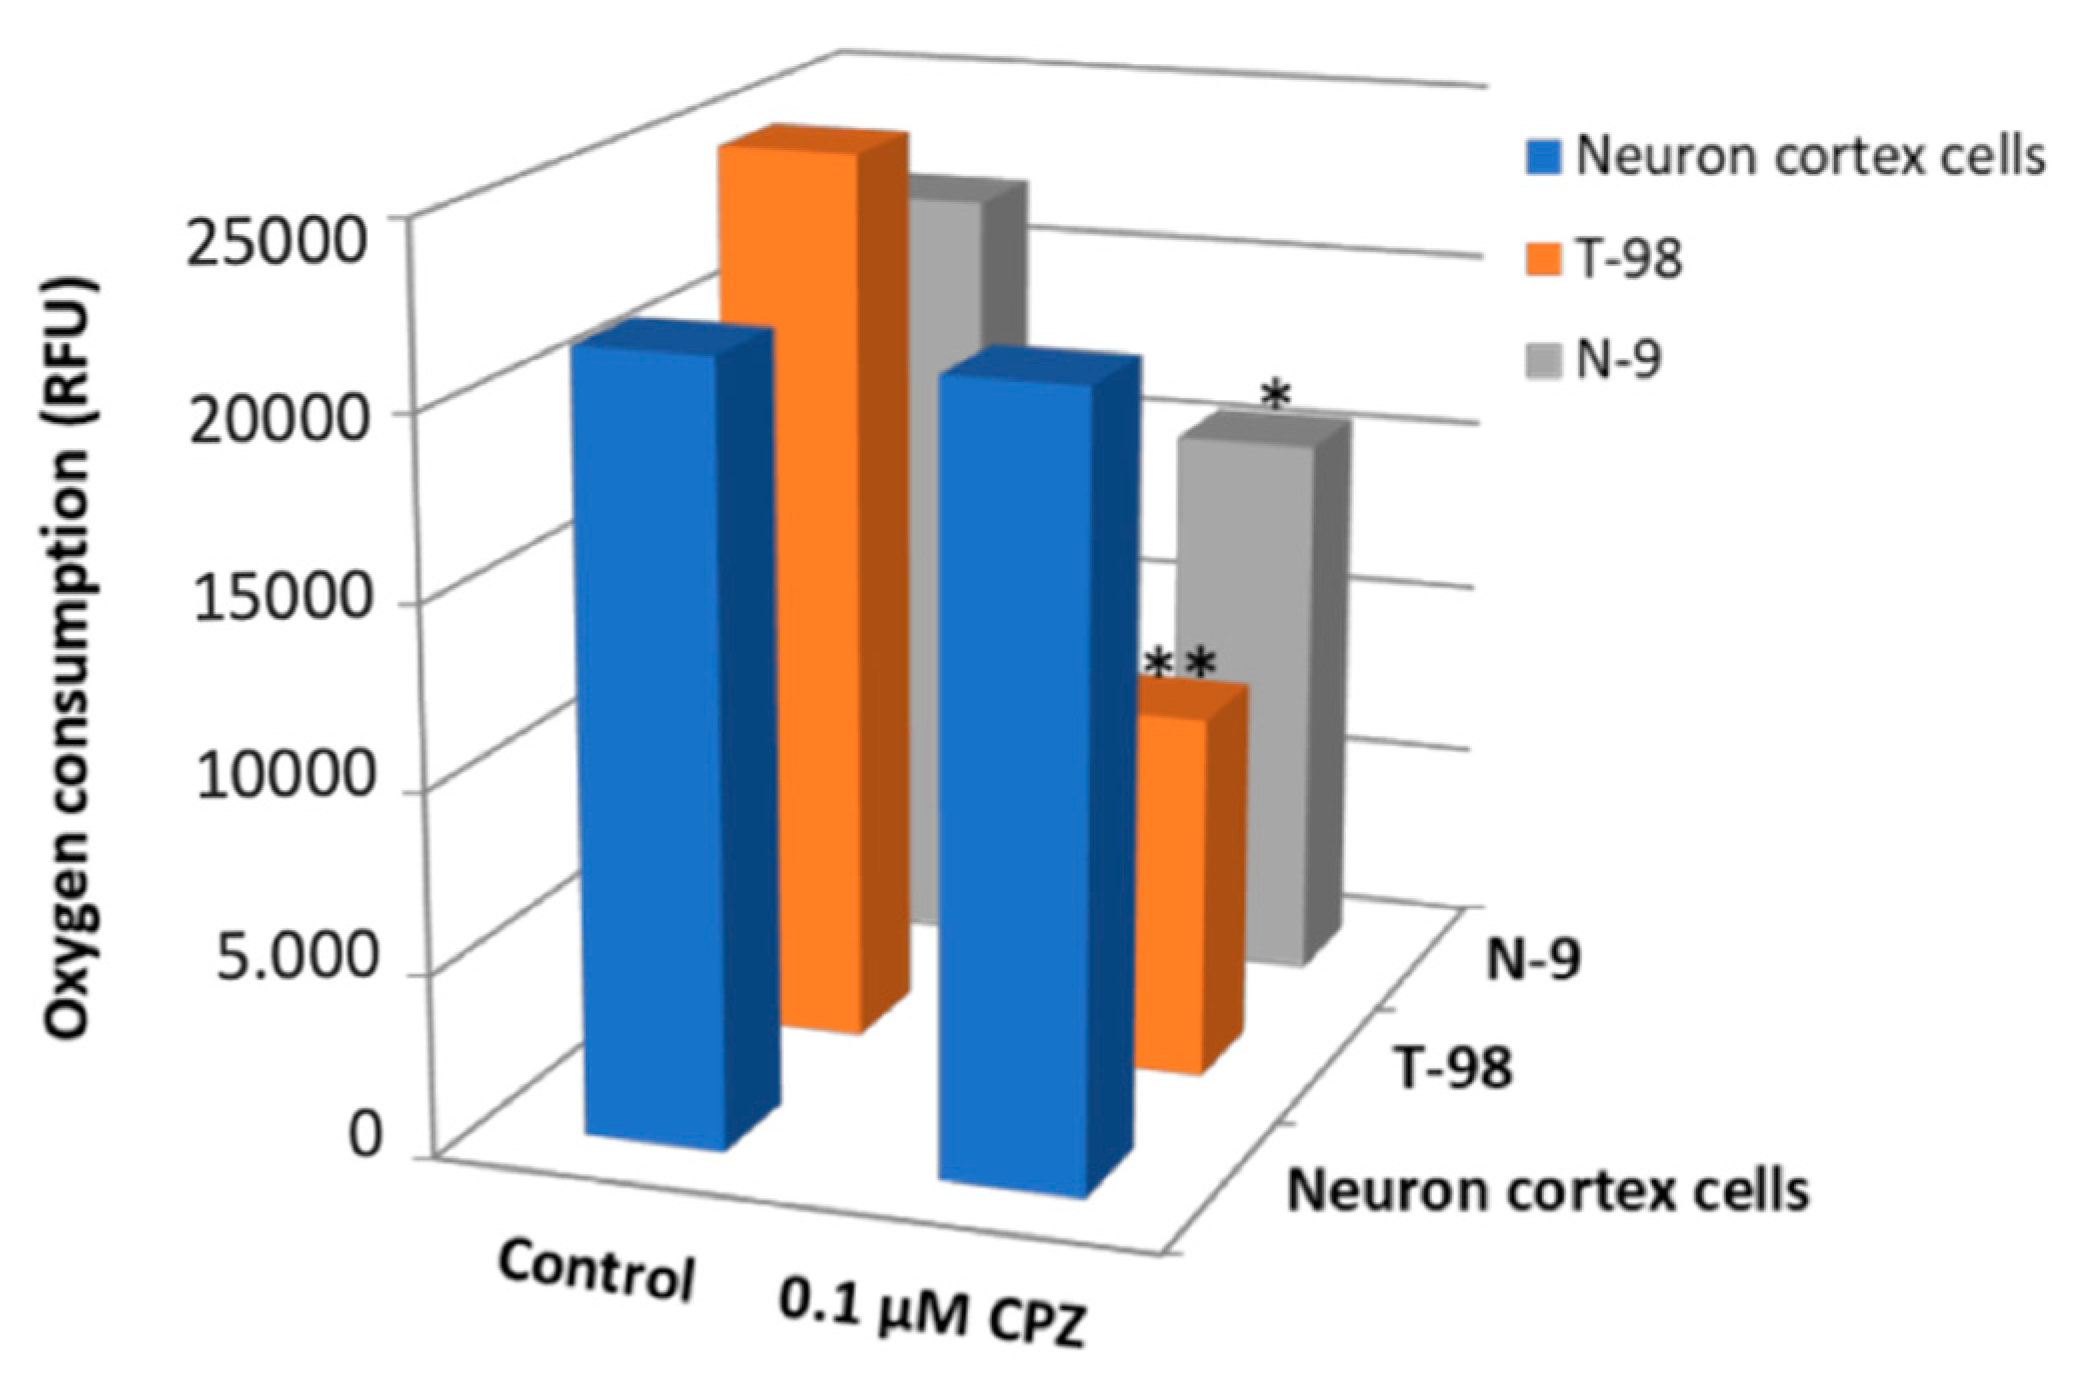
3.5. Oxygen Consumption by the Electron Transport Chain Is Reduced upon CPZ Treatment
4. Discussion
Author Contributions
Funding
Institutional Review Board Statement
Informed Consent Statement
Data Availability Statement
Conflicts of Interest
References
- Ray Dorsey, E.; Elbaz, A.; Nichols, E.; Abd-Allah, F.; Abdelalim, A.; Adsuar, J.C.; Ansha, M.G.; Brayne, C.; Choi, J.Y.J.; Collado-Mateo, D.; et al. Global, regional, and national burden of Parkinson’s disease, 1990–2016: A systematic analysis for the Global Burden of Disease Study 2016. Lancet Neurol. 2018, 17, 939–953. [Google Scholar] [CrossRef]
- Gelfand, J.M. Multiple sclerosis: Diagnosis, differential diagnosis, and clinical presentation. In Handbook of Clinical Neurology; Elsevier B.V.: Amsterdam, The Netherlands, 2014; Volume 122, pp. 269–290. [Google Scholar]
- Noseworthy, J.H.; Lucchinetti, C.; Rodriguez, M.; Weinshenker, B.G. Multiple sclerosis. N. Engl. J. Med. 2000, 343, 938–952. [Google Scholar] [CrossRef] [PubMed]
- Correale, J.; Gaitán, M.I.; Ysrraelit, M.C.; Fiol, M.P. Progressive multiple sclerosis: From pathogenic mechanisms to treatment. Brain 2017, 140, 527–546. [Google Scholar] [CrossRef] [PubMed]
- Lublin, F.D.; Reingold, S.C.; Cohen, J.A.; Cutter, G.R.; Sørensen, P.S.; Thompson, A.J.; Wolinsky, J.S.; Balcer, L.J.; Banwell, B.; Barkhof, F.; et al. Defining the clinical course of multiple sclerosis: The 2013 revisions. Neurology 2014, 83, 278–286. [Google Scholar] [CrossRef] [PubMed]
- Goldberg, P.; Fleming, M.C.; Picard, E.H. Multiple sclerosis: Decreased relapse rate through dietary supplementation with calcium, magnesium and vitamin D. Med. Hypotheses 1986, 21, 193–200. [Google Scholar] [CrossRef]
- Kappos, L.; Bar-Or, A.; Cree, B.A.C.; Fox, R.J.; Giovannoni, G.; Gold, R.; Vermersch, P.; Arnold, D.L.; Arnould, S.; Scherz, T.; et al. Siponimod versus placebo in secondary progressive multiple sclerosis (EXPAND): A double-blind, randomised, phase 3 study. Lancet 2018, 391, 1263–1273. [Google Scholar] [CrossRef]
- Leibowitz, S.M.; Yan, J. NF-κB pathways in the pathogenesis of multiple sclerosis and the therapeutic implications. Front. Mol. Neurosci. 2016, 9. [Google Scholar] [CrossRef]
- Ontaneda, D.; Hyland, M.; Cohen, J.A. Multiple Sclerosis: New Insights in Pathogenesis and Novel Therapeutics. Annu. Rev. Med. 2012, 63, 389–404. [Google Scholar] [CrossRef]
- Vandenbark, A.A.; Culbertson, N.E.; Bartholomew, R.M.; Huan, J.; Agotsch, M.; LaTocha, D.; Yadav, V.; Mass, M.; Whitham, R.; Lovera, J.; et al. Therapeutic vaccination with a trivalent T-cell receptor (TCR) peptide vaccine restores deficient FoxP3 expression and TCR recognition in subjects with multiple sclerosis. Immunology 2008, 123, 66–78. [Google Scholar] [CrossRef]
- Barkhof, F.; Hulst, H.E.; Drulović, J.; Uitdehaag, B.M.J.; Matsuda, K.; Landin, R. Ibudilast in relapsing-remitting multiple sclerosis: A neuroprotectant? Neurology 2010, 74, 1033–1040. [Google Scholar] [CrossRef]
- Brown, J.W.L.; Coles, A.; Horakova, D.; Havrdova, E.; Izquierdo, G.; Prat, A.; Girard, M.; Duquette, P.; Trojano, M.; Lugaresi, A.; et al. Association of Initial Disease-Modifying Therapy with Later Conversion to Secondary Progressive Multiple Sclerosis. JAMA 2019, 321, 175–187. [Google Scholar] [CrossRef]
- Burton, J.M.; Kimball, S.; Vieth, R.; Bar-Or, A.; Dosch, H.M.; Cheung, R.; Gagne, D.; D’Souza, C.; Ursell, M.; O’Connor, P. A phase I/II dose-escalation trial of vitamin D3 and calcium in multiple sclerosis. Neurology 2010, 74, 1852–1859. [Google Scholar] [CrossRef]
- Frau, J.; Coghe, G.; Lorefice, L.; Fenu, G.; Cocco, E. New horizons for multiple sclerosis therapeutics: Milestones in the development of ocrelizumab. Neuropsychiatr. Dis. Treat. 2018, 14, 1093–1099. [Google Scholar] [CrossRef]
- Ontaneda, D.; Fox, R.J.; Chataway, J. Clinical trials in progressive multiple sclerosis: Lessons learned and future perspectives. Lancet Neurol. 2015, 14, 208–223. [Google Scholar] [CrossRef]
- Reich, D.S.; Lucchinetti, C.F.; Calabresi, P.A. Multiple sclerosis. N. Engl. J. Med. 2018, 378, 169–180. [Google Scholar] [CrossRef] [PubMed]
- Stys, P.K.; Zamponi, G.W.; Van Minnen, J.; Geurts, J.J.G. Will the real multiple sclerosis please stand up? Nat. Rev. Neurosci. 2012, 13, 507–514. [Google Scholar] [CrossRef]
- Caprariello, A.V.; Rogers, J.A.; Morgan, M.L.; Hoghooghi, V.; Plemel, J.R.; Koebel, A.; Tsutsui, S.; Dunn, J.F.; Kotra, L.P.; Ousman, S.S.; et al. Biochemically altered myelin triggers autoimmune demyelination. Proc. Natl. Acad. Sci. USA 2018, 115, 5528–5533. [Google Scholar] [CrossRef]
- Titus, H.E.; Chen, Y.; Podojil, J.R.; Robinson, A.P.; Balabanov, R.; Popko, B.; Miller, S.D. Pre-clinical and Clinical Implications of “Inside-Out” vs. “Outside-In” Paradigms in Multiple Sclerosis Etiopathogenesis. Front. Cell. Neurosci. 2020, 14, 599717. [Google Scholar] [CrossRef]
- van Der Star, B.; Vogel, D.; Kipp, M.; Puentes, F.; Baker, D.; Amor, S. In Vitro and In Vivo Models of Multiple Sclerosis. CNS Neurol. Disord. Drug Targets 2012, 11, 570–588. [Google Scholar] [CrossRef]
- Palumbo, S.; Pellegrini, S. Experimental In Vivo Models of Multiple Sclerosis: State of the Art. In Multiple Sclerosis: Perspectives in Treatment and Pathogenesis; Codon Publications: Brisbane, Australia, 2017; pp. 173–183. ISBN 9780994438133. [Google Scholar]
- Procaccini, C.; De Rosa, V.; Pucino, V.; Formisano, L.; Matarese, G. Animal models of Multiple Sclerosis. Eur. J. Pharmacol. 2015, 759, 182–191. [Google Scholar] [CrossRef]
- Denic, A.; Johnson, A.J.; Bieber, A.J.; Warrington, A.E.; Rodriguez, M.; Pirko, I. The relevance of animal models in multiple sclerosis research. Pathophysiology 2011, 18, 21–29. [Google Scholar] [CrossRef]
- Nyamoya, S.; Schweiger, F.; Kipp, M.; Hochstrasser, T. Cuprizone as a model of myelin and axonal damage. Drug Discov. Today Dis. Model. 2017, 25–26, 63–68. [Google Scholar] [CrossRef]
- Vega-Riquer, J.M.; Mendez-Victoriano, G.; Morales-Luckie, R.A.; Gonzalez-Perez, O. Five Decades of Cuprizone, an Updated Model to Replicate Demyelinating Diseases. Curr. Neuropharmacol. 2019, 17, 129–141. [Google Scholar] [CrossRef]
- Praet, J.; Guglielmetti, C.; Berneman, Z.; Van der Linden, A.; Ponsaerts, P. Cellular and molecular neuropathology of the cuprizone mouse model: Clinical relevance for multiple sclerosis. Neurosci. Biobehav. Rev. 2014, 47, 485–505. [Google Scholar] [CrossRef] [PubMed]
- Carlton, W.W. Spongiform encephalopathy induced in rats and guinea pigs by cuprizone. Exp. Mol. Pathol. 1969, 10, 274–287. [Google Scholar] [CrossRef]
- Messori, L.; Casini, A.; Gabbiani, C.; Sorace, L.; Muniz-Miranda, M.; Zatta, P. Unravelling the chemical nature of copper cuprizone. Dalt. Trans. 2007, 2112–2114. [Google Scholar] [CrossRef]
- Post, G.R.; Dawson, G. Characterization of a cell line derived from a human oligodendroglioma. Mol. Chem. Neuropathol. 1992, 16, 303–317. [Google Scholar] [CrossRef] [PubMed]
- Bello-Morales, R.; Crespillo, A.J.; García, B.; Dorado, L.Á.; Martín, B.; Tabarés, E.; Krummenacher, C.; De Castro, F.; López-Guerrero, J.A. The effect of cellular differentiation on HSV-1 infection of oligodendrocytic cells. PLoS ONE 2014, 9. [Google Scholar] [CrossRef]
- Hradsky, J.; Mikhaylova, M.; Karpova, A.; Kreutz, M.R.; Zuschratter, W. Super-resolution microscopy of the neuronal calcium-binding proteins calneuron-1 and caldendrin. Methods Mol. Biol. 2013, 963, 147–169. [Google Scholar] [CrossRef]
- Bénardais, K.; Kotsiari, A.; Škuljec, J.; Koutsoudaki, P.N.; Gudi, V.; Singh, V.; Vulinović, F.; Skripuletz, T.; Stangel, M. Cuprizone [bis(cyclohexylidenehydrazide)] is selectively toxic for mature oligodendrocytes. Neurotox. Res. 2013, 24, 244–250. [Google Scholar] [CrossRef]
- Cammer, W. The neurotoxicant, cuprizone, retards the differentiation of oligodendrocytes in vitro. J. Neurol. Sci. 1999, 168, 116–120. [Google Scholar] [CrossRef]
- Martínez-Pinilla, E.; Aguinaga, D.; Navarro, G.; Rico, A.J.; Oyarzábal, J.; Sánchez-Arias, J.A.; Lanciego, J.L.; Franco, R. Targeting CB1 and GPR55 Endocannabinoid Receptors as a Potential Neuroprotective Approach for Parkinson’s Disease. Mol. Neurobiol. 2019, 56, 5900–5910. [Google Scholar] [CrossRef]
- Hynes, J.; Floyd, S.; Soini, A.E.; O’Connor, R.; Papkovskyi, D.B. Fluorescence-based cell viability screening assays using water-soluble oxygen probes. J. Biomol. Screen. 2003, 8, 264–272. [Google Scholar] [CrossRef]
- Martínez, E.; Navarro, A.; Ordóñez, C.; Del Valle, E.; Tolivia, J. Oxidative stress induces apolipoprotein d overexpression in hippocampus during aging and alzheimer’s disease. J. Alzheimer’s Dis. 2013, 36, 129–144. [Google Scholar] [CrossRef]
- Palumbo, S. Pathogenesis and Progression of Multiple Sclerosis: The Role of Arachidonic Acid–Mediated Neuroinflammation. In Multiple Sclerosis: Perspectives in Treatment and Pathogenesis; Codon Publications: Brisbane, Queensland, Australia, 2017; pp. 111–124. [Google Scholar]
- Buntinx, M.; Vanderlocht, J.; Hellings, N.; Vandenabeele, F.; Lambrichts, I.; Raus, J.; Ameloot, M.; Stinissen, P.; Steels, P. Characterization of three human oligodendroglial cell lines as a model to study oligodendrocyte injury: Morphology and oligodendrocyte-specific gene expression. J. Neurocytol. 2003, 32, 25–38. [Google Scholar] [CrossRef] [PubMed]
- Martínez-Pinilla, E.; Rubio-Sardón, N.; Peláez, R.; García-Álvarez, E.; Del Valle, E.; Tolivia, J.; Larráyoz, I.M.; Navarro, A. Neuroprotective Effect of Apolipoprotein D in Cuprizone-Induced Cell Line Models: A Potential Therapeutic Approach for Multiple Sclerosis and Demyelinating Diseases. Int. J. Mol. Sci. 2021, 22, 1260. [Google Scholar] [CrossRef] [PubMed]
- Torkildsen, Ø.; Brunborg, L.A.; Myhr, K.-M.; Bø, L. The cuprizone model for demyelination. Acta Neurol. Scand. 2008, 117, 72–76. [Google Scholar] [CrossRef]
- Benetti, F.; Ventura, M.; Salmini, B.; Ceola, S.; Carbonera, D.; Mammi, S.; Zitolo, A.; D’Angelo, P.; Urso, E.; Maffia, M.; et al. Cuprizone neurotoxicity, copper deficiency and neurodegeneration. Neurotoxicology 2010, 31, 509–517. [Google Scholar] [CrossRef]
- Taraboletti, A.; Walker, T.; Avila, R.; Huang, H.; Caporoso, J.; Manandhar, E.; Leeper, T.C.; Modarelli, D.A.; Medicetty, S.; Shriver, L.P. Cuprizone Intoxication Induces Cell Intrinsic Alterations in Oligodendrocyte Metabolism Independent of Copper Chelation. Biochemistry 2017, 56, 1518–1528. [Google Scholar] [CrossRef]
- Chen, J.L.; Steele, T.W.J.; Stuckey, D.C. Metabolic reduction of resazurin; location within the cell for cytotoxicity assays. Biotechnol. Bioeng. 2018, 115, 351–358. [Google Scholar] [CrossRef]
- O’Brien, J.; Wilson, I.; Orton, T.; Pognan, F. Investigation of the Alamar Blue (resazurin) fluorescent dye for the assessment of mammalian cell cytotoxicity. Eur. J. Biochem. 2000, 267, 5421–5426. [Google Scholar] [CrossRef]
- Uzarski, J.S.; DiVito, M.D.; Wertheim, J.A.; Miller, W.M. Essential design considerations for the resazurin reduction assay to noninvasively quantify cell expansion within perfused extracellular matrix scaffolds. Biomaterials 2017, 129, 163–175. [Google Scholar] [CrossRef] [PubMed]
- Buschmann, J.P.; Berger, K.; Awad, H.; Clarner, T.; Beyer, C.; Kipp, M. Inflammatory response and chemokine expression in the white matter corpus callosum and gray matter cortex region during cuprizone-induced demyelination. J. Mol. Neurosci. 2012, 48, 66–76. [Google Scholar] [CrossRef] [PubMed]
- Liu, L.; Belkadi, A.; Darnall, L.; Hu, T.; Drescher, C.; Cotleur, A.C.; Padovani-Claudio, D.; He, T.; Choi, K.; Lane, T.E.; et al. CXCR2-positive neutrophils are essential for cuprizone-induced demyelination: Relevance to multiple sclerosis. Nat. Neurosci. 2010, 13, 319–326. [Google Scholar] [CrossRef]
- Fünfschilling, U.; Supplie, L.M.; Mahad, D.; Boretius, S.; Saab, A.S.; Edgar, J.; Brinkmann, B.G.; Kassmann, C.M.; Tzvetanova, I.D.; Möbius, W.; et al. Glycolytic oligodendrocytes maintain myelin and long-term axonal integrity. Nature 2012, 485, 517–521. [Google Scholar] [CrossRef] [PubMed]
- Lassmann, H.; Van Horssen, J. Oxidative stress and its impact on neurons and glia in multiple sclerosis lesions. Biochim. Biophys. Acta Mol. Basis Dis. 2016, 1862, 506–510. [Google Scholar] [CrossRef]
- Luo, M.; Deng, M.; Yu, Z.; Zhang, Y.; Xu, S.; Hu, S.; Xu, H. Differential Susceptibility and Vulnerability of Brain Cells in C57BL/6 Mouse to Mitochondrial Dysfunction Induced by Short-Term Cuprizone Exposure. Front. Neuroanat. 2020, 14, 30. [Google Scholar] [CrossRef]
- Hyung, S.; Yoon Lee, B.; Park, J.C.; Kim, J.; Hur, E.M.; Francis Suh, J.K. Coculture of Primary Motor Neurons and Schwann Cells as a Model for in Vitro Myelination. Sci. Rep. 2015, 5, 15122. [Google Scholar] [CrossRef]
- Kolahdouzan, M.; Futhey, N.C.; Kieran, N.W.; Healy, L.M. Novel Molecular Leads for the Prevention of Damage and the Promotion of Repair in Neuroimmunological Disease. Front. Immunol. 2019, 10, 1657. [Google Scholar] [CrossRef]
- Hillis, J.M.; Davies, J.; Mundim, M.V.; Al-Dalahmah, O.; Szele, F.G. Cuprizone demyelination induces a unique inflammatory response in the subventricular zone. J. Neuroinflammation 2016, 13, 190. [Google Scholar] [CrossRef]
- Gudi, V.; Gingele, S.; Skripuletz, T.; Stangel, M. Glial response during cuprizone-induced de- and remyelination in the CNS: Lessons learned. Front. Cell. Neurosci. 2014, 8. [Google Scholar] [CrossRef] [PubMed]
- Pasquini, L.A.; Calatayud, C.A.; Bertone Uña, A.L.; Millet, V.; Pasquini, J.M.; Soto, E.F. The neurotoxic effect of cuprizone on oligodendrocytes depends on the presence of pro-inflammatory cytokines secreted by microglia. Neurochem. Res. 2007, 32, 279–292. [Google Scholar] [CrossRef] [PubMed]
- Matsushima, G.K.; Morell, P. The Neurotoxicant, Cuprizone, as a Model to Study Demyelination and Remyelination in the Central Nervous System. Brain Pathol. 2006, 11, 107–116. [Google Scholar] [CrossRef] [PubMed]
- Patergnani, S.; Fossati, V.; Bonora, M.; Giorgi, C.; Marchi, S.; Missiroli, S.; Rusielewicz, T.; Wieckowski, M.R.; Pinton, P. Mitochondria in Multiple Sclerosis: Molecular Mechanisms of Pathogenesis. In International Review of Cell and Molecular Biology; Elsevier Inc.: Amsterdam, The Netherlands, 2017; Volume 328, pp. 49–103. [Google Scholar]
- Moldovan, N.; Al-Ebraheem, A.; Lobo, L.; Park, R.; Farquharson, M.J.; Bock, N.A. Altered transition metal homeostasis in the cuprizone model of demyelination. Neurotoxicology 2015, 48, 1–8. [Google Scholar] [CrossRef] [PubMed]
- Hesse, A.; Wagner, M.; Held, J.; Brück, W.; Salinas-Riester, G.; Hao, Z.; Waisman, A.; Kuhlmann, T. In toxic demyelination oligodendroglial cell death occurs early and is FAS independent. Neurobiol. Dis. 2010, 37, 362–369. [Google Scholar] [CrossRef]


Publisher’s Note: MDPI stays neutral with regard to jurisdictional claims in published maps and institutional affiliations. |
© 2021 by the authors. Licensee MDPI, Basel, Switzerland. This article is an open access article distributed under the terms and conditions of the Creative Commons Attribution (CC BY) license (http://creativecommons.org/licenses/by/4.0/).
Share and Cite
Martínez-Pinilla, E.; Rubio-Sardón, N.; Villar-Conde, S.; Navarro, G.; del Valle, E.; Tolivia, J.; Franco, R.; Navarro, A. Cuprizone-Induced Neurotoxicity in Human Neural Cell Lines Is Mediated by a Reversible Mitochondrial Dysfunction: Relevance for Demyelination Models. Brain Sci. 2021, 11, 272. https://doi.org/10.3390/brainsci11020272
Martínez-Pinilla E, Rubio-Sardón N, Villar-Conde S, Navarro G, del Valle E, Tolivia J, Franco R, Navarro A. Cuprizone-Induced Neurotoxicity in Human Neural Cell Lines Is Mediated by a Reversible Mitochondrial Dysfunction: Relevance for Demyelination Models. Brain Sciences. 2021; 11(2):272. https://doi.org/10.3390/brainsci11020272
Chicago/Turabian StyleMartínez-Pinilla, Eva, Núria Rubio-Sardón, Sandra Villar-Conde, Gemma Navarro, Eva del Valle, Jorge Tolivia, Rafael Franco, and Ana Navarro. 2021. "Cuprizone-Induced Neurotoxicity in Human Neural Cell Lines Is Mediated by a Reversible Mitochondrial Dysfunction: Relevance for Demyelination Models" Brain Sciences 11, no. 2: 272. https://doi.org/10.3390/brainsci11020272
APA StyleMartínez-Pinilla, E., Rubio-Sardón, N., Villar-Conde, S., Navarro, G., del Valle, E., Tolivia, J., Franco, R., & Navarro, A. (2021). Cuprizone-Induced Neurotoxicity in Human Neural Cell Lines Is Mediated by a Reversible Mitochondrial Dysfunction: Relevance for Demyelination Models. Brain Sciences, 11(2), 272. https://doi.org/10.3390/brainsci11020272