Abstract
Recent research on behavioral variant frontotemporal dementia (bvFTD) has shown that personality changes and executive dysfunctions are accompanied by a disease-specific anatomical pattern of cortical and subcortical atrophy. We investigated the structural topological network changes in patients with bvFTD in comparison to healthy controls. In particular, 25 bvFTD patients and 20 healthy controls underwent structural 3T MRI. Next, bilaterally averaged values of 34 cortical surface areas, 34 cortical thickness values, and six subcortical volumes were used to capture single-subject anatomical connectivity and investigate network organization using a graph theory approach. Relative to controls, bvFTD patients showed altered small-world properties and decreased global efficiency, suggesting a reduced ability to combine specialized information from distributed brain regions. At a local level, patients with bvFTD displayed lower values of local efficiency in the cortical thickness of the caudal and rostral middle frontal gyrus, rostral anterior cingulate, and precuneus, cuneus, and transverse temporal gyrus. A significant correlation was also found between the efficiency of caudal anterior cingulate thickness and Mini-Mental State Examination (MMSE) scores in bvFTD patients. Taken together, these findings confirm the selective disruption in structural brain networks of bvFTD patients, providing new insights on the association between cognitive decline and graph properties.
1. Introduction
Behavioral variant frontotemporal dementia (bvFTD) is the most common frontotemporal lobar degeneration (FTLD), accounting for more than 50% of patients with autopsy-confirmed FTLD [1]. Characterized by a progressive impairment in social function and personality [2], patients with bvFTD often show a focused atrophy in several cortical and subcortical regions, such as the anterior cingulate, insula, prefrontal cortex, anterior temporal regions, striatum, and thalamus [3,4,5]. Despite the typical clinical features and anatomical changes, bvFTD remains difficult to diagnose, and may be confused with other neurological or psychiatric disorders [6]. Thus, the development of new biomarkers to enhance the diagnostic validity of bvFTD is crucial, particularly in the early stages of the clinical work-up and for the selection of participants to pharmacological and clinical trials.
In the last decade, neuroimaging studies have supported the idea that brain abnormalities observed in several neurodegenerative diseases not only involve changes in discrete brain regions, but are also characterized in terms of an altered organization in several functionally and anatomically interconnected regions [7,8,9]. Graph theoretical methods applied to resting state fMRI (rs-fMRI) and diffusion tensor imaging (DTI) data have also allowed the modeling of the brain as a complex network, revealing important features of global and local brain organization [10,11,12,13]. In this context, previous studies have revealed that brain networks in healthy controls show a small-world topology, supporting both specialized and integrated information processing [10,14]. Although small-world properties have also been observed in patients with several brain disorders, alterations in these network measures have been reported in comparison with healthy controls [9,14,15,16,17,18,19,20,21].
In recent years, fMRI- and DTI-based brain connectivity measures have been complemented by a novel class of measurements using the inter-individual or intra-individual covariation in brain morphology (e.g., volume, thickness, or surface area) to characterize structural connectivity between regions and define large-scale brain networks (i.e., structural covariance networks) [22,23,24]. A crucial assumption underlying this procedure is that the morphological properties of interconnected brain regions would covary, since they share common developmental and maturational influences [22]. Structural covariance networks have demonstrated connectivity patterns similar to those detected in functional and diffusion-based anatomical networks [25,26]. At the same time, their construction is less sensitive to noise in comparison to those of functional and DTI-based networks [27,28], and requires relatively lower computational loads [29]. Although several studies have used brain structural covariance and graph analysis in neurodegenerative diseases [14,29,30,31,32,33], the investigation of changes in global and regional network characteristics within patients with bvFTD is still limited. To our knowledge, only one study has combined graph analysis and gray matter intensities to examine intra-individual structural covariation of the brain in bvFTD patients [34]. In that study, patients with bvFTD showed lower values of small-world properties compared to healthy controls. Lower MMSE scores were also associated with lower integration values in the right hippocampus.
In the current study, we used a new approach to human brain network mapping that leverages the increasing ability to obtain multiple morphological features from cortical and subcortical brain regions [33]. In particular, we used cortical thickness values, cortical surface areas, and subcortical volumes to capture single-subject anatomical connectivity and investigate network topology, applying a graph theory approach. We hypothesized that the structural covariance networks of patients with bvFTD should have altered global and local network properties compared to healthy controls. Considering the previously reported functional alterations and pathological damages in bvFTD, we expected changes in specific brain regions belonging to frontal and temporal circuits, which have been associated with bvFTD. To test this hypothesis, we employed the following local graph metrics: (i) a centrality measure (i.e., degree centrality), (ii) segregation measures (i.e., clustering coefficient), and (iii) integration measures (i.e., characteristic path length and local efficiency).
2. Materials and Methods
2.1. Participants
We included 25 bvFTD patients (14 males/11 females; 66.92 ± 7.69 years) and 20 control subjects (seven males/13 females; 63.60 ± 5.90 years). All participants were referred to the Neurodegerative Diseases Unit, Department of Clinical Research in Neurology of the University of Bari “Aldo Moro” at “Pia Fondazione Cardinale G. Panico”. According to Rascovsky’s criteria [2], patient diagnoses were based on a comprehensive evaluation, including clinical history, neurological examination, and neuropsychological testing. Eligibility criteria included no history of other neurological or psychiatric illnesses, no clinical or neuroimaging evidence of focal lesions, and no inflammatory, infectious, or vascular diseases. The control group was selected according to ADNI-3 criteria (ADNI Protocol v1.0: 24 May 2016, http://adni.loni.usc.edu/wp-content/themes/freshnews-dev-v2/documents/clinical/ADNI3_Protocol.pdf). None of the controls had a history of neurologic or psychiatric illness. The Mini-Mental State Examination (MMSE) and Frontal Assessment Battery (FAB) were administered to all participants as the screening assessment [35,36]. All participants gave written informed consent. The study was conducted according to the guidelines of the Declaration of Helsinki, and approved by the Institutional Review Board (or Ethics Committee) of ASL Lecce (verbale n. 6, 25 July 2017).
2.2. MRI Acquisition and Processing
Neuroimaging data were acquired on a 3T scanner (Philips Ingenia 3T). Set acquisition was in the sagittal plane using a Fast-Field Echo (FFE) T1-weighted sequence with the following parameters: repetition time = 8.2 ms, echo time = 3.8 ms, field of view = 256 × 256 mm2, 200 slices, flip angle = 8°, and isotropic 1 mm3 voxels.
T1-weighted images were inspected visually to check for motion-related artifacts and gross neuroanatomical alterations by a consultant neuroradiologist. Next, images were analyzed using FreeSurfer (version 6.0) (http://www.nmr.mgh.harvard.edu/martinos) to extract morphological features for cortical and subcortical brain regions [37,38,39]. Briefly, the cortical surface for each participant was reconstructed from T1-weighted images by the following steps: skull stripping, segmentation of cortical gray and white matter, separation of the two hemispheres and subcortical structures, and, finally, construction of smooth representation of the gray/white interface and the pial surface [37,39,40,41]. Next, all images were checked for reconstruction cortical surface errors, and surface inaccuracies were corrected with FreeSurfer’s editing tools. Then, the surface area was calculated using triangular tessellation of the gray/white matter interface and white matter/cerebrospinal fluid boundary (pial surface) [42]. Cortical thickness was also calculated based on the distance between closest points, between gray and white matter surfaces [39]. Finally, we used the FreeSurfer parcellation scheme based on the Desikan–Killiany Atlas to extract the cortical thickness and surface area of 68 cortical regions from both hemispheres [43]. Subcortical volumetric analyses were also performed using an automated approach that estimates the probability of structure classification based on prior templates in which those structures were manually identified [44]. We considered 12 subcortical areas, including the putamen, caudate, thalamus, pallidum, hippocampus, and amygdala, for each hemisphere. A list of cortical and subcortical regions is given in Supplementary Materials (Table S1).
2.3. Network Construction
Cortical thickness, surface area, and volumetric values were bilaterally averaged and corrected for age, sex, and individual brain size [33]. The resulting residuals were then z-score transformed using the mean and standard deviation values of each brain region calculated from healthy controls. Finally, a measure of joint variation between the 74 morphometric features (34 cortical surface area values, 34 cortical thickness values, and six subcortical volume values) represented the edge weights of the network, and was calculated using the following formula [33,45]:
1/exp{[(z-score value of ith region of interest) − (z-score value of jth region of interest)]2}
2.4. Graph Theory Analysis
Estimation of the global and local network characteristics was performed by using the Graph Theoretical Network Analysis (GRETNA) (www.nitrc.org/projects/gretna/) packages [46]. Small world measures and global efficiency (Eglob) were used to characterize the global topological organization of the covariance structural networks in both controls and patients with bvFTD. In particular, to examine the small-world properties of a network, the normalized clustering coefficient γ = (Cpreal/Cprandom) and the normalized characteristic path length λ = (Lpreal/Lprandom) were first computed. Then, the small-world index was calculated as the ratio of the normalized clustering coefficient and the normalized path length (σ = γ/λ). Of note, Cpreal and Lpreal are the clustering and the characteristic path length of the real network, respectively, and Cprandom and Lprandom represent, respectively, the mean clustering coefficient and shortest path length of 1000 matched random networks that preserve the same numbers of nodes, edges, and degree distribution as the real network. A real network can be considered as a small-world network if it fulfills the following criteria: small-world index σ = λ/ γ > 1.1 [47,48]. Compared to a random network, a small-world network is thus characterized by a higher clustering coefficient. By contrast, it exhibits a short characteristic path length comparable to that of a random network.
Regional network properties were assessed using degree centrality, the clustering coefficient, local path length, and local efficiency [11,49,50,51]. Degree centrality is a local graph measure that is able to quantify the relative importance of a node within a network [51]. The clustering coefficient represents the ability of a node to communicate with other nodes with which it shares a direct connection (segregation ability) [49]. Nodal efficiency and characteristic path length, on the other hand, quantify the ability of information propagation between a node and the remaining nodes in the network (integration ability). Local efficiency is calculated as the global efficiency of the subgraph formed by the node’s neighbors. A node with high nodal efficiency or low path length indicates high capability of information transmission with other nodes. Detailed formulas and explanations of these global and local metrics can be found in previous methodological reviews [13,21,50].
As graph measures are non-trivially dependent on the density of the underlying graph [52], intra-individual structural covariance networks were thresholded in a network density range of d = 0.10–0.40, with an interval of 0.01. Connectivity thresholding is commonly used to remove noisy or spurious links, preserving the strongest structural edges. The range of density was chosen to allow small-world network properties to be properly estimated and the number of spurious edges in each network to be minimized [53,54]. Then, the network parameters were computed for each network at each density. Finally, GRETNA was used to calculate the area under the curve (AUC, i.e., the integral over the density range) for each network measure to provide a scalar that does not depend on specific threshold selection [55,56]. Of note, graph measures were calculated based on weighted structural networks. In this way, we could characterize the relative importance of each link between network nodes. The BrainNet Viewer (http://www.nitrc.org/projects/bnv/) was used to visualize the regional brain network changes between patients and healthy controls [57].
2.5. Statistical Analyses
The Shapiro–Wilk test was performed in either demographic, neuroimaging, and neuropsychological variables (i.e., age, total intracranial volume, cognitive performance), or graph measures to verify the normality of data distribution. Next, variables with a normal distribution were compared between controls and bvFTD patients using pairwise t-tests. Non-normally distributed variables were compared between groups using Wilcoxon–Mann–Whitney test. The chi-square test was used to test for differences in the sex distribution between groups. The critical statistical threshold was set to p < 0.05. A false discovery rate (FDR) correction procedure was employed to correct for multiple comparisons in the global and local network analyses [58]. The relationships between network metrics and clinical data (disease duration and cognitive performances) of patients with bvFTD were tested using the Pearson correlation (p-value < 0.05). The correlations were considered statistically significant if the relative p-values were less than 0.05 after FDR correction.
3. Results
3.1. Demographic and Clinical Characteristics
No differences were found in age, sex, years of education, or intracranial volume between the bvFTD patients and healthy controls (p > 0.05). Concerning clinical data, patients with bvFTD had significantly lower MMSE and FAB scores compared with healthy control participants (p-value < 0.001) (Table 1).

Table 1.
Demographic, clinical, and neuroimaging data of sample.
3.2. Global Network Characteristics
The structural covariance network of controls and bvFTD patients demonstrated small-world network architecture over the preselected density range (1.37 < σHC < 2.92; 1.25 < σbvFTD < 2.76). However, the small-world index was smaller in bvFTD patients than in controls. Moreover, the normalized characteristic path length values in patients were greater than those of controls (Table 2, p < 0.05, FDR corrected). Compared with the healthy control participants, the bvFTD group also exhibited significantly less global efficiency (Table 2, p-value < 0.001, FDR corrected). No significant difference was found in the normalized clustering coefficient values between bvFTD patients and healthy controls.
Table 2.
Main effect of the group in the global network metrics.
3.3. Regional Network Characteristics
At a local level, bvFTD patients displayed a reduced local efficiency in the cortical thickness of the rostral and caudal middle frontal gyrus, pars opercularis, precuneus, cuneus, transverse temporal gyrus, and rostral anterior cingulate (p-value < 0.05, FDR corrected) (Figure 1, Table 3). Moreover, we observed a reduced clustering in the cortical thickness of the inferior temporal gyrus in bvFTD patients compared with controls (p-value < 0.001, FDR corrected) (Table 3). No significant differences were found in the local properties of cortical surface areas and subcortical volumes between bvFTD patients and controls.
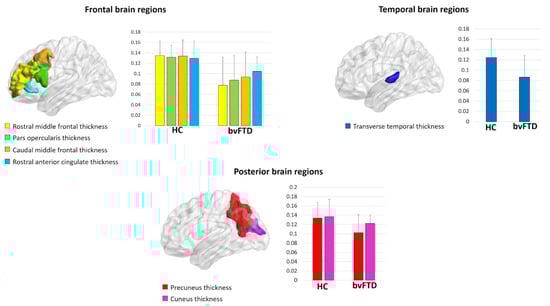
Figure 1.
Regions showing decreased local efficiency in behavioral variant frontotemporal dementia (bvFTD) patients compared to healthy controls (HC).
Table 3.
Main effect of the group in the local efficiency and clustering coefficient.
3.4. Correlation between Connectivity Metrics and Clinical Data
Significant correlations were found in bvFTD patients’ MMSE scores with the local efficiency and nodal degree in the cortical thickness of the caudal anterior cingulate (Figure 2, p-value = 0.01, FDR corrected).

Figure 2.
Significant correlation between degree centrality/nodal efficiency in the cortical thickness of the caudal anterior cingulate and Mini-Mental State Examination (MMSE) scores in behavioral variant frontotemporal dementia (bvFTD) patients.
4. Discussion
In the present study, we applied graph analysis to investigate the topological organization of structural brain networks in patients with bvFTD. We found altered graph metrics both at a global and local level. More specifically, when compared to healthy controls, bvFTD patients showed altered small-world properties (i.e., increased normalized path length) and decreased global efficiency. At the local level, patients with bvFTD displayed lower values of local efficiency in cortical thickness of the caudal and rostral middle frontal gyrus, rostral anterior cingulate, and precuneus, cuneus, and transverse temporal gyrus. Relative to controls, patients with bvFTD also displayed reduced values of clustering coefficients in the thickness of the inferior temporal gyrus. Finally, a significant correlation was found between the efficiency of caudal anterior cingulate thickness and the MMSE scores in bvFTD patients.
Our findings provide new insights into our understanding of structural changes in the organization of bvFTD brain networks. In particular, the reduced small-world index (σ) observed in bvFTD patients suggests that the covariance networks of bvFTD patients tend to have a more randomized configuration compared to the control group [53]. Moreover, the disruption of both normalized path length and global efficiency is indicative of an impaired functional integration of bvFTD networks, indicating a reduced ability to combine specialized information from distributed brain regions [10,49]. In the past years, several studies have investigated small-world property alterations in healthy individuals [58,59,60], as well as in neurological and psychiatric disorders [17,19,32,61,62,63,64,65]. Neuroimaging studies have demonstrated that the cognitive and memory declines in Alzheimer’s disease patients are often associated with the disruption of the small-world structure [17,27,66,67]. Evidence from graph theoretical studies have also observed reduced functional and structural integrity in bvFTD brain networks when compared to healthy controls [16,17,34,68,69]. In line with these findings, the bvFTD-related global property alterations observed in the present study are thus suggestive of an impaired functional integration, which might contribute to impairments in the cognitive function of patients with bvFTD. This idea is further supported by local property changes that we found in the frontotemporal regions of bvFTD networks. Compared to controls, patients with bvFTD showed reduced local efficiency and clustering coefficients in the cortical thickness of the middle frontal gyrus, pars-opercularis, anterior cingulate, and temporal cortices. All of these regions represent the most prominent sites of bvFTD-related focal atrophy [4,5,70]. Moreover, they play a crucial role in executive control, working memory, and emotion processing that are often disrupted in bvFTD [71,72]. Decreased values in the local properties (i.e., nodal centrality, nodal strength) of frontotemporal regions were previously reported in functional and structural networks of patients with bvFTD in comparison to controls [16,68,69]. In the present study, the reduced ability in integration found in key regions of the frontotemporal network further confirm a strong involvement of this network in bvFTD pathophysiology. Furthermore, the local efficiency and centrality degree values of the cortical thickness in the caudal anterior cingulate were found to significantly and positively correlate with the MMSE score, indicating that the anterior cingulate might play a key role in driving cognitive deficits in bvFTD patients. Interestingly, we also found a reduced local efficiency in the cortical thickness of the precuneus and cuneus. Although gray matter alterations in these brain regions are not frequent in bvFTD patients, recent fMRI studies have reported functional connectivity alterations in posterior cortical areas of patients with FTD when compared to healthy controls, possibly reflecting reduced afferent input from limbic regions [73,74].
The current study has some limitations that need to be addressed. We considered a cohort of bvFTD patients without a histopathological confirmation. However, clinical examination was performed according to the most recent diagnostic criteria for FTD. Second, we examined a relatively small number of patients. Hence, a larger sample size is required to replicate our results. Third, in the calculation of intra-individual structural covariance networks, we used the bilaterally averaged values of cortical and subcortical morphological features. Therefore, we were not able to explore the homologous connectivity between the brain regions. However, bvFTD is traditionally associated with largely symmetrical atrophy of the frontal and temporal lobes [5,68]. Fourth, network measures are generally related to each other. Thus, it becomes difficult to say which of these measures is driving the others. The obtained results should therefore be interpreted with caution. Fifth, longitudinal studies are required to assess whether topological changes in the structural covariance network of bvFTD patients are predictive of clinical–pathological progression. Finally, it remains to be determined whether the local property changes that we found in the frontotemporal regions of bvFTD networks may represent a useful marker in distinguishing between FTD subtypes.
5. Conclusions
Our study provides new evidence for the usefulness of combining several morphometric measures to capture single-subject anatomical connectivity and then investigating bvFTD-related network organization using a graph theory approach. Compared to controls, patients with bvFTD showed altered graph metrics both at a global and local level. In particular, bvFTD patients were characterized by lower local efficiency values in the cortical thickness of several frontotemporal regions. These network alterations might contribute to cognitive impairments often observed in patients with bvFTD, as suggested by correlations between graph measures and MMSE scores.
Supplementary Materials
The following are available online at https://www.mdpi.com/2076-3425/11/2/192/s1, Table S1: List of cortical and subcortical brain regions used to construct structural covariance networks.
Author Contributions
Conceptualization, S.N. and G.L.; methodology, S.N., B.T., and G.L.; software, S.N. and B.T.; formal analysis, S.N. and B.T.; visualization, S.N.; investigation, S.N.; resources, S.N., B.T., R.D.B., and G.L.; data curation, S.N. and B.T.; validation, S.N., B.T., D.U., R.D.B., M.E.F., M.R.B., R.C., A.C., G.G., and G.L.; writing—original draft preparation, S.N.; writing—review and editing, S.N., B.T., D.U., R.D.B., M.E.F., M.R.B., R.C., A.C., G.G., and G.L.; funding acquisition, G.G. and G.L.; supervision, G.L. All authors have read and agreed to the published version of the manuscript.
Funding
This work was supported by Regione Puglia (DGR n. 1284—27.05.2015) for the project “Registro Regionale per la SLA, la FTD-P e le patologie affini in Regione Puglia (SLAPDem register- www.slapdem.it) and from Italian Ministry of Health (Ricerca Corrente) and by Regione Puglia and CNR for Tecnopolo per la Medicina di Precisione. D.G.R. n. 2117 of 21.11.2018.
Institutional Review Board Statement
The study was conducted according to the guidelines of the Declaration of Helsinki, and approved by the Institutional Review Board (or Ethics Committee) of ASL Lecce (verbale n. 6, 25 July 2017).
Informed Consent Statement
Informed consent was obtained from all subjects involved in the study.
Data Availability Statement
The data presented in this study are available on request from the corresponding author. The data are not publicly available due to privacy restrictions.
Acknowledgments
The authors thank the patients for participation.
Conflicts of Interest
The authors declare no conflict of interest.
References
- Snowden, J.S.; Thompson, J.C.; Stopford, C.L.; Richardson, A.M.T.; Gerhard, A.; Neary, D.; Mann, D.M.A. The clinical diagnosis of early-onset dementias: Diagnostic accuracy and clinicopathological relationships. Brain J. Neurol. 2011, 134, 2478–2492. [Google Scholar] [CrossRef] [PubMed]
- Rascovsky, K.; Hodges, J.R.; Knopman, D.; Mendez, M.F.; Kramer, J.H.; Neuhaus, J.; van Swieten, J.C.; Seelaar, H.; Dopper, E.G.P.; Onyike, C.U.; et al. Sensitivity of revised diagnostic criteria for the behavioural variant of frontotemporal dementia. Brain 2011, 134, 2456–2477. [Google Scholar] [CrossRef] [PubMed]
- Rosen, H.J.; Gorno-Tempini, M.L.; Goldman, W.P.; Perry, R.J.; Schuff, N.; Weiner, M.; Feiwell, R.; Kramer, J.H.; Miller, B.L. Patterns of brain atrophy in frontotemporal dementia and semantic dementia. Neurology 2002, 58, 198–208. [Google Scholar] [CrossRef] [PubMed]
- Boccardi, M.; Sabattoli, F.; Laakso, M.P.; Testa, C.; Rossi, R.; Beltramello, A.; Soininen, H.; Frisoni, G.B. Frontotemporal dementia as a neural system disease. Neurobiol. Aging 2005, 26, 37–44. [Google Scholar] [CrossRef] [PubMed]
- Whitwell, J.L.; Przybelski, S.A.; Weigand, S.D.; Ivnik, R.J.; Vemuri, P.; Gunter, J.L.; Senjem, M.L.; Shiung, M.M.; Boeve, B.F.; Knopman, D.S.; et al. Distinct anatomical subtypes of the behavioural variant of frontotemporal dementia: A cluster analysis study. Brain 2009, 132, 2932–2946. [Google Scholar] [CrossRef] [PubMed]
- Bang, J.; Spina, S.; Miller, B.L. Frontotemporal dementia. Lancet Lond. Engl. 2015, 386, 1672–1682. [Google Scholar] [CrossRef]
- Seeley, W.W.; Crawford, R.K.; Zhou, J.; Miller, B.L.; Greicius, M.D. Neurodegenerative diseases target large-scale human brain networks. Neuron 2009, 62, 42–52. [Google Scholar] [CrossRef] [PubMed]
- Seeley, W.W. Mapping Neurodegenerative Disease Onset and Progression. Cold Spring Harb. Perspect. Biol. 2017, 9, a023622. [Google Scholar] [CrossRef]
- Ashish, R.; Fon, P. Models of Network Spread and Network Degeneration in Brain Disorders. Biol. Psychiatry Cogn. Neurosci. Neuroimaging 2018, 3, 788–797. [Google Scholar] [CrossRef]
- Sporns, O.; Zwi, J.D. The small world of the cerebral cortex. Neuroinformatics 2004, 2, 145–162. [Google Scholar] [CrossRef]
- Boccaletti, S.; Latora, V.; Moreno, Y.; Chavez, M.; Hwang, D.-U. Complex networks: Structure and dynamics. Phys. Rep. 2006, 424, 175–308. [Google Scholar] [CrossRef]
- Stam, C.J.; Reijneveld, J.C. Graph theoretical analysis of complex networks in the brain. Nonlinear Biomed. Phys. 2007, 1, 3. [Google Scholar] [CrossRef]
- Bullmore, E.; Sporns, O. Complex brain networks: Graph theoretical analysis of structural and functional systems. Nat. Rev. Neurosci. 2009, 10, 186–198. [Google Scholar] [CrossRef] [PubMed]
- He, Y.; Chen, Z.; Evans, A. Structural Insights into Aberrant Topological Patterns of Large-Scale Cortical Networks in Alzheimer’s Disease. J. Neurosci. 2008, 28, 4756–4766. [Google Scholar] [CrossRef] [PubMed]
- Zhou, J.; Greicius, M.D.; Gennatas, E.D.; Growdon, M.E.; Jang, J.Y.; Rabinovici, G.D.; Kramer, J.H.; Weiner, M.; Miller, B.L.; Seeley, W.W. Divergent network connectivity changes in behavioural variant frontotemporal dementia and Alzheimer’s disease. Brain J. Neurol. 2010, 133, 1352–1367. [Google Scholar] [CrossRef] [PubMed]
- Filippi, M.; Agosta, F.; Scola, E.; Canu, E.; Magnani, G.; Marcone, A.; Valsasina, P.; Caso, F.; Copetti, M.; Comi, G.; et al. Functional network connectivity in the behavioral variant of frontotemporal dementia. Cortex J. Devoted Study Nerv. Syst. Behav. 2013, 49, 2389–2401. [Google Scholar] [CrossRef] [PubMed]
- Filippi, M.; Basaia, S.; Canu, E.; Imperiale, F.; Meani, A.; Caso, F.; Magnani, G.; Falautano, M.; Comi, G.; Falini, A.; et al. Brain network connectivity differs in early-onset neurodegenerative dementia. Neurology 2017, 89, 1764–1772. [Google Scholar] [CrossRef] [PubMed]
- Vecchio, F.; Miraglia, F.; Curcio, G.; Altavilla, R.; Scrascia, F.; Giambattistelli, F.; Quattrocchi, C.C.; Bramanti, P.; Vernieri, F.; Rossini, P.M. Cortical brain connectivity evaluated by graph theory in dementia: A correlation study between functional and structural data. J. Alzheimers Dis. JAD 2015, 45, 745–756. [Google Scholar] [CrossRef] [PubMed]
- Nigro, S.; Riccelli, R.; Passamonti, L.; Arabia, G.; Morelli, M.; Nisticò, R.; Novellino, F.; Salsone, M.; Barbagallo, G.; Quattrone, A. Characterizing structural neural networks in de novo Parkinson disease patients using diffusion tensor imaging. Hum. Brain Mapp. 2016, 37, 4500–4510. [Google Scholar] [CrossRef] [PubMed]
- Sedeño, L.; Couto, B.; García-Cordero, I.; Melloni, M.; Baez, S.; Morales Sepúlveda, J.P.; Fraiman, D.; Huepe, D.; Hurtado, E.; Matallana, D.; et al. Brain Network Organization and Social Executive Performance in Frontotemporal Dementia. J. Int. Neuropsychol. Soc. JINS 2016, 22, 250–262. [Google Scholar] [CrossRef]
- Farahani, F.V.; Karwowski, W.; Lighthall, N.R. Application of Graph Theory for Identifying Connectivity Patterns in Human Brain Networks: A Systematic Review. Front. Neurosci. 2019, 13, 585. [Google Scholar] [CrossRef]
- Alexander-Bloch, A.; Giedd, J.N.; Bullmore, E. Imaging structural co-variance between human brain regions. Nat. Rev. Neurosci. 2013, 14, 322–336. [Google Scholar] [CrossRef]
- Spreng, R.N.; Turner, G.R. Structural Covariance of the Default Network in Healthy and Pathological Aging. J. Neurosci. 2013, 33, 15226–15234. [Google Scholar] [CrossRef] [PubMed]
- DuPre, E.; Spreng, R.N. Structural covariance networks across the life span, from 6 to 94 years of age. Netw. Neurosci. 2017, 1, 302–323. [Google Scholar] [CrossRef]
- Hosseini, S.M.H.; Mazaika, P.; Mauras, N.; Buckingham, B.; Weinzimer, S.A.; Tsalikian, E.; White, N.H.; Reiss, A.L. Altered Integration of Structural Covariance Networks in Young Children With Type 1 Diabetes. Hum. Brain Mapp. 2016, 37, 4034–4046. [Google Scholar] [CrossRef] [PubMed]
- Bruno, J.L.; Hosseini, S.M.H.; Saggar, M.; Quintin, E.-M.; Raman, M.M.; Reiss, A.L. Altered Brain Network Segregation in Fragile X Syndrome Revealed by Structural Connectomics. Cereb. Cortex 2017, 27, 2249–2259. [Google Scholar] [CrossRef] [PubMed]
- Bernhardt, B.C.; Bernasconi, N.; Concha, L.; Bernasconi, A. Cortical thickness analysis in temporal lobe epilepsy: Reproducibility and relation to outcome. Neurology 2010, 74, 1776–1784. [Google Scholar] [CrossRef] [PubMed]
- Bethlehem, R.A.I.; Romero-Garcia, R.; Mak, E.; Bullmore, E.T.; Baron-Cohen, S. Structural Covariance Networks in Children with Autism or ADHD. Cereb. Cortex 2017, 27, 4267–4276. [Google Scholar] [CrossRef] [PubMed]
- Yao, Z.; Zhang, Y.; Lin, L.; Zhou, Y.; Xu, C.; Jiang, T. Alzheimer’s Disease Neuroimaging Initiative Abnormal cortical networks in mild cognitive impairment and Alzheimer’s disease. PLoS Comput. Biol. 2010, 6, e1001006. [Google Scholar] [CrossRef] [PubMed]
- Pereira, J.B.; Aarsland, D.; Ginestet, C.E.; Lebedev, A.V.; Wahlund, L.-O.; Simmons, A.; Volpe, G.; Westman, E. Aberrant cerebral network topology and mild cognitive impairment in early Parkinson’s disease. Hum. Brain Mapp. 2015, 36, 2980–2995. [Google Scholar] [CrossRef] [PubMed]
- Minkova, L.; Eickhoff, S.B.; Abdulkadir, A.; Kaller, C.P.; Peter, J.; Scheller, E.; Lahr, J.; Roos, R.A.; Durr, A.; Leavitt, B.R.; et al. Large-scale brain network abnormalities in Huntington’s disease revealed by structural covariance. Hum. Brain Mapp. 2016, 37, 67–80. [Google Scholar] [CrossRef] [PubMed]
- Li, Y.; Wang, Y.; Wang, Y.; Wang, H.; Li, D.; Chen, Q.; Huang, W. Impaired Topological Properties of Gray Matter Structural Covariance Network in Epilepsy Children With Generalized Tonic–Clonic Seizures: A Graph Theoretical Analysis. Front. Neurol. 2020, 11, 253. [Google Scholar] [CrossRef] [PubMed]
- Yun, J.-Y.; Boedhoe, P.S.W.; Vriend, C.; Jahanshad, N.; Abe, Y.; Ameis, S.H.; Anticevic, A.; Arnold, P.D.; Batistuzzo, M.C.; Benedetti, F.; et al. Brain structural covariance networks in obsessive-compulsive disorder: A graph analysis from the ENIGMA Consortium. Brain 2020, 143, 684–700. [Google Scholar] [CrossRef] [PubMed]
- Vijverberg, E.G.B.; Tijms, B.M.; Dopp, J.; Hong, Y.J.; Teunissen, C.E.; Barkhof, F.; Scheltens, P.; Pijnenburg, Y. Gray matter network differences between behavioral variant frontotemporal dementia and Alzheimer’s disease. Neurobiol. Aging 2017, 50, 77–86. [Google Scholar] [CrossRef] [PubMed]
- Measso, G.; Cavarzeran, F.; Zappalà, G.; Lebowitz, B.D.; Crook, T.H.; Pirozzolo, F.J.; Amaducci, L.A.; Massari, D.; Grigoletto, F. The mini-mental state examination: Normative study of an Italian random sample. Dev. Neuropsychol. 1993, 9, 77–85. [Google Scholar] [CrossRef]
- Appollonio, I.; Leone, M.; Isella, V.; Piamarta, F.; Consoli, T.; Villa, M.L.; Forapani, E.; Russo, A.; Nichelli, P. The Frontal Assessment Battery (FAB): Normative values in an Italian population sample. Neurol. Sci. Off. J. Ital. Neurol. Soc. Ital. Soc. Clin. Neurophysiol. 2005, 26, 108–116. [Google Scholar] [CrossRef]
- Dale, A.M.; Fischl, B.; Sereno, M.I. Cortical surface-based analysis. I. Segmentation and surface reconstruction. NeuroImage 1999, 9, 179–194. [Google Scholar] [CrossRef]
- Fischl, B.; Sereno, M.I.; Dale, A.M. Cortical surface-based analysis. II: Inflation, flattening, and a surface-based coordinate system. NeuroImage 1999, 9, 195–207. [Google Scholar] [CrossRef]
- Fischl, B.; Dale, A.M. Measuring the thickness of the human cerebral cortex from magnetic resonance images. Proc. Natl. Acad. Sci. USA 2000, 97, 11050–11055. [Google Scholar] [CrossRef]
- Fischl, B.; van der Kouwe, A.; Destrieux, C.; Halgren, E.; Ségonne, F.; Salat, D.H.; Busa, E.; Seidman, L.J.; Goldstein, J.; Kennedy, D.; et al. Automatically parcellating the human cerebral cortex. Cereb. Cortex 2004, 14, 11–22. [Google Scholar] [CrossRef] [PubMed]
- Ségonne, F.; Dale, A.M.; Busa, E.; Glessner, M.; Salat, D.; Hahn, H.K.; Fischl, B. A hybrid approach to the skull stripping problem in MRI. NeuroImage 2004, 22, 1060–1075. [Google Scholar] [CrossRef]
- Winkler, A.M.; Sabuncu, M.R.; Yeo, B.T.T.; Fischl, B.; Greve, D.N.; Kochunov, P.; Nichols, T.E.; Blangero, J.; Glahn, D.C. Measuring and comparing brain cortical surface area and other areal quantities. NeuroImage 2012, 61, 1428–1443. [Google Scholar] [CrossRef]
- Desikan, R.S.; Ségonne, F.; Fischl, B.; Quinn, B.T.; Dickerson, B.C.; Blacker, D.; Buckner, R.L.; Dale, A.M.; Maguire, R.P.; Hyman, B.T.; et al. An automated labeling system for subdividing the human cerebral cortex on MRI scans into gyral based regions of interest. NeuroImage 2006, 31, 968–980. [Google Scholar] [CrossRef] [PubMed]
- Fischl, B.; Salat, D.H.; Busa, E.; Albert, M.; Dieterich, M.; Haselgrove, C.; van der Kouwe, A.; Killiany, R.; Kennedy, D.; Klaveness, S.; et al. Whole brain segmentation: Automated labeling of neuroanatomical structures in the human brain. Neuron 2002, 33, 341–355. [Google Scholar] [CrossRef]
- Yun, J.-Y.; Kim, S.N.; Lee, T.Y.; Chon, M.-W.; Kwon, J.S. Individualized covariance profile of cortical morphology for auditory hallucinations in first-episode psychosis. Hum. Brain Mapp. 2016, 37, 1051–1065. [Google Scholar] [CrossRef] [PubMed]
- Wang, J.; Wang, X.; Xia, M.; Liao, X.; Evans, A.; He, Y. GRETNA: A graph theoretical network analysis toolbox for imaging connectomics. Front. Hum. Neurosci. 2015, 9, 386. [Google Scholar] [CrossRef] [PubMed]
- Achard, S.; Salvador, R.; Whitcher, B.; Suckling, J.; Bullmore, E. A resilient, low-frequency, small-world human brain functional network with highly connected association cortical hubs. J. Neurosci. 2006, 26, 63–72. [Google Scholar] [CrossRef] [PubMed]
- Humphries, M.D.; Gurney, K.; Prescott, T.J. The brainstem reticular formation is a small-world, not scale-free, network. Proc. R. Soc. B Biol. Sci. 2006, 273, 503–511. [Google Scholar] [CrossRef] [PubMed]
- Watts, D.J.; Strogatz, S.H. Collective dynamics of ‘small-world’ networks. Nature 1998, 393, 440–442. [Google Scholar] [CrossRef]
- Rubinov, M.; Sporns, O. Complex network measures of brain connectivity: Uses and interpretations. NeuroImage 2010, 52, 1059–1069. [Google Scholar] [CrossRef]
- Zuo, X.-N.; Ehmke, R.; Mennes, M.; Imperati, D.; Castellanos, F.X.; Sporns, O.; Milham, M.P. Network centrality in the human functional connectome. Cereb. Cortex 2012, 22, 1862–1875. [Google Scholar] [CrossRef] [PubMed]
- van Wijk, B.C.M.; Stam, C.J.; Daffertshofer, A. Comparing Brain Networks of Different Size and Connectivity Density Using Graph Theory. PLoS ONE 2010, 5, e13701. [Google Scholar] [CrossRef] [PubMed]
- Achard, S.; Bullmore, E. Efficiency and cost of economical brain functional networks. PLoS Comput. Biol. 2007, 3, e17. [Google Scholar] [CrossRef] [PubMed]
- He, Y.; Chen, Z.J.; Evans, A.C. Small-world anatomical networks in the human brain revealed by cortical thickness from MRI. Cereb. Cortex 2007, 17, 2407–2419. [Google Scholar] [CrossRef] [PubMed]
- Wang, J.; Wang, L.; Zang, Y.; Yang, H.; Tang, H.; Gong, Q.; Chen, Z.; Zhu, C.; He, Y. Parcellation-dependent small-world brain functional networks: A resting-state fMRI study. Hum. Brain Mapp. 2009, 30, 1511–1523. [Google Scholar] [CrossRef] [PubMed]
- Zhang, J.; Wang, J.; Wu, Q.; Kuang, W.; Huang, X.; He, Y.; Gong, Q. Disrupted brain connectivity networks in drug-naive, first-episode major depressive disorder. Biol. Psychiatry 2011, 70, 334–342. [Google Scholar] [CrossRef]
- Xia, M.; Wang, J.; He, Y. BrainNet Viewer: A Network Visualization Tool for Human Brain Connectomics. PLoS ONE 2013, 8, e68910. [Google Scholar] [CrossRef]
- Benjamini, Y.; Hochberg, Y. Controlling the false discovery rate: A practical and powerful approach to multiple testing. J. R. Stat. Soc. Ser. B-Methodol. 1995, 57, 289–300. [Google Scholar] [CrossRef]
- Bassett, D.S.; Wymbs, N.F.; Porter, M.A.; Mucha, P.J.; Carlson, J.M.; Grafton, S.T. Dynamic reconfiguration of human brain networks during learning. Proc. Natl. Acad. Sci. USA 2011, 108, 7641–7646. [Google Scholar] [CrossRef] [PubMed]
- Cao, M.; Huang, H.; Peng, Y.; Dong, Q.; He, Y. Toward Developmental Connectomics of the Human Brain. Front. Neuroanat. 2016, 10, 25. [Google Scholar] [CrossRef]
- Liang, X.; Zou, Q.; He, Y.; Yang, Y. Topologically Reorganized Connectivity Architecture of Default-Mode, Executive-Control, and Salience Networks across Working Memory Task Loads. Cereb. Cortex 2016, 26, 1501–1511. [Google Scholar] [CrossRef]
- Xia, M.; He, Y. Magnetic resonance imaging and graph theoretical analysis of complex brain networks in neuropsychiatric disorders. Brain Connect. 2011, 1, 349–365. [Google Scholar] [CrossRef]
- Fornito, A.; Bullmore, E.T. Connectomic intermediate phenotypes for psychiatric disorders. Front. Psychiatry 2012, 3, 32. [Google Scholar] [CrossRef] [PubMed]
- Fornito, A.; Bullmore, E.T. Connectomics: A new paradigm for understanding brain disease. Eur. Neuropsychopharmacol. J. Eur. Coll. Neuropsychopharmacol. 2015, 25, 733–748. [Google Scholar] [CrossRef] [PubMed]
- Olde Dubbelink, K.T.E.; Hillebrand, A.; Stoffers, D.; Deijen, J.B.; Twisk, J.W.R.; Stam, C.J.; Berendse, H.W. Disrupted brain network topology in Parkinson’s disease: A longitudinal magnetoencephalography study. Brain J. Neurol. 2014, 137, 197–207. [Google Scholar] [CrossRef] [PubMed]
- Hou, Y.; Wei, Q.; Ou, R.; Yang, J.; Gong, Q.; Shang, H. Impaired topographic organization in Parkinson’s disease with mild cognitive impairment. J. Neurol. Sci. 2020, 414, 116861. [Google Scholar] [CrossRef] [PubMed]
- Brier, M.R.; Thomas, J.B.; Fagan, A.M.; Hassenstab, J.; Holtzman, D.M.; Benzinger, T.L.; Morris, J.C.; Ances, B.M. Functional connectivity and graph theory in preclinical Alzheimer’s disease. Neurobiol. Aging 2014, 35, 757–768. [Google Scholar] [CrossRef] [PubMed]
- Afshari, S.; Jalili, M. Directed Functional Networks in Alzheimer’s Disease: Disruption of Global and Local Connectivity Measures. IEEE J. Biomed. Health Inform. 2017, 21, 949–955. [Google Scholar] [CrossRef]
- Daianu, M.; Mezher, A.; Mendez, M.F.; Jahanshad, N.; Jimenez, E.E.; Thompson, P.M. Disrupted rich club network in behavioral variant frontotemporal dementia and early-onset Alzheimer’s disease. Hum. Brain Mapp. 2016, 37, 868–883. [Google Scholar] [CrossRef]
- Saba, V.; Premi, E.; Cristillo, V.; Gazzina, S.; Palluzzi, F.; Zanetti, O.; Gasparotti, R.; Padovani, A.; Borroni, B.; Grassi, M. Brain Connectivity and Information-Flow Breakdown Revealed by a Minimum Spanning Tree-Based Analysis of MRI Data in Behavioral Variant Frontotemporal Dementia. Front. Neurosci. 2019, 13, 211. [Google Scholar] [CrossRef]
- Meeter, L.H.; Kaat, L.D.; Rohrer, J.D.; van Swieten, J.C. Imaging and fluid biomarkers in frontotemporal dementia. Nat. Rev. Neurol. 2017, 13, 406–419. [Google Scholar] [CrossRef] [PubMed]
- Harciarek, M.; Cosentino, S. Language, Executive Function and Social Cognition in the Diagnosis of Frontotemporal Dementia Syndromes. Int. Rev. Psychiatry Abingdon Engl. 2013, 25, 178–196. [Google Scholar] [CrossRef] [PubMed]
- Johnen, A.; Bertoux, M. Psychological and Cognitive Markers of Behavioral Variant Frontotemporal Dementia–A Clinical Neuropsychologist’s View on Diagnostic Criteria and Beyond. Front. Neurol. 2019, 10, 594. [Google Scholar] [CrossRef]
- Virani, K.; Jesso, S.; Kertesz, A.; Mitchell, D.; Finger, E. Functional neural correlates of emotional expression processing deficits in behavioural variant frontotemporal dementia. J. Psychiatry Neurosci. JPN 2013, 38, 174–182. [Google Scholar] [CrossRef] [PubMed]


Publisher’s Note: MDPI stays neutral with regard to jurisdictional claims in published maps and institutional affiliations. |
© 2021 by the authors. Licensee MDPI, Basel, Switzerland. This article is an open access article distributed under the terms and conditions of the Creative Commons Attribution (CC BY) license (http://creativecommons.org/licenses/by/4.0/).