The Effects of Working Memory Training on Brain Activity


 , , ,
, , ,
Abstract
1. Introduction
1.1. Enhancement of Working Memory Capacity
1.2. Neural Effects of WM Training
1.3. The Present Study
2. Materials and Methods
2.1. Participants
2.2. Study Design
2.3. Tasks
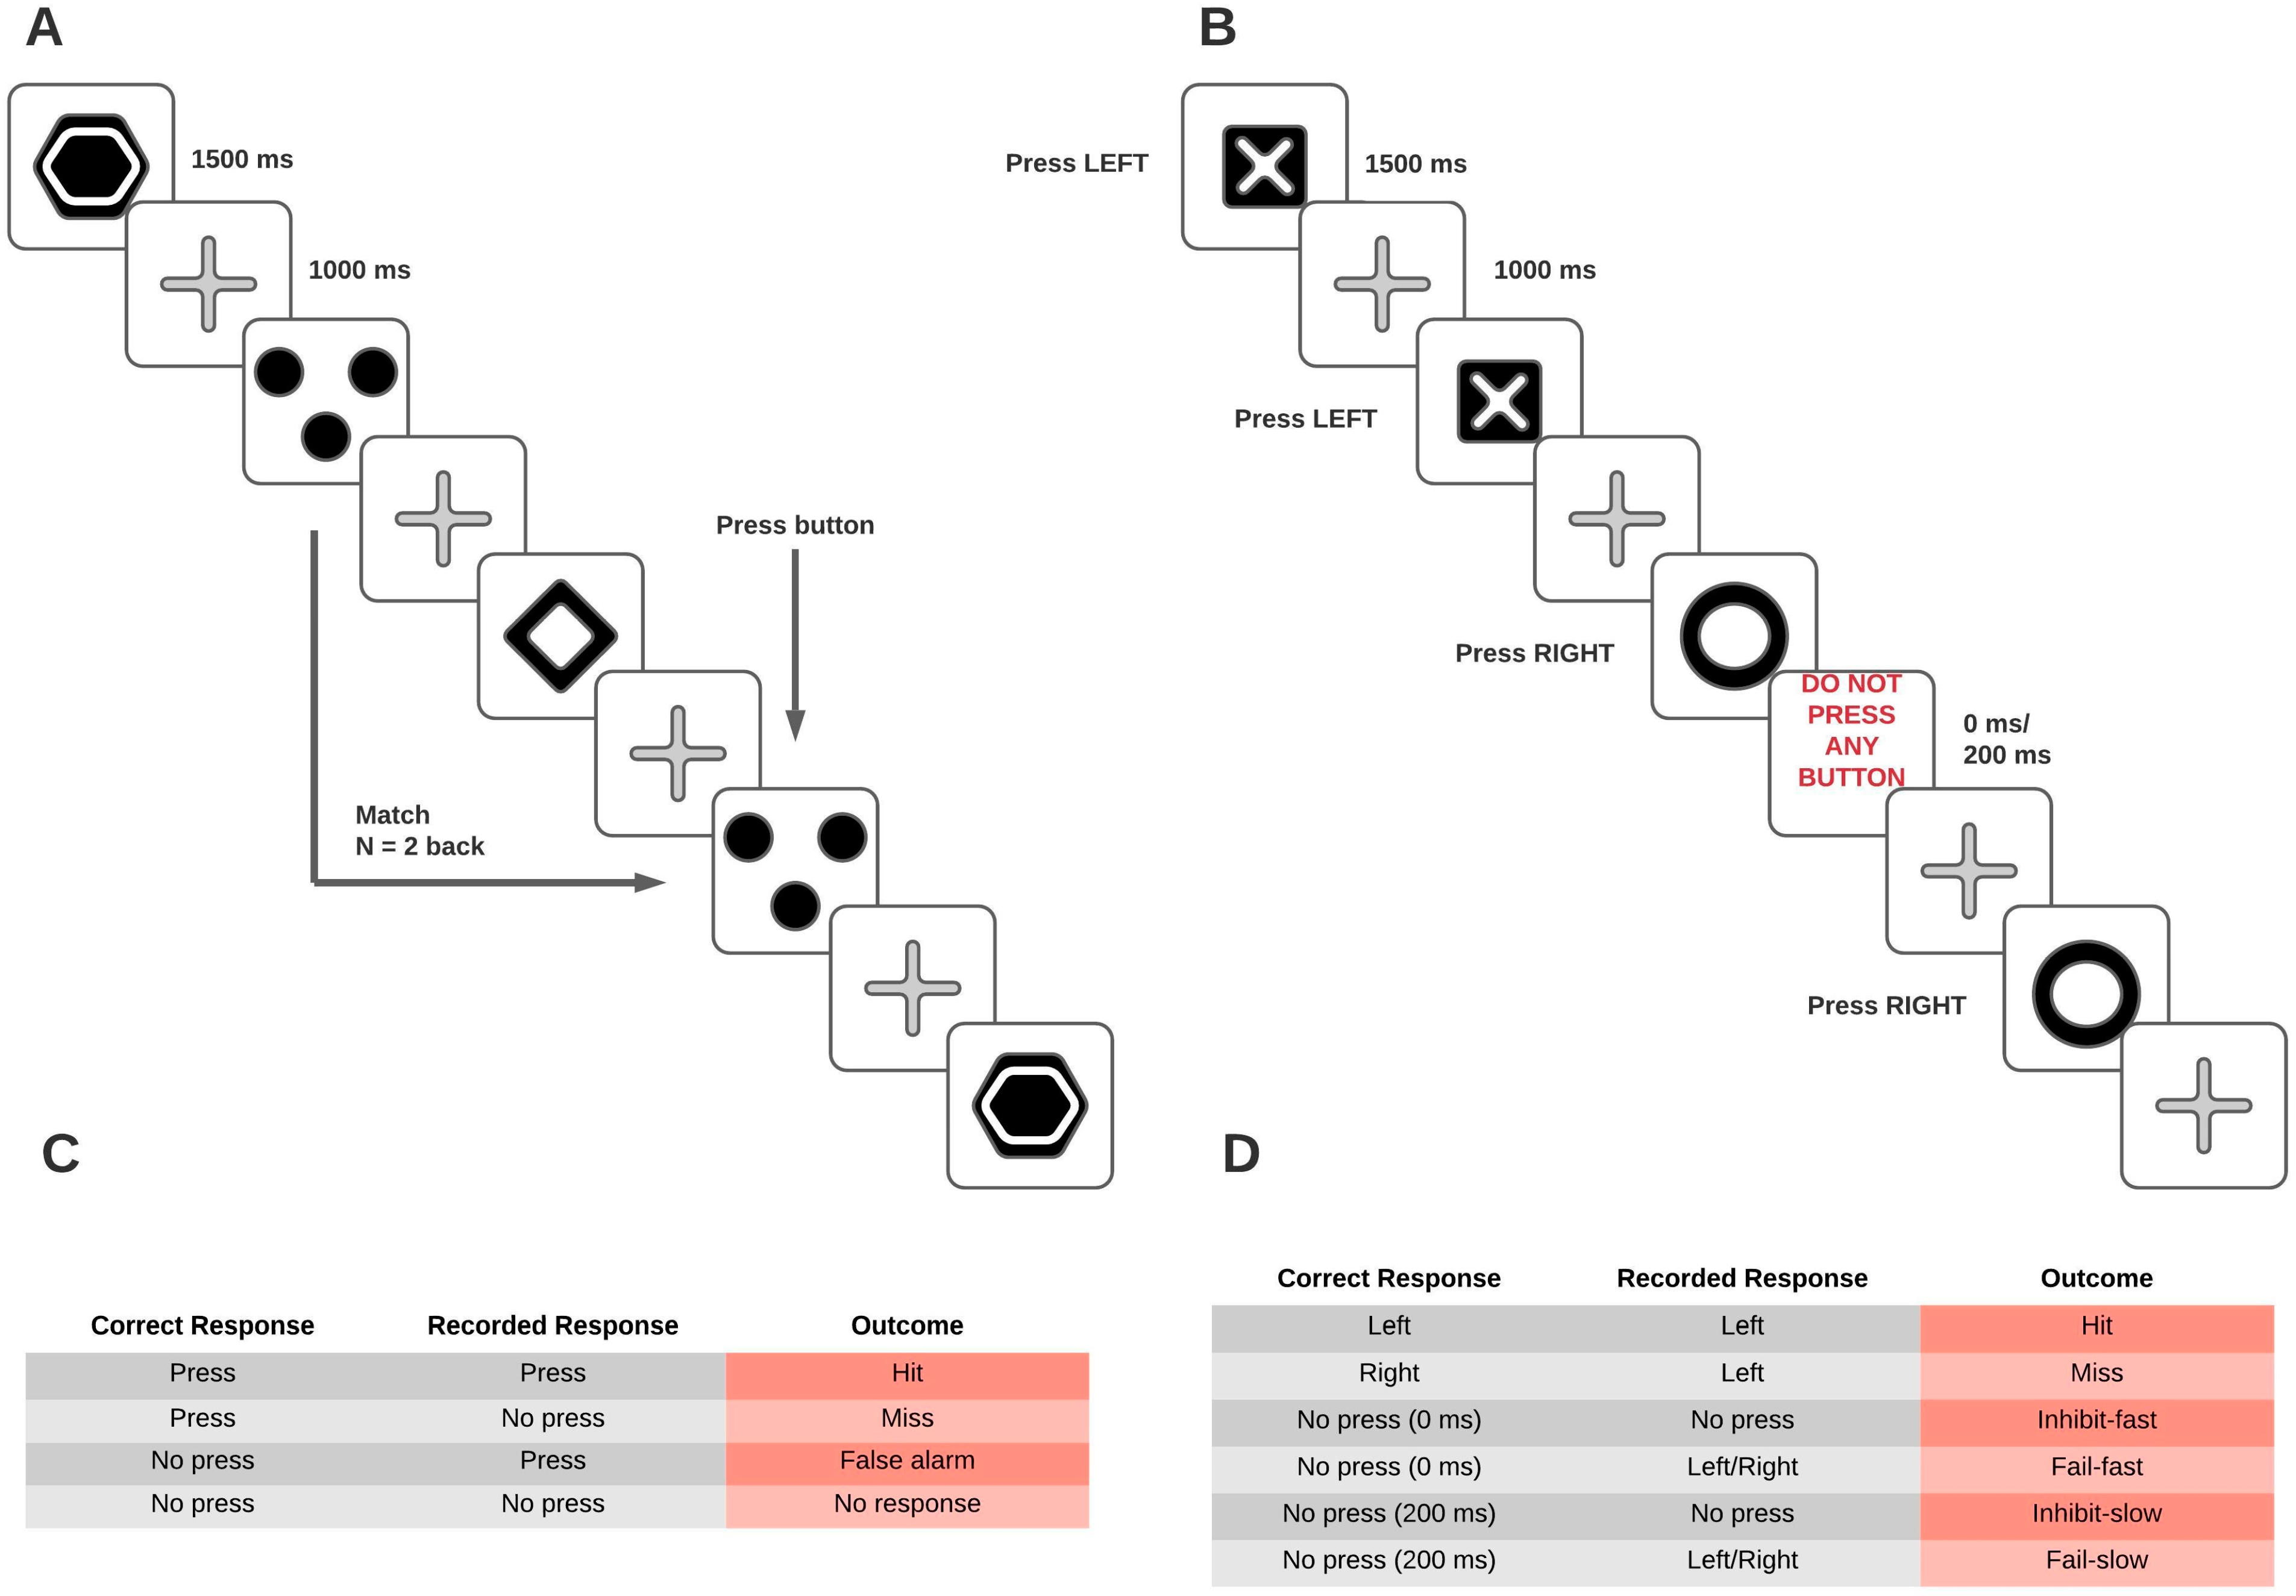
2.3.1. N-Back Task
2.3.2. Stop-Signal Task
2.3.3. Paper-and-Pencil Instruments
2.4. Procedure
2.4.1. The Training Procedure
2.4.2. The Scanning Procedure
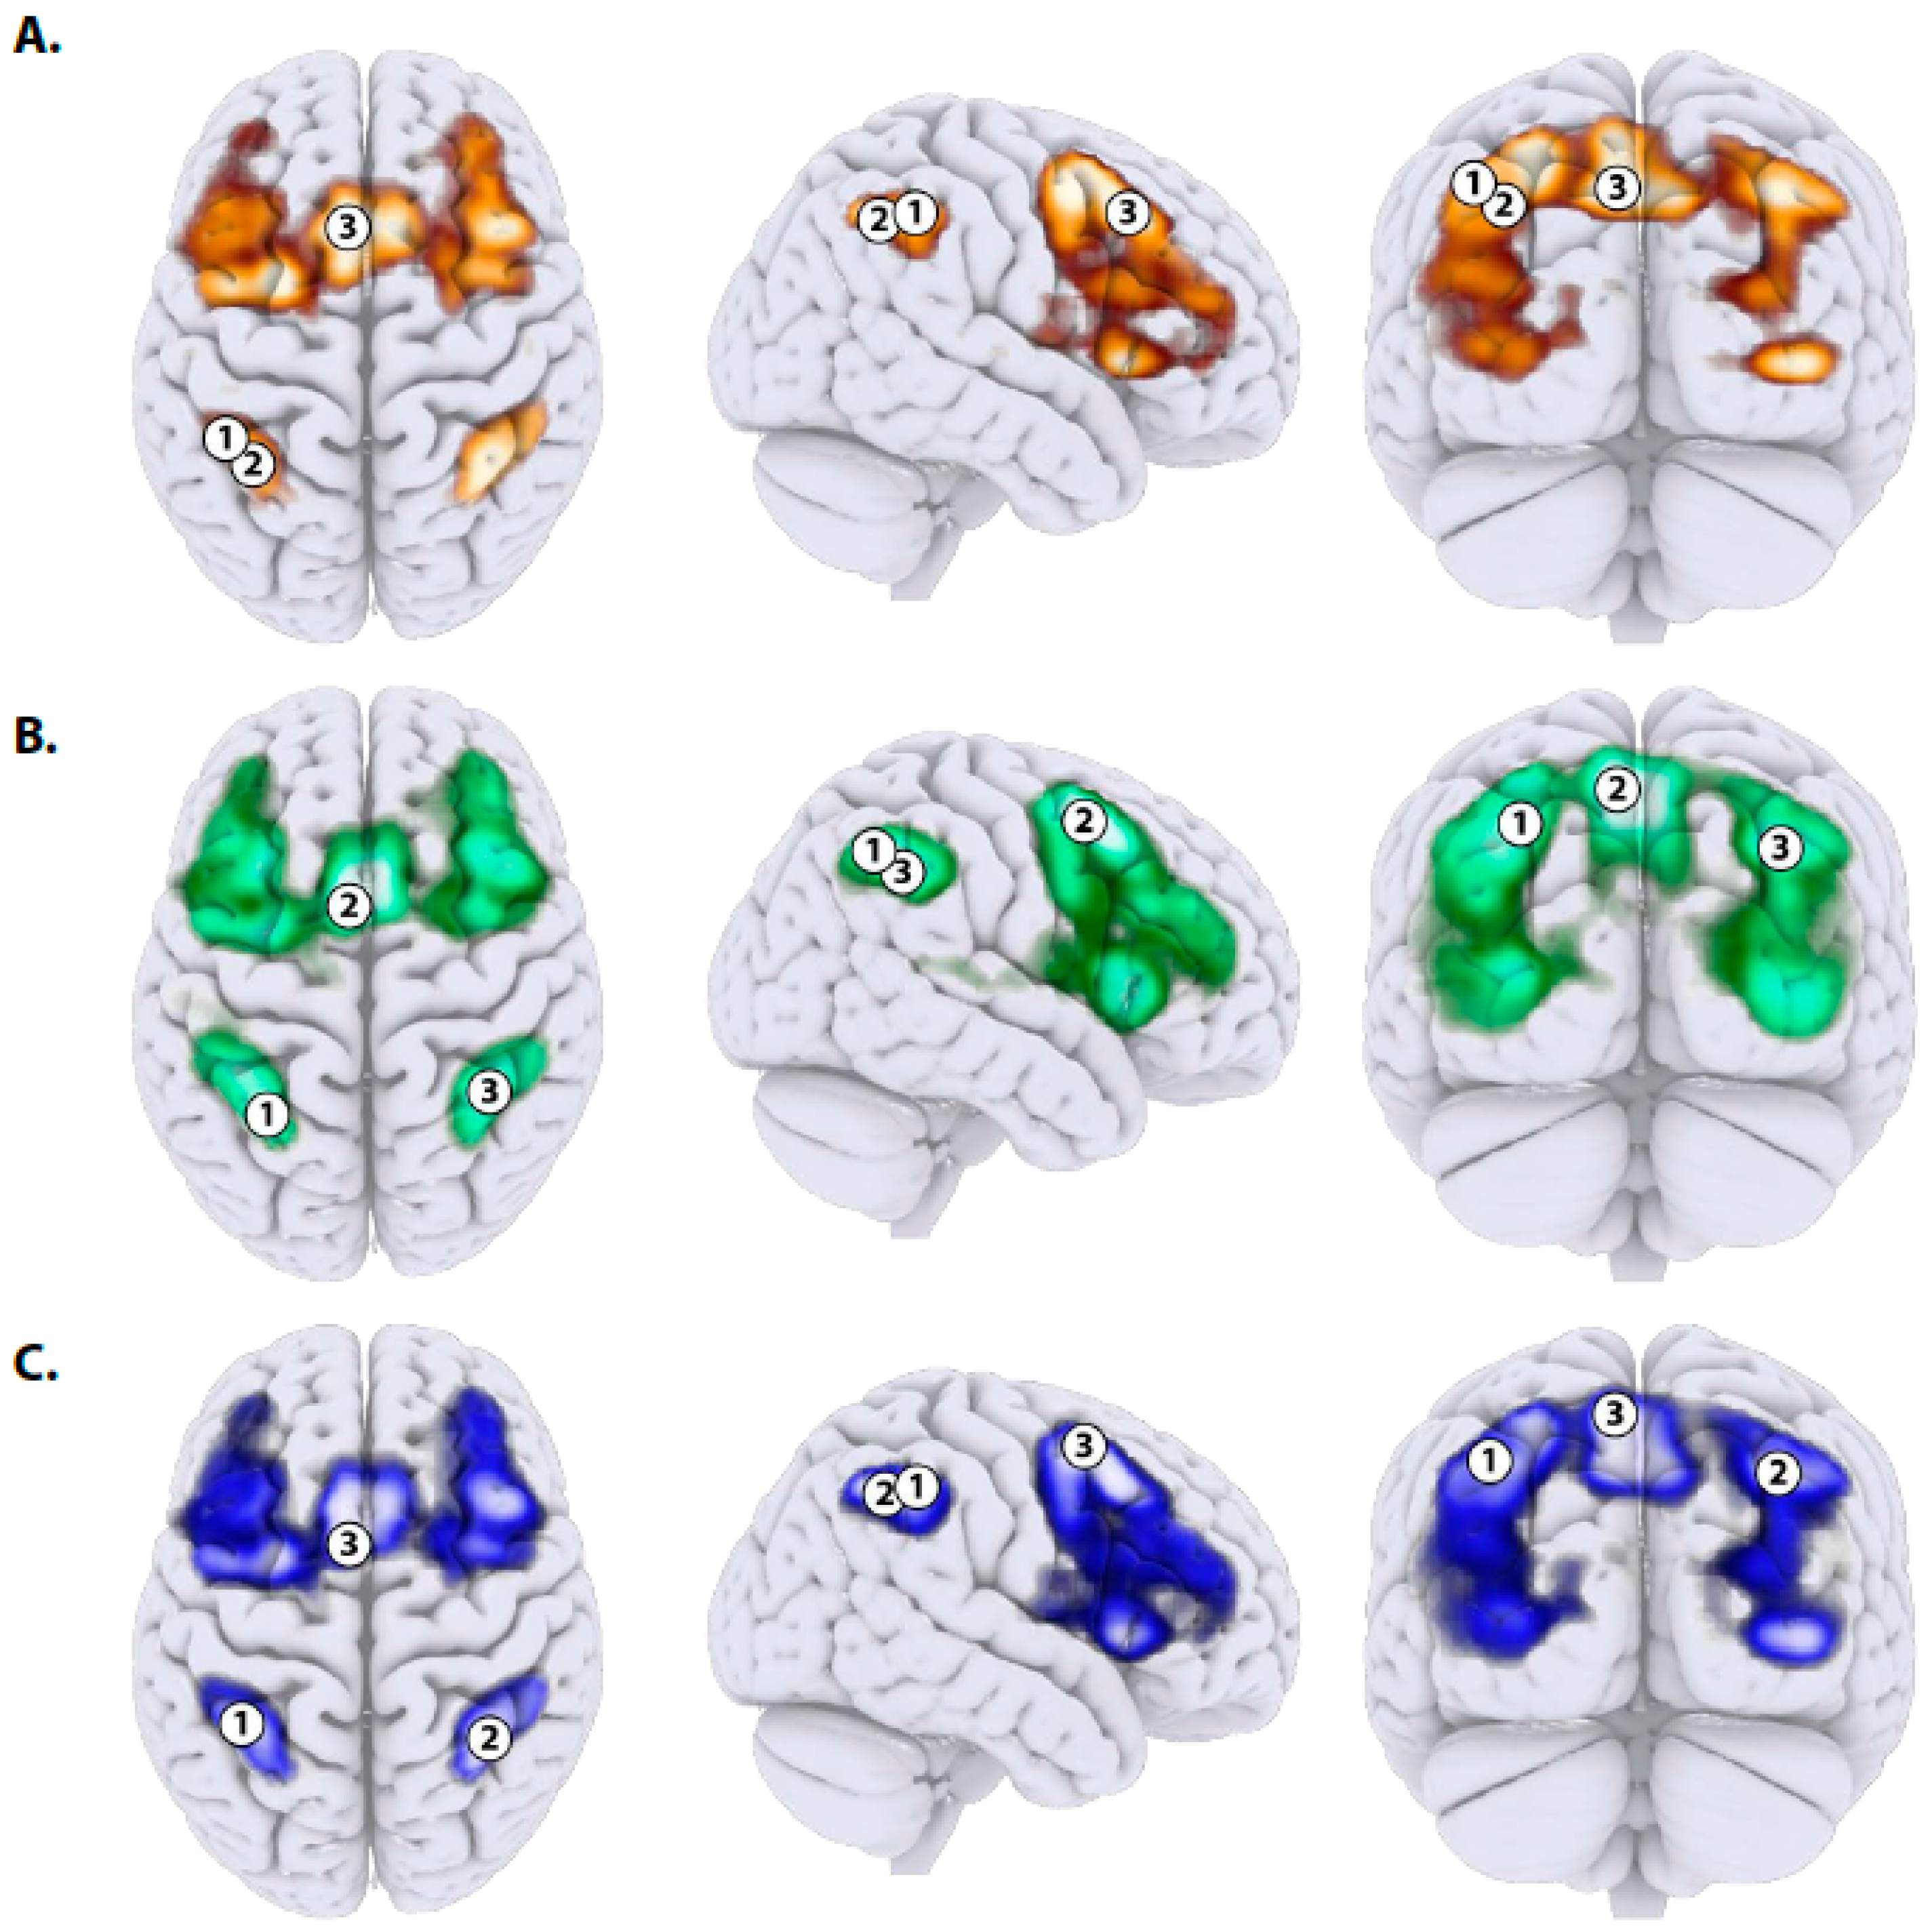
2.4.3. Data-Driven Region of Interest (ROI) Clustering
3. Results
3.1. Behavioral Results
3.2. Imaging Results
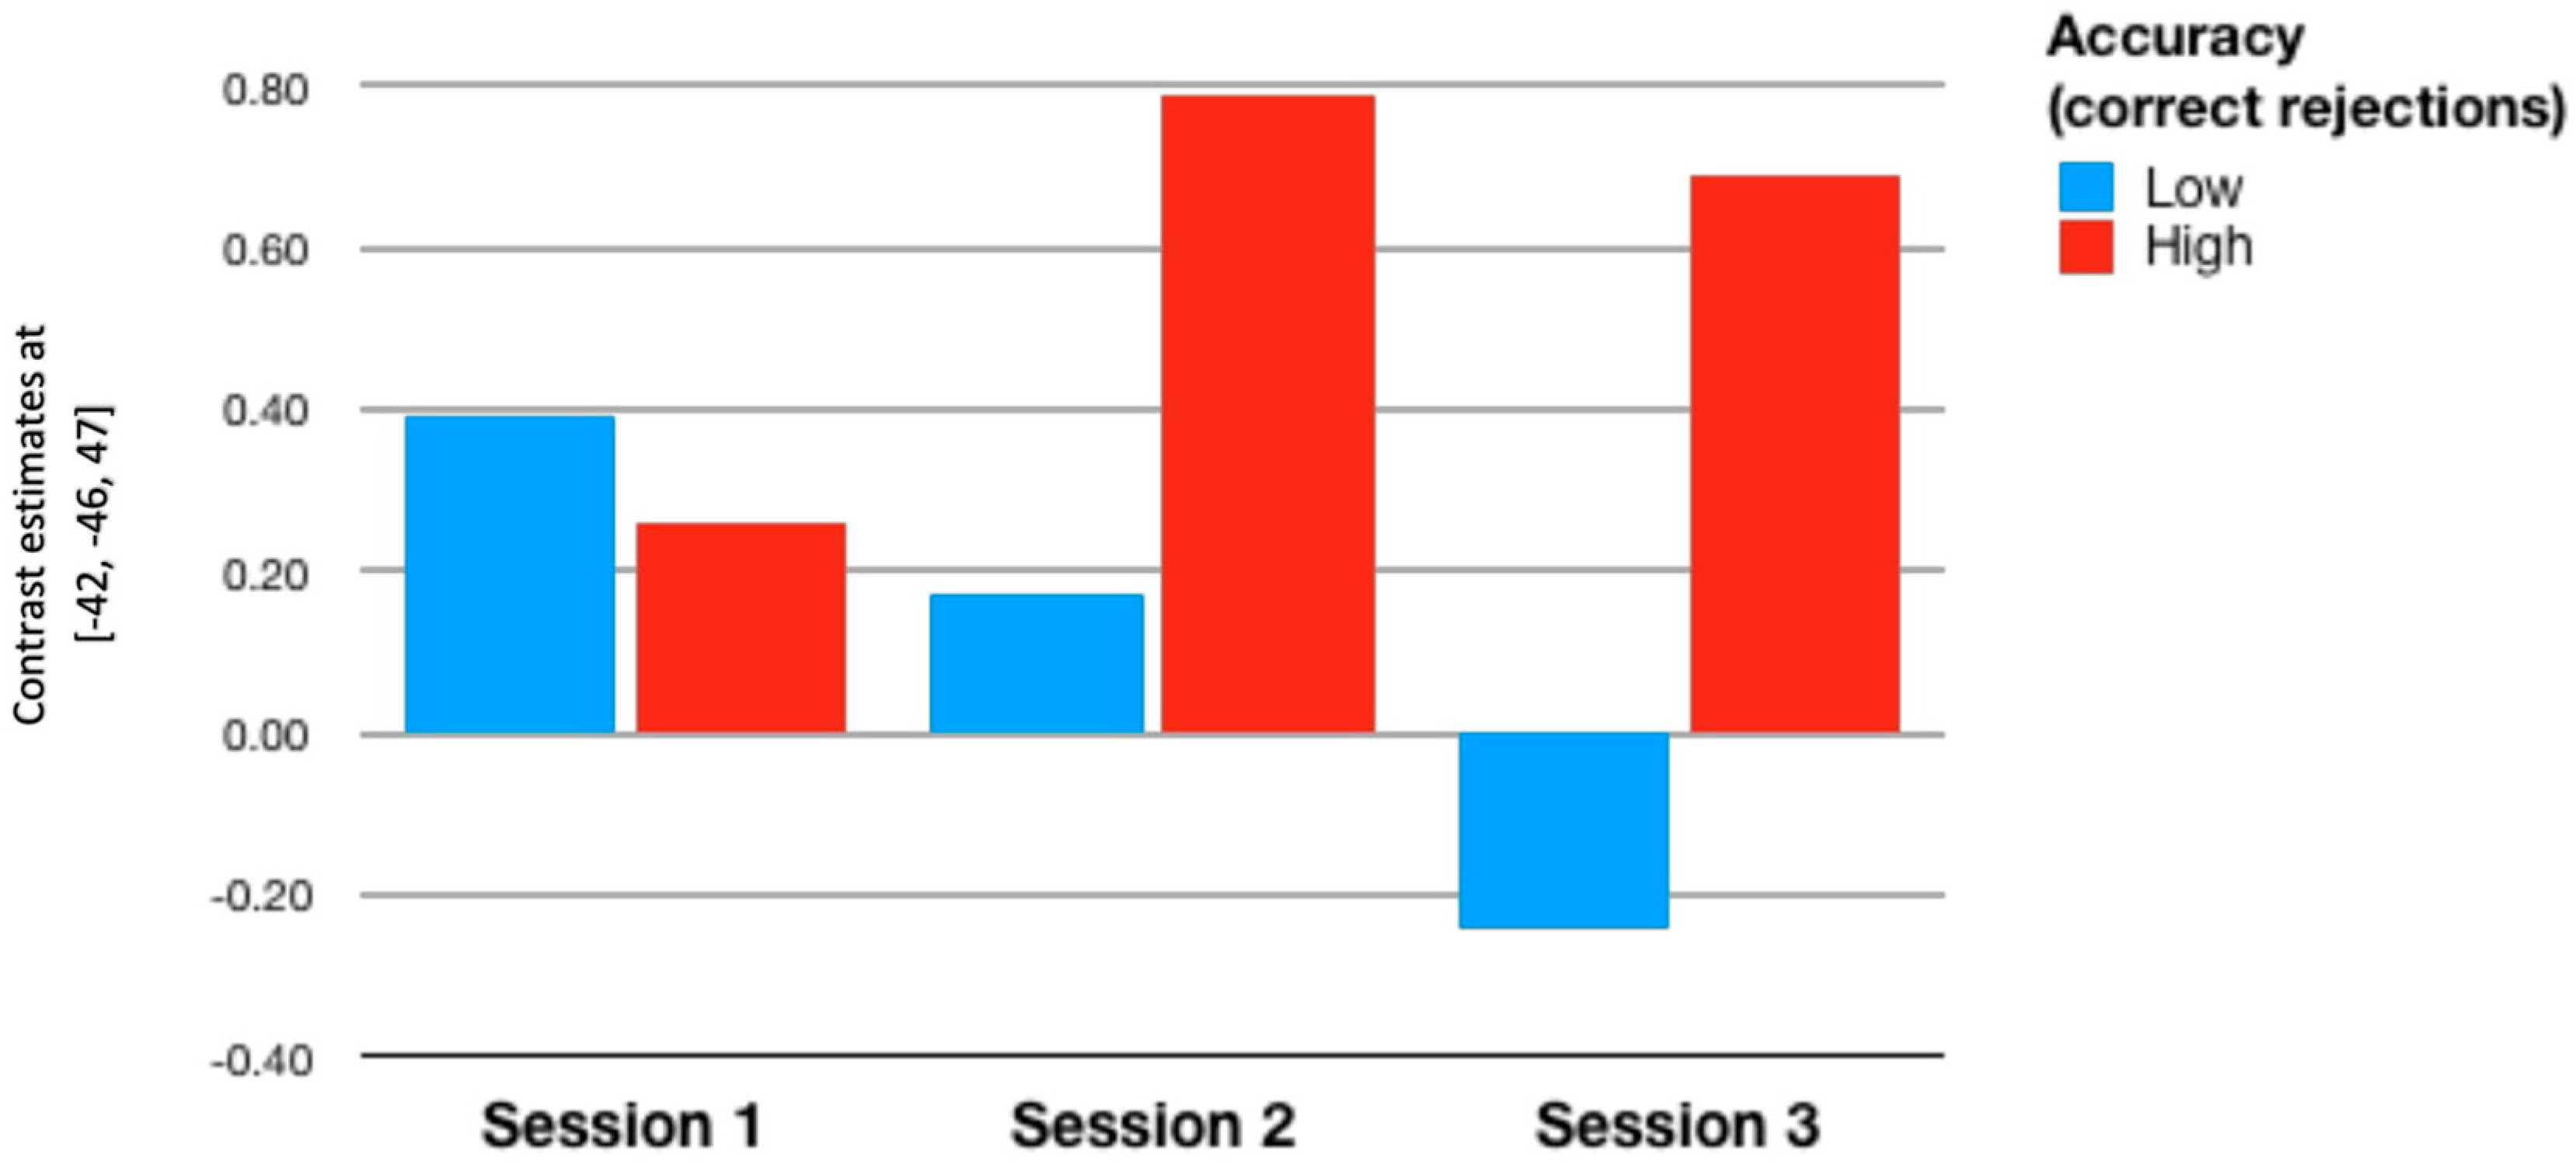
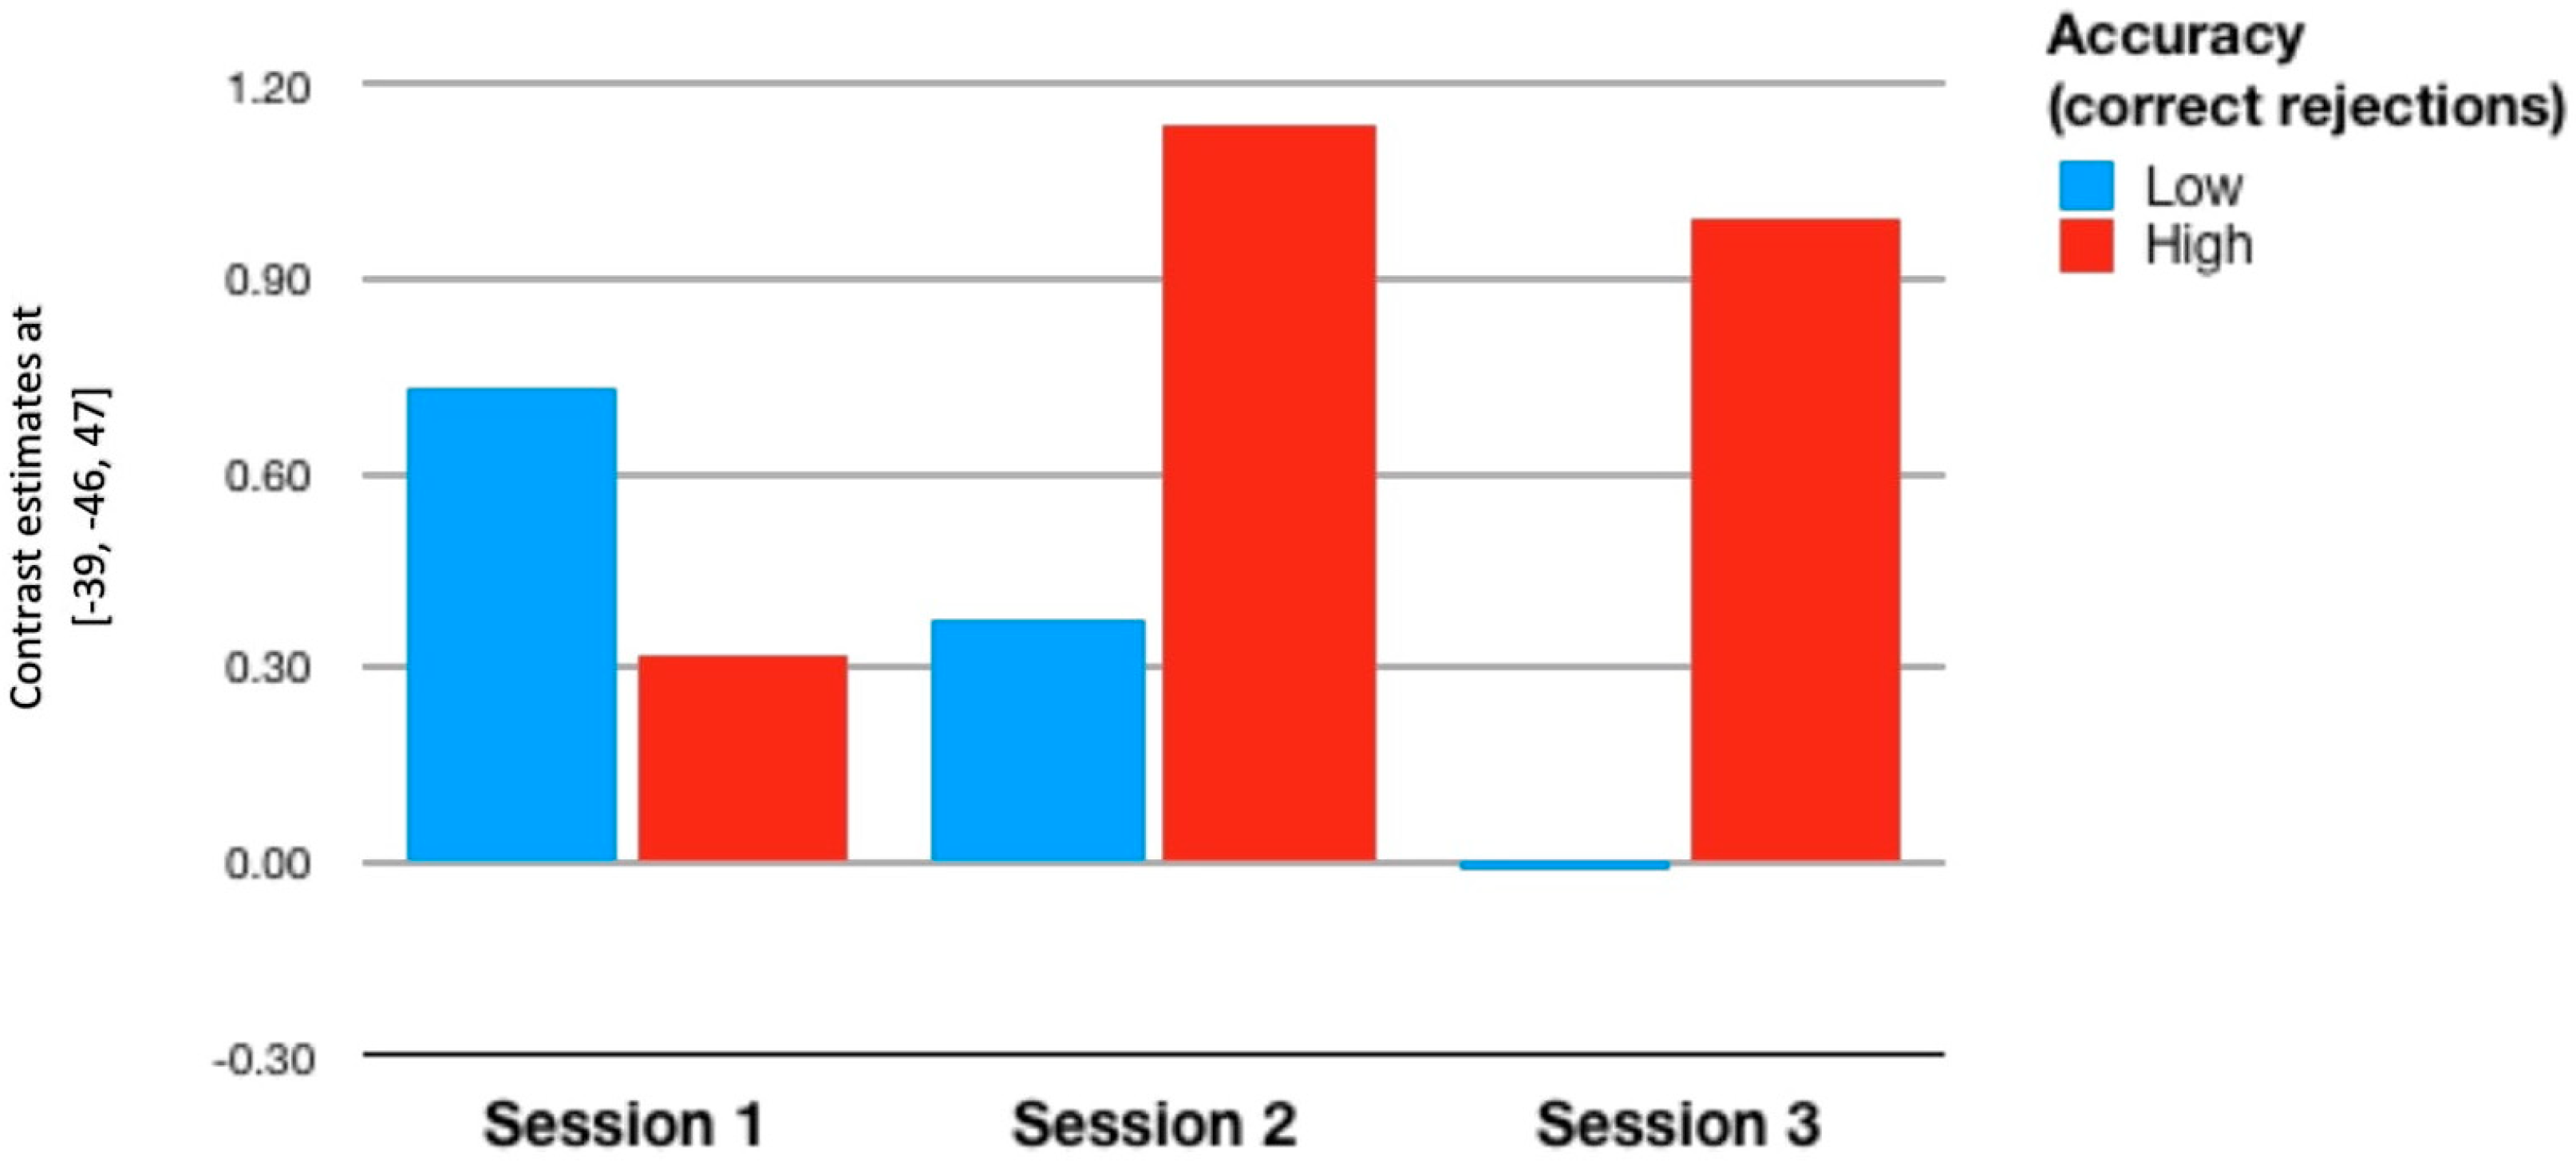
3.3. Individual Differences
4. Discussion
5. Conclusions
Author Contributions
Funding
Institutional Review Board Statement
Informed Consent Statement
Data Availability Statement
Acknowledgments
Conflicts of Interest
References
- Hampshire, A.; Sandrone, S.; Hellyer, P.J. A large-scale, cross-sectional investigation into the efficacy of brain training. Front. Hum. Neurosci. 2019, 13, 221. [Google Scholar] [CrossRef]
- Harvey, P.D.; McGurk, S.R.; Mahncke, H.; Wykes, T. Controversies in computerized cognitive training. Biol. Psychiatry Cogn. Neurosci. Neuroimaging 2018, 3, 907–915. [Google Scholar] [CrossRef] [PubMed]
- Hertzog, C.; Kramer, A.F.; Wilson, R.S.; Lindenberger, U. Enrichment effects on adult cognitive development. Psychol. Sci. Public Interest 2008, 9, 1–65. [Google Scholar] [CrossRef] [PubMed]
- Owen, A.M.; Hampshire, A.; Grahn, J.A.; Stenton, R.; Dajani, S.; Burns, A.S.; Howard, R.J.; Ballard, C.G. Putting brain training to the test. Nat. Cell Biol. 2010, 465, 775–778. [Google Scholar] [CrossRef] [PubMed]
- Simons, D.J.; Boot, W.R.; Charness, N.; Gathercole, S.E.; Chabris, C.F.; Hambrick, D.Z.; Stine-Morrow, E.A.L. Do “Brain-training” programs work? Psychol. Sci. Public Interest 2016, 17, 103–186. [Google Scholar] [CrossRef] [PubMed]
- Baddeley, A.; Hitch, G.J. Working memory. In Recent Advances in Learning and Motivation; Bower, G., Ed.; Academic Press: New York, NY, USA, 1974; Volume 8, pp. 47–90. [Google Scholar]
- Baddeley, A. Is Working Memory Still Working? 1Copyright © 2001 by the American Psychological Association. Reprinted with permission from the original publication: “Is Working Memory Still Working?” American Psychologist, 56, 849–864. This re-print publication is arranged in recognition of the conferral on Dr. Baddeley of the Aristotle Prize at the VIIth European Congress of Psychology, London, in July 2001, for his outstanding research on human working memory. The original publication in the American Psychologist related to Prof. Baddeley’s receipt of the Distinguished Scientific Contribution Award of the American Psychological Association in 2001. Eur. Psychol. 2002, 7, 85–97. [Google Scholar] [CrossRef]
- Miller, G.A. The magical number seven, plus or minus two: Some limits on our capacity for processing information. Psychol. Rev. 1956, 63, 81–97. [Google Scholar] [CrossRef]
- Gilhooly, K.J. Working Memory, Strategies, and Reasoning Tasks. In Working Memory and Thinking; Informa UK Limited: London, UK, 2010; pp. 7–22. [Google Scholar]
- Shah, P.; Miyake, A. The separability of working memory resources for spatial thinking and language processing: An individual differences approach. J. Exp. Psychol. Gen. 1996, 125, 4–27. [Google Scholar] [CrossRef]
- Just, A.; Carpenter, P. A capacity theory of comprehension: Individual differences in working memory. Psychol. Rev. 1992, 99, 122–149. [Google Scholar] [CrossRef]
- D’Esposito, M.; Postle, B.R. The cognitive neuroscience of working memory. Annu. Rev. Psychol. 2015, 66, 115–142. [Google Scholar] [CrossRef]
- Kane, M.J.; Engle, R.W. The role of prefrontal cortex in working-memory capacity, executive attention, and general fluid intelligence: An individual-differences perspective. Psychon. Bull. Rev. 2002, 9, 637–671. [Google Scholar] [CrossRef] [PubMed]
- Chuderski, A. When are fluid intelligence and working memory isomorphic and when are they not? Intelligence 2013, 41, 244–262. [Google Scholar] [CrossRef]
- Gathercole, S.E.; Woolgar, F.; Kievit, R.A.; Astle, D.; Manly, T.; Holmes, J. How Common are WM Deficits in Children with Difficulties in Reading and Mathematics? J. Appl. Res. Mem. Cogn. 2016, 5, 384–394. [Google Scholar] [CrossRef] [PubMed]
- Ilkowska, M.; Engle, R.W. Trait and State Differences in Working Memory Capacity. In Handbook of Individual Differences in Cognition; Springer Science and Business Media LLC: Berlin/Heidelberg, Germany, 2010; pp. 295–320. [Google Scholar]
- Schweizer, S.; Hampshire, A.; Dalgleish, T. Extending brain-training to the affective domain: Increasing cognitive and affective executive control through emotional working memory training. PLoS ONE 2011, 6, e24372. [Google Scholar] [CrossRef] [PubMed]
- Esoveri, A.; Antfolk, J.; Karlsson, L.; Salo, B.; Laine, M. Working memory training revisited: A multi-level meta-analysis of n-back training studies. Psychon. Bull. Rev. 2017, 24, 1077–1096. [Google Scholar] [CrossRef] [PubMed]
- Baniqued, P.L.; Allen, C.M.; Kranz, M.B.; Johnson, K.; Sipolins, A.; Dickens, C.; Ward, N.; Geyer, A.; Kramer, A.F. Working memory, reasoning, and task switching training: Transfer effects, limitations, and great expectations? PLoS ONE 2015, 10, e0142169. [Google Scholar] [CrossRef]
- Verhaeghen, P.; Cerella, J.; Basak, C. A Working memory workout: How to expand the focus of serial attention from one to four items in 10 hours or Less. J. Exp. Psychol. Learn. Mem. Cogn. 2004, 30, 1322–1337. [Google Scholar] [CrossRef]
- Dahlin, E.; Neely, A.S.; Larsson, A.; Bäckman, L.; Nyberg, L. Transfer of learning after updating training mediated by the striatum. Science 2008, 320, 1510–1512. [Google Scholar] [CrossRef]
- Schmiedek, F.; Lövdén, M.; Lindenberger, U. Hundred days of cognitive training enhance broad cognitive abilities in adulthood: Findings from the COGITO study. Front. Aging Neurosci. 2010, 2, 27. [Google Scholar] [CrossRef]
- Barnett, S.M.; Ceci, S.J. When and where do we apply what we learn? A taxonomy for far transfer. Psychol. Bull. 2002, 128, 612–637. [Google Scholar] [CrossRef]
- Jaeggi, S.M.; Buschkuehl, M.; Jonides, J.; Perrig, W.J. Improving fluid intelligence with training on working memory. Proc. Natl. Acad. Sci. USA 2008, 105, 6829–6833. [Google Scholar] [CrossRef] [PubMed]
- Au, J.; Sheehan, E.; Tsai, N.; Duncan, G.J.; Buschkuehl, M.; Jaeggi, S.M. Improving fluid intelligence with training on working memory: A meta-analysis. Psychon. Bull. Rev. 2014, 22, 366–377. [Google Scholar] [CrossRef] [PubMed]
- Buschkuehl, M.; Jaeggi, S.M.; Hutchison, S.; Perrig-Chiello, P.; Däpp, C.; Müller, M.; Breil, F.; Hoppeler, H.; Perrig, W.J. Impact of working memory training on memory performance in old-old adults. Psychol. Aging 2008, 23, 743–753. [Google Scholar] [CrossRef] [PubMed]
- Clark, C.M.; Lawlor-Savage, L.; Goghari, V.M. Working memory training in healthy young adults: Support for the null from a randomized comparison to active and passive control groups. PLoS ONE 2017, 12, e0177707. [Google Scholar] [CrossRef] [PubMed]
- Redick, T.S.; Shipstead, Z.; Harrison, T.L.; Hicks, K.L.; Fried, D.E.; Hambrick, D.Z.; Kane, M.J.; Engle, R.W. No evidence of intelligence improvement after working memory training: A randomized, placebo-controlled study. J. Exp. Psychol. Gen. 2013, 142, 359–379. [Google Scholar] [CrossRef] [PubMed]
- Shipstead, Z.; Redick, T.S.; Engle, R.W. Is working memory training effective? Psychol. Bull. 2012, 138, 628–654. [Google Scholar] [CrossRef]
- Karbach, J.; Verhaeghen, P. Making Working Memory Work. Psychol. Sci. 2014, 25, 2027–2037. [Google Scholar] [CrossRef]
- Moody, D.E. Can intelligence be increased by training on a task of working memory? Intelligence 2009, 37, 327–328. [Google Scholar] [CrossRef]
- Buschkuehl, M.; Hernandez-Garcia, L.; Jaeggi, S.M.; Bernard, J.A.; Jonides, J. Neural effects of short-term training on working memory. Cogn. Affect. Behav. Neurosci. 2014, 14, 147–160. [Google Scholar] [CrossRef]
- Stevens, M.C.; Gaynor, A.; Bessette, K.L.; Pearlson, G.D. A preliminary study of the effects of working memory training on brain function. Brain Imaging Behav. 2016, 10, 387–407. [Google Scholar] [CrossRef]
- Schweizer, S.; Grahn, J.A.; Hampshire, A.; Mobbs, D.; Dalgleish, T. Training the emotional brain: Improving affective control through emotional working memory training. J. Neurosci. 2013, 33, 5301–5311. [Google Scholar] [CrossRef] [PubMed]
- Constantinidis, C.; Klingberg, T. The neuroscience of working memory capacity and training. Nat. Rev. Neurosci. 2016, 17, 438–449. [Google Scholar] [CrossRef] [PubMed]
- Clark, C.M.; Lawlor-Savage, L.; Goghari, V.M. Functional brain activation associated with working memory training and transfer. Behav. Brain Res. 2017, 334, 34–49. [Google Scholar] [CrossRef] [PubMed]
- Heinzel, S.; Lorenz, R.C.; Pelz, P.; Heinz, A.; Walter, H.; Kathmann, N.; Rapp, M.A.; Stelzel, C. Neural correlates of training and transfer effects in working memory in older adults. Neuroimage 2016, 134, 236–249. [Google Scholar] [CrossRef]
- Miró-Padilla, A.; Bueichekú, E.; Ávila, C. Locating neural transfer effects of n-back training on the central executive: A longitudinal fMRI study. Sci. Rep. 2020, 10, 1–11. [Google Scholar] [CrossRef]
- Chang, L.; Løhaugen, G.C.; Andres, T.; Jiang, C.S.; Douet, V.; Tanizaki, N.; Walker, C.; Castillo, D.; Lim, A.; Skranes, J.; et al. Adaptive working memory training improved brain function in human immunodeficiency virus-seropositive patients. Ann. Neurol. 2016, 81, 17–34. [Google Scholar] [CrossRef]
- Erickson, K.I.; Colcombe, S.J.; Wadhwa, R.; Bherer, L.; Peterson, M.S.; Scalf, P.E.; Kim, J.S.; Alvarado, M.; Kramer, A.F. Training-induced functional activation changes in dual-task processing: An FMRI study. Cereb. Cortex 2006, 17, 192–204. [Google Scholar] [CrossRef]
- Buschkuehl, M.; Jaeggi, S.M.; Jonides, J. Neuronal effects following working memory training. Dev. Cogn. Neurosci. 2012, 2, S167–S179. [Google Scholar] [CrossRef]
- Salminen, T.; Kühn, S.; Frensch, P.A.; Schubert, T. Transfer after dual n-back training depends on striatal activation Change. J. Neurosci. 2016, 36, 10198–10213. [Google Scholar] [CrossRef]
- Rypma, B.; Berger, J.S.; Prabhakaran, V.; Bly, B.M.; Kimberg, D.Y.; Biswal, B.B.; D’Esposito, M. Neural correlates of cognitive efficiency. Neuroimage 2006, 33, 969–979. [Google Scholar] [CrossRef]
- Neubauer, A.C.; Fink, A. Intelligence and neural efficiency. Neurosci. Biobehav. Rev. 2009, 33, 1004–1023. [Google Scholar] [CrossRef] [PubMed]
- Haier, R.J.; Siegel, B.V.; Nuechterlein, K.H.; Hazlett, E.; Wu, J.C.; Paek, J.; Browning, H.L.; Buchsbaum, M.S. Cor-tical glucose metabolic rate correlates of abstract reasoning and attention studied with positron emission tomography. Intelligence 1988, 12, 199–217. [Google Scholar] [CrossRef]
- Dunst, B.; Benedek, M.; Jauk, E.; Bergner, S.; Koschutnig, K.; Sommer, M.; Ischebeck, A.; Spinath, B.; Arendasy, M.E.; Bühner, M.; et al. Neural efficiency as a function of task demands. Intelligence 2014, 42, 22–30. [Google Scholar] [CrossRef] [PubMed]
- Nussbaumer, D.; Grabner, R.H.; Stern, E. Neural efficiency in working memory tasks: The impact of task demand. Intelligence 2015, 50, 196–208. [Google Scholar] [CrossRef]
- Gobel, E.W.; Parrish, T.B.; Reber, P.J. Neural correlates of skill acquisition: Decreased cortical activity during a serial interception sequence learning task. Neuroimage 2011, 58, 1150–1157. [Google Scholar] [CrossRef]
- Rypma, B.; Prabhakaran, V. When less is more and when more is more: The mediating roles of capacity and speed in brain-behavior efficiency. Intelligence 2009, 37, 207–222. [Google Scholar] [CrossRef]
- McErlee, B. Working memory and focal attention. J. Exp. Psychol. Learn. Mem. Cogn. 2001, 27, 817–835. [Google Scholar]
- Logan, G.D. On the ability to inhibit thought and action: A users’ guide to the stop signal paradigm. In Inhibitory Processes in Attention, Memory, and Language; Dagenbach, D., Carr, T.H., Eds.; Academic Press: San Diego, CA, USA, 1994; pp. 189–239. [Google Scholar]
- Owen, A.M.; McMillan, K.M.; Laird, A.R.; Bullmore, E. N-back working memory paradigm: A meta-analysis of normative functional neuroimaging studies. Hum. Brain Mapp. 2005, 25, 46–59. [Google Scholar] [CrossRef]
- Miyake, A.; Friedman, N.P.; Emerson, M.J.; Witzki, A.H.; Howerter, A.; Wager, T.D. The unity and diversity of executive functions and their contributions to complex “frontal lobe” tasks: A latent variable analysis. Cogn. Psychol. 2000, 41, 49–100. [Google Scholar] [CrossRef]
- Raven, J.C.; Court, J.H.; Raven, J. Manual for Raven’s Progressive Matrices and Vocabulary Scales: Advanced Progressive Matrices Sets I and II; H. K. Lewis: London, UK, 1983. [Google Scholar]
- Oldfield, R. The assessment and analysis of handedness: The Edinburgh inventory. Neuropsychology 1971, 9, 97–113. [Google Scholar] [CrossRef]
- Poldrack, R.A. Region of interest analysis for fMRI. Soc. Cogn. Affect. Neurosci. 2007, 2, 67–70. [Google Scholar] [CrossRef]
- Baker, C. Promises and pitfalls of imaging the brain. Nat. Cell Biol. 2018, 562, 340–342. [Google Scholar] [CrossRef] [PubMed]
- Schmiedek, F. Methods and designs. In Cognitive Training; Strobach, T., Karbach, J., Eds.; Springer Science and Business Media LLC: Berlin/Heidelberg, Germany, 2016; pp. 9–18. [Google Scholar]
- Carlson, S.; Martinkauppi, S.; Rämä, P.; Salli, E.; Korvenoja, A.; Aronen, H.J. Distribution of cortical activation during visuospatial n-back tasks as revealed by functional magnetic resonance imaging. Cereb. Cortex 1998, 8, 743–752. [Google Scholar] [CrossRef]
- The American Association for Research into Nervous and Mental Diseases; Courtney, S.M.; Petit, L.; Haxby, J.V.; Ungerleider, L.G. The role of prefrontal cortex in working memory: Examining the contents of consciousness. Philos. Trans. R. Soc. B Biol. Sci. 1998, 353, 1819–1828. [Google Scholar] [CrossRef] [PubMed]
- Duann, J.-R.; Ide, J.S.; Luo, X.; Li, C.-S.R. Functional connectivity delineates distinct roles of the inferior frontal cortex and presupplementary motor area in stop signal inhibition. J. Neurosci. 2009, 29, 10171–10179. [Google Scholar] [CrossRef]
- Aron, A.R. Cortical and subcortical contributions to stop signal response inhibition: Role of the subthalamic nucleus. J. Neurosci. 2006, 26, 2424–2433. [Google Scholar] [CrossRef] [PubMed]
- Rubia, K.; Russella, T.; Overmeyera, S.; Brammer, M.J.; Bullmore, E.T.; Sharmaa, T.; Simmonsa, A.; Williams, S.C.R.; Giampietroa, V.; Andrew, C.; et al. Mapping Motor inhibition: Conjunctive brain activations across different versions of Go/No-go and stop tasks. Neuroimage 2001, 13, 250–261. [Google Scholar] [CrossRef]
- Kable, J.W.; Caulfield, M.K.; Falcone, M.; McConnell, M.; Bernardo, L.; Parthasarathi, T.; Cooper, N.; Ashare, R.; Audrain-McGovern, J.; Hornik, R.; et al. No Effect of commercial cognitive training on brain activity, choice behavior, or cognitive performance. J. Neurosci. 2017, 37, 7390–7402. [Google Scholar] [CrossRef]
- Poldrack, R.A. Is “efficiency” a useful concept in cognitive neuroscience? Dev. Cogn. Neurosci. 2015, 11, 12–17. [Google Scholar] [CrossRef]
- Salminen, T.; Martensson, J.; Schubert, T.; Kühn, S. Increased integrity of white matter pathways after dual n-back training. Neuroimage 2016, 133, 244–250. [Google Scholar] [CrossRef]
- Takeuchi, H.; Sekiguchi, A.; Taki, Y.; Yokoyama, S.; Yomogida, Y.; Komuro, N.; Yamanouchi, T.; Suzuki, S.; Kawashima, R. Training of working memory impacts structural connectivity. J. Neurosci. 2010, 30, 3297–3303. [Google Scholar] [CrossRef] [PubMed]
- Kowalczyk-Grębska, N.; Shi, F.; Magnuski, M.; Skorko, M.; Dobrowolski, P.; Kossowski, B.; Marchewka, A.; Bielecki, M.; Kossut, M.; Brzezicka, A. Real-time strategy video game experience and structural connectivity—A diffusion tensor imaging study. Hum. Brain Mapp. 2018, 39, 3742–3758. [Google Scholar] [CrossRef] [PubMed]


| Hits | Correct Rejections | ||||
|---|---|---|---|---|---|
| Group | Mean | SD | Mean | SD | |
| Session 1 | Control | 11.42 | 3.11 | 12.82 | 3.04 |
| Training | 10.78 | 2.20 | 12.67 | 2.79 | |
| All | 11.10 | 2.69 | 12.75 | 2.89 | |
| Session 2 | Control | 13.97 | 1.60 | 14.25 | 1.22 |
| Training | 12.86 | 2.78 | 13.75 | 1.61 | |
| All | 13.41 | 2.31 | 14.00 | 1.43 | |
| Session 3 | Control | 13.87 | 1.75 | 14.48 | 0.63 |
| Training | 12.41 | 3.05 | 14.16 | 1.15 | |
| All | 13.13 | 2.57 | 14.32 | 0.93 | |
| ROI Id | X | Y | Z | Hemisphere | p Value (FDR Corrected) | Name WFU | Anatomical Label |
|---|---|---|---|---|---|---|---|
| 1 | −42 | −46 | 47 | Left | p = 0.07 | BA.40 | Superior Parietal Lobule |
| 2 | −39 | −52 | 44 | Left | p = 0.011 | BA.40 | Inferior Parietal Lobule (SMG posterior) |
| 3 | −6 | 20 | 47 | Left | p = 0.007 | BA.08 | Superior Frontal Gyrus |
| 1 | −30 | −55 | 47 | Left | p = 0.044 | BA.07 | Superior Parietal Lobule |
| 2 | −6 | 8 | 56 | Left | p = 0.001 | BA.06 | Superior Frontal Gyrus (paracingulate gyrus) |
| 3 | 36 | −49 | 41 | Right | p = 0.001 | BA.40 | Inferior Parietal Lobule (SMG posterior) |
| 1 | −39 | −46 | 47 | Left | p = 0.001 | BA.40 | Superior Parietal Lobule |
| 2 | 36 | −52 | 44 | Right | p = 0.102 | BA.40 | Inferior Parietal Lobule (SMG posterior) |
| 3 | −6 | 8 | 59 | Left | p = 0.001 | BA.06 | Superior Frontal Gyrus (paracingulate gyrus) |
| Coordinates | p Value | p Value | Anatomical |
|---|---|---|---|
| (X, Y, Z) | (Uncorr.) | (FDR-Corr.) | Labels |
| ‘Stop vs. Go’ | |||
| (36, 26, −4) | p < 0.001 | p = 0.986 | Right Insula |
| (−3, −28, 62) | p < 0.001 | p = 0.986 | Left Paracentral Lobule |
| (−45, 26, −1) | p < 0.001 | p = 0.986 | Left Paracentral Lobule |
| (18, −64, 5) | p < 0.007 | p = 0.986 | Right Calcarine |
| ‘Stop vs. Fail’ | |||
| (−15, 23, 47) | p < 0.01 | p = 0.98 | Left Superior Frontal G. |
| (45, −19, 50) | p < 0.005 | p = 0.98 | Right Postcentral Gyrus |
| All (n = 46) | ||||||
| Hit 1 | Reject 1 | Hit 2 | Reject 2 | Hit 3 | Reject 3 | |
| RoI 1 | 0.062 | −0.17 | 0.202 | 0.082 | 0.07 | 0.452 ** |
| p = 0.683 | p = 0.259 | p = 0.177 | p = 0.588 | p = 0.646 | p = 0.002 | |
| RoI 2 | −0.053 | −0.089 | 0.103 | −0.065 | −0.068 | 0.389 ** |
| p = 0.727 | p = 0.557 | p = 0.497 | p = 0.669 | p = 0.651 | p = 0.008 | |
| RoI 3 | 0.095 | −0.029 | 0.177 | 0.109 | −0.168 | 0.12 |
| p = 0.532 | p = 0.847 | p = 0.238 | p = 0.469 | p = 0.264 | p = 0.426 | |
| Training (n = 23) | ||||||
| Hit 1 | Reject 1 | Hit 2 | Reject 2 | Hit 3 | Reject 3 | |
| RoI 1 | 0.141 | −0.076 | 0.315 | 0.204 | 0.183 | 0.554 ** |
| p = 0.512 | p = 0.731 | p = 0.144 | p = 0.351 | p = 0.404 | p = 0.006 | |
| RoI 2 | −0.034 | −0.164 | 0.248 | 0.088 | 0.05 | 0.491 * |
| p = 0.879 | p = 0.455 | p = 0.254 | p = 0.689 | p = 0.822 | p = 0.017 | |
| RoI 3 | 0.026 | 0.046 | 0.197 | 0.407 | −0.108 | 0.1 |
| p = 0.907 | p = 0.835 | p = 0.367 | p = 0.054 | p = 0.624 | p = 0.651 | |
| Control (n = 23) | ||||||
| Hit 1 | Reject 1 | Hit 2 | Reject 2 | Hit 3 | Reject 3 | |
| RoI 1 | 0.06 | −0.227 | 0.09 | −0.082 | −0.163 | 0.377 |
| p = 0.784 | p = 0.297 | p = 0.682 | p = 0.708 | p = 0.459 | p = 0.076 | |
| RoI 2 | −0.098 | −0.086 | −0.013 | −0.179 | −0.226 | 0.371 |
| p = 0.656 | p = 0.698 | p = 0.953 | p = 0.415 | p = 0.219 | p = 0.082 | |
| RoI 3 | 0.14 | −0.106 | 0.075 | −0.157 | -0.404 | 0.113 |
| p = 0.525 | p = 0.629 | p = 0.732 | p = 0.474 | p = 0.056 | p = 0.608 | |
Publisher’s Note: MDPI stays neutral with regard to jurisdictional claims in published maps and institutional affiliations. |
© 2021 by the authors. Licensee MDPI, Basel, Switzerland. This article is an open access article distributed under the terms and conditions of the Creative Commons Attribution (CC BY) license (http://creativecommons.org/licenses/by/4.0/).
Share and Cite
Nęcka, E.; Gruszka, A.; Hampshire, A.; Sarzyńska-Wawer, J.; Anicai, A.-E.; Orzechowski, J.; Nowak, M.; Wójcik, N.; Sandrone, S.; Soreq, E. The Effects of Working Memory Training on Brain Activity. Brain Sci. 2021, 11, 155. https://doi.org/10.3390/brainsci11020155
Nęcka E, Gruszka A, Hampshire A, Sarzyńska-Wawer J, Anicai A-E, Orzechowski J, Nowak M, Wójcik N, Sandrone S, Soreq E. The Effects of Working Memory Training on Brain Activity. Brain Sciences. 2021; 11(2):155. https://doi.org/10.3390/brainsci11020155
Chicago/Turabian StyleNęcka, Edward, Aleksandra Gruszka, Adam Hampshire, Justyna Sarzyńska-Wawer, Andreea-Elena Anicai, Jarosław Orzechowski, Michał Nowak, Natalia Wójcik, Stefano Sandrone, and Eyal Soreq. 2021. "The Effects of Working Memory Training on Brain Activity" Brain Sciences 11, no. 2: 155. https://doi.org/10.3390/brainsci11020155
APA StyleNęcka, E., Gruszka, A., Hampshire, A., Sarzyńska-Wawer, J., Anicai, A.-E., Orzechowski, J., Nowak, M., Wójcik, N., Sandrone, S., & Soreq, E. (2021). The Effects of Working Memory Training on Brain Activity. Brain Sciences, 11(2), 155. https://doi.org/10.3390/brainsci11020155