Article

Time Course Transcriptome Analysis of Spina Bifida Progression in Fetal Rats

1
Department of Orthopaedic Surgery, University of Cincinnati, Cincinnati, OH 45267, USA
2
Center for Fetal and Placental Research, Division of Pediatric General and Thoracic Surgery, Cincinnati Children’s Hospital and Medical Center, Cincinnati, OH 45229, USA
3
Department of Pediatrics, University of Cincinnati, Cincinnati, OH 45267, USA
*
Author to whom correspondence should be addressed.
Brain Sci. 2021, 11(12), 1593; https://doi.org/10.3390/brainsci11121593
Submission received: 25 October 2021 / Revised: 9 November 2021 / Accepted: 24 November 2021 / Published: 30 November 2021
(This article belongs to the Section Developmental Neuroscience)

Abstract

:
A better understanding of the transcriptomic modifications that occur in spina bifida may lead to identify mechanisms involved in the progression of spina bifida in utero and the development of new therapeutic strategies that aid in spinal cord regeneration after surgical interventions. In this study, RNA-sequencing was used to identify differentially expressed genes in fetal spinal cords from rats with retinoic acid-induced spina bifida at E15, E17, and E20. Gene ontology, KEGG, and protein–protein interaction analysis were conducted to predict pathways involved in the evolution of the disease. Approximately 3000, 1000 and 300 genes were differentially expressed compared to the control groups at E15, E17 and E20, respectively. Overall, the results suggest common alterations in certain pathways between gestational time points, such as upregulation in p53 and sonic hedgehog signaling at E15 and E17 and downregulation in the myelin sheath at E17 and E20. However, there were other modifications specific to gestational time points, including skeletal muscle development at E15, downregulated glucose metabolism at E17, and upregulated inflammation at E20. In conclusion, this work provides evidence that gestational age during spina bifida repair may be a significant variable to consider during the development of new regenerative therapeutics approaches.

Graphical Abstract

1. Introduction

Myelomeningocele (MMC), the most significant form of spina bifida, is a devastating congenital malformation of the spinal cord associated with severe morbidity and mortality [1]. This “two-hit” process occurs during the folding of the neural plate into the neural tube during early development, 3–4 weeks of gestation, resulting in the lack of sclerotomal coverage leaving the neural tissue directly exposed to the amniotic fluid [2,3], called the “first hit” followed by an in utero acquired neurodegeneration by the chemical action of the amniotic fluid to the neural tissue or “second hit”. This can result in severe consequences, including decreased mobility and limb paralysis, bladder and intestinal incontinence, and stunted neurological function [4]. Evidence indicates that consequences progress in severity if not corrected in utero; however, fetal repair only stops progression in most cases, as it does not reverse the existing damage [5,6,7].
Despite the advances in surgical techniques for spina bifida repair in utero, effective regenerative treatments for the devastating neurotological alteration have not yet been developed. To develop better therapeutic approaches, it is extremely important to understand the molecular changes present in the neural tissue once the defect has occurred and during this progressive degeneration in utero. The analysis of transcriptome studies at different time points throughout gestation would provide in-depth knowledge of the regulatory changes present in the neural tissue of the neurodegenerative progression in utero after spina bifida occurs. Through these studies, pathways could be identified as therapeutic targets to aid in spinal cord regeneration.
In a follow-up study to our previous publication [8], we have performed a comprehensive time-course transcriptomic analysis of the commonly used congenital retinoic acid (RA)-induced spina bifida rat model to characterize the progressive changes that occur in the neural tissue after the development of spina bifida [4]. Gene expression was analyzed in the spinal cords of three fetal gestational points: E15, E17, and E20 of fetuses with spina bifida and controls, using RNA sequencing. The justification of these time points was based on lung and spinal cord development since lung development is known as an indicator of maturity and organogenesis when comparing humans and rodents. Lung development predominantly occurs during the canalicular–saccular phase in mice from E17 to birth. Comparatively, this reflects changes that occur during weeks 15–38 of gestation in humans [9]. Additionally, spinal cord neurogenesis begins at E11 and peaks around E17 in rodents with the beginning of the gliogenesis processes [10,11]. Furthermore, this reflects changes that occur during weeks 22–24 of gestation in humans. Therefore, these time points make sense in order to study the progression of the defect in response to amniotic fluid exposure. Additionally, we identify an important role of specific pathways along with the progression of the disease in utero. We conclude that these results will guide future studies of strategies to regenerate spinal cord tissue after or during in utero spina bifida repair [12].

2. Materials and Methods

2.1. Animals

Sprague Dawley rats weighing 200–250 g (Charles River Laboratories, Inc., Wilmington, NC, USA) were housed at 22 °C in a standard dark:light cycle (10:14 h) with access to water and standard food ad libitum. The mating date was defined as E-1 and plug day as E0. The experimental protocol was in agreement with the National Institutes of Health Guidelines for Care and Use of Laboratory Animals and was approved by the Institutional Animal Care and Use Committee at Cincinnati Children’s Hospital and Medical Center (IACUC 2019-0081).

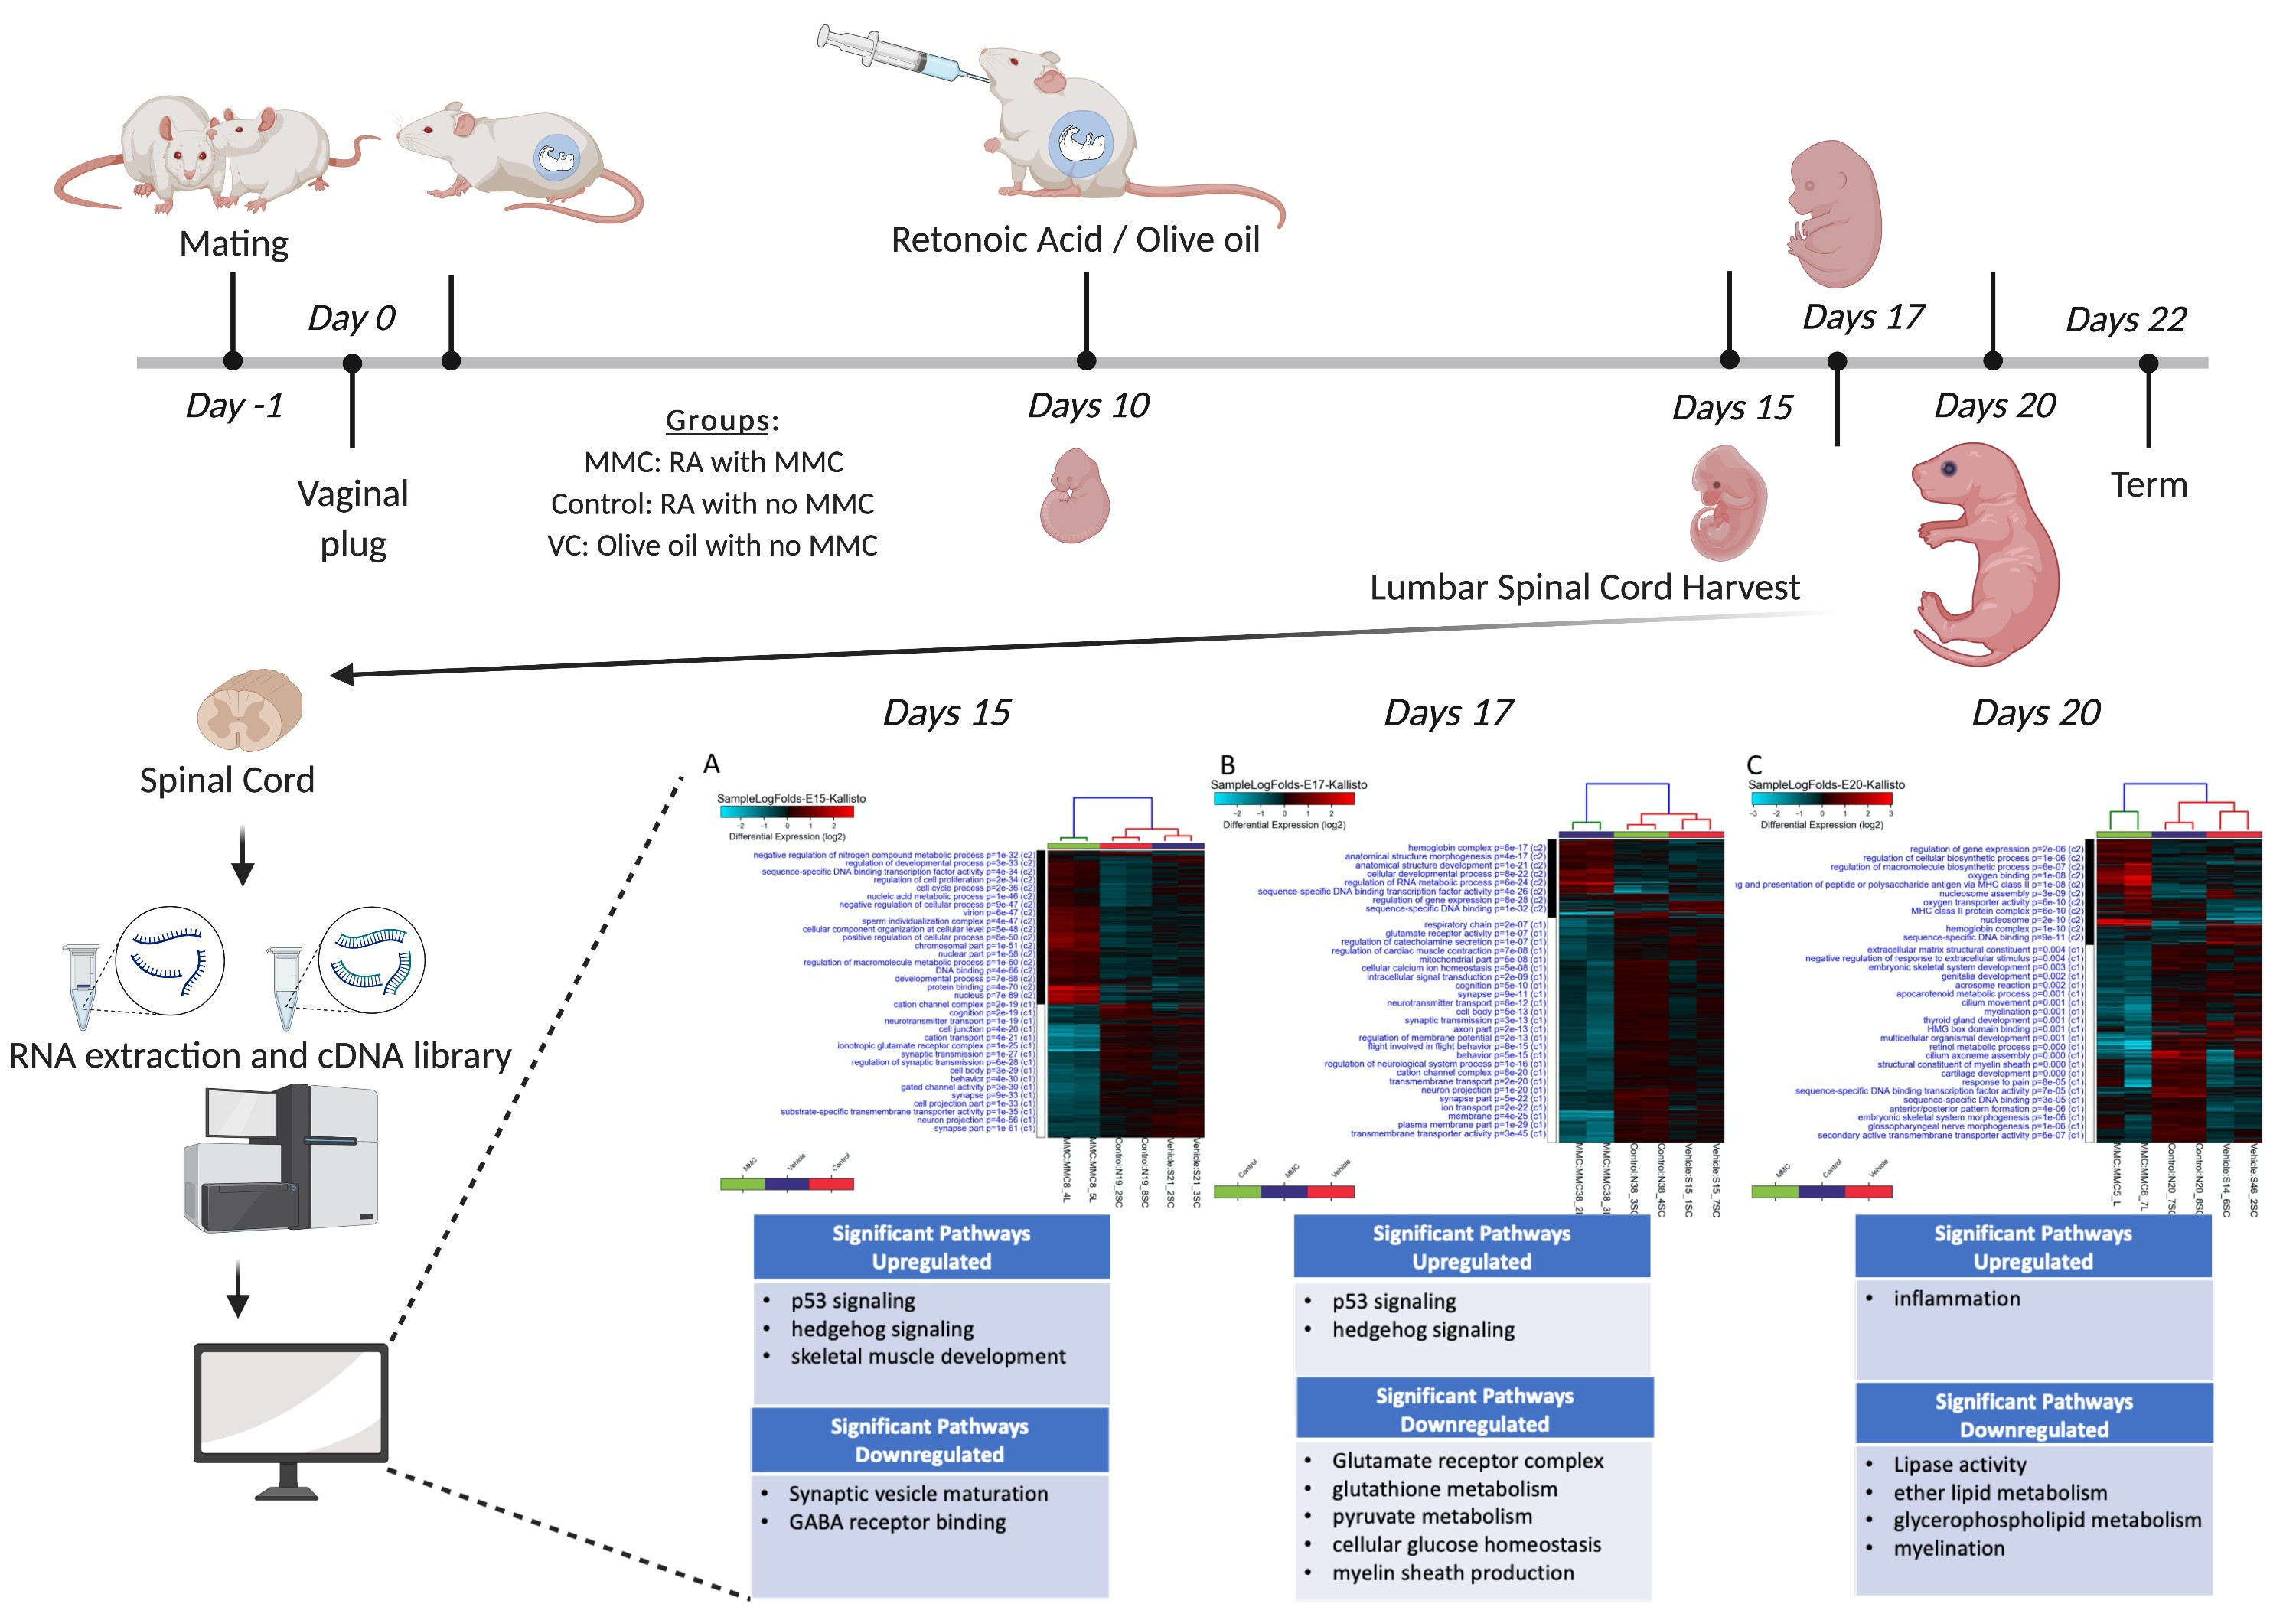
2.2. Congenital Retinoic Acid (RA) Induced Spina Bifida Animal Model

On E10 at 10:00 a.m., pregnant dams were gavaged with 100 mg/kg trans-retinoic acid (RA) (Sigma Aldrich, St. Louis, MO, USA) solubilized in olive oil or an equal volume of olive oil only (vehicle). With this model, 70% of fetuses in each liter were diagnosed with spina bifida based on open spinal defect [8]. At E15, E17, and E20, pregnant dames were humanely sacrificed and fetuses from three different groups were harvested: (i) MMC—open spinal cords from fetuses with RA-induced spina bifida; (ii) control—spinal cords from non-affected siblings from mothers who received Ra; and (iii) vehicle—spinal cords from fetuses whose mothers received olive oil only.

2.3. Tissue Processing and RNA Extraction

At E15, E17, and E20, comparable size spinal cords from vehicle, control, and MMC fetuses were dissected from the lumbar region and snap-frozen and stored at −80 °C until used for gene expression analysis. In MMC fetuses, only the spinal cord from the open area were dissected. Frozen spinal cords were homogenized using an IkaT10 basic Ultra-Turrax homogenizer in RLT buffer and then RNA was extruded using the RNeasy Plus Mini Kit (Qiagen Science, Hilden, Germany) following the manufacturer’s protocol. RNA quantity was assessed through spectrophotometric analysis using an Epoch Biotek spectrophotometer (Biotek Instruments, Winooski, VT, USA).

2.4. cDNA Library Preparation and Sequencing

Agarose gels (1%) were used to monitor RNA degradation and contamination. RNA purity was assessed using the NanoPhotometer® spectrophotometer (Implen, West Lake Village, CA, USA). RNA concentration was measured using the Qubit® RNA Assay Kit in a Qubit® 2.0 Fluorometer (Life Technologies, Carlsbad, CA, USA) and the RNA integrity was evaluated using the RNA Nano6000 Assay Kit for the Bioanalyzer 2100 system (Agilent Technologies, Santa Clara, CA, USA).
Three micrograms of total RNA per sample were used to generate sequencing libraries (n = 2 animals per group per time point). Libraries were generated using the NEBNext® UltraTM RNA Library Prep Kit for Illumina® (NEB, Ipswich, MA, USA) following the manufacturer’s recommendations. cDNA products were purified using the AMPure XP system and library quality was determined using the Agilent Bioanalyzer 2100 system. The cBot Cluster Generation System using the HiSeq PE Cluster Kit cBot-HS (Illumina, San Diego, CA, USA) was used to cluster the samples according to the manufacturer’s instructions. After this, the library products were sequenced on an Illumina HiSeq (Illumina, San Diego, CA, USA) and 125 bp/150 bp paired-end reads were generated per sample.

2.5. RNA-Seq Data Processing and Analysis

Raw FastQ files were processed through in-house Perl scripts, where clean reads were obtained by removing reads containing adapter or poly(N) as well as low-quality reads. TopHat v2.0.12 was used to align clean reads to the reference genome, which was built using Bowtie v2.2.3. HTSeq v 0.6.1 was used to calculate the fragments per kilobase of exon per million base pairs mapped (FPKM) based on the gene’s length and reads mapped to that gene. Differential expression analysis was performed using the DESeqR software v1.18.0. The resulting p values less than 0.05 were considered differentially expressed. This analysis identified differentially expressed genes (DEGs) between control, vehicle, and MMC groups at E15, E17, and E20. Principal component analysis was conducted using the AltAnalyzer package v2.0 (http://www.altanalyze.org, accessed on 18 February 2021) [13,14,15]. The GOseqR package was used to perform gene ontology (GO) enrichment analysis and GO terms with a p value less than 0.05 were considered statistically significant. RNAseq data were deposited in the Sequence Read Archive (SRA) and can be found via BioProject (PRJNA683230) and SRA(PRJNA683793). The protein–protein interaction network (PPI) was constructed and illustrated using the search tool for the retrieval of interacting genes/proteins (STRING) (https://string-db.org/, accessed on 27 May 2021) database to reveal the relationships of the top 25 DEGs based on a minimum required interaction.

2.6. RT-qPCR Analysis

Utilizing the RT2 First Strand Kit (Qiagen, Germantown, MD, USA), 1 µg RNA /sample was reverse transcribed into cDNA. Four to six samples from the MMC and vehicle groups were analyzed. A 1 µg cDNA sample was then used as a template for RT-qPCR employing TaqMan® gene expression assays (Applied Biosystems, Foster City, CA, USA) (Table 1) in the 7500 Fast Real-Time PCR system. Samples were run in duplicate for target genes and were normalized using HPRT1 as an endogenous control.

2.7. Statistical Analysis

All graphs were performed in GraphPad Prism9 software (GraphPad Software Inc., La Jolla, CA, USA). A fold change > 1.5 and p value < 0.05 was considered statistically significant. Relative quantification of transcript expression from RT-qPCR was performed using the 2−ΔΔCt method comparing MMC and vehicle, where Ct represents the threshold cycle. Error bars indicate the standard error of the mean.

3. Results

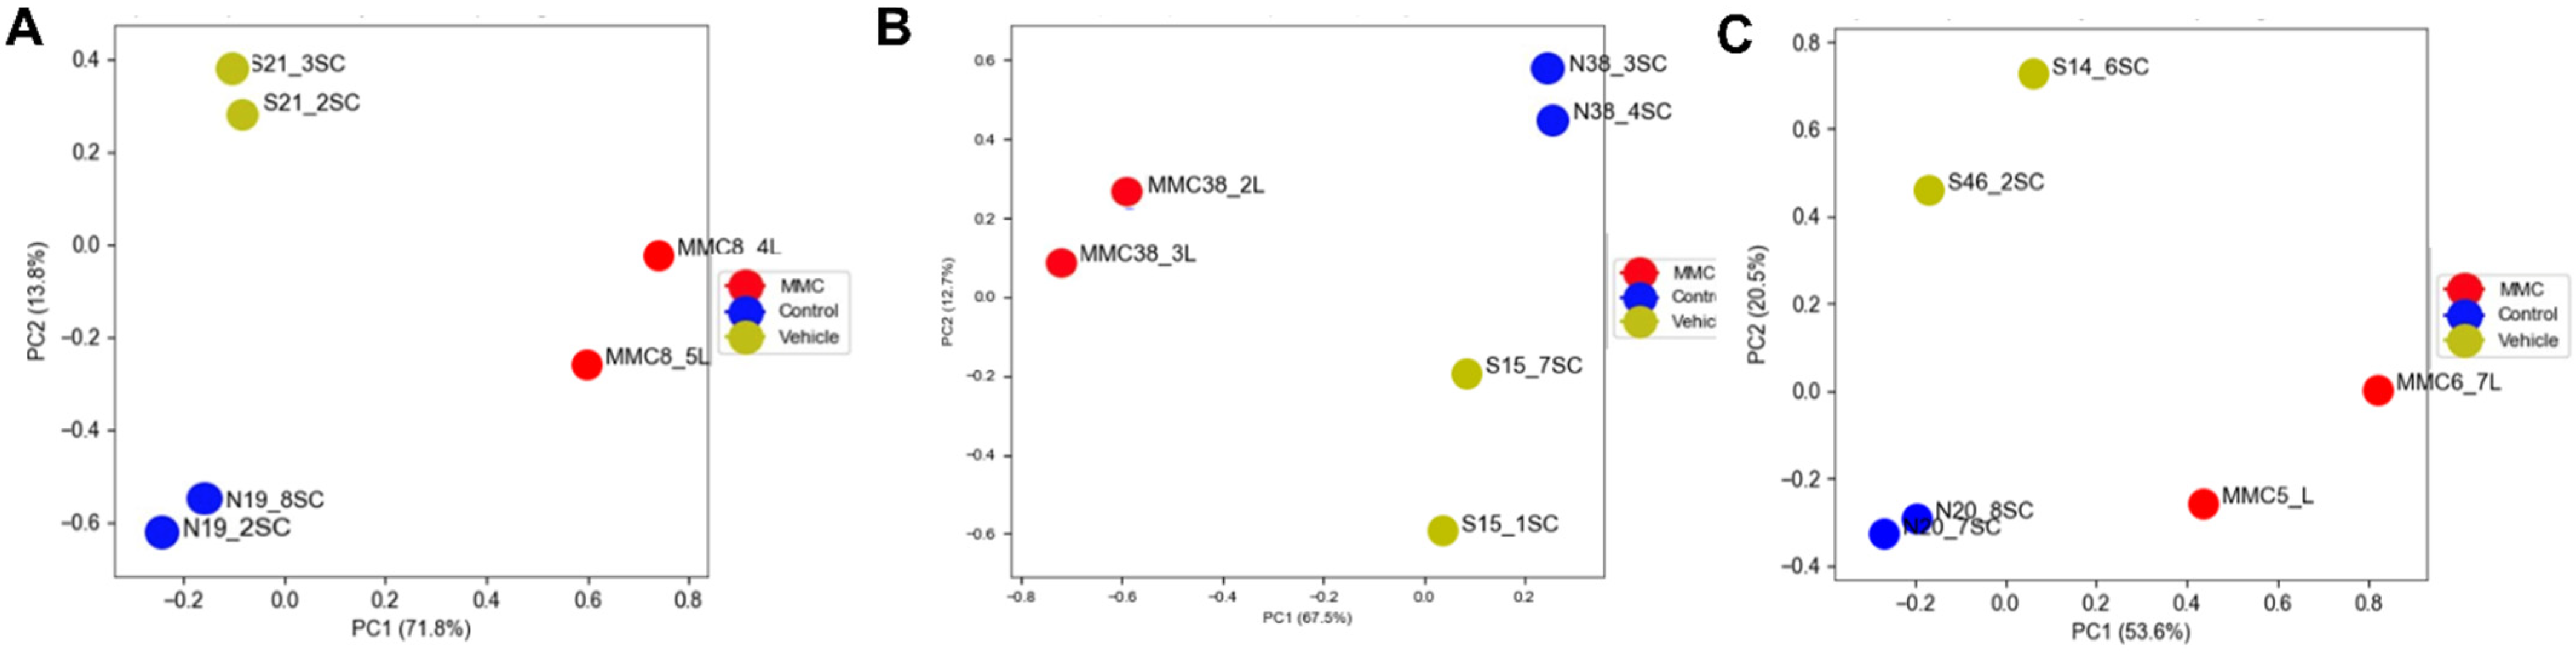
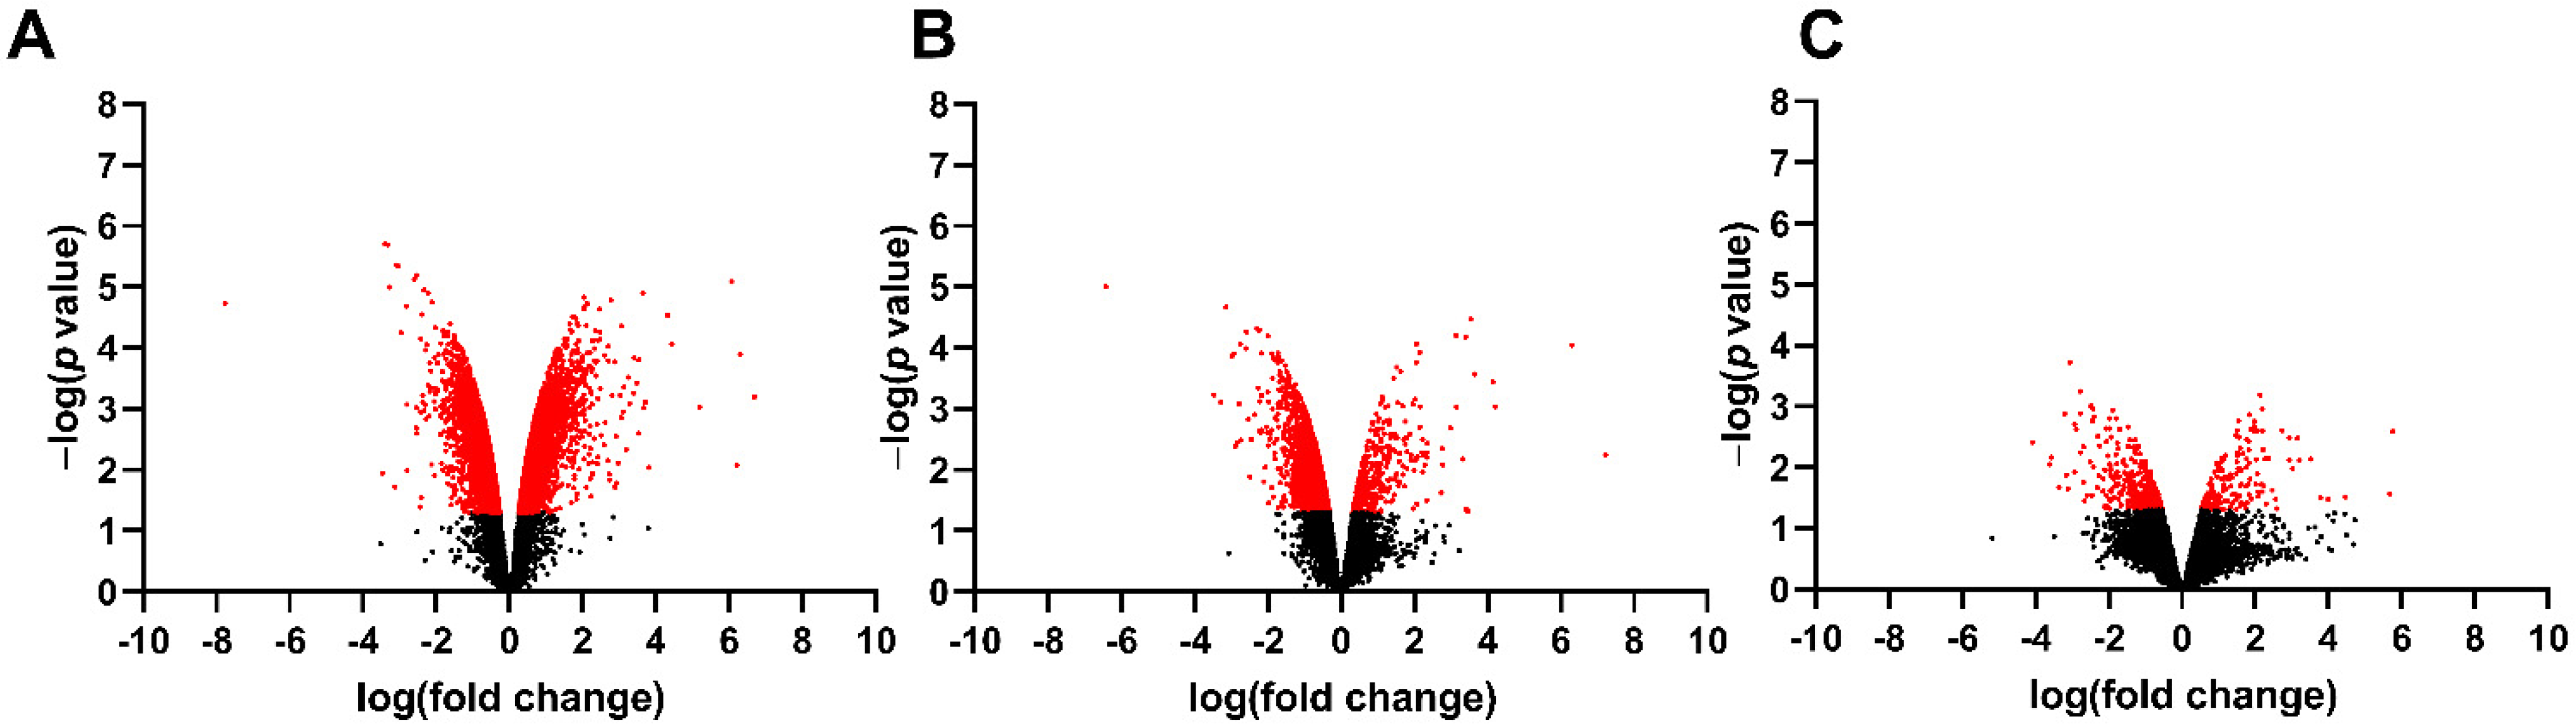
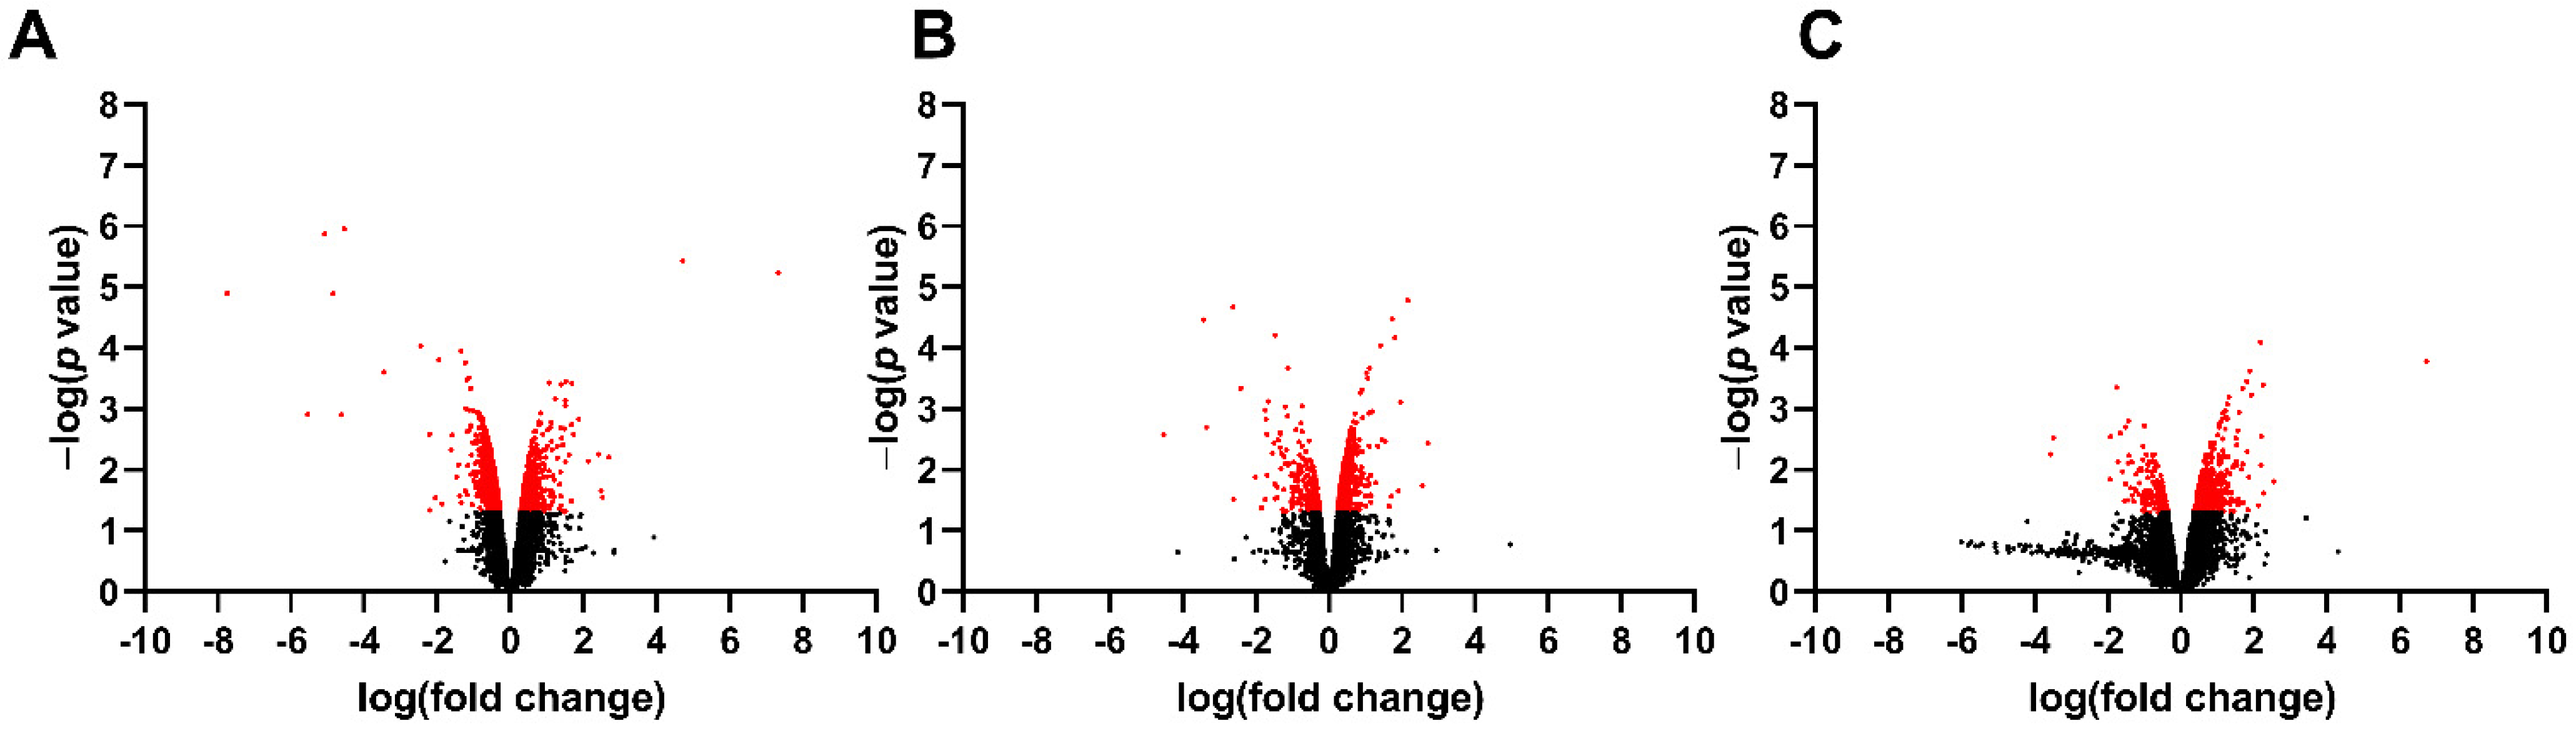
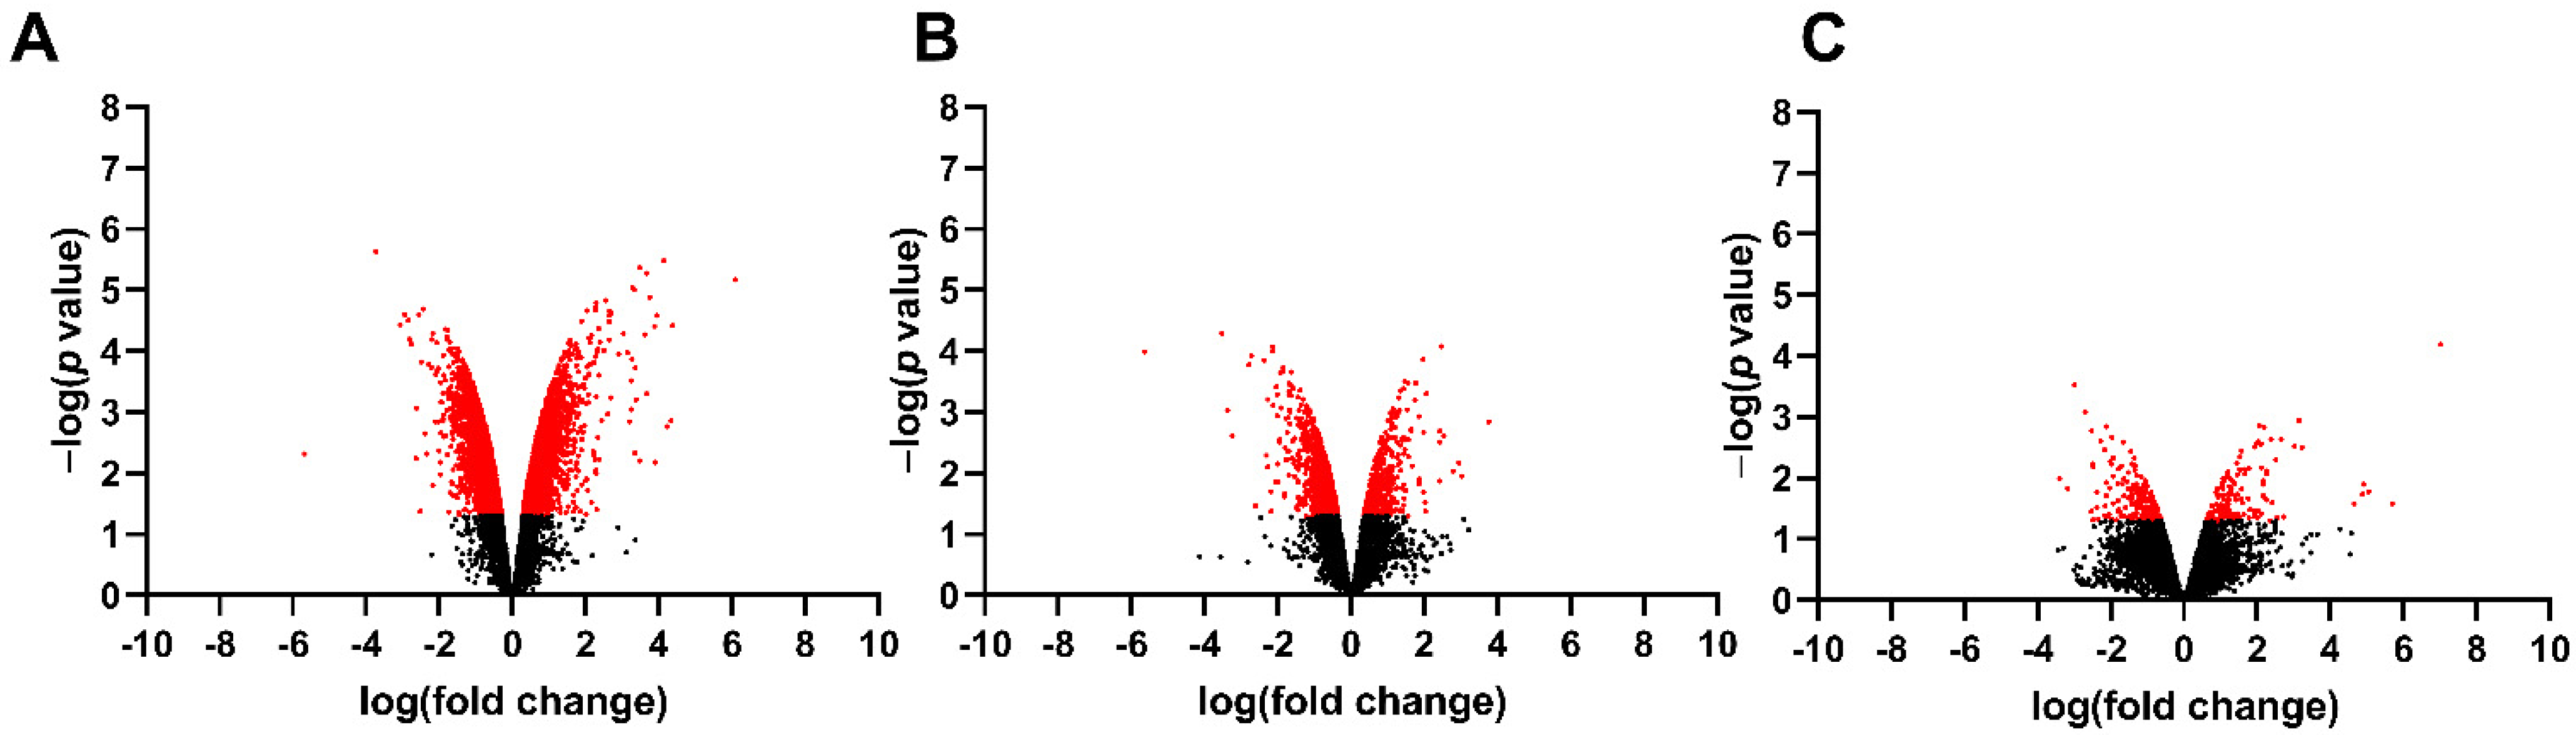
3.1. Differentially Expressed Genes in the Fetal Spinal Cord after MMC Occurs

To identify spinal cord changes in gene expression after MMC occurs in rat fetuses, we compared RNA-sequencing data between MMC, control, and vehicle groups at E15, E17, and E20. Principal component analysis indicates segregation of transcriptomes from the MMC group compared to the vehicle and control groups at each time point (Figure 1). The number of DEGs, identified as >1.5-fold change and p < 0.05 for each comparison at each time point is found in Table 2. Interestingly, the number of DEGs between MMC and either control or vehicle were greater than the control, compared to the vehicle, and the number of DEGs decreased between each comparison as gestation progressed. These trends are illustrated as volcano plots found in Figure 2 (MMC vs. vehicle), Figure 3 (MMC vs. control), and Figure 4 (control vs. vehicle).
Hierarchical clustering analysis indicates that vehicle and control groups cluster together compared to the MMC group at each time point studied (Figure 5). These data indicate that at E15 and E17, genes involved in neurological systems function, such as synaptic transmission, synapse, neuron projection, and neurotransmitter transport, are downregulated in MMC compared to either control or vehicle (Figure 5A,B). Additionally, at E20, inflammatory genes, such as those involved in MHC class II antigen presentation, are upregulated, and genes involved in the development of the myelin sheath are downregulated in MMC compared to the control groups (Figure 5C). Because of this clustering pattern, we chose to focus our further analyses on the comparison between MMC and vehicle at each time point; however, the comparisons between MMC and control and control compared to the vehicle can be found in the Supplemental Information.
The 25 genes that are most significantly upregulated and downregulated between MMC and vehicle groups at E15, E17 and E20 are listed in Table 3, Table 4 and Table 5 respectively. Additionally, the top 25 upregulated and downregulated DEGs between MMC and control at E15, E17, and E20 are listed in Supplementary Tables S1–S3 respectively. Furthermore, the top 25 upregulated and downregulated DEGs between control and vehicle at each time point are listed in Supplementary Tables S4–S6.
Collectively, these results provide initial evidence that downregulated genes at E15 and E17 may lead to a decline in neural function and upregulated genes at E20 result in inflammation and disruption in myelin sheath development in rat fetuses with RA-induced MMC.

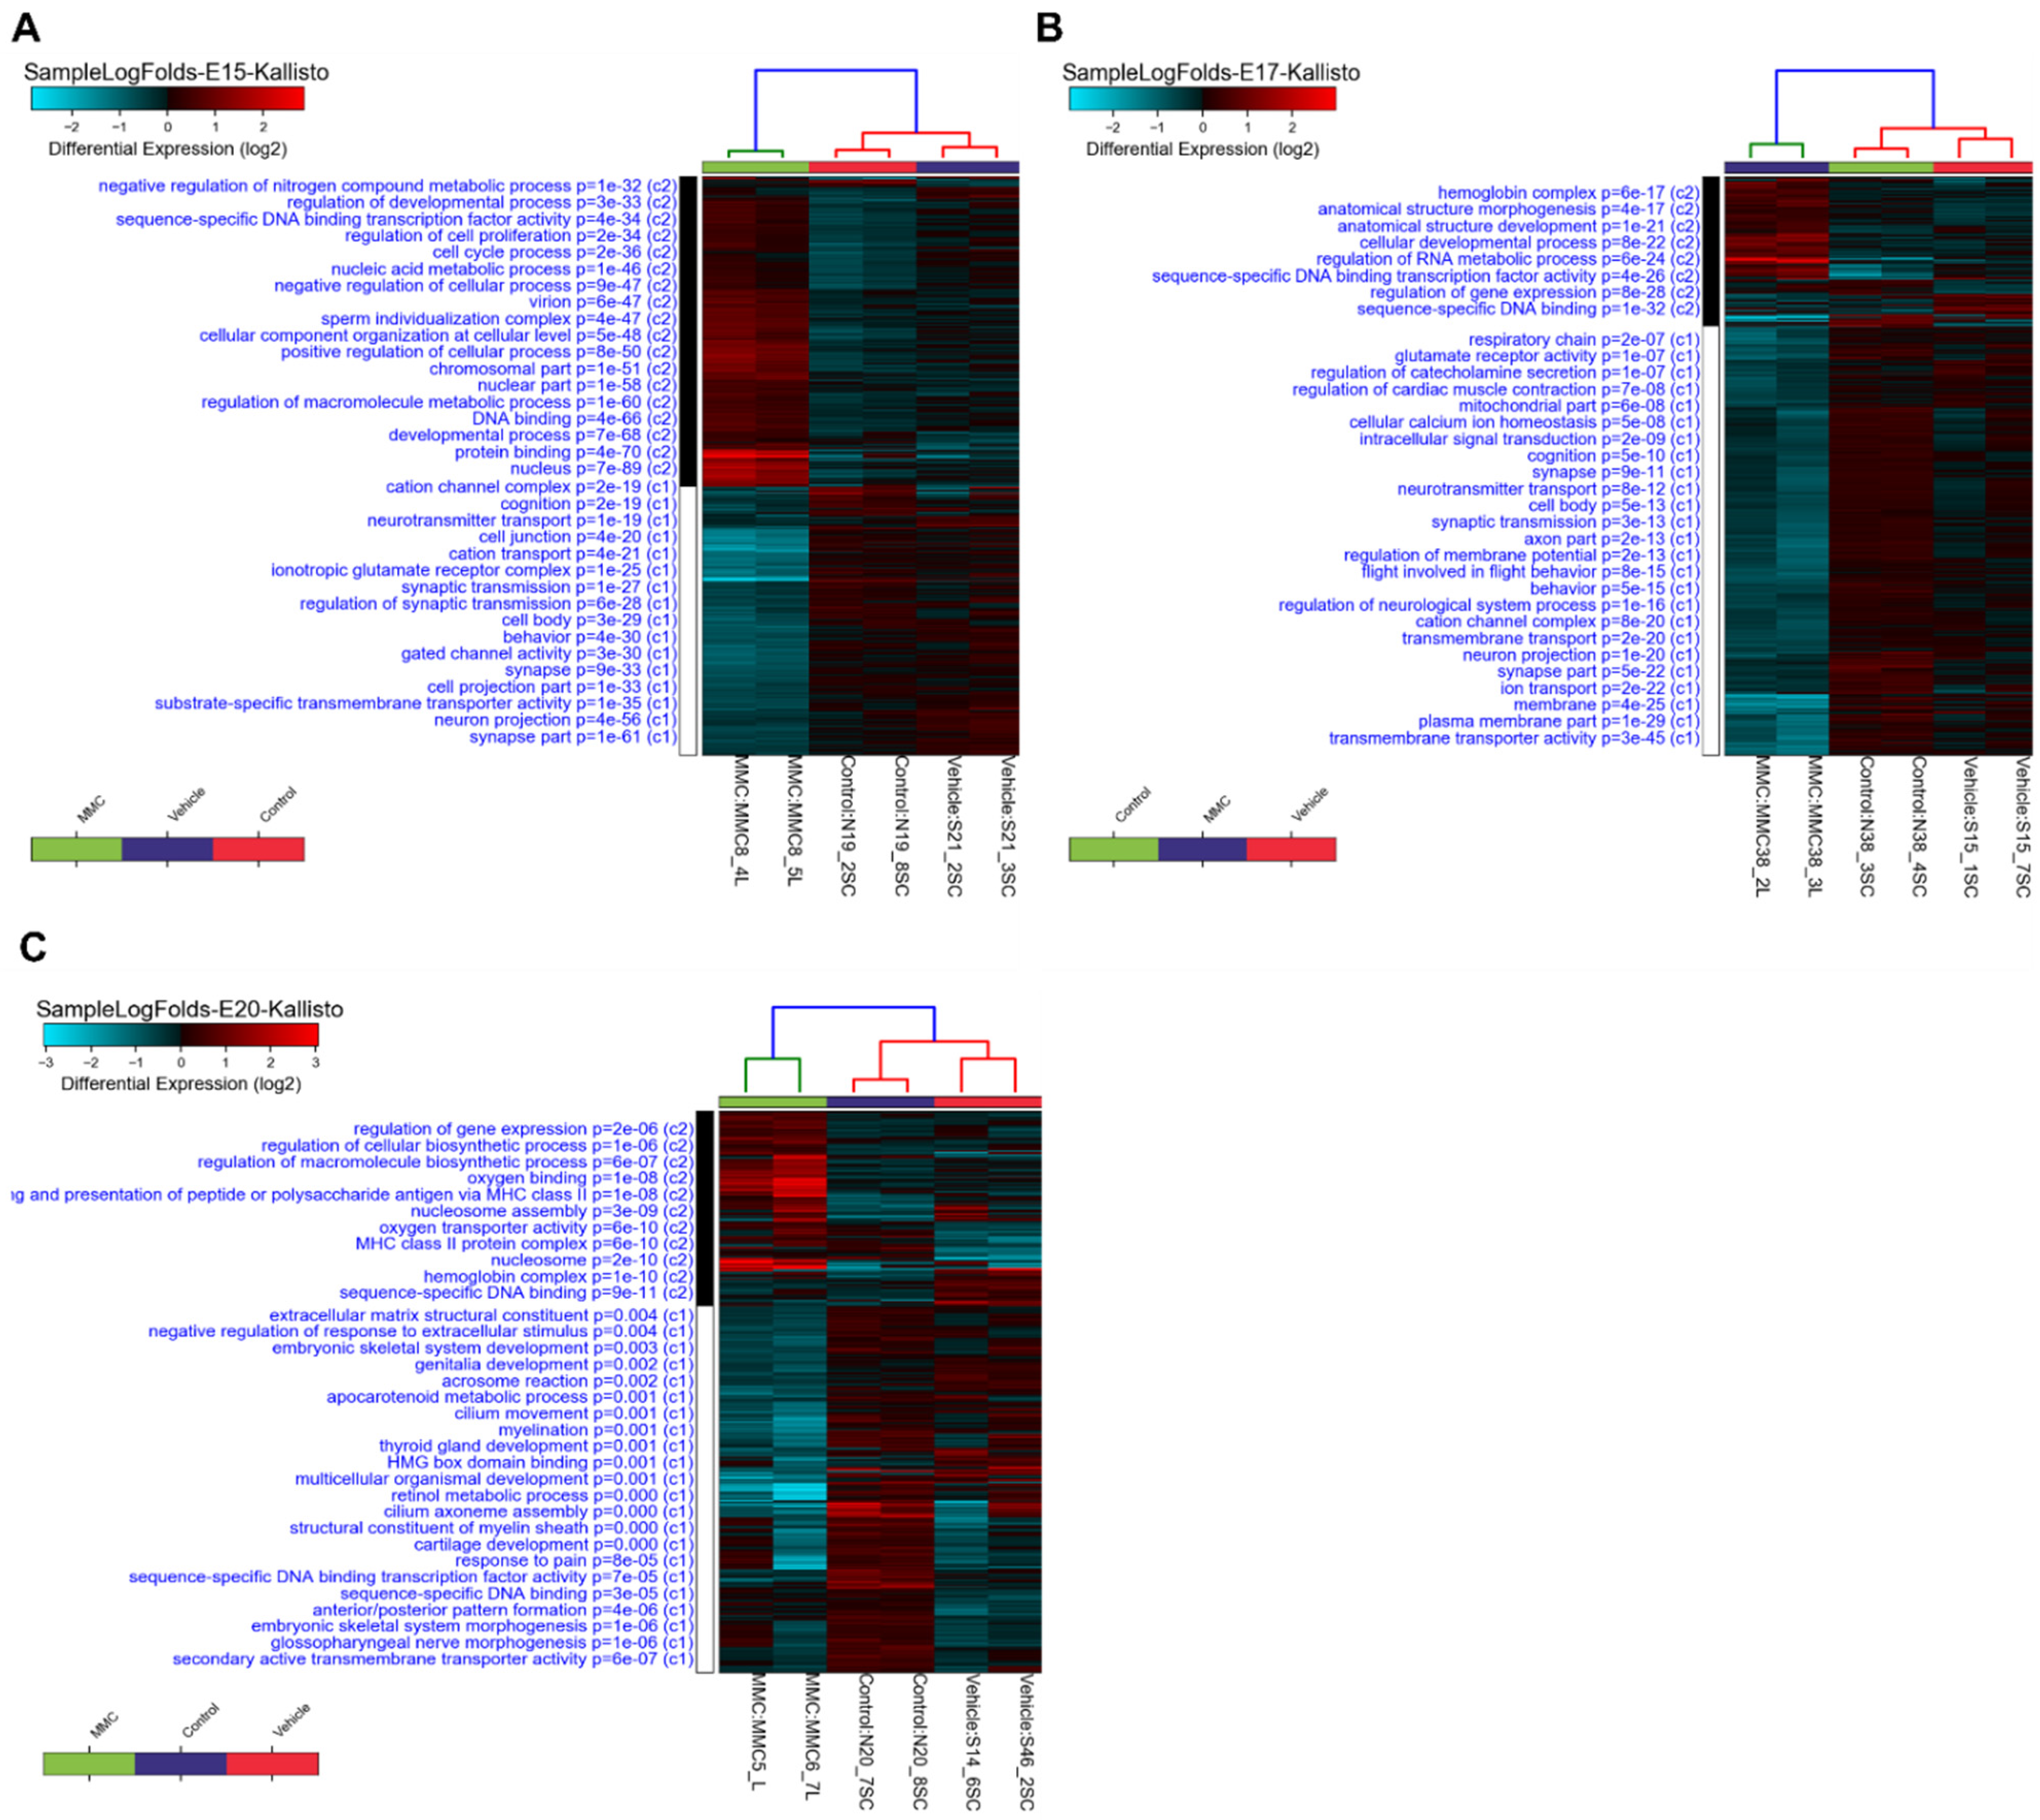
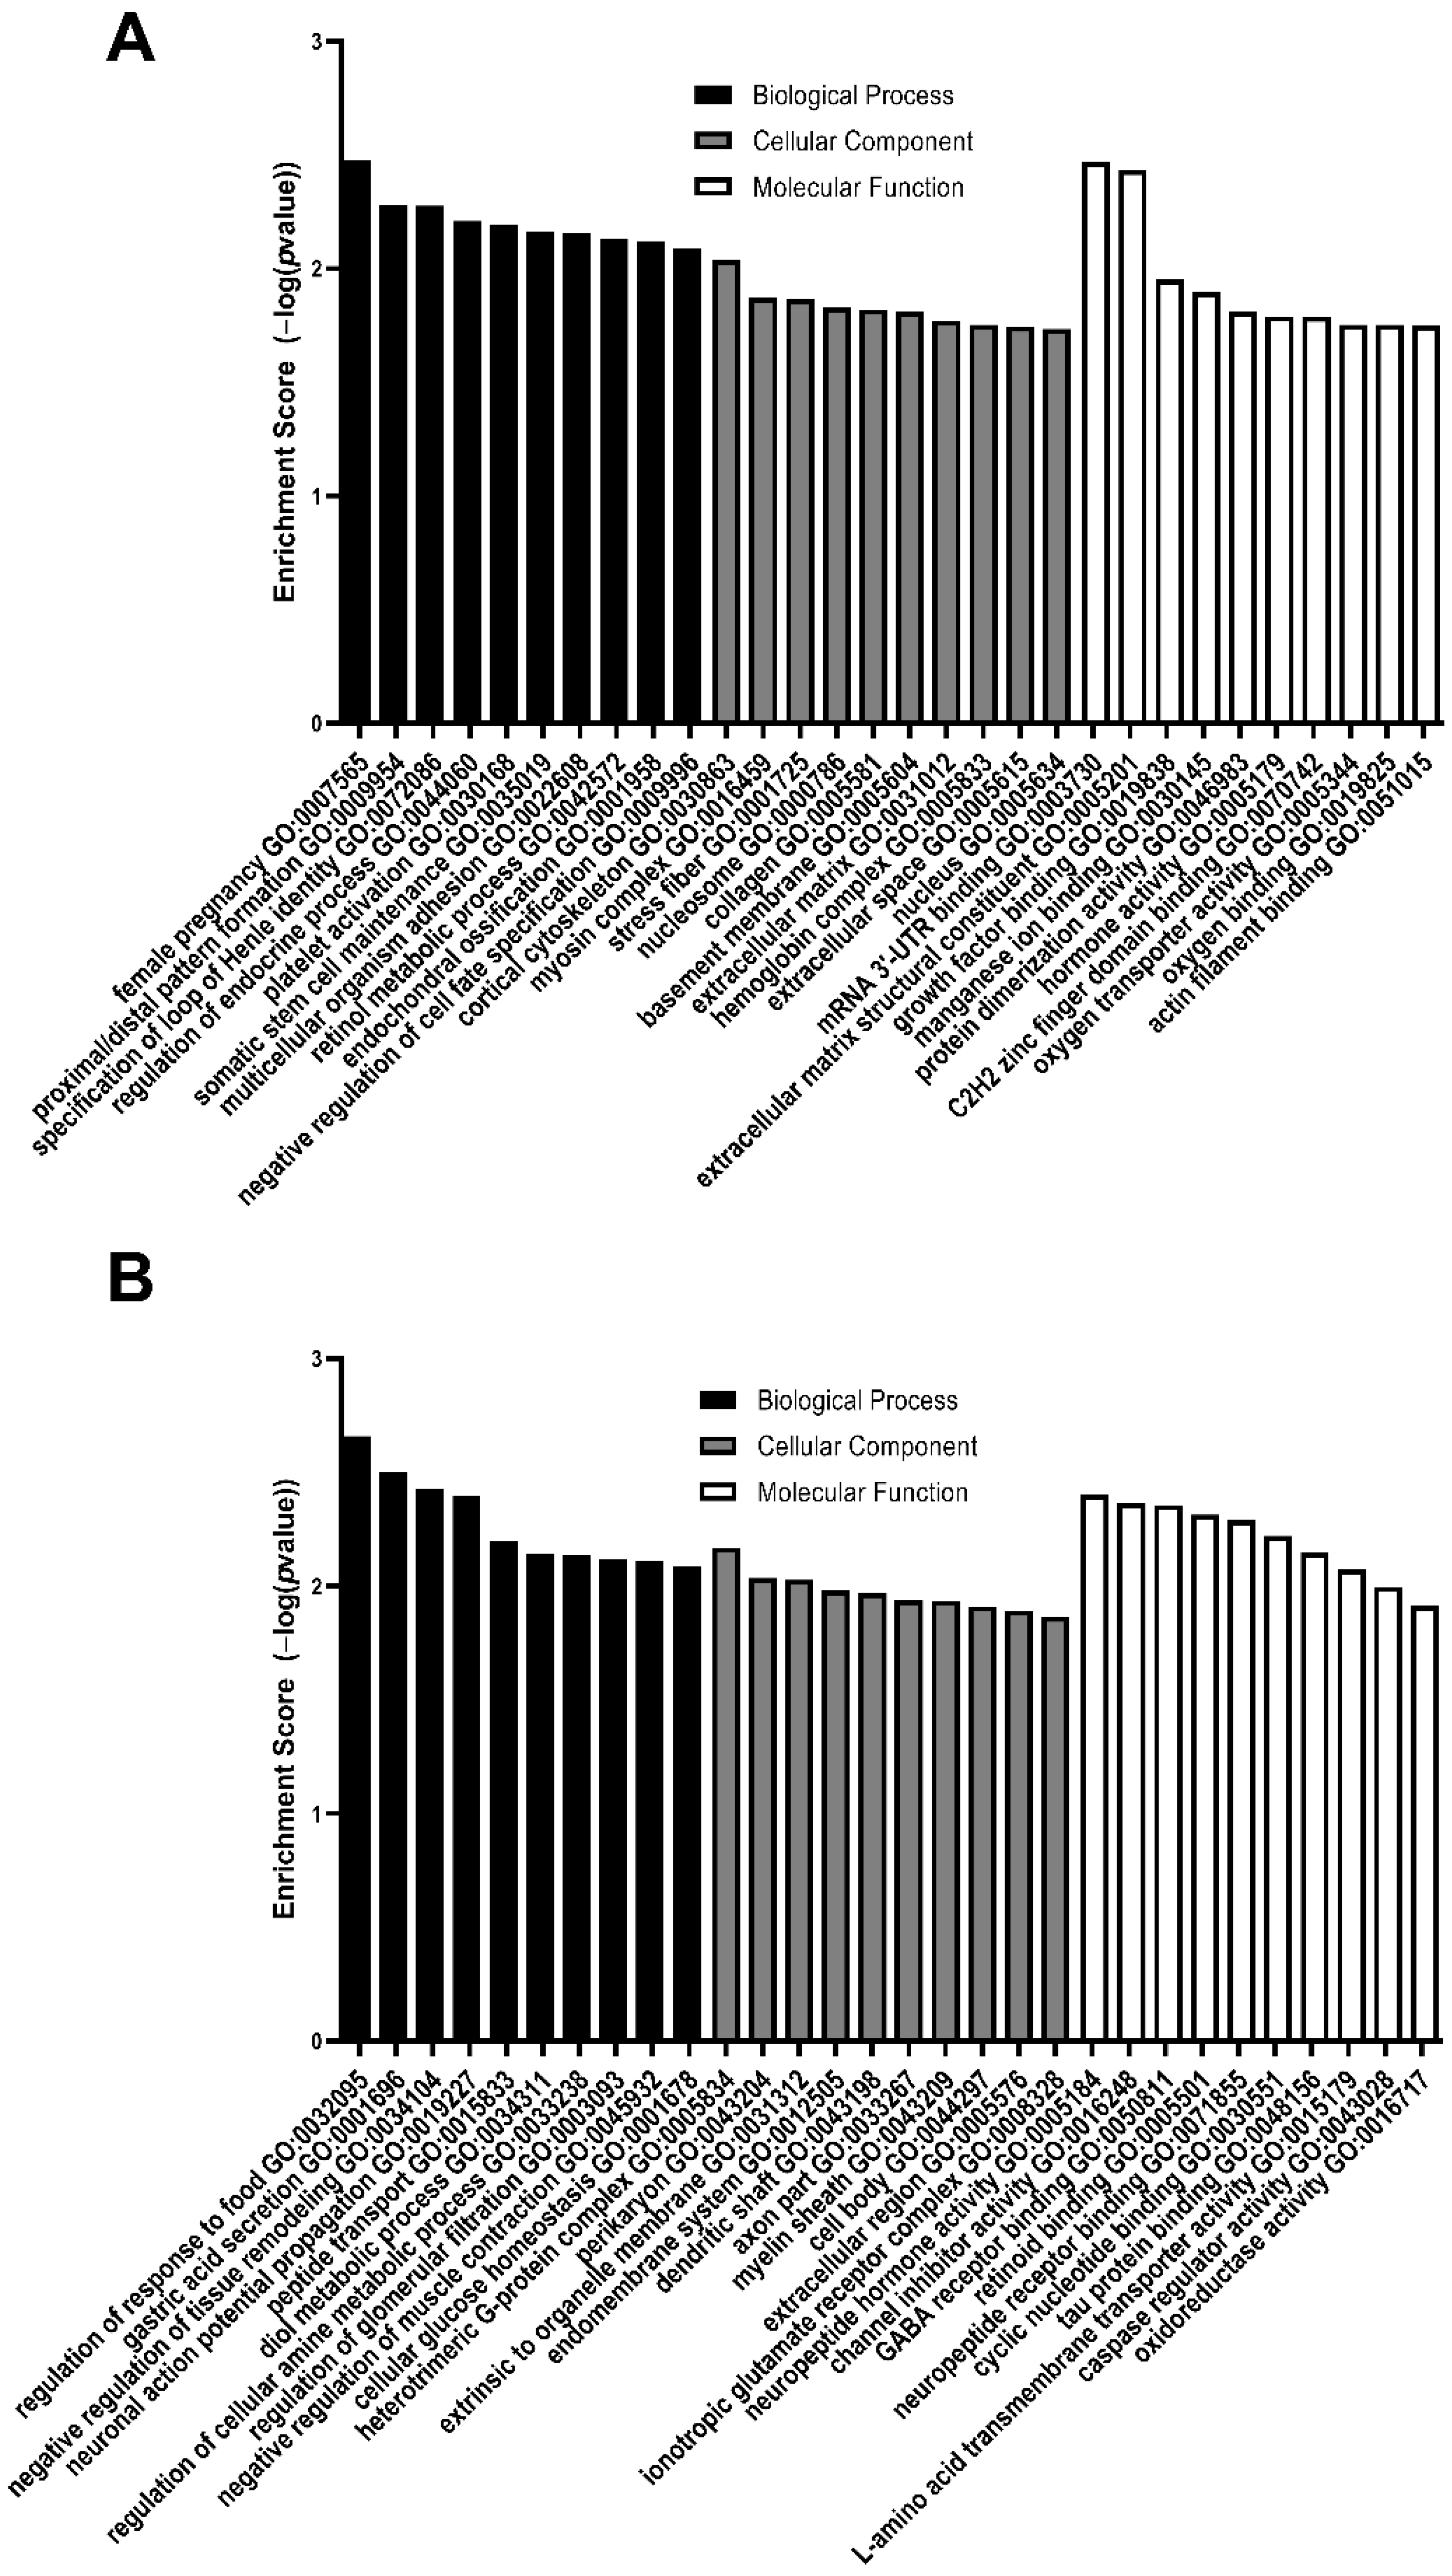
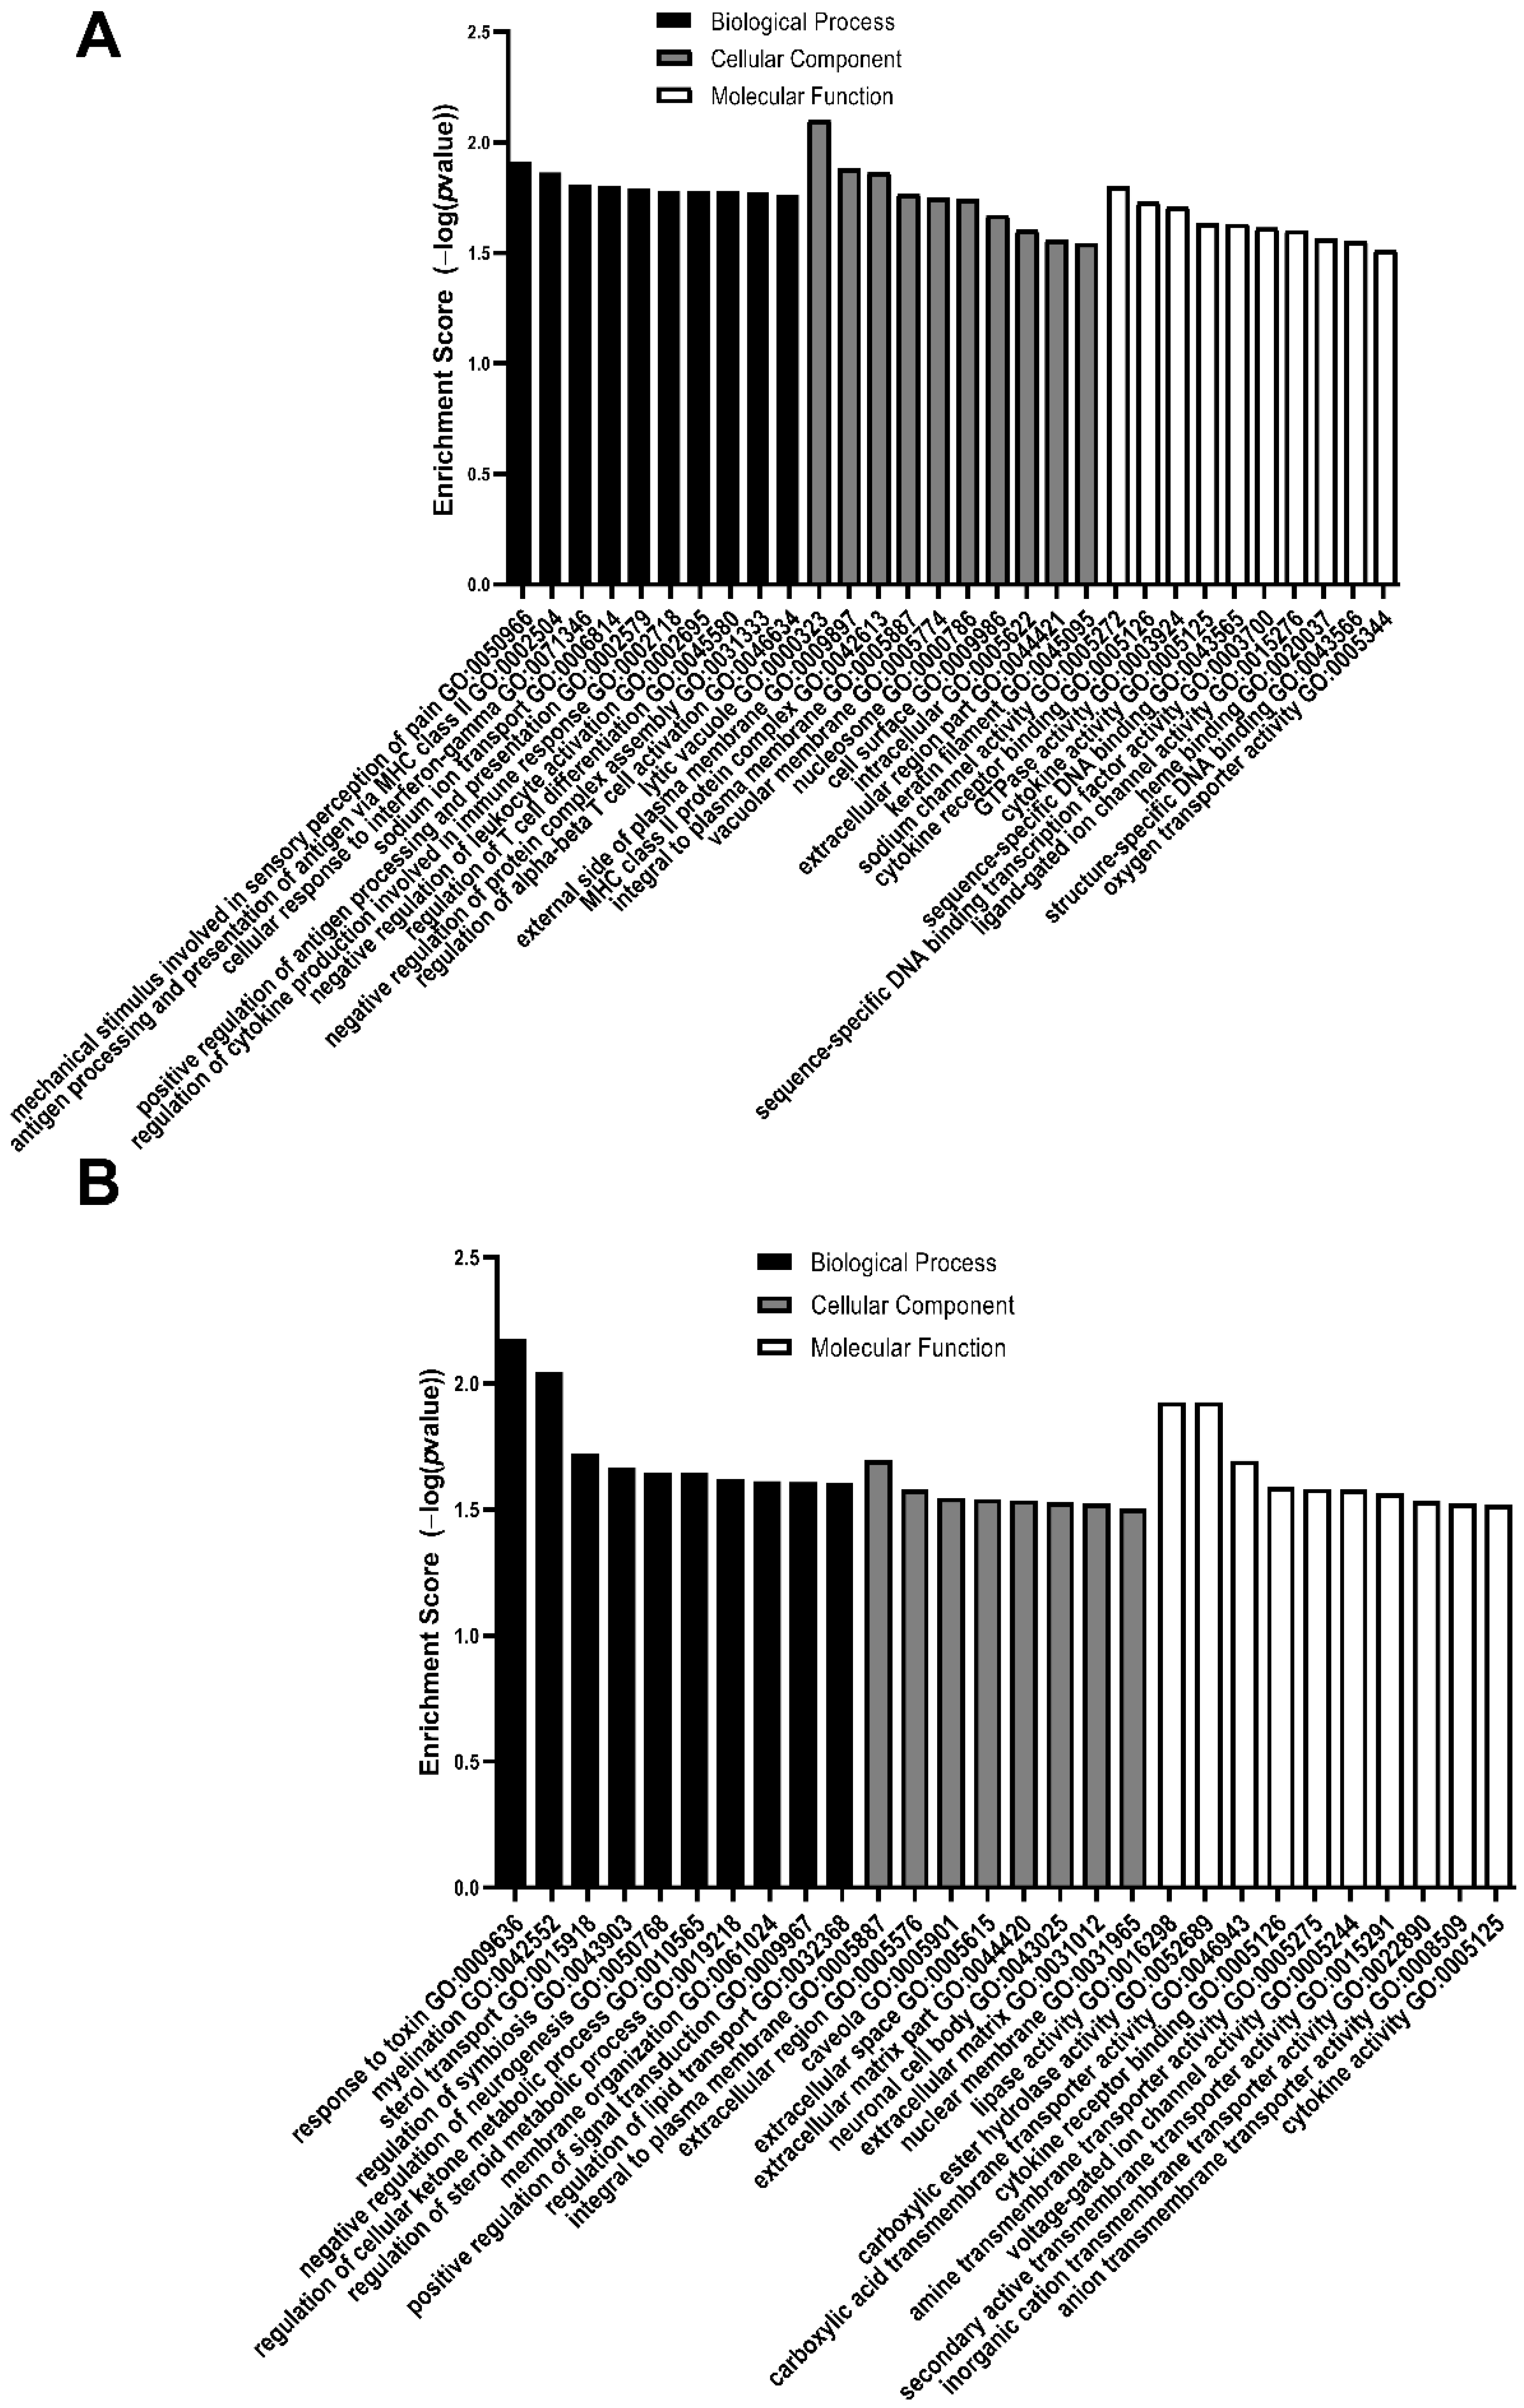
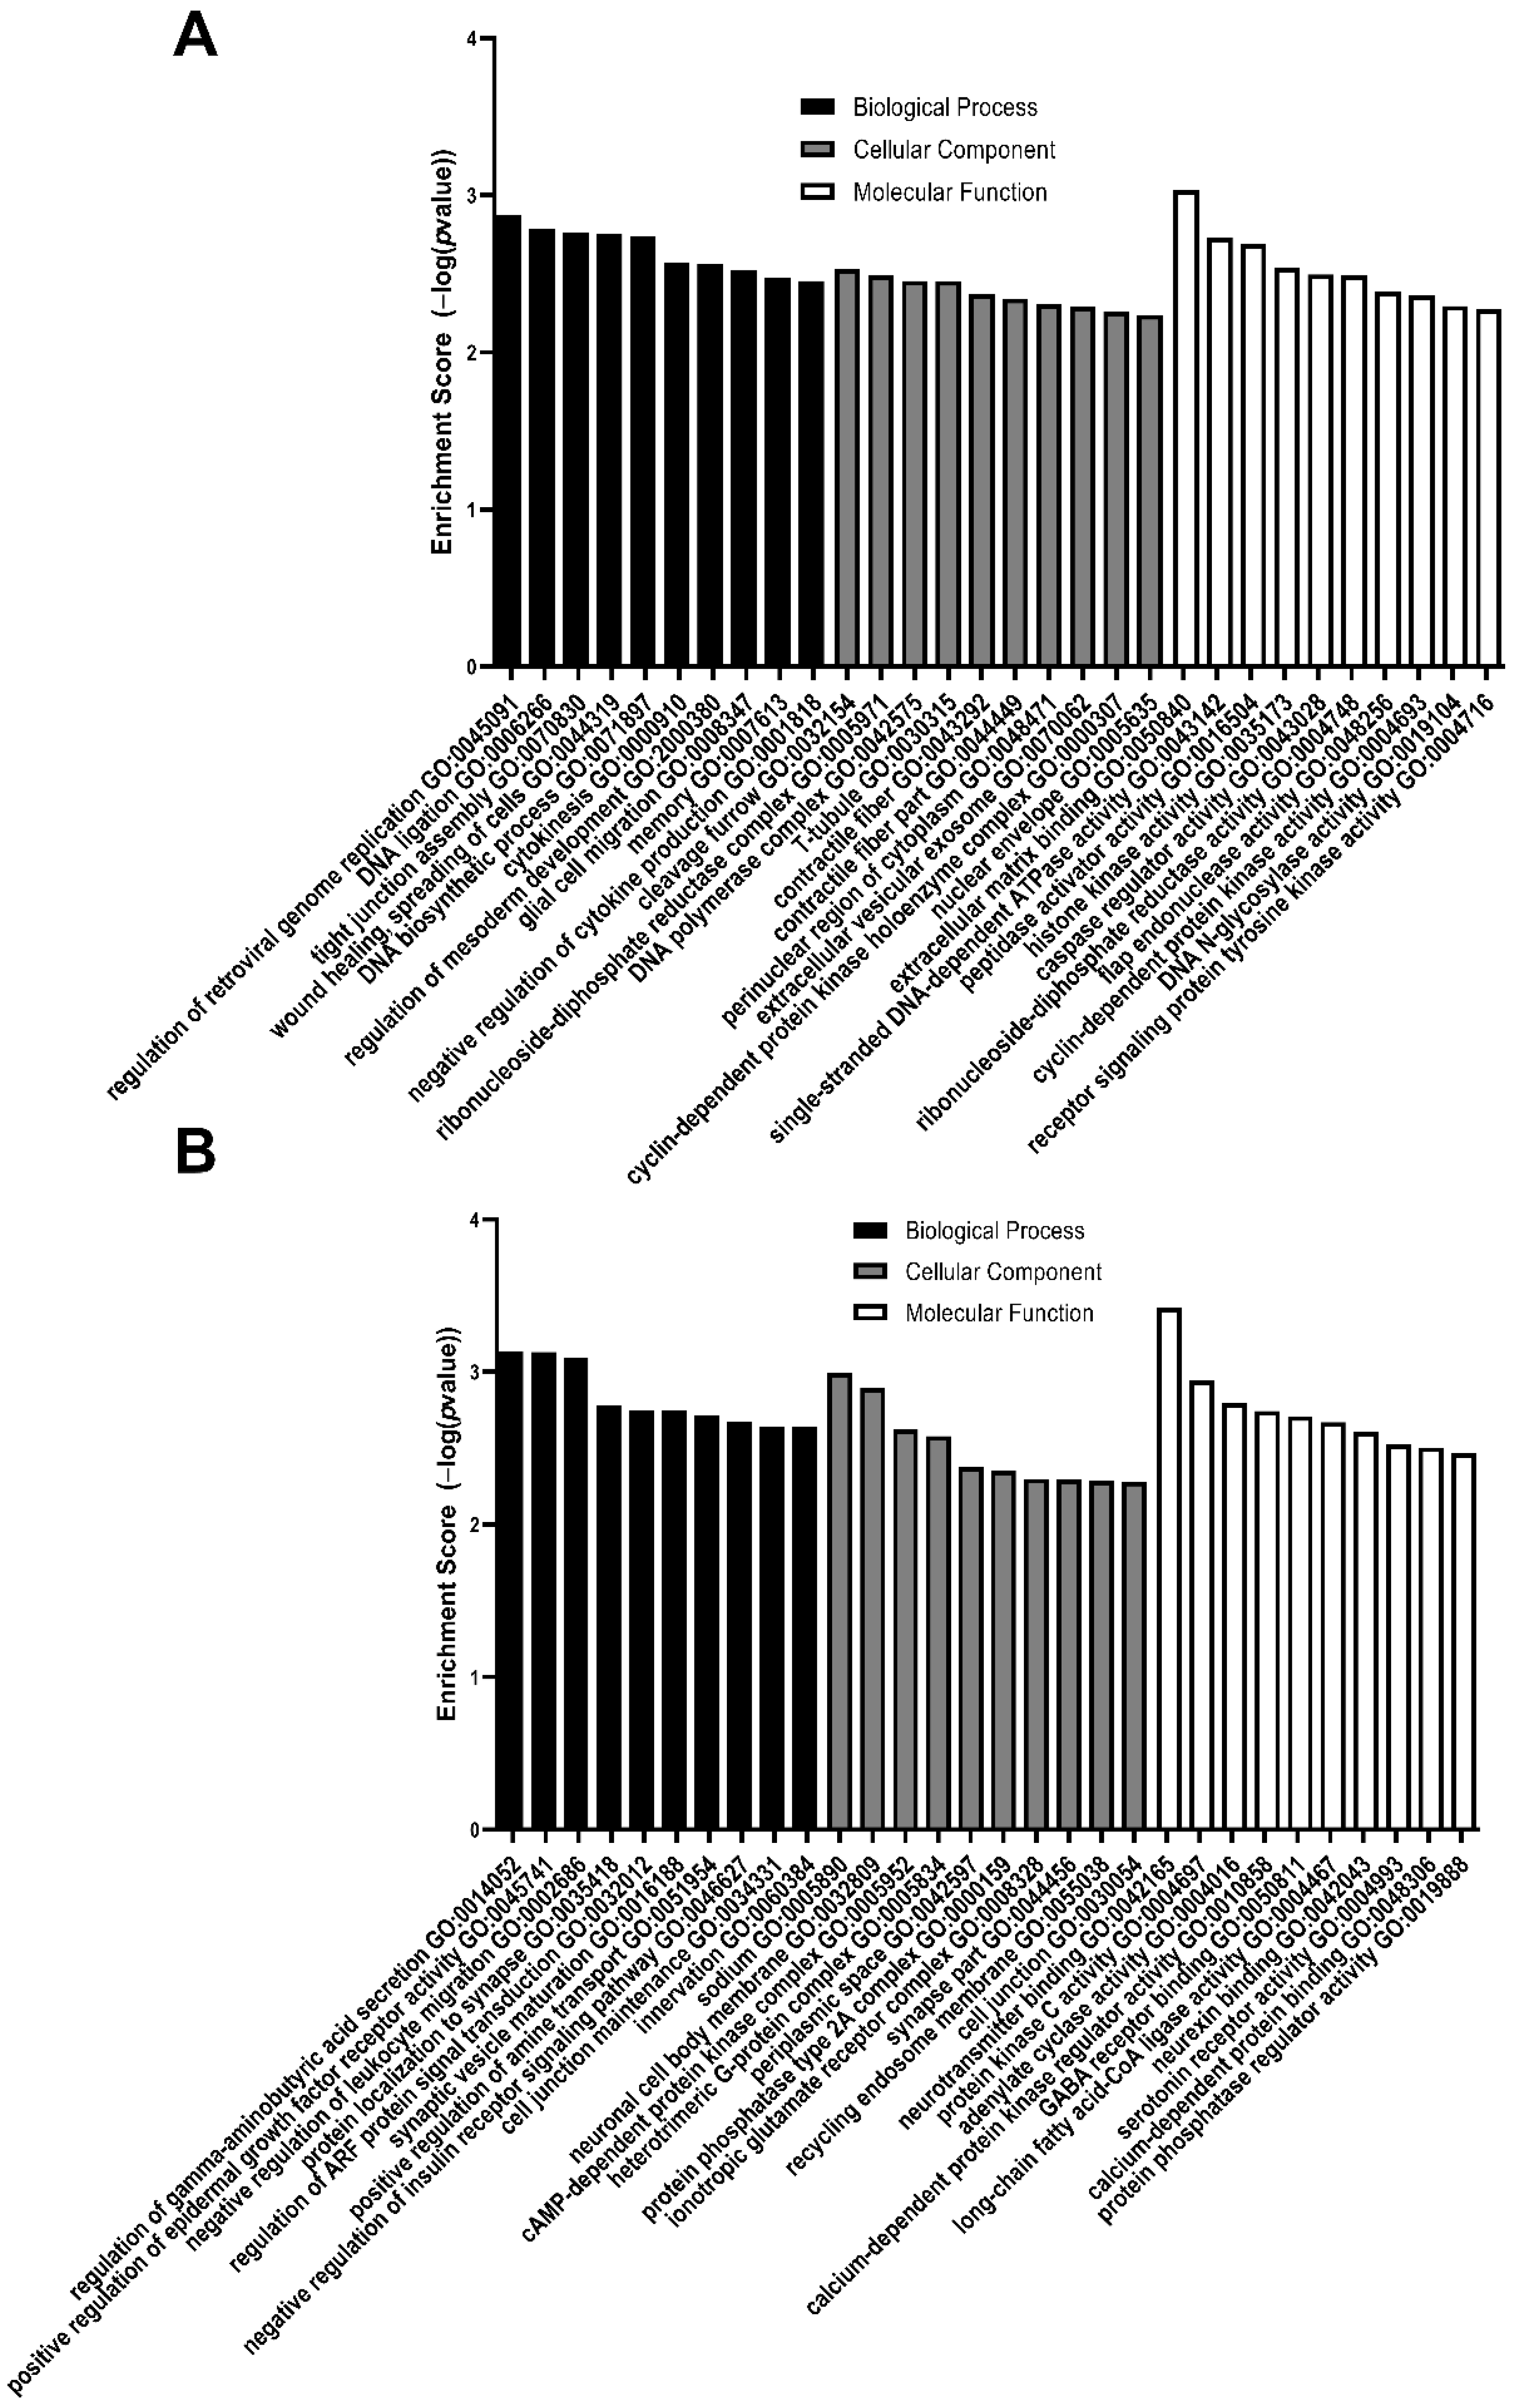
3.2. GO Analysis of Differentially Expressed Genes

The top 10 enriched GO biological processes, cellular components, and molecular functions from upregulated and downregulated DEGs between MMC and vehicle at E15 are listed in Table 6 and Table 7, E17 in Table 8 and Table 9, and E20 in Table 10 and Table 11. Additionally, the enrichment score of each GO listed between MMC and vehicle at E15, E17, and E20 is depicted in Figure 6, Figure 7 and Figure 8, respectively. At E15, upregulated DEGs were enriched in biological processes, such as glial cell migration and regulation of mesoderm development, cellular components, such as contractile fiber and T-tubule, and molecular functions, such as extracellular matrix binding and caspase regulator activity (Table 6, Figure 6A). At E15, downregulated DEGs were enriched in biological processes, such as protein localization to synapse and synaptic vesicle maturation, cellular components, such as cell junction and ionotropic glutamate receptor complex, and molecular functions, such as calcium-dependent protein binding and GABA receptor binding (Table 7, Figure 6B).
At E17, upregulated DEGs were enriched in biological processes, including proximal/distal pattern formation and negative regulation of cell fate specification, cellular components, including myosin complex and collagen, and molecular functions, such as extracellular matrix structural constituent, actin filament binding, and growth factor binding (Table 8, Figure 7A). At E17, downregulated DEGs were enriched in biological processes, such as cellular glucose homeostasis and negative regulation of tissue remodeling, cellular components, such as the ionotropic glutamate receptor complex and myelin sheath, and molecular functions such as GABA receptor binding and neuropeptide receptor binding (Table 9, Figure 7B).
At E20, upregulated DEGs were enriched in biological processes, such as cellular response to interferon-gamma, and regulation of cytokine production cellular components, such as keratin filament, and molecular functions, such as GTPase activity and cytokine receptor binding (Table 10, Figure 8A). At E20, downregulated DEGs were enriched in biological processes, such as regulation of the cellular ketone metabolic process and negative regulation of neurogenesis, cellular components, such as the extracellular matrix and neuronal cell body, and molecular functions, such as anion transmembrane transporter activity and voltage-gated ion channel activity (Table 11, Figure 8B).
The top 10 GO biological processes, cellular components, and molecular function enriched from DEGs that are upregulated or downregulated in MMC spinal cords, compared to the control at E15, E17, and E20, can be found in Figure S1. Several common GOs were identified when comparing MMC to either control group, but not when comparing control and vehicle groups (Figure S2). For example, at E15, both comparisons indicated that the biological process innervation and molecular function neurexin binding were downregulated. Additionally, at E17, both comparisons indicated a downregulation in neuronal action potential propagation and upregulation in the extracellular matrix. Finally, at E20, antigen processing and presentation of peptide or polysaccharide antigen via MHC class II and MHC class II protein complex were upregulated and myelination was downregulated.

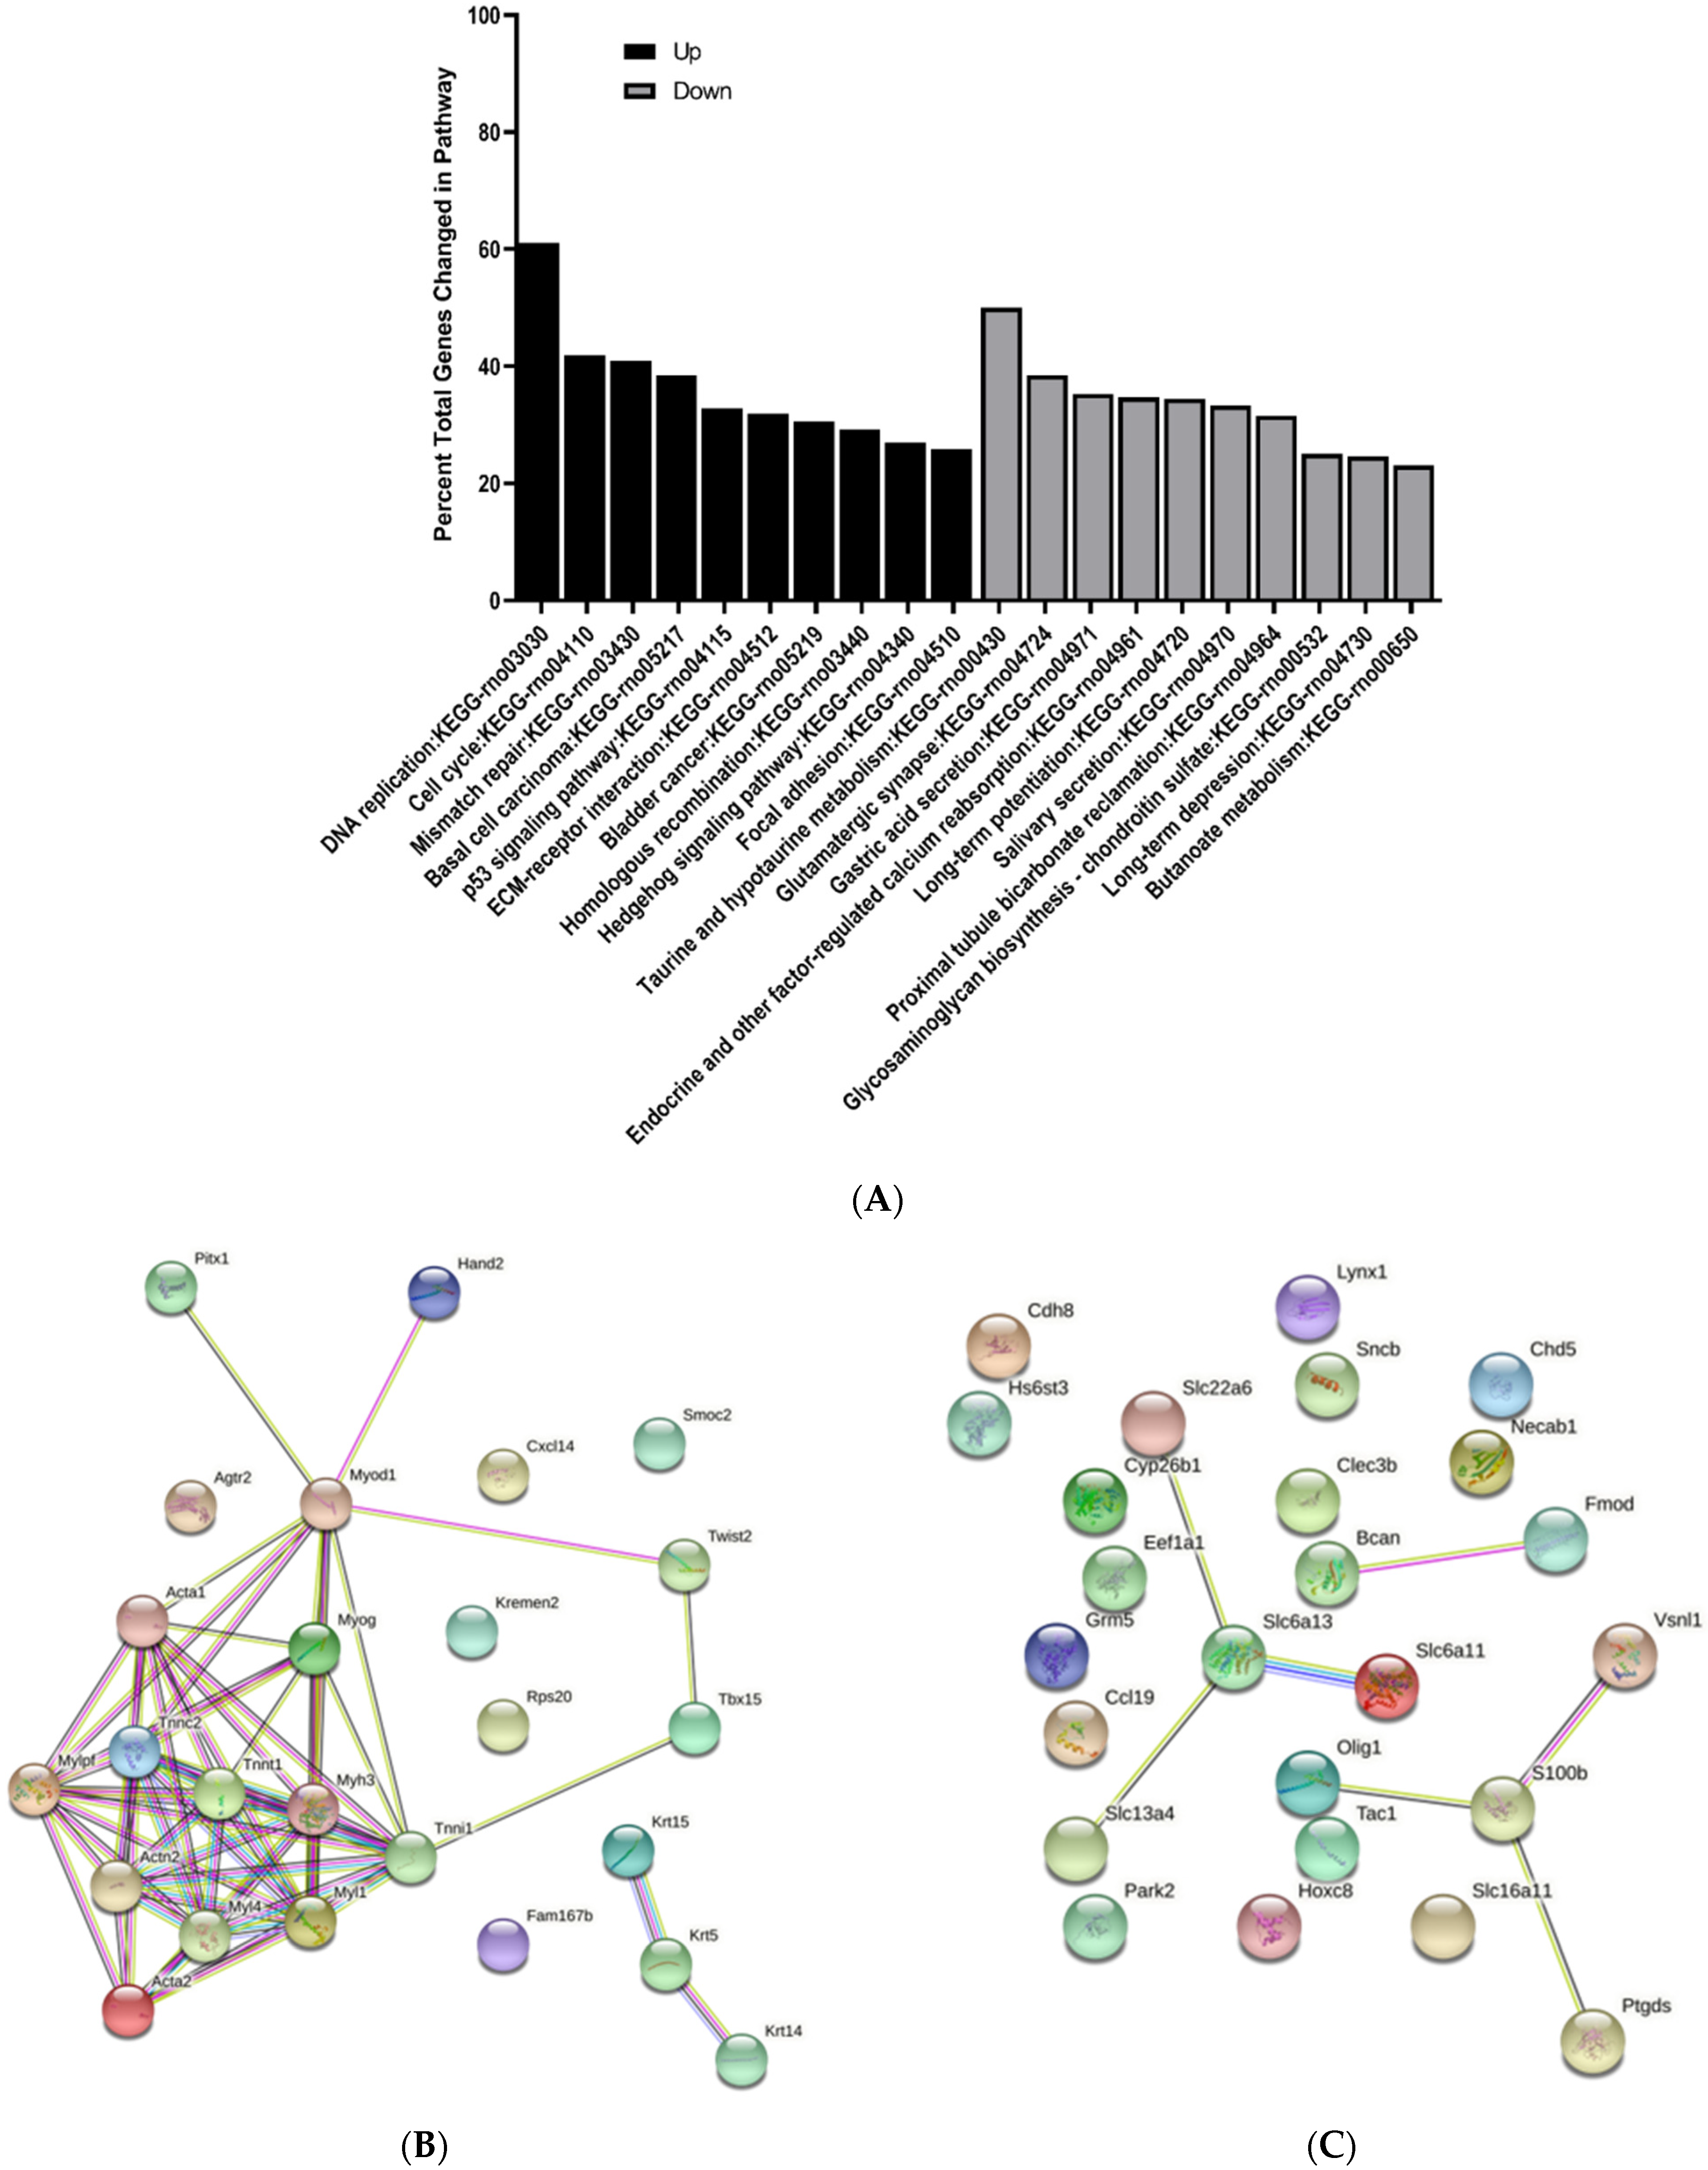
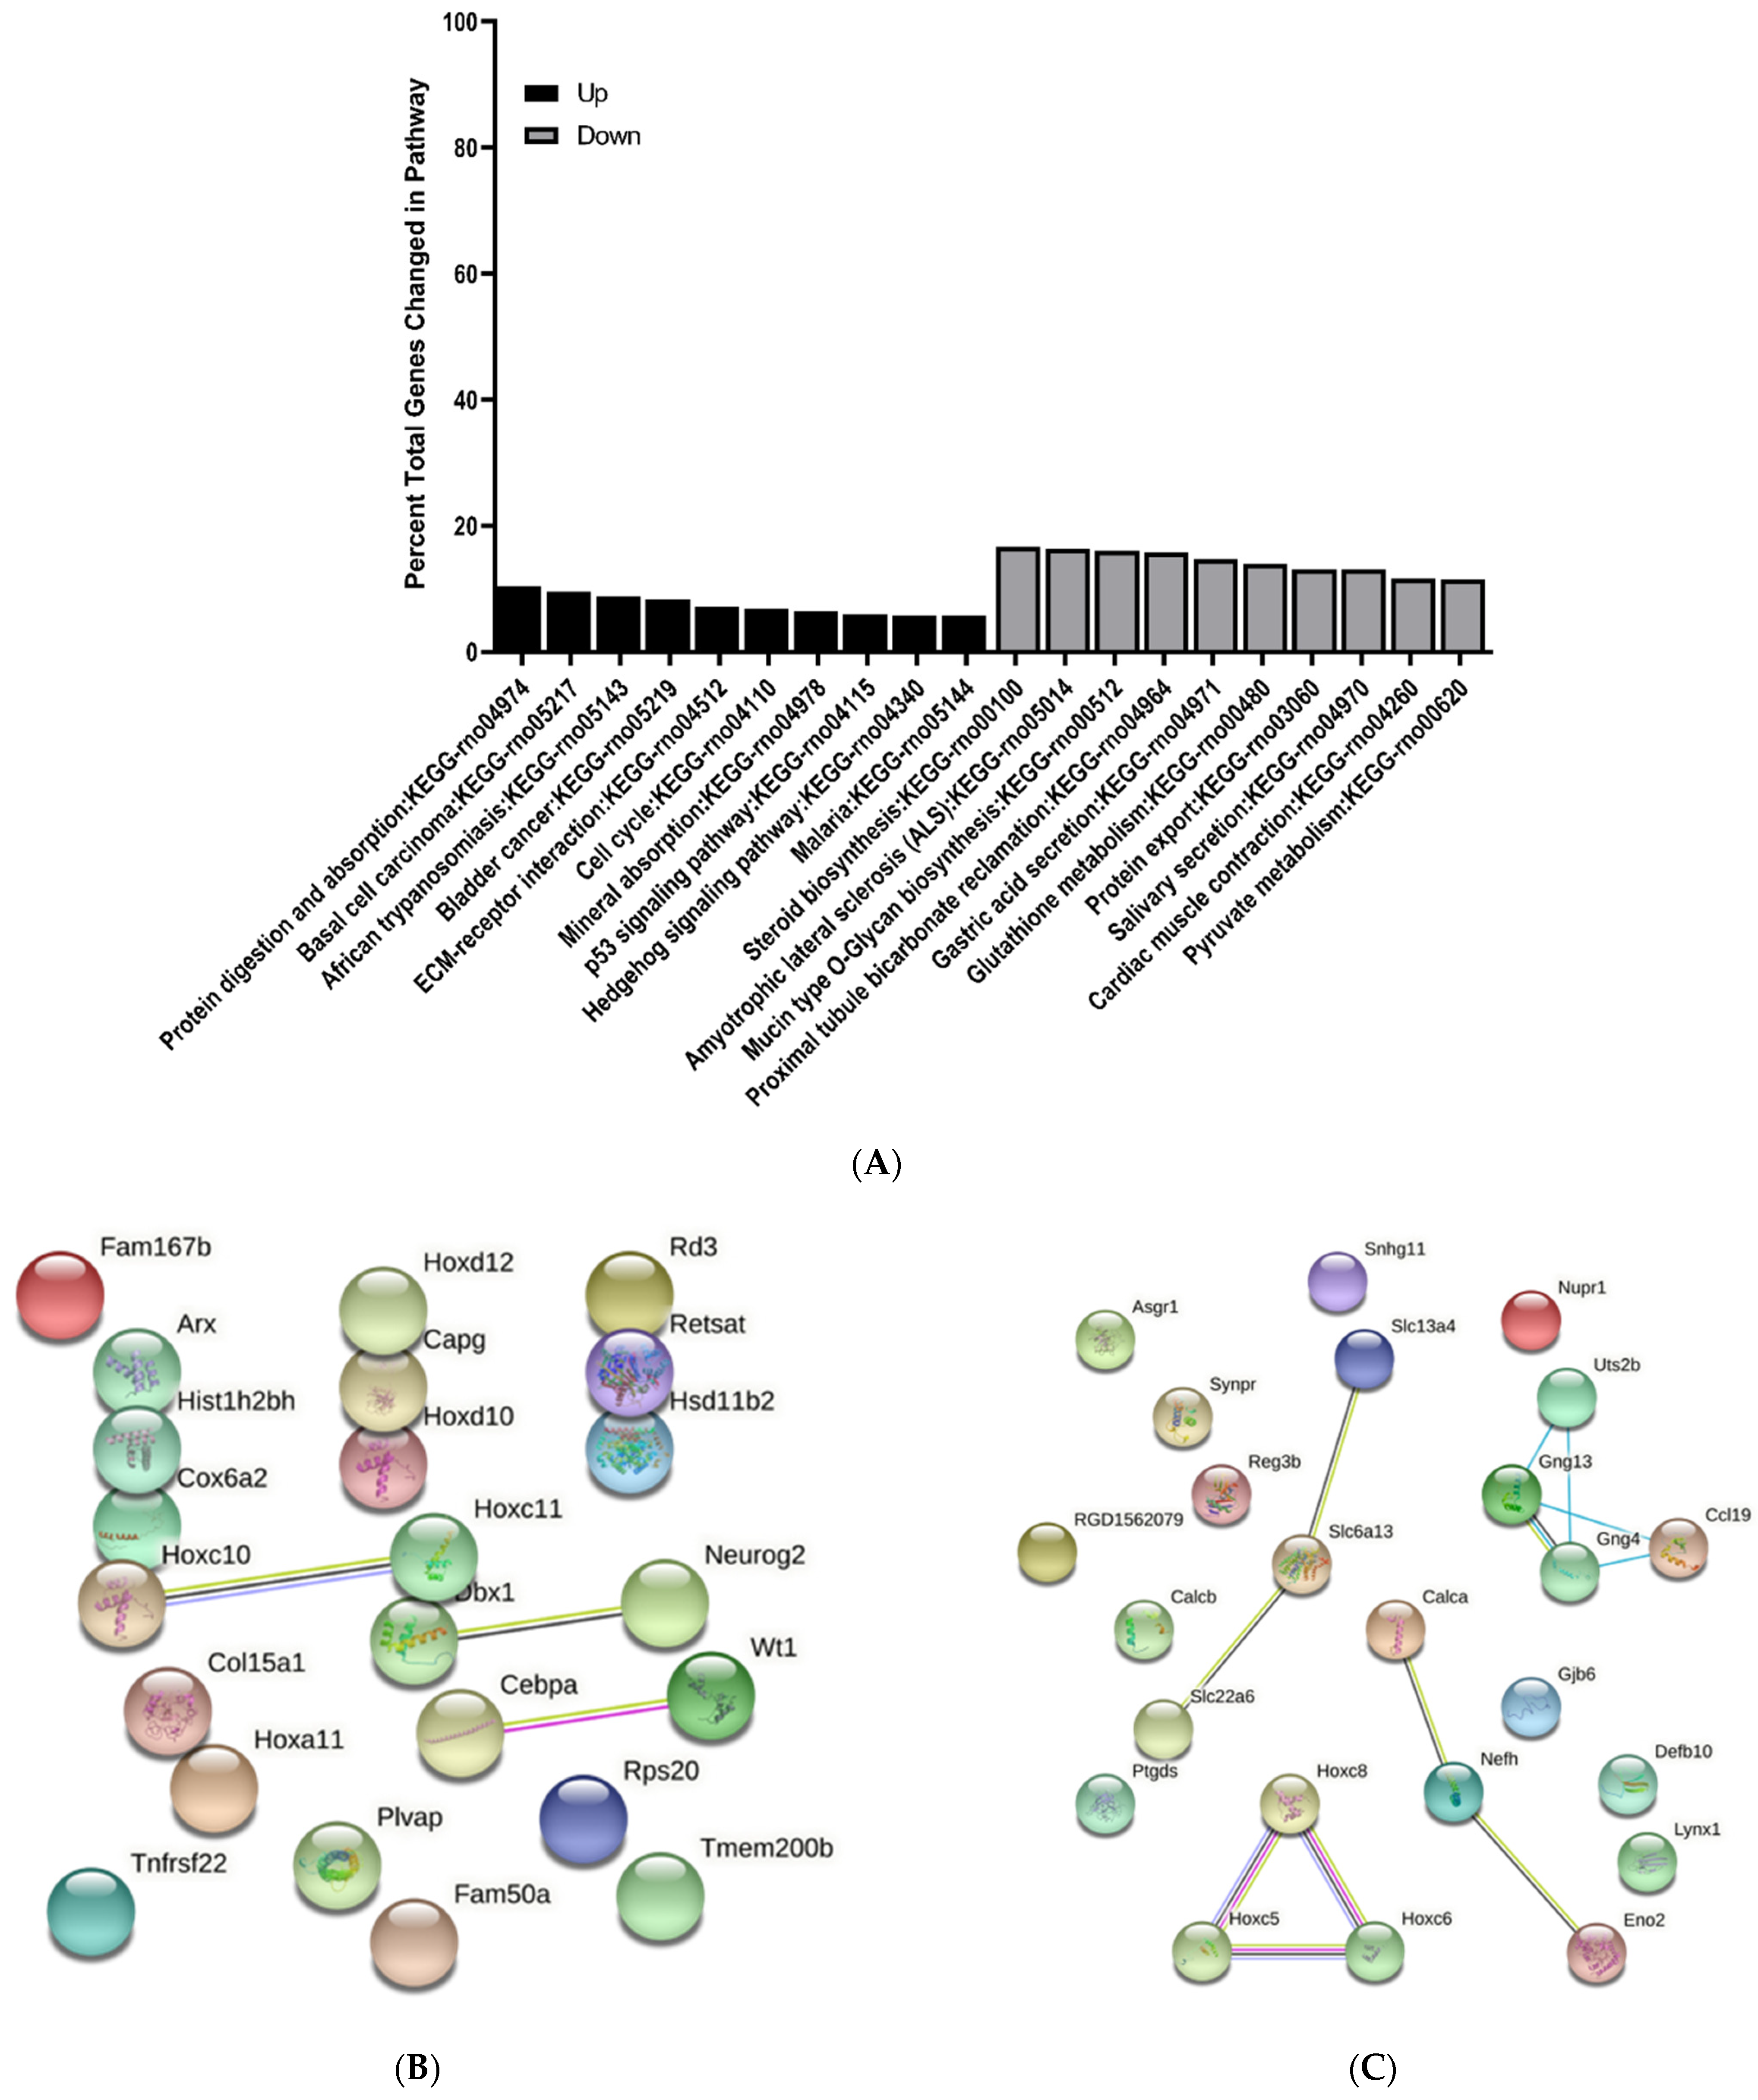
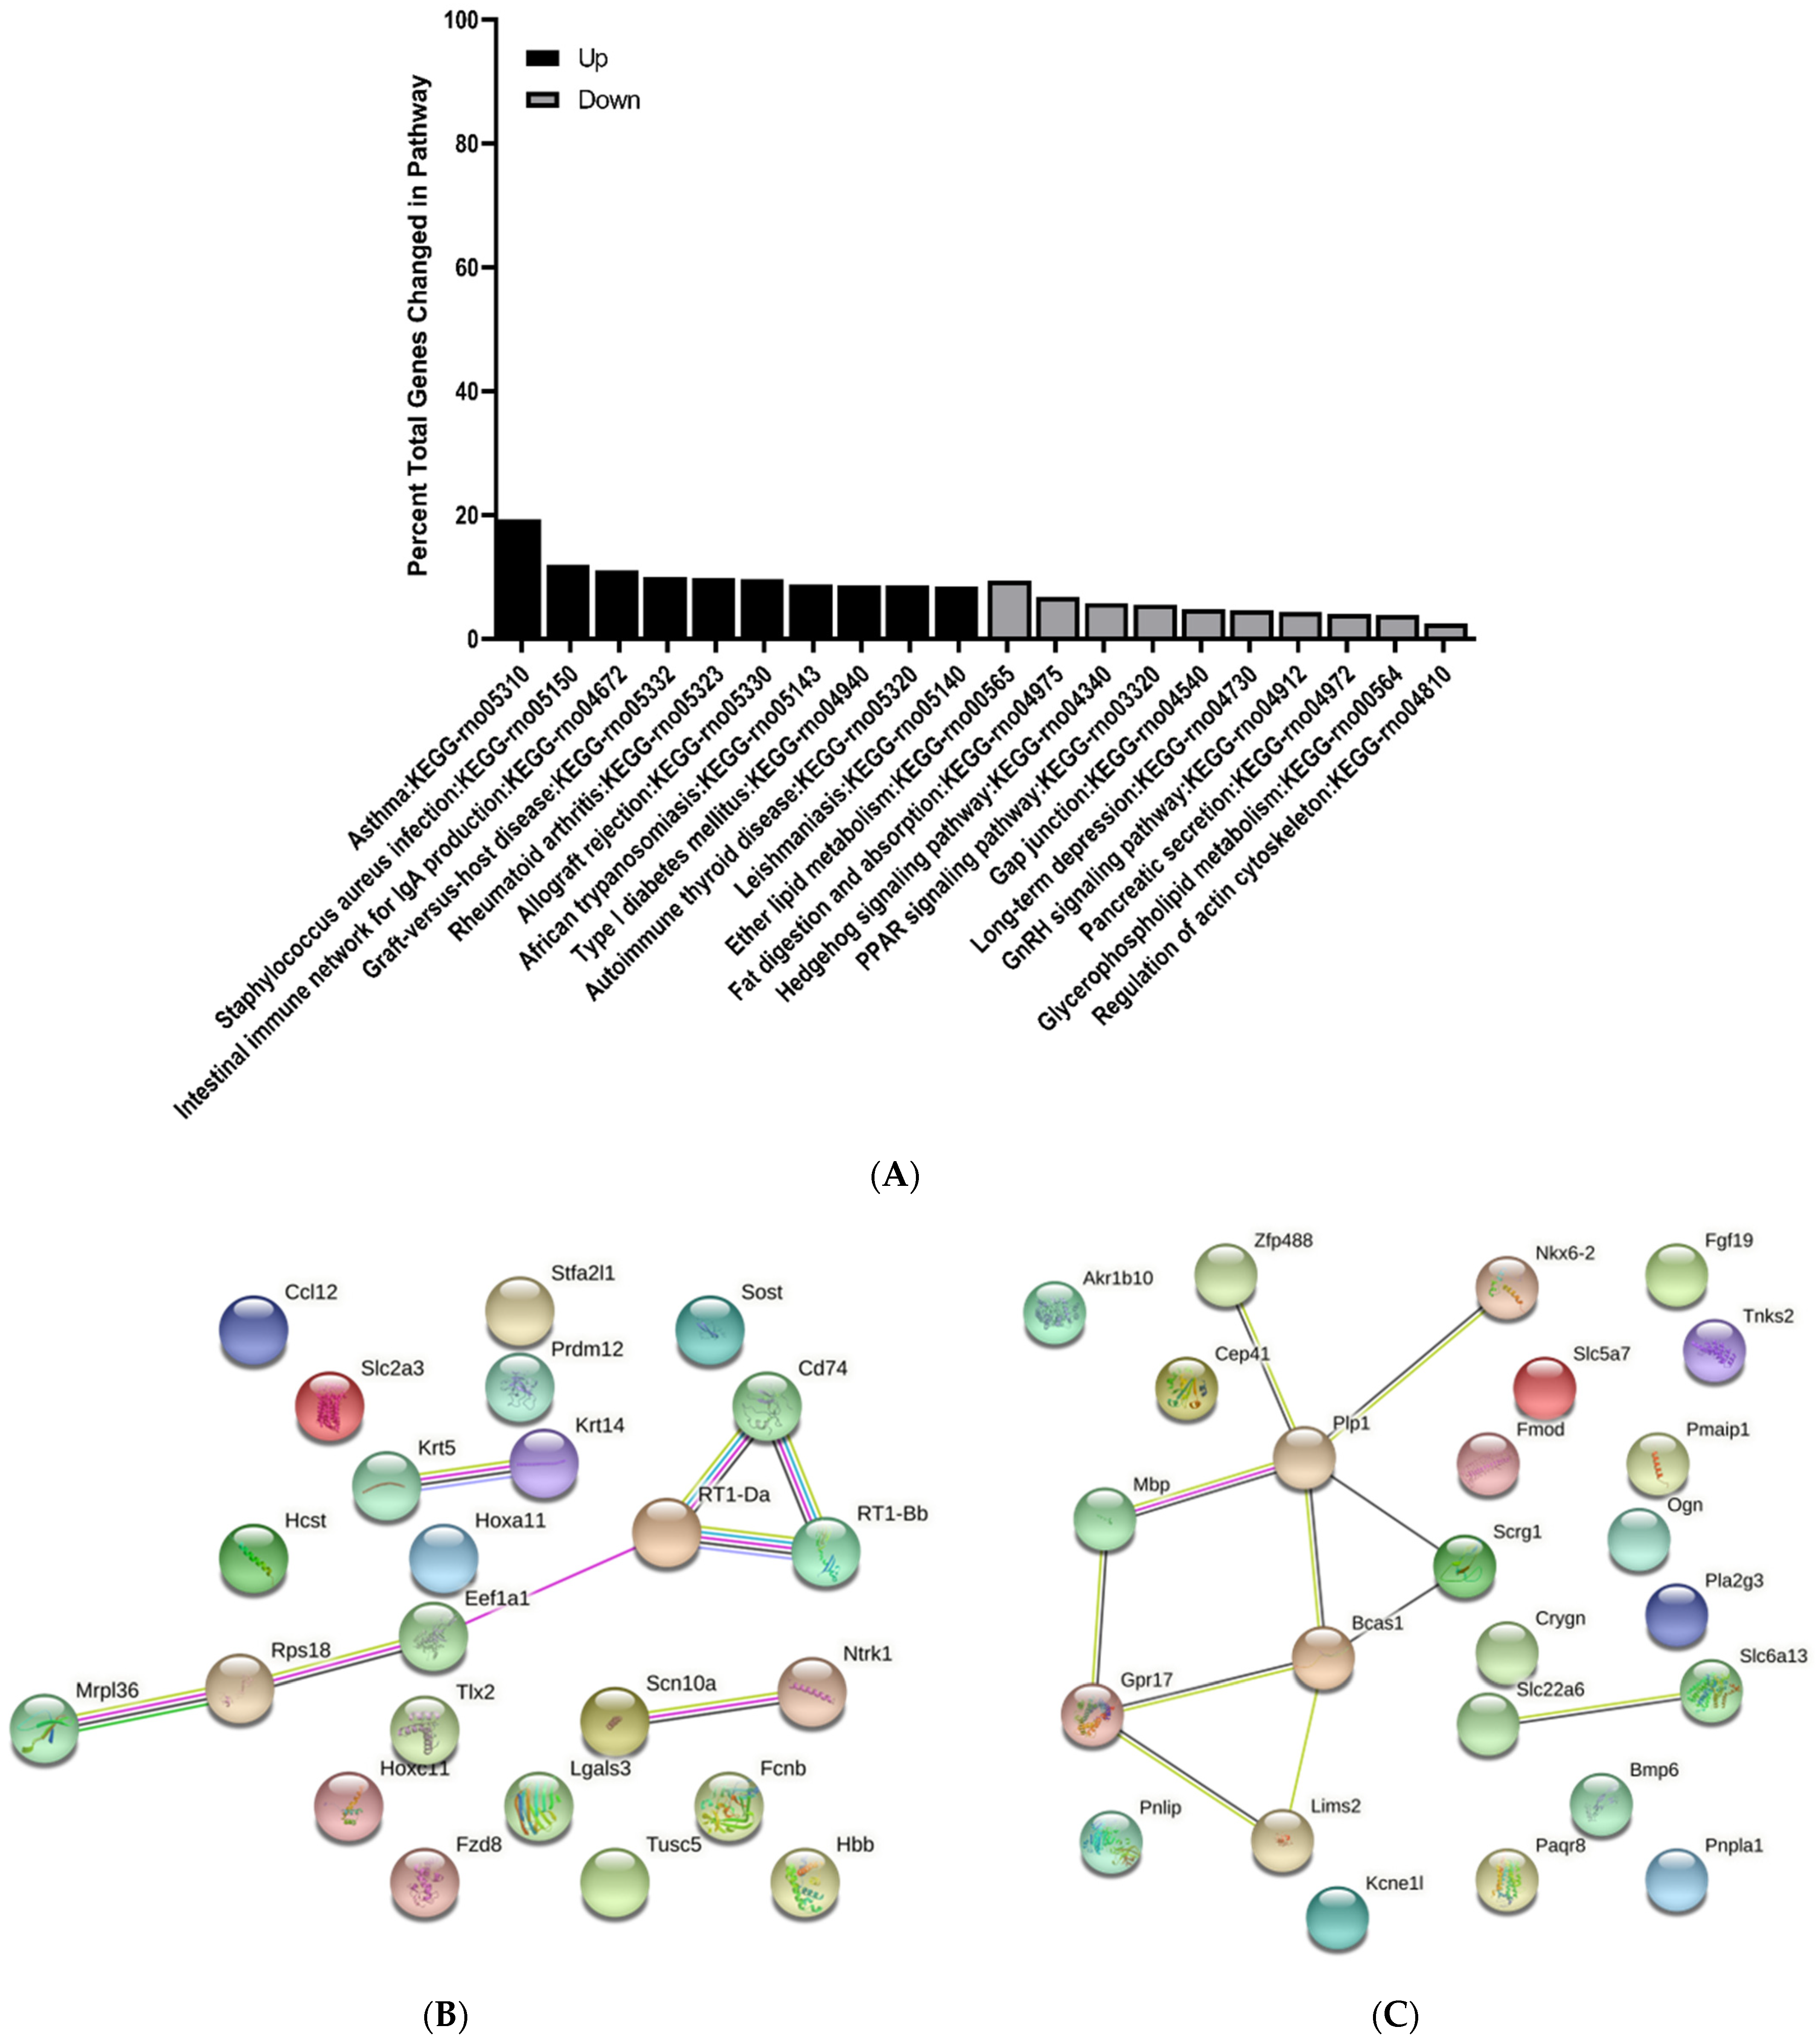
3.3. KEGG Pathway Enrichment Analysis of Differentially Expressed Genes

The top 10 upregulated and downregulated KEGG pathways were determined and reported as percent total changed genes in each pathway. All pathways identified were greater than 1.5-fold change and p < 0.05. Interestingly, there were several common pathways changed at E15 and E17 when comparing MMC and vehicle groups (Figure 9A and Figure 10A). For example, at both time points, p53 signaling and hedgehog signaling were upregulated; however, fewer genes were changed in these pathways at E17 (Figure 10A). Additionally, at E17, metabolic pathways including glutathione and pyruvate metabolism were also downregulated and ECM receptor interaction was upregulated (Figure 10A). At E20, immunological pathways, such as staphylococcus aureus infection, were upregulated, while metabolic pathways including PPAR signaling, ether lipid metabolism and glycerophospholipid metabolism, were downregulated (Figure 11A). Additionally, at this time point, gap junction, and regulation of actin cytoskeleton were also downregulated (Figure 11A).
The top 10 upregulated and downregulated KEGG pathways identified between the MMC and control groups and control and vehicle groups are found in Figures S3 and S4, respectively. Several common pathways were identified at each time point between MMC and either of the control groups. For example, the cell cycle and ECM receptor interactions were upregulated in both comparisons at E15 and E17. Furthermore, both comparisons demonstrated upregulation in autoimmune diseases, such as rheumatoid arthritis, type 1 diabetes mellitus, and autoimmune thyroid disease.

3.4. Protein–Protein Interaction Network Analysis of Differentially Expressed Genes

To investigate the interactions between DEGS, protein–protein interactions (PPI) were determined for each time point by submitting the top 25 up and downregulated DEGs between vehicle and MMC groups to the string. At E15, we identified a cluster of interactions between upregulated DEGs involved in structure and skeletal muscle development including Acta1, Actn2, and Myog (Figure 9B). Additionally, interactions between various downregulated transporters, such as Slc22a6 and Slc6a13, were determined as well as proteins involved in CNS cell fate determination, including Olig1 and S100b (Figure 9C); however, these interactions were also identified when comparing MMC groups to the control group (Figure S5). Furthermore, interactions between the same downregulated transporters were also identified at E17 in addition to proteins involved in neuronal cell identity, such as those in the Hox family, and neuron and axon maturation, including Calca and Nefh (Figure 10C). Interestingly, similar interactions were also identified when comparing MMC and control groups (Figure S6). Specific to the comparison between MMC and vehicle groups were the interactions between upregulated Dbx1 and neurog, both involved in neurogenesis, as well as Cebpa and Wt1, which are involved in the differentiation and survival of non-CNS cell types, including adipocytes and granulocytes (Figure 10B). Furthermore, interactions between downregulated Uts2b, Gng13, CCL19, and Gng4 were demonstrated (Figure 10C). At E20, PPI analysis indicated interactions between a host of downregulated DEGs involved myelination and oligodendrogenesis (Figure 11C). Similar to interactions observed at E17, the majority of these interactions were also found when comparing MMC and control groups (Figure S7); however, specific to the comparison of MMC and vehicle were the interactions between GPR17 and Bcas1 with Lims2 (Figure 11C). Interactions involving upregulated DEGs associated with MHC class II immune reactions, CD74 and RT1-Da were identified at E20 when comparing MMC and the control group (Figure S8B), with the addition of RT1-Bb and Eef1a1 in the comparison between MMC and vehicle groups (Figure 11B).

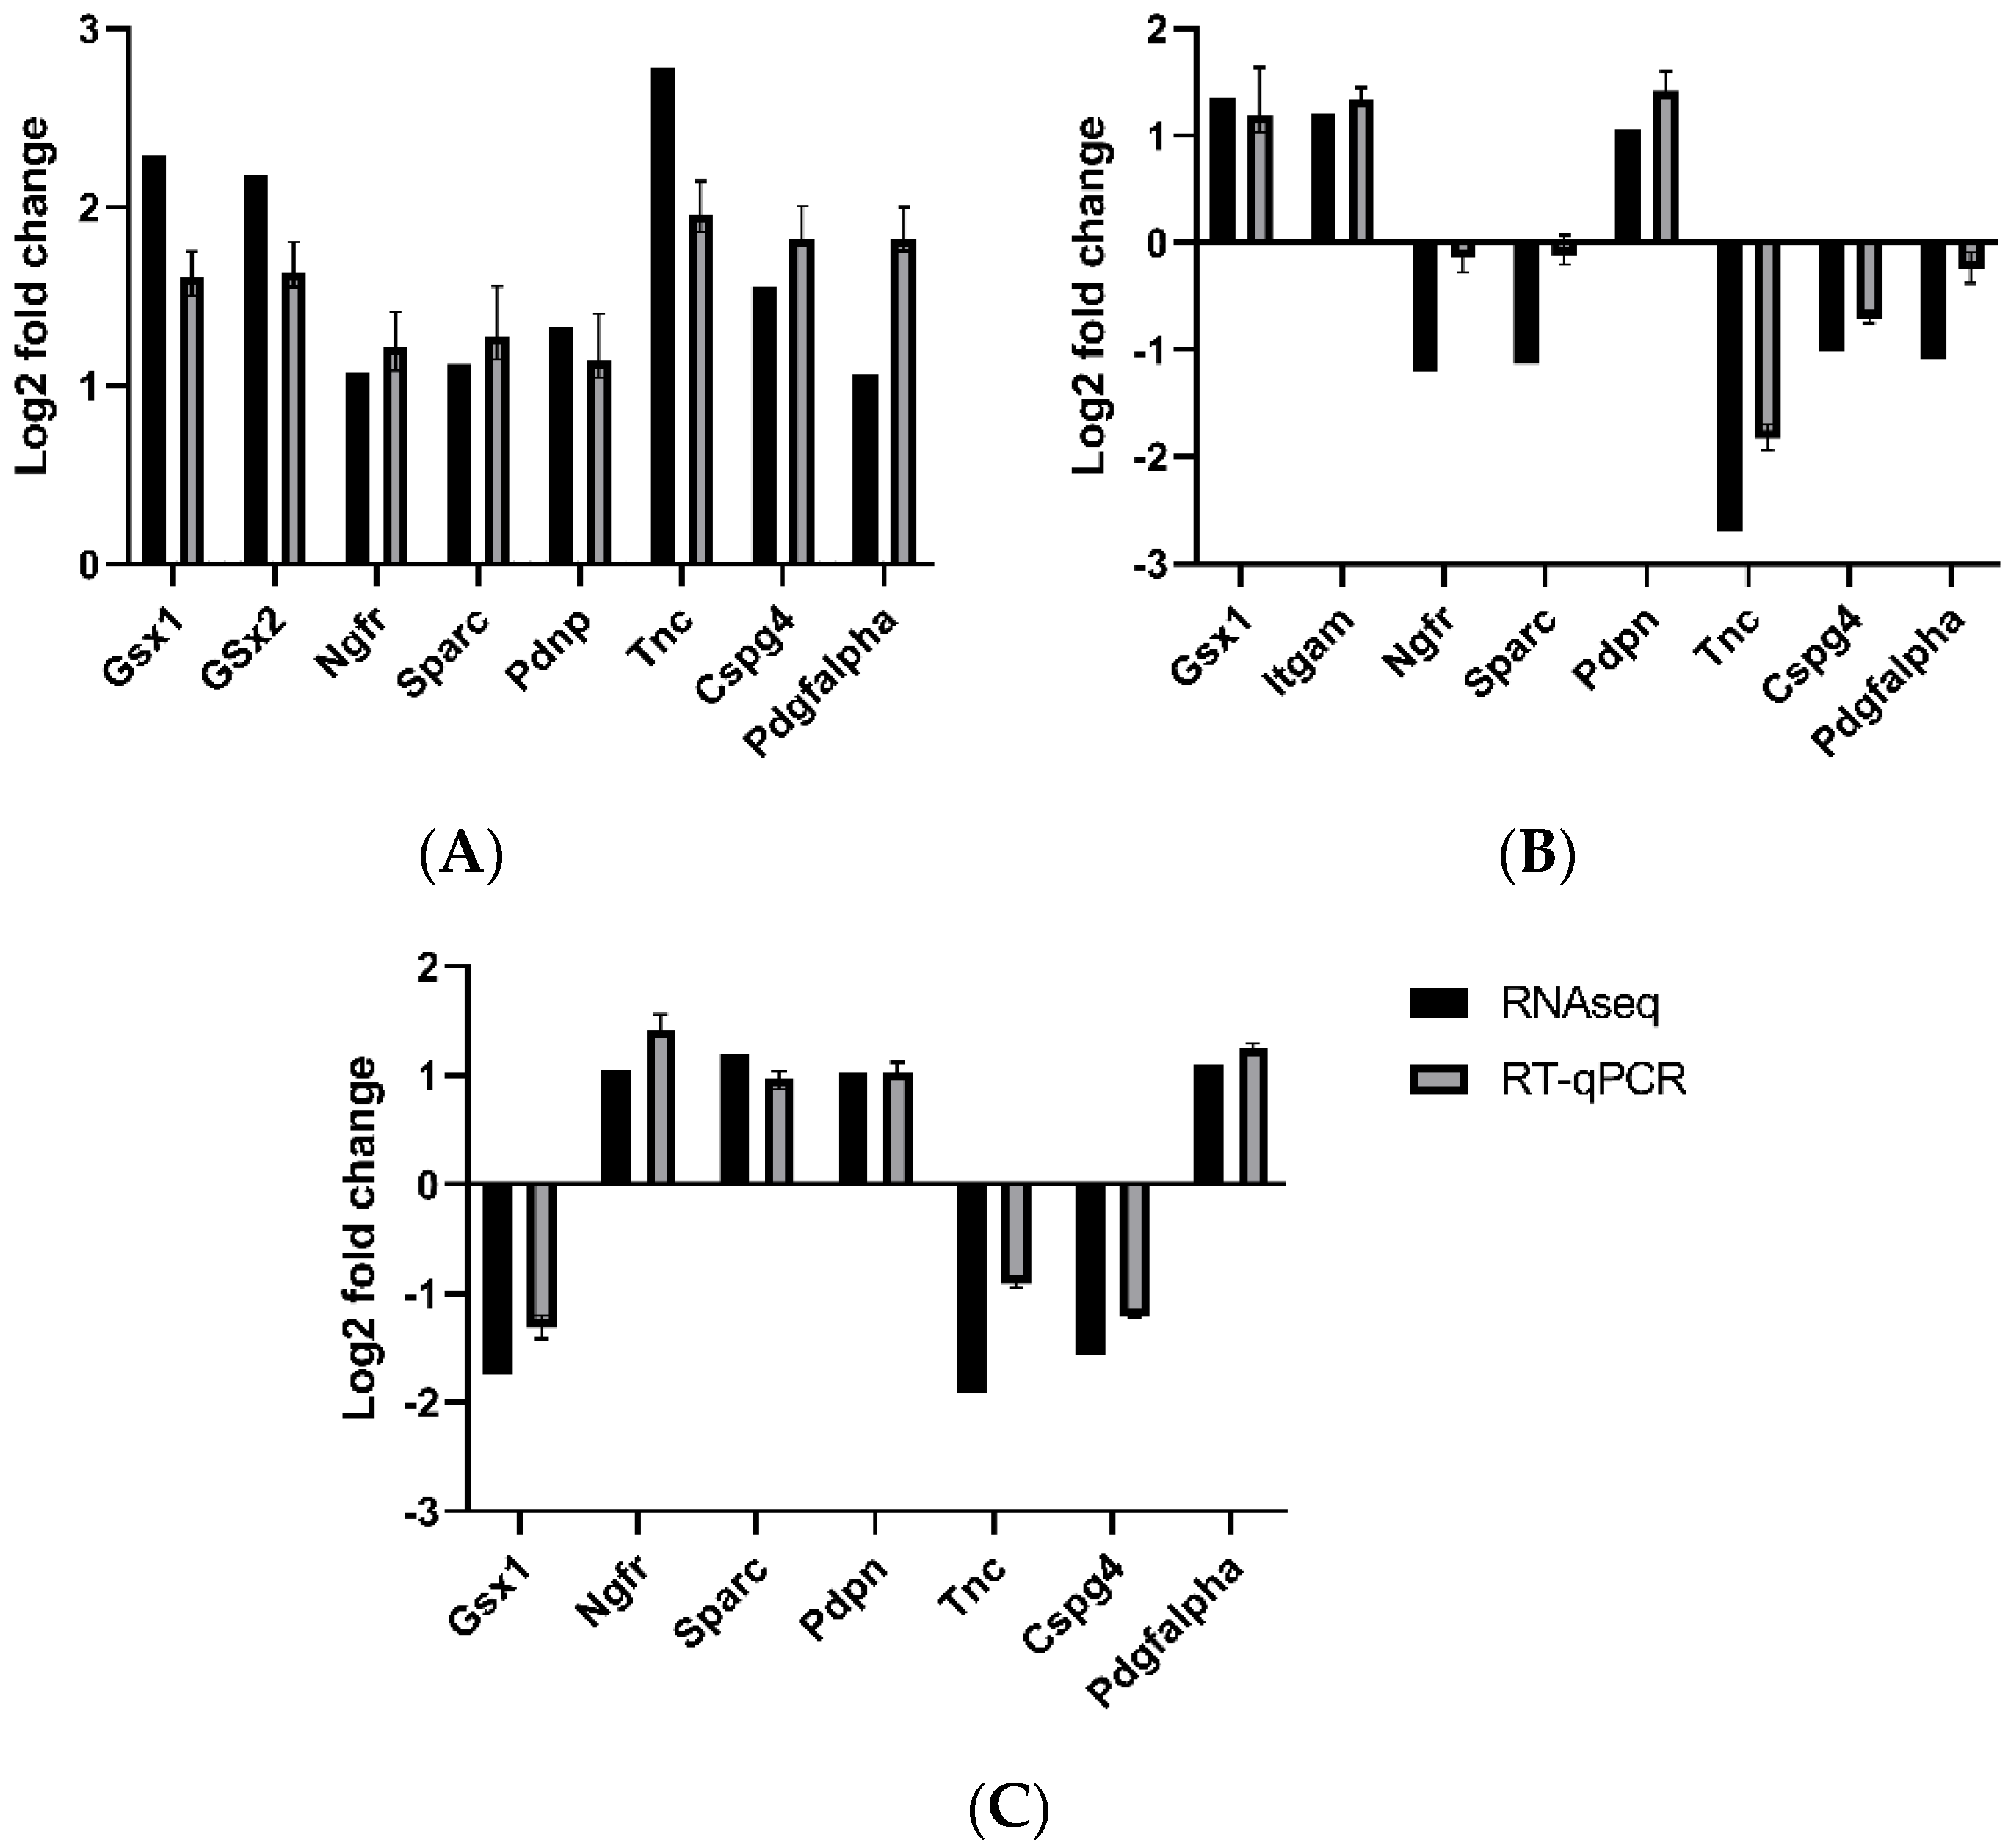
3.5. Validation by qRT-PCR

To validate the sequencing results, the gene expression of 7–8 genes was randomly measured using qRT-PCR. The Log2fold change was determined between spinal cords isolated from MMC and vehicle groups at each time point and analyzed compared to results from the RNA sequencing (Figure 12). While the absolute values were not identical between each measurement type, the trend changes between each gestational time point were congruent with the results obtained from RNA sequencing. These data support that the RNA sequencing method provided reliable quantifications.

4. Discussion

In this study, we employed RNA sequencing to characterize the chronology of the most significant gene expression alterations in the spinal cord after defect development and exposure to the amniotic fluid in the congenital retinoic acid rat model of spina bifida. Models created from single or double mutants in mice do not always match the phenotype of human neural tube defect with the same mutation [12]. For example, a mutation in Vang-like protein 1 (VANGL1) was associated with neural tube defects in humans; however, there was not a neural tube defect phenotype found in homozygous mouse VANGL1 mutants [12]. It is suggested that human neural tube defects are a result of a combination of interacting mutations. The retinoic acid model is similar to human MMC both developmentally and anatomically, so this model may be also associated with interacting mutations [16]. Therefore, the use of retinoic acid is a translationally relevant model to study human MMC. By comparing the gene expression of spinal cords isolated from fetuses with retinoic acid-induced spina bifida to those of its control siblings or fetuses from vehicle-treated dames, we identified over 3000 differentially expressed genes (DEGs) at E15, over 1000 DEGs at E17, and over 300 DEGs at E20. Using this well-established and cost-efficient teratogenic animal model and the matched internal controls and vehicle controls allowed us to identify the changes during the second hit MMC pathophysiology (i.e., the acquired degenerative effect after amniotic fluid exposure) and not due to specific genetic mutations. We used this information to then predict the potential role of the DEGs using GO analysis, KEGG pathway analysis, and protein–protein interaction analysis at each time point. To our knowledge, this is the first study of its kind that identifies key DEGs and potential pathways that could be involved in the neural alterations of spina bifida in this model in utero. We propose that this information lays a foundation for the further study of novel pathways that could potentially be involved in the advancement of spina bifida and specific clinical outcomes. Additionally, these results may also lead to the future tailoring time-specific treatments in combination with the current standard of care that would potentially enhance current surgical spina bifida repair strategies as well as improve overall clinical outcomes.
Our results suggest that a spina bifida defect is associated with alterations in the spinal cord gene expression that regulates aspects of cell survival and positioning, neuron function, and skeletal muscle development during E15 and E17 gestational points. Compared to fetuses with normal development, genes involved in p53 signaling were upregulated in fetuses with MMC at E15, a time point similar to gestational weeks 5–6 in humans [17]. This potential role of p53 signaling is supported by previous evidence that p53 mRNA is upregulated at E15 in the spinal cord of rat fetuses with retinoic acid-induced spina bifida [18]. This pathway is likely involved in the extreme apoptosis found in the spinal cord during spina bifida, which consequently leads to neuronal cell loss, contributing to the impairment of neurological functions, such as motor skills [8,18,19]. Similarly, KEGG pathway analysis also predicted hedgehog signaling to be upregulated, which was previously implicated in neural tube defects [4]. Abnormal hedgehog signaling decreases the survival of neuronal precursors and alters the position of motor neurons resulting in abnormalities in the structure of the motor column [20,21]. Motor neuron function may also potentially be impacted through hedgehog signaling effects on cellular retinoic acid-binding protein 1 (CRABP1) in which variants were observed in patients with neural tube defects [22,23]. Additionally, the glutamate receptor complex was downregulated at this time point, which also diminishes neural cell migration [24]. Furthermore, our results support modifications in neuron function potentially due to downregulation in synaptic vesicle maturation and GABA receptor binding, which plays a role in synapse formation [25]. Finally, DEGs involved in skeletal muscle development and cytoskeleton were upregulated at this time point. Previous studies support the accumulation of actomyosin machinery, which increases tissue stiffness and mechanically inhibits the normal closure of the neural plate, leading to a neural tube defect [26,27,28].
Interestingly, p53 and hedgehog signaling were also upregulated in fetuses with retinoic acid-induced MMC at E17, a time point similar to gestational weeks 20–26 in humans [17]. This was also associated with the downregulation of the glutamate receptor complex, supporting that neuronal survival and positioning continued to be impacted during gestation of this model. However, during this time point, further alterations were observed that diminish neuron function and may lead to clinical outcomes such as paralysis and neurological dysfunction. For example, downregulations in metabolic processes, such as those described by GOs, such as glutathione metabolism, pyruvate metabolism, and cellular glucose homeostasis, were also evident. Deficiencies in molecules involved in glutathione, a major antioxidant, metabolism have been linked to neuronal cell loss in the brain and cognitive impairment, a significant clinical outcome in spina bifida patients [29,30]. In addition, abnormalities in glucose metabolism may lead to impairments in neuron function, as neurons not only break down glucose to meet energetic demands, but they also consume pyruvate that is released by astrocytes after glycolysis [31,32]. Pre-clinical and clinical studies indicate that diabetic mothers or mothers with alterations in genes that regulate glucose metabolism have an increased risk of neural tube defects, supporting a potential role for glucose metabolism in the progression of spina bifida [33,34]. Furthermore, at E17, GO analysis also indicated downregulation of processes involved in myelin sheath production, which is heavily controlled by oligodendrocytes [35]. This effect is likely due to dysregulation in hedgehog signaling at E15 and E17, as this pathway is a major regulator of oligodendrocyte differentiation and function [36].
The dysregulation of processes involved in metabolic pathways and myelination was also apparent in fetuses with retinoic acid-induced MMC at E20, a time point similar to gestational week 34 in humans [17]. In contrast to glutathione and glucose metabolism downregulated at E17, KEGG analysis indicated the downregulation of pathways involved in lipid metabolism, such as lipase activity, ether lipid metabolism, and glycerophospholipid metabolism later in gestation. While few studies have investigated a role for lipid metabolism in spina bifida progression, rare variants in lipid metabolism have been observed in patients with spina bifida phenotypes [37]. Additionally, modifications in this pathway have been connected to diseases associated with motor neuron loss, such as amyotrophic lateral sclerosis in which patients develop muscle paralysis [38]. Furthermore, while several DEGs involved in oligodendrogenesis and myelination were downregulated as a result of retinoic acid, but not associated with spina bifida, other such DEGs including Gpr17, Lims2, and Bcas1 were downregulated in the spinal cord of fetuses with MMC defects. These specific genes were also significantly reduced in prenatal neurosphere cultures after BMP2 treatment, indicating the potential role of BMP2 in diminishing myelination during the progression of spina bifida [39]. Finally, specific only to E20, our results provide evidence that inflammatory processes are upregulated in the spinal cord of fetuses with retinoic acid-induced MMC. Our previous data further support this claim, as an increase in activated microglia, characterized as Iba1+ and MHC class II+ cells, IL-1B, IL-6, and IFN-g, was observed in the spinal cord of fetuses with MMC at E20, but not at earlier time points [8].
We hypothesize that the changes in gene expression we observed after the spina bifida defect is at least in part due to exposure of the spinal cord to the amniotic fluid. Studies on amniotic fluid supernatant collected from pregnant women at the time of open defect identified alterations in pathways similar to our results including those associated with neuronal development, axonal development, and synapse formation [40]. Interestingly, the inflammation had some of the most prominent alterations [40]. Furthermore, this inflammatory response may be due to the toxic components of amniotic fluid, as the amniotic fluid of rats with retinoic acid-induced MMC contained higher amylase levels and activity compared to healthy controls [41]. While the specific role of amylase in spinal cord inflammation and spina bifida outcomes has not been investigated, serum amylase is elevated during pancreatitis and is associated with the elevation of pro-inflammatory cytokines, such as Il-1B and IL-6, which supports the potential pro-inflammatory role of amylase in amniotic fluid [42].

5. Conclusions

In conclusion, through a comprehensive time-course transcriptomic analysis, this is the first study that characterized the progressive changes that occur in the neural tissue after exposure to the amniotic fluid in utero, using the congenital retinoic acid-induced spina bifida rodent model. Current standard surgical strategies only structurally repair the defect and inhibit further neurological damage due to amniotic fluid exposure. Likely due to limited understanding of the mechanisms that drive spina bifida degeneration in utero, there are no treatments available that regenerate healthy neural tissue and function after spina bifida diagnosis. Our results provide evidence that different mechanisms may play more important roles during specific periods throughout fetal progression. Therefore, it may be beneficial to tailor new therapeutic strategies to the gestational age at the time of treatment as well as to entertain an approach where a combination of pathways is targeted. Furthermore, future studies further elucidating the specific targets at different gestational ages during disease progression should be a focus in the spina bifida research community.

Supplementary Materials

The following are available online at https://www.mdpi.com/article/10.3390/brainsci11121593/s1, Figure S1: Top 10 GO biological processes, cellular components, and molecular functions enriched from DEGs that are upregulated (A–C) or downregulated (D–F) in MMC spinal cords compared to control at E15 (A,D), E17 (B,E), and E20 (C,F). Figure S2: Top 10 GO biological processes, cellular components, and molecular functions enriched from DEGS that are upregulated (A–C) or downregulated (D–F) in vehicle spinal cords compared to control at E15 (A,D), E17 (B,E), and E20 (C,F). Figure S3: Top 10 KEGG pathways upregulated and downregulated between MMC and control at E15 (A), E17 (B), and E20 (C) as determined by percent total changed genes in each pathway. Figure S4: Top 10 KEGG pathways upregulated and downregulated between vehicle and control at E15 (A), E17 (B), and E20 (C) as determined by percent total changed genes in each pathway. Figure S5: Protein–protein interaction network analysis based on top 25 downregulated (A) and upregulated (B) differentially expressed genes between MMC and control at E15. Figure S6: Protein–protein interaction network analysis based on top 25 downregulated (A) and upregulated (B) differentially expressed genes between MMC and control at E17. Figure S7: Protein–protein interaction network analysis based on top 25 downregulated (A) and upregulated (B) differentially expressed genes between MMC and control at E20. Figure S8: Protein–protein interaction network analysis based on top 25 downregulated (A) and upregulated (B) differentially expressed genes between vehicle and control at E15. Figure S9: Protein–protein interaction network analysis based on top 25 downregulated (A) and upregulated (B) differentially expressed genes between vehicle and control at E17. Figure S10: Protein–protein interaction network analysis based on top 25 downregulated (A) and upregulated (B) differentially expressed genes between vehicle and control at E20. Table S1: Top 25 upregulated and downregulated genes between MMC and control groups at E15. Table S2: Top 25 upregulated and downregulated genes between MMC and control groups at E17. Table S3: Top 25 upregulated and downregulated genes between MMC and control groups at E20. Table S4: Top 25 upregulated and downregulated genes between control and vehicle groups at E15. Table S5: Top 25 upregulated and downregulated genes between control and vehicle groups at E17. Table S6: Top 25 upregulated and downregulated genes between control and vehicle groups at E20. Graphical Abstract (created with BioRender.com).

Author Contributions

Conceptualization, J.L.P. and M.O.; methodology, K.P.M., B.P. and M.O.; software, M.O.; validation, M.O.; formal analysis, K.P.M., B.P. and M.O.; data curation, K.P.M., B.P. and M.O.; writing—original draft preparation, K.P.M.; writing—review and editing, K.P.M., B.P., J.L.P. and M.O.; supervision, J.L.P. and M.O.; project administration, M.O.; funding acquisition, J.L.P. All authors have read and agreed to the published version of the manuscript.

Funding

This study is supported by NIH/NINDS 1R01NS103992 to JL.P. by the Center for Fetal and Placental Research at the Cincinnati Fetal Center at Cincinnati Children’s Hospital Medical Center.

Institutional Review Board Statement

The experimental protocol agreed with the National Institutes of Health Guidelines for Care and Use of Laboratory Animals and was approved by the Institutional Animal Care and Use Committee at Cincinnati Children’s Hospital and Medical Center (IACUC 2019-0081).

Informed Consent Statement

Not applicable.

Data Availability Statement

RNAseq data were deposited in the Sequence Read Archive (SRA) and can be found via BioProject (PRJNA683230) and SRA(PRJNA683793).

Acknowledgments

We greatly appreciate Nathan Salomonis for advice and help with AltAnalyzer package v2.0 (http://www.altanalyze.org (accessed on 13 November 2021)). The authors would like to thank Novogene Corporation Inc. (Sacramento, CA, USA) for conducting the RNA sequencing.

Conflicts of Interest

The authors declare no conflict of interest. The funders had no role in the design of the study; in the collection, analyses, or interpretation of data; in the writing of the manuscript, or in the decision to publish the results.

References

  1. Copp, A.J.; Adzick, N.S.; Chitty, L.S.; Fletcher, J.M.; Holmbeck, G.N.; Shaw, G.M. Spina bifida. Nat. Rev. Dis. Prim. 2015, 1, 15007. [Google Scholar] [CrossRef] [PubMed]
  2. Copp, A.J.; Greene, N.D.E. Neural tube defects—Disorders of neurulation and related embryonic processes. Wiley Interdiscip. Rev. Dev. Biol. 2013, 2, 213. [Google Scholar] [CrossRef] [PubMed] [Green Version]
  3. Cavalli, P. Prevention of Neural Tube Defects and proper folate periconceptional supplementation. J. Prenat. Med. 2008, 2, 40. [Google Scholar] [PubMed]
  4. Alruwaili, A.A.; Das, J.M. Myelomeningocele. Encycl. Neurol. Sci. 2021, 246–249. [Google Scholar]
  5. Moldenhauer, J.S.; Adzick, N.S. Fetal surgery for myelomeningocele: After the Management of Myelomeningocele Study (MOMS). Semin. Fetal Neonatal Med. 2017, 22, 360–366. [Google Scholar] [CrossRef] [PubMed]
  6. Maroto, A.; Illescas, T.; Meléndez, M.; Arévalo, S.; Rodó, C.; Peiró, J.L.; Belfort, M.; Cuxart, A.; Carreras, E. Ultrasound functional evaluation of fetuses with myelomeningocele: Study of the interpretation of results. J. Matern.-Fetal Neonatal Med. 2017, 30, 2301–2305. [Google Scholar] [CrossRef] [PubMed]
  7. Carreras, E.; Maroto, A.; Illescas, T.; Meléndez, M.; Arévalo, S.; Peiró, J.L.; García-Fontecha, C.G.; Belfort, M.; Cuxart, A. Prenatal ultrasound evaluation of segmental level of neurological lesion in fetuses with myelomeningocele: Development of a new technique. Ultrasound Obstet. Gynecol. 2016, 47, 162–167. [Google Scholar] [CrossRef] [PubMed] [Green Version]
  8. Jackson, C.M.; Mukherjee, S.; Wilburn, A.N.; Cates, C.; Lewkowich, I.P.; Deshmukh, H.; Zacharias, W.J.; Chougnet, C.A. Pulmonary Consequences of Prenatal Inflammatory Exposures: Clinical Perspective and Review of Basic Immunological Mechanisms. Front. Immunol. 2020, 11, 1285. [Google Scholar] [CrossRef] [PubMed]
  9. Reemst, K.; Noctor, S.C.; Lucassen, P.J.; Hol, E.M. The Indispensable Roles of Microglia and Astrocytes during Brain Development. Front. Hum. Neurosci. 2016, 10. [Google Scholar] [CrossRef] [PubMed] [Green Version]
  10. Bayer, S.A.; Altman, J.; Russo, R.J.; Zhang, X. Timetables of Neurogenesis in the Human Brain Based on Experimentally Determ’ined Patterns in the Rat Deriving Principles of Central Nervous System Development from Experimental Studies in Rats. NeuroToxicology 1993, 14, 83–144. [Google Scholar] [PubMed]
  11. Oria, M.; Figueira, R.L.; Scorletti, F.; Sbragia, L.; Owens, K.; Li, Z.; Pathak, B.; Corona, M.U.; Marotta, M.; Encinas, J.L.; et al. CD200-CD200R imbalance correlates with microglia and pro-inflammatory activation in rat spinal cords exposed to amniotic fluid in retinoic acid-induced spina bifida. Sci. Rep. 2018, 8, 1–12. [Google Scholar] [CrossRef] [PubMed]
  12. Copp, A.J.; Stanier, P.; Greene, N.D.E. Neural tube defects—Recent advances, unsolved questions and controversies. Lancet Neurol. 2013, 12, 799. [Google Scholar] [CrossRef] [Green Version]
  13. Olsson, A.; Venkatasubramanian, M.; Chaudhri, V.K.; Aronow, B.J.; Salomonis, N.; Singh, H.; Grimes, H.L. Single-cell analysis of mixed-lineage states leading to a binary cell fate choice. Nature 2016, 537, 698–702. [Google Scholar] [CrossRef]
  14. Salomonis, N.; Schlieve, C.R.; Pereira, L.; Wahlquist, C.; Colas, A.; Zambon, A.C.; Vranizan, K.; Spindler, M.J.; Pico, A.R.; Cline, M.S.; et al. Alternative splicing regulates mouse embryonic stem cell pluripotency and differentiation. Proc. Natl. Acad. Sci. USA 2010, 107, 10514–10519. [Google Scholar] [CrossRef] [PubMed] [Green Version]
  15. Emig, D.; Salomonis, N.; Baumbach, J.; Lengauer, T.; Conklin, B.R.; Albrecht, M. AltAnalyze and DomainGraph: Analyzing and visualizing exon expression data. Nucleic Acids Res. 2010, 38, W755. [Google Scholar] [CrossRef] [PubMed] [Green Version]
  16. Danzer, E.; Schwarz, U.; Wehrli, S.; Radu, A.; Adzick, N.S.; Flake, A.W. Retinoic acid induced myelomeningocele in fetal rats: Characterization by histopathological analysis and magnetic resonance imaging. Exp. Neurol. 2005, 194, 467–475. [Google Scholar] [CrossRef] [PubMed]
  17. Pressler, R.; Auvin, S. Comparison of brain maturation among species: An example in translational research suggesting the possible use of bumetanide in newborn. Front. Neurol. 2013, 4, 36. [Google Scholar] [CrossRef] [PubMed] [Green Version]
  18. Wu, L.; Wei, X.; Fan, Y.; Miao, J.; Wang, L.; Zhang, Y.; Wu, D.; Yuan, Z. Altered Expression of 14-3-3ζ Protein in Spinal Cords of Rat Fetuses with Spina Bifida Aperta. PLoS ONE 2013, 8, e70457. [Google Scholar] [CrossRef] [PubMed]
  19. Jacobs, W.B.; Kaplan, D.R.; Miller, F.D. The p53 family in nervous system development and disease. J. Neurochem. 2006, 97, 1571–1584. [Google Scholar] [CrossRef]
  20. Oppenheim, R.W.; Homma, S.; Marti, E.; Prevette, D.; Wang, S.; Yaginuma, H.; McMahon, A.P. Modulation of Early but Not Later Stages of Programmed Cell Death in Embryonic Avian Spinal Cord by Sonic Hedgehog. Mol. Cell. Neurosci. 1999, 13, 348–361. [Google Scholar] [CrossRef] [PubMed]
  21. Yang, C.; Li, S.; Li, X.; Li, H.; Li, Y.; Zhang, C.; Lin, J. Effect of sonic hedgehog on motor neuron positioning in the spinal cord during chicken embryonic development. J. Cell. Mol. Med. 2019, 23, 3549. [Google Scholar] [CrossRef] [PubMed] [Green Version]
  22. Lin, Y.-L.; Lin, Y.-W.; Nhieu, J.; Zhang, X.; Wei, L.-N. Sonic Hedgehog-Gli1 Signaling and Cellular Retinoic Acid Binding Protein 1 Gene Regulation in Motor Neuron Differentiation and Diseases. Int. J. Mol. Sci. 2020, 21, 4125. [Google Scholar] [CrossRef]
  23. Li, H.; Zhang, J.; Chen, S.; Wang, F.; Zhang, T.; Niswander, L. Genetic contribution of retinoid related genes to neural tube defects. Hum. Mutat. 2018, 39, 550. [Google Scholar] [CrossRef] [PubMed]
  24. Sequerra, E.B.; Goyal, R.; Castro, P.A.; Levin, J.B.; Borodinsky, L.N. NMDA Receptor Signaling Is Important for Neural Tube Formation and for Preventing Antiepileptic Drug-Induced Neural Tube Defects. J. Neurosci. 2018, 38, 4762–4773. [Google Scholar] [CrossRef]
  25. Fu, Y.; Wu, X.; Lu, J.; Huang, J. Presynaptic GABAB Receptor Regulates Activity-Dependent Maturation and Patterning of Inhibitory Synapses through Dynamic Allocation of Synaptic Vesicles. Front. Cell. Neurosci. 2012, 6, 57. [Google Scholar] [CrossRef] [PubMed] [Green Version]
  26. Finckenstein, F.G.; Davicioni, E.; Osborn, K.G.; Cavenee, W.K.; Arden, K.C.; Anderson, M.J. Transgenic mice expressing PAX3-FKHR have multiple defects in muscle development, including ectopic skeletal myogenesis in the developing neural tube. Transgenic Res. 2006, 15, 595–614. [Google Scholar] [CrossRef]
  27. Rolo, A.; Escuin, S.; Greene, N.D.E.; Copp, A.J. Rho GTPases in mammalian spinal neural tube closure. Small GTPases 2018, 9, 283. [Google Scholar] [CrossRef] [Green Version]
  28. Escuin, S.; Vernay, B.; Savery, D.; Gurniak, C.B.; Witke, W.; Greene, N.D.E.; Copp, A.J. Rho-kinase-dependent actin turnover and actomyosin disassembly are necessary for mouse spinal neural tube closure. J. Cell Sci. 2015, 128, 2468. [Google Scholar] [CrossRef] [Green Version]
  29. Dringen, R.; Pfeiffer, B.; Hamprecht, B. Synthesis of the Antioxidant Glutathione in Neurons: Supply by Astrocytes of CysGly as Precursor for Neuronal Glutathione. J. Neurosci. 1999, 19, 562–569. [Google Scholar] [CrossRef] [PubMed]
  30. Sedlak, T.W.; Paul, B.D.; Parker, G.M.; Hester, L.D.; Snowman, A.M.; Taniguchi, Y.; Kamiya, A.; Snyder, S.H.; Sawa, A. The glutathione cycle shapes synaptic glutamate activity. Proc. Natl. Acad. Sci. USA 2019, 116, 2701. [Google Scholar] [CrossRef] [PubMed] [Green Version]
  31. Rouleau, C.; Rakotoarivelo, C.; Petite, D.; Lambert, K.; Fabre, C.; Bonardet, A.; Mercier, J.; Baldet, P.; Privat, A.; Langley, K.; et al. Pyruvate modifies glycolytic and oxidative metabolism of rat embryonic spinal cord astrocyte cell lines and prevents their spontaneous transformation. J. Neurochem. 2007, 100, 1589–1598. [Google Scholar] [CrossRef]
  32. Díaz-García, C.M.; Yellen, G. Neurons rely on glucose rather than astrocytic lactate during stimulation. J. Neurosci. Res. 2019, 97, 883. [Google Scholar] [CrossRef] [Green Version]
  33. Fu, Y.; Wang, L.; Yi, D.; Jin, L.; Liu, J.; Zhang, Y.; Ren, A. Association between maternal single nucleotide polymorphisms in genes regulating glucose metabolism and risk for neural tube defects in offspring. Birth Defects Res. Part A Clin. Mol. Teratol. 2015, 103, 471–478. [Google Scholar] [CrossRef]
  34. Loeken, M.R. Current perspectives on the causes of neural tube defects resulting from diabetic pregnancy. Am. J. Med. Genet. Part C Semin. Med. Genet. 2005, 135C, 77–87. [Google Scholar] [CrossRef] [PubMed]
  35. Kuhn, S.; Gritti, L.; Crooks, D.; Dombrowski, Y. Oligodendrocytes in Development, Myelin Generation and Beyond. Cells 2019, 8, 1424. [Google Scholar] [CrossRef] [PubMed] [Green Version]
  36. Wang, L.-C.; Almazan, G. Role of Sonic Hedgehog Signaling in Oligodendrocyte Differentiation. Neurochem. Res. 2016 4112 2016, 41, 3289–3299. [Google Scholar] [CrossRef] [PubMed]
  37. Zou, J.; Wang, F.; Yang, X.; Wang, H.; Niswander, L.; Zhang, T.; Li, H. Association between rare variants in specific functional pathways and human neural tube defects multiple subphenotypes. Neural Dev. 2020, 15, 1–15. [Google Scholar] [CrossRef] [PubMed]
  38. Chaves-Filho, A.B.; Pinto, I.F.D.; Dantas, L.S.; Xavier, A.M.; Inague, A.; Faria, R.L.; Medeiros, M.H.G.; Glezer, I.; Yoshinaga, M.Y.; Miyamoto, S. Alterations in lipid metabolism of spinal cord linked to amyotrophic lateral sclerosis. Sci. Rep. 2019, 9, 1–14. [Google Scholar] [CrossRef] [Green Version]
  39. Scholl, C.; Weißmüller, K.; Holenya, P.; Shaked-Rabi, M.; Tucker, K.L.; Wölfl, S. Distinct and overlapping gene regulatory networks in BMP- and HDAC-controlled cell fate determination in the embryonic forebrain. BMC Genom. 2012, 13, 1–18. [Google Scholar] [CrossRef] [PubMed] [Green Version]
  40. Tarui, T.; Kim, A.; Flake, A.; Mcclain, L.; Stratigis, J.; Fried, I.; Newman, R.; Slonim, D.K.; Bianchi, D.W. Amniotic fluid transcriptomics reflects novel disease mechanisms in fetuses with myelomeningocele. Am. J. Obstet. Gynecol. 2017, 217, 587.e1. [Google Scholar] [CrossRef] [PubMed] [Green Version]
  41. Sasso, E.B.; Thornton, M.E.; Chmait, R.H.; Ouzounian, J.G.; Grubbs, B.H. Amylase concentration and activity in the amniotic fluid of fetal rats with retinoic acid induced myelomeningocele. J. Matern.-Fetal Neonatal Med. 2020. [Google Scholar] [CrossRef] [PubMed]
  42. Manohar, M.; Verma, A.K.; Venkateshaiah, S.U.; Sanders, N.L.; Mishra, A. Pathogenic mechanisms of pancreatitis. World J. Gastrointest. Pharmacol. Ther. 2017, 8, 10. [Google Scholar] [CrossRef] [PubMed]
Figure 1. Principal component analysis of libraries sequenced for RNA-seq for tissues isolated at (A) E15, (B) E17, and (C) E20.
Brainsci 11 01593 g001
Figure 2. Volcano plot illustrating RNA-seq data of fetal spinal cords isolated from MMC and vehicle at (A) E15, (B) E17, and (C) E20. Red identifies genes that were greater than 1.5-fold change and p < 0.05.
Brainsci 11 01593 g002
Figure 3. Volcano plot illustrating RNA-seq data of fetal spinal cords isolated from MMC and control at (A) E15, (B) E17, and (C) E20. Red identifies genes that were greater than 1.5-fold change and p < 0.05.
Brainsci 11 01593 g003
Figure 4. Volcano plot illustrating RNA-seq data of fetal spinal cords isolated from control and vehicle at (A) E15, (B) E17, and (C) E20. Red identifies genes that were greater than 1.5-fold change and p < 0.05.
Brainsci 11 01593 g004
Figure 5. Hierarchical clustering analysis of differentially expressed genes in the spinal cord of MMC, vehicle, and control fetuses isolated at (A) E15, (B) E17, and (C) E20.
Brainsci 11 01593 g005
Figure 6. Enrichment scores of the top 10 GO biological processes, cellular components, and molecular function enriched from differentially expressed genes that are (A) upregulated or (B) downregulated in MMC spinal cords compared to vehicle at E15. All GO pathways were >1.5-fold and p < 0.05.
Brainsci 11 01593 g006
Figure 7. Enrichment scores of the top 10 GO biological processes, cellular components, and molecular function enriched from differentially expressed genes that are (A) upregulated or (B) downregulated in MMC spinal cords compared to vehicle at E17. All GO pathways were >1.5-fold and p < 0.05.
Brainsci 11 01593 g007
Figure 8. Enrichment scores of the top 10 GO biological processes, cellular components, and molecular function enriched from differentially expressed genes that are (A) upregulated or (B) downregulated in MMC spinal cords compared to vehicle at E20. All GO pathways were >1.5-fold and p < 0.05.
Brainsci 11 01593 g008
Figure 9. KEGG and protein–protein interaction network analysis of differentially expressed genes in the spinal cord of MMC and vehicle fetuses isolated at E15. (A) Top 10 KEGG pathways upregulated and downregulated as determined by percent total changed genes in each pathway. All pathways were greater than 1.5-fold change and p < 0.05. (B,C) Protein–protein interaction network analysis based on top 25 (B) upregulated and (C) downregulated differentially expressed genes.
Brainsci 11 01593 g009
Figure 10. KEGG and protein–protein interaction network analysis of differentially expressed genes in the spinal cord of MMC and vehicle fetuses isolated at E17. (A) Top 10 KEGG pathways upregulated and downregulated as determined by percent total changed genes in each pathway. All pathways were greater than 1.5-fold change and p < 0.05. (B,C) Protein–protein interaction network analysis based on top 25 (B) upregulated and (C) downregulated differentially expressed genes.
Brainsci 11 01593 g010
Figure 11. KEGG and protein–protein interaction network analysis of differentially expressed genes in the spinal cord of MMC and vehicle fetuses isolated at E20. (A) Top 10 KEGG pathways upregulated and downregulated as determined by percent total changed genes in each pathway. All pathways were greater than 1.5-fold change and p < 0.05. (B,C) Protein–protein interaction network analysis based on top 25 (B) upregulated and (C) downregulated differentially expressed genes.
Brainsci 11 01593 g011
Figure 12. Comparison between RNA sequencing results and RT-qPCR between MMC and vehicle at (A) E15, (B) E17, and (C) E20.
Brainsci 11 01593 g012
Table 1. TaqMan probes used for RT-qPCR analysis.
mRNAName* Assay Code Number
Gsx1GS Homeobox1Rn01412792_g1
Gsx2GS Homeobox2Rn03810223_m1
NgfrNerve Growth Factor ReceptorRn00561634_m1
SparcSecreted Protein, Acidic, Cysteine-RichRn01470624_m1
PdpnPodoplaninRn00571195_m1
Hprt1Hypoxanthine Phosphoribosyl Transferase 1Rn01527840_m1
TncTenascin CRn01454948_m1
PdgfaPlatelet-Derived Growth Factor PolypeptideRn00709363_m1
* Probe codes from Thermo Fisher Scientific.
Table 2. Number of differentially expressed genes identified as >1.5-fold change and p < 0.05 and % of total differentially expressed genes up- or downregulated.
E15E17E20
TotalUpregulatedDownregulatedTotalUpregulatedDownregulatedTotalUpregulatedDownregulated
MMC vs. Vehicle30221324 (44%)1698 (56%)1167312 (27%)855 (73%)302133 (44%)169 (56%)
MMC vs. Control37772119 (56%)1658 (44%)1847264 (14%)1583 (86%)469154 (33%)315 (67%)
Control vs. Vehicle505147 (29%)358 (71%)327117 (56%)210 (44%)355269 (76%)86 (24%)
Table 3. Top 25 upregulated and downregulated genes between MMC and vehicle groups at E15.
Gene SymbolFull Gene NameFold Changep Value
Actc1Actin, alpha cardiac muscle 168.26 6.81 × 10 6
Tnni1Troponin I, slow skeletal muscle20.94 3.828 × 10 5
Rps2040S ribosomal protein S2020.21 1.408 × 10 3
Myh3Myosin-317.56 3.27 × 10 6
Tnnc2Troponin C, skeletal muscle15.43 2.59 × 10 5
Krt5Keratin, type II cytoskeletal 514.95 6.67 × 10 3
Myl1Myosin light chain 1/3, skeletal muscle isoform 14.81 3.88 × 10 5
MyogMyogenin13.50 1.30 × 10 5
Cxcl14C-X-C motif chemokine 14 precursor12.76 4.99 × 10 4
Twist2Twist-related protein 212.62 5.29 × 10 6
Tnnt1Troponin T, slow skeletal muscle12.24 5.33 × 10 5
Smoc2SPARC-related modular calcium-binding protein 2
precursor
11.22 4.24 × 10 6
Fam167bFamily with sequence similarity 167, member B10.45 6.29 × 10 4
Agtr2Type-2 angiotensin II receptor10.28 1.89 × 10 4
Krt14Keratin, type I cytoskeletal 1410.22 4.65 × 10 3
Myod1Myoblast determination protein 110.01 9.92 × 10 6
Kremen2Kremen protein 2 precursor9.82 9.19 × 10 6
Myl4Myosin light chain 49.67 1.36 × 10 4
Pitx1Pituitary homeobox 19.57 9.11 × 10 4
Hand2Heart- and neural crest derivatives-expressed protein 29.45 3.02 × 10 4
Krt15Keratin, type I cytoskeletal 159.23 1.43 × 10 3
MylpfMyosin regulatory light chain 2, skeletal muscle isoform8.91 1.06 × 10 4
Actn2Actinin alpha 27.50 1.11 × 10 4
Acta1Actin, alpha skeletal muscle6.50 2.38 × 10 5
Tbx15T-box transcription factor TBX156.44 5.78 × 10 4
EF1AElongation factor 1-alpha−51.18 4.81 × 10 3
Lynx1Ly-6/neurotoxin-like protein 1 precursor−13.24 2.35 × 10 6
Necab1N-terminal EF-hand calcium-binding protein 1 −8.35 3.64 × 10 5
Slc6a13Sodium- and chloride-dependent GABA transporter 2−7.65 2.54 × 10 5
BcanBrevican core protein isoform 1 precursor−7.18 3.16 × 10 5
Slc13a4Solute carrier family 13 member 4 precursor−7.01 6.39 × 10 5
Clec3bC-type lectin domain family 3, member b-6.78 7.60 × 10 5
Hoxc8Homeobox protein Hox-C8−6.15 8.64 × 10 4
Slc6a11Sodium- and chloride-dependent GABA transporter 3−5.85 2.47 × 10 5
S100bProtein S100-B−5.63 1.49 × 10 4
Grm5Metabotropic glutamate receptor 5−5.40 2.03 × 10 5
Slc22a6Solute carrier family 22 member 6−4.86 1.65 × 10 4
PtgdsProstaglandin-H2 D-isomerase−4.63 6.46 × 10 5
Vsnl1Visinin-like protein 1−4.61 1.87 × 10 4
Slc16a11Solute carrier family 16, member 11−4.26 2.41 × 10 4
Ccl19C-C motif chemokine 19 precursor−4.20 2.18 × 10 4
Park2E3 ubiquitin-protein ligase parkin−4.19 7.30 × 10 5
Cdh8Cadherin-8 precursor−3.90 3.29 × 10 4
SncbBeta-synuclein −3.80 6.87 × 10 4
FmodFibromodulin precursor −3.73 4.79 × 10 4
Hs6st3Heparan-sulfate 6-O-sulfotransferase 3 precursor−3.72 1.41 × 10 3
Cyp26b1Cytochrome P450 26B1 −3.69 1.18 × 10 4
Tac1Protachykinin-1 Substance P Neurokinin A Neuropeptide K Neuropeptide gamma C-terminal-flanking peptide−3.69 2.52 × 10 3
Olig1Oligodendrocyte transcription factor 1−3.64 1.10 × 10 3
Chd5Chromodomain-helicase-DNA-binding protein 5−3.63 2.48 × 10 4
Table 4. Top 25 upregulated and downregulated genes between MMC and vehicle groups at E17.
Gene SymbolFull Gene NameFold Changep Value
Fam167bFamily with sequence similarity 167, member B8.18 1.12 × 10 2
Hoxc11Homeobox C117.72 6.76 × 10 3
Fam50aProtein Fam50a6.96 9.29 × 10 3
Dbx1Homeobox protein DBX15.82 2.49 × 10 3
CapgMacrophage-capping protein5.59 8.40 × 10 5
Hoxa11Protein Hoxa105.40 1.36 × 10 2
Tmem200bTransmembrane protein 200B4.16 4.99 × 10 4
Cox6a2Cytochrome c oxidase subunit 6A2, mitochondrial4.06 9.10 × 10 2
Hbb-b2Hemoglobin subunit beta-23.97 2.12 × 10 3
PlvapPlasmalemma vesicle-associated protein 3.94 2.05 × 10 2
Hoxd12Homeo box D123.92 1.36 × 10 4
Rd3Retinal degeneration 33.67 1.46 × 10 2
Neurog2Protein Neurog23.67 1.26 × 10 2
RetsatAll-trans-retinol 13,14-reductase precursor3.41 3.32 × 10 4
Tnfrsf22Tumor necrosis factor superfamily member 223.37 6.39 × 10 4
Rps2040S ribosomal protein S203.18 7.69 × 10 3
Hist1h2bcHistone H2B3.14 1.93 × 10 3
Hoxc10Homeo box C103.13 2.03 × 10 3
ArxHomeobox protein ARX2.97 5.39 × 10 3
ATP5F1EATP synthase subunit epsilon, mitochondrial2.96 2.81 × 10 3
Col15a1Collagen alpha-1(XV) chain precursor2.96 4.95 × 10 2
Hsd11b2Corticosteroid 11-beta-dehydrogenase isozyme 22.95 3.39 × 10 4
Wt1Wilms tumor protein homolog2.90 9.21 × 10 4
Hoxd10Homeo box D102.82 2.85 × 10 3
CebpaCCAAT/enhancer-binding protein alpha2.81 1.91 × 10 2
PtgdsProstaglandin-H2 D-isomerase−49.27 1.02 × 10 4
Gm10068Chromobox 3, pseudogene 7−11.565.10 × 10−5
Eno2Enolase 2−9.46 2.43 × 10 3
CalcaCalcitonin −6.91 1.68 × 10 4
SDHAF1Succinate dehydrogenase assembly factor 1−6.07 3.42 × 10 2
Defb10Beta-defensin 10-5.15 1.42 × 10 4
Lynx1Ly-6/neurotoxin-like protein 1 precursor−4.83 7.85 × 10 3
Reg3bRegenerating islet-derived protein 3-beta−4.55 2.01 × 10 2
Slc22a6Solute carrier family 22 member 6−4.41 9.99 × 10 5
Hoxc8Homeobox protein Hox-C8−4.35 7.76 × 10 4
Hoxc5Homeo box C5−4.16 1.38 × 10 2
Uts2dUrotensin-2B−4.06 5.12 × 10 4
Slc13a4Solute carrier family 13 member 4 precursor−4.06 1.15 × 10 3
Gng4Guanine nucleotide-binding protein subunit gamma 4 −4.01 7.08 × 10 3
NUPR1Nuclear protein 1−3.83 3.09 × 10 3
Slc6a13Sodium- and chloride-dependent GABA transporter 2 −3.82 2.29 × 10 4
NefhNeurofilament heavy polypeptide−3.73 8.48 × 10 4
CalcbCalcitonin gene-related peptide 2 precursor−3.62 1.87 × 10 4
Asgr1Asialoglycoprotein receptor 1−3.60 2.10 × 10 4
Gng13Guanine nucleotide binding protein, gamma 13−3.48 3.79 × 10 3
Ccl19C-C motif chemokine 19 precursor−3.44 5.99 × 10 3
Hoxc6Homeo box C6−3.33 2.14 × 10 3
Snhg11Small nucleolar RNA host gene 11 (non-protein coding)−3.32 6.00 × 10 3
Gjb6Gap junction beta-6 protein−3.30 4.40 × 10 3
SynprSynaptoporin−3.29 1.24 × 10 3
Table 5. Top 25 upregulated and downregulated genes between MMC and vehicle groups at E20.
Gene SymbolFull Gene NameFold Changep Value
EF1AElongation factor 1-alpha129.91 6.48 × 10 5
Krt5Keratin, type II cytoskeletal 551.61 2.60 × 10 2
Hoxc11Homeobox C1129.97 1.27 × 10 2
HBBHemoglobin subunit beta-229.46 1.84 × 10 2
Krt14Keratin, type I cytoskeletal 1425.30 2.63 × 10 2
Hoxa11Homeobox A119.35 3.12 × 10 3
RPS1840S ribosomal protein S188.87 1.14 × 10 3
Hoxa11Protein Hoxa10; RCG524558.13 3.06 × 10 3
RT1-DaRT1 class II, locus Da precursor6.32 2.27 × 10 3
MRPL36Mitochondrial ribosomal protein L365.85 4.45 × 10 2
Ntrk1High affinity nerve growth factor receptor5.70 4.95 × 10 3
Lgals3Galectin-35.36 2.53 × 10 2
Cd74H-2 class II histocompatibility antigen gamma chain5.23 2.36 × 10 3
FZD8Frizzled 84.84 7.65 × 10 3
Prdm12PR domain zinc finger protein 124.82 8.55 × 10 3
Tlx2T-cell leukemia, homeobox 24.82 2.27 × 10 2
Stfa2l1Stefin-34.70 2.25 × 10 2
Ccl12Chemokine (C-C motif) ligand 12 precursor4.52 1.95 × 10 2
HcstHematopoietic cell signal transducer4.50 1.11 × 10 2
Tusc5Tumor suppressor candidate 5 homolog4.48 1.28 × 10 2
Scn10aSodium channel protein type 10 subunit alpha4.34 6.80 × 10 3
Slc2a3Solute carrier family 2, facilitated glucose transporter member 34.33 2.77 × 10 3
RT1-BbRano class II histocompatibility antigen, B-1 beta chain precursor4.18 1.38 × 10 3
FcnbFicolin-24.04 4.42 × 10 2
SostSclerostin4.03 3.39 × 10 2
Pla2g3Group 3 secretory phospholipase A2 precursor−9.01 1.47 × 10 2
Bcas1Breast carcinoma-amplified sequence 1 homolog−5.78 3.52 × 10 2
MbpMyelin basic protein S−5.72 1.68 × 10 3
Tnks2Tankyrase 2−5.59 5.93 × 10 3
Gpr17Uracil nucleotide/cysteinyl leukotriene receptor−5.58 4.84 × 10 2
TSGA14Testis-Specific Gene A14 Protein−5.56 6.59 × 10 3
Slc22a6Solute carrier family 22 member 6−5.19 1.73 × 10 2
PnlipPancreatic triacylglycerol lipase precursor−4.83 2.51 × 10 3
Slc6a13Sodium- and chloride-dependent GABA transporter 2 −4.48 3.47 × 10 3
OgnOsteoglycin−4.46 4.11 × 10 2
Paqr8Membrane progestin receptor beta−4.44 2.86 × 10 2
Nkx6-2NK6 homeobox 2−4.35 1.94 × 10 2
CrygnGamma-crystallin N−4.23 4.27 × 10 2
Scrg1Scrapie-responsive protein 1−4.09 1.45 × 10 2
Plp1Myelin proteolipid protein−3.92 5.92 × 10 3
Zfp488Zinc Finger Protein 488−3.89 4.68 × 10 2
FmodFibromodulin precursor−3.80 4.67 × 10 3
Pmaip1Phorbol-12-myristate-13-acetate-induced protein 1−3.79 2.61 × 10 2
AKR1B10Aldo-keto reductase family 1, member B10−3.56 4.93 × 10 2
Fgf15Fibroblast growth factor 15 precursor−3.50 1.21 × 10 2
Slc5a7High affinity choline transporter 1−3.47 3.53 × 10 2
Bmp6Bone morphogenetic protein 6−3.46 2.36 × 10 2
Lims2LIM and senescent cell antigen-like-containing domain protein 2−3.30 3.69 × 10 2
Pnpla1Patatin-like phospholipase domain-containing protein 1−3.29 4.12 × 10 2
Kcne1lPotassium voltage-gated channel subfamily E member 1-like protein−3.24 6.35 × 10 3
Table 6. Top 10 GO biological processes, cellular components, and molecular functions enriched from differentially expressed genes that are upregulated in MMC spinal cords compared to vehicle at E15. All GO pathways were >1.5-fold and p < 0.05.
GO Biological ProcessGO Cellular ComponentGO Molecular Function
Regulation of retroviral genome replicationCleavage furrowExtracellular matrix binding
DNA ligationRibonucleoside-diphosphate reductase complexSingle-stranded DNA-dependent ATPase activity
Tight junction assemblyDNA polymerase complexPeptidase activator activity
Wound healing, spreading of cellsT-tubuleHistone kinase activity
DNA biosynthetic processContractile fiberCaspase regulator activity
CytokinesisContractile fiber partRibonucleoside-diphosphate reductase activity
Regulation of mesoderm developmentPerinuclear region of cytoplasmFlap endonuclease activity
Glial cell migrationExtracellular vesicular exosomeCyclin-dependent protein kinase activity
MemoryCyclin-dependent protein kinase holoenzyme complexDNA N-glycosylase activity
Negative regulation of cytokine productionNuclear envelopeReceptor signaling protein tyrosine kinase activity
Table 7. Top 10 GO biological processes, cellular components, and molecular functions enriched from differentially expressed genes that are downregulated in MMC spinal cords compared to vehicle at E15. All GO pathways were >1.5-fold and p < 0.05.
GO Biological ProcessGO Cellular ComponentGO Molecular Function
Regulation of gamma-aminobutyric acid secretionSodiumNeurotransmitter binding
Positive regulation of epidermal growth factor
receptor activity
Neuronal cell body membraneProtein kinase C activity
Negative regulation of leukocyte migrationcAMP-dependent protein kinase complexAdenylate cyclase activity
Protein localization to synapseHeterotrimeric G-protein complexCalcium-dependent protein kinase regulator activity
Regulation of ARF protein
signal transduction
Periplasmic spaceGABA receptor binding
Synaptic vesicle maturationProtein phosphatase type 2A complexLong-chain fatty acid-CoA ligase activity
Positive regulation of amine transportIonotropic glutamate receptor complexNeurexin binding
Negative regulation of insulin receptor signaling pathwaySynapse partSerotonin receptor activity
Cell junction maintenanceRecycling endosome membraneCalcium-dependent protein binding
InnervationCell junctionProtein phosphatase regulator activity
Table 8. Top 10 GO biological processes, cellular components, and molecular functions enriched from differentially expressed genes that are upregulated in MMC spinal cords compared to vehicle at E17. All GO pathways were >1.5-fold and p < 0.05.
GO Biological ProcessGO Cellular ComponentGO Molecular Function
Female pregnancyCortical cytoskeletonmRNA 3′-UTR binding
Proximal/distal pattern formationMyosin complexExtracellular matrix structural constituent
Specification of loop of Henle identityStress fiberGrowth factor binding
Regulation of endocrine processNucleosomeManganese ion binding
Platelet activationCollagenProtein dimerization activity
Somatic stem cell maintenanceBasement membraneHormone activity
Multicellular organism adhesionExtracellular matrixC2H2 zinc finger domain binding
Retinol metabolic processHemoglobin complexOxygen transporter activity
Endochondral ossificationExtracellular spaceOxygen binding
Negative regulation of cell fate specification NucleusActin filament binding
Table 9. Top 10 GO biological processes, cellular components, and molecular functions enriched from differentially expressed genes that are downregulated in MMC spinal cords compared to vehicle at E17. All GO pathways were >1.5-fold and p < 0.05.
GO Biological ProcessGO Cellular ComponentGO Molecular Function
Regulation of response to foodHeterotrimeric G protein complexNeuropeptide hormone activity
Gastric acid secretionPerikaryonChannel inhibitor activity
Negative regulation of tissue remodelingExtrinsic to organelle membraneGABA receptor binding
Neuronal action potential propagationEndomembrane systemRetinoid binding
Peptide transportDendritic shaftNeuropeptide receptor binding
Diol metabolic processAxon partCyclic nucleotide binding
Regulation of cellular amine metabolic processMyelin sheathTau protein binding
Regulation of glomerular filtrationCell bodyL amino acid transmembrane transporter activity
Negative regulation of muscle contractionExtracellular regionCaspase regulator activity
Cellular glucose homeostasisIonotropic glutamate receptor complexOxidoreductase activity
Table 10. Top 10 GO biological processes, cellular components, and molecular functions enriched from differentially expressed genes that are upregulated in MMC spinal cords compared to vehicle at E20. All GO pathways were >1.5-fold and p < 0.05.
GO Biological ProcessGO Cellular ComponentGO Molecular Function
Mechanical stimulus involved in sensory perception of painLytic vacuoleSodium channel activity
Antigen processing and presentation of antigen via MHC class IIExternal side of plasma membraneCytokine receptor binding
Cellular response to interferon-gammaMHC class II protein complexGTPase activity
Sodium ion transportIntegral to plasma membraneCytokine activity
Positive regulation of antigen processing and presentationVacuolar membraneSequence specific DNA binding
Regulation of cytokine production involved in immune responseNucleosomeSequence specific DNA binding transcription factor activity
Negative regulation of leukocyte activationCell surfaceLigand-gated ion channel activity
Regulation of T cell differentiation IntracellularHeme binding
Negative regulation of
protein complex assembly
Extracellular region partStructure specific DNA binding
Regulation of alpha-beta
T cell activation
Keratin filamentOxygen transporter activity
Table 11. Top 10 GO biological processes, cellular components, and molecular functions enriched from differentially expressed genes that are downregulated in MMC spinal cords compared to vehicle at E17. All GO pathways were >1.5-fold and p < 0.05.
GO Biological ProcessGO Cellular ComponentGO Molecular Function
Response to toxinIntegral to plasma membrane Carboxylic ester hydrolase activity
MyelinationExtracellular regionCarboxylic acid transmembrane transporter activity
Sterol transportCaveolaCytokine receptor binding
Regulation of symbiosisExtracellular spaceAmine transmembrane transporter activity
Negative regulation of neurogenesisExtracellular matrix partVoltage-gated ion channel activity
Regulation of cellular ketone metabolic processNeuronal cell bodySecondary active transmembrane transporter activity
Regulation of steroid metabolic processExtracellular matrixInorganic cation transmembrane transporter activity
Membrane organizationNuclear membrane Anion transmembrane transporter activity
Positive regulation of signal transduction Cytokine activity
Regulation of lipid transport
Publisher’s Note: MDPI stays neutral with regard to jurisdictional claims in published maps and institutional affiliations.

