Article

Determinants of Quality of Life after Stroke in Southern Portugal: A Cross Sectional Community-Based Study

by
Eva Lourenço
1,2,3,*,
Mário Rui dos Mártires Sampaio
3,4,
Hipólito Nzwalo
5,6,
Emília Isabel Costa
3,7 and
José Luis Sánchez Ramos
8
1
Doctoral School, Huelva University, 21001 Huelva, Spain
2
Intensive Care Unit, Algarve University Hospital Center, 8000 Faro, Portugal
3
Nursing Department, Algarve University, 8000 Faro, Portugal
4
Tavira Health Center, Algarve Health Administration, 8800 Tavira, Portugal
5
Faculty of Medicine and Biomedical Sciences, Algarve University, 8000 Faro, Portugal
6
Stroke Unit, Algarve University Hospital Center, 8000 Faro, Portugal
7
Health Sciences Research Unit: Nursing, 3000 Coimbra, Portugal
8
Nursing Department, Huelva University, 21001 Huelva, Spain
*
Author to whom correspondence should be addressed.
Brain Sci. 2021, 11(11), 1509; https://doi.org/10.3390/brainsci11111509
Submission received: 2 October 2021 / Revised: 3 November 2021 / Accepted: 11 November 2021 / Published: 14 November 2021

Abstract

:
Introduction: the perception of Quality of Life (QoL) has been used to evaluate the treatment and evolution of several pathologies. QoL evaluation allows a better understanding of the patient and his adaptation to the disease. An observational, community-based and descriptive correlational study was carried out to analyze stroke survivors’ perception of QoL. Methods: consecutive case-series of stroke survivors (≥3 months) followed in a single public primary health center (“Tavira Primary Health Centre”) from Algarve, southern Portugal. The Portuguese version of the World Health Organization Quality of life instrument was administered in 102 stroke survivors. Results: Perception of QoL was associated (p < 0.05) with specific sociodemographic (age, sex, marital status, academic training), economic (monthly family income) and clinical factors (number of vascular risk factors, type of stroke, evolution, chronic mRankin score). On multivariate analysis, chronic mRankin score on physical (R2 = 0.406; F = 8.757; p < 0.001), psychological (R2 = 0.286; F = 5.536; p < 0.001) and general domain (R2 = 0.357; F = 7.287; p < 0.001); and family income (R2 = 0.160; F = 3.156; p < 0.005) on environmental domain, emerged as predictors of QoL. Conclusion: Different socio-demographic, economic and health factors are associated with post-stroke QoL. Description of QoL contributes to the overall evaluation of the impact of stroke on health and should be a priority for health professionals.

Graphical Abstract

1. Introduction

Despite the decline of incidence and mortality rates [1], stroke remains a leading cause of morbidity worldwide [2]. Most studies addressing the health impact of stroke are based on short, long-term mortality and functional neurological outcome. However, even in patients without significant neurological disability, stroke can be associated with poor Quality of Life (QoL) [3,4,5,6]. QoL measurements are potentially more relevant and informative to patients than the evaluation of functional outcomes [7]. QoL evaluation may uncover insufficiently managed chronic health problems or facilitate a much broader description of stroke impact on survivors [8]. Worldwide, there are few studies addressing QoL among stroke survivors. These studies have identified factors such as functional status, depression, low socioeconomic status, or pain as the main determinants of QoL in stroke survivors [5,6,8,9,10,11]. Despite the extreme importance for patients and community, there are no community based published studies describing the QoL of stroke survivors in Portugal. Therefore, we sought to investigate which factors determine QoL of stroke survivors in a community representative population of Algarve, the southernmost part of Portugal.

2. Materials and Methods

2.1. Setting and Sample

A cross-sectional, descriptive study was carried out between February to September 2018 on consecutively presenting stroke survivors from a single public primary health care unit, the Tavira Health Centre in Tavira, Algarve. The centre serves a population of about 26,100 inhabitants [12]. Primary health care in Portugal is universally free and is the main place of regular patient follow-up for the majority of acute and chronic health conditions. The institutional electronic database was used to identify the patients meeting the following inclusion criteria: >18 years at the time of diagnosis; stroke diagnosed at least 3 months apart; followed at the Tavira Health Center. Patients were excluded in the presence of neurological deficits preventing effective communication and incomplete medical history. We used the World Health Organization (WHO) definition of stroke, “clinical syndrome of sudden onset of rapidly developing symptoms and signs of focal or global cerebral deficit with symptom lasting more than 24 h or leading to death with no apparent cause other than vascular origin” [13] confirmed by imaging.
The following variables were extracted from the electronic database: age, gender, marital status, formal education, employment status, income, existence of a caregiver, cardiovascular risk factors (hypertension, smoking, type 2 diabetes, sedentary lifestyle, obstructive apnea syndrome (OSAS), type 1 diabetes, alcoholism, atrial fibrillation, ischemic heart disease, dyslipidemia, obesity, hyperuricemia), functional neurological status (modified Rankin Scale or mRankin) [14]; stroke classification (“Oxfordshire Community Stroke Project” [15]-OCSP), previous medication and clinical evolution/sequelae and admission through “Vía Verde” or stroke code (a set of procedures aiming to rapidly provide acute reperfusion treatments in patients with stroke).

2.2. Health-Related Quality of Life

Health related Quality of life (HRQoL) is a multidimensional medical study questionnaire developed by WHO. The WHOQoL-BREF (abbreviated) version 2.0 has 26 questions and was translated and validated to Portuguese language [16,17]. These 26 questions access the individual’s perceptions of their health and well-being over the previous two weeks. Responses to questions are on a 1-5 Likert scale where 1 represents “disagree” or “not at all” and 5 represents “completely agree” or “extremely”. Every six questions cover one of four domains: Physical, Psychological, Social, Environment. Two questions access a General domain. The WHOQoL-BREF questionnaire takes about 15 minutes to complete and was administered in a face-to-face interview.

2.3. Statistical Analysis

For descriptive and inferential statistics Statistical Package for the Social Sciences (SPSS), version 21.0, was used. Continuous variables were expressed as mean and standard deviation, and categorical variables were expressed as percentages. Linear association between quantitative variables was evaluated by Pearson correlation coefficient. Spearman correlation coefficient was used in case variables did not present normality and for ordinal variables. T test was applied to variables with normal distribution, in order to determine whether the results were statistically different. Non-parametric tests, such as the Mann–Whitney test (2 independent samples) and the Kruskal–Wallis test (>2 independent samples) were applied when one of the variables had less than 30 individuals or did not present normal distribution. For each domain of the WHOQoL-BREF logistic, regression analysis was used to identify predictors associated with the QoL of stroke survivors. The statistical significance of all tests was set as p < 0.05 by 2-tailed tests. The Algarve Regional Research Ethics Committee approved the study in accordance with the Helsinki Declaration of 1983 (CES 34/2018). All subjects provided informed consent.

3. Results

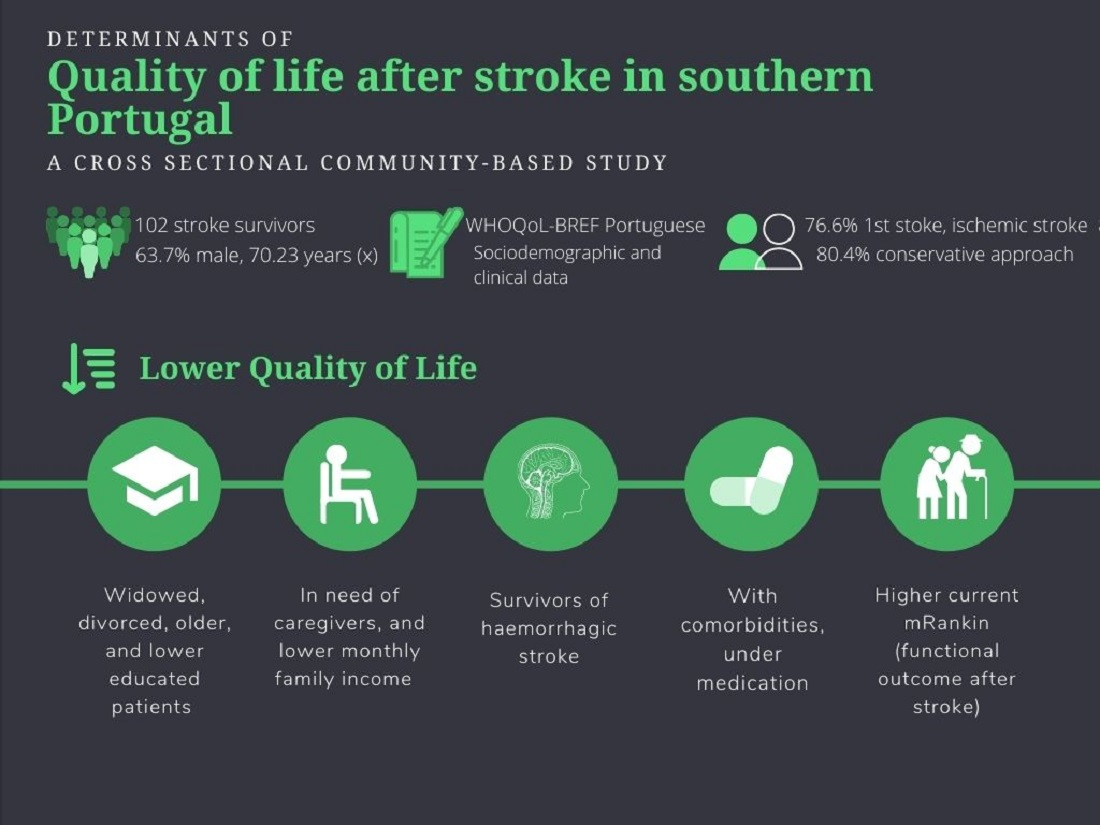
Of the 120 persons who met the inclusion criteria and could be located, 102 (85.8%) agreed to participate and completed the questionnaire. Table 1 and Table 2 resume, respectively, the sociodemographic and clinical characteristics of the patients included in the study. Table 1 shows that the majority (65/63.7%) were men and the mean age at the diagnosis of stroke was 67.7 years old (SD: 12.3). The mean time between the stroke event and the questionnaire was 29.52 months (SD: 32). Most of the patients were married (65/63.7%), had four years of schooling (55/53.9%), were retired (69/67.6%) and had an income lower than 580 euros (47/46.1%).
Ischemic stroke was the most common type (87/86.4%). The most prevalent risk factors at the time of the vascular event were hypertension (85/82.5%), dyslipidemia (61/59.2%) and sedentary lifestyle (51/49.5%). The proportion of stroke survivors with any functional neurological dependency was 10 (9.9%), 72 (69.5%) and 63 (61.6%), before stroke, immediately after stroke and at the time of the questionnaire (from December 2018 to June 2019), respectively (Table 2). The majority of patients had a single stroke (78/76.6%); 82 patients (80.4%) did not receive any acute reperfusion treatment; only 29 patients had a positive clinical evolution without neurological sequelae.
Table 3 and Table 4 resume the analysis of the association between specific domains of the HRQoL with different sociodemographic and clinical variables, respectively.
Higher age at the time of stroke onset was negatively correlated with the physical (p < 0.01) and social (p < 0.05) dimensions of the HRQoL. Divorced survivors had higher average scores on physical, psychological, social, and general dimensions than married (p < 0.05) or widowed survivors (p < 0.01). Survivors with more years of school (p < 0.01) and higher family income (p < 0.05) had higher perception in all dimensions of the HRQoL. On the contrary, retired survivors (p < 0.05) and those with current need of caregivers (p < 0.01) had worse perception in multidomain of the HRQoL (Table 3).
Survivors who were taking medication or with comorbidities had worse perception of HRQoL in the physical, psychological, social, and general domains (p < 0.01) (Table 4). In comparison to ischemic stroke survivors, patients who suffered a hemorrhagic stroke had worse perception in almost all dimensions of the HRQoL (p < 0.01).
On multivariate analysis (Table 5, Table 6, Table 7 and Table 8) chronic mRS was the only predictor found for the physical domain (R2 = 0.406; F = 8.757; p < 0.001), the psychological domain (R2 = 0.286; F = 5.536; p < 0.001) and the general domain (R2 = 0.357; F = 7.287; p < 0.001). Chronic mRS explained 40.6%, 28.6% and 35.7% of the variance, respectively. For the environmental domain, monthly family income emerged as a predictor, explaining 6% of the variance (R2 = 0.160; F = 3.156; p < 0.005).

4. Discussion

This is the first community-based study describing the QoL of stroke survivors in our country. The study demonstrated that in stroke survivors, several sociodemographic factors (being older, widow, less educated), economic factors (lower monthly family income) and clinical factors (hemorrhagic stroke type, comorbidities, high chronic mRankin score) are associated with reduced perception of QoL in different dimensions. These findings are similar to those reported in previous studies [5,6,8,9,10,11]. A large proportion of stroke survivors have poor perception of their QoL and probably face unmet long-term needs [6]. Sociodemographic, economic and health factors have been shown to influence the QoL of stroke survivors [18,19,20]. The relatively young age at the time of stroke, as well at the time of QoL evaluation, further emphasizes the potential for long-term impact and great repercussions to the survivors and consequently for the society [19,20]. QoL is very complex and dependent on several factors. For instance, in our study we have demonstrated that widowed survivors have poor QoL. However, widowed patients are generally older, at greater risk of functional decline and poor social support. In addition, the grieving process, per se, negatively impacts various aspects of physical and mental health that can lead to a decrease in the perception of QoL [19,20,21].
Indeed, among older patients and in patients with lower education, reduced HRQoL has been shown to be multifactorial [6,11]. Compliance with post-stroke management including rehabilitation, control of vascular risk factors; access to supporting networks within or outside the family helps improve the perception of QoL [8]. Low education and income influence the ability to control cardiovascular risk factors and the treatment of stroke, due to the difficulty in implementing preventive measures and problems in accessing information, treatment, and rehabilitation services [11]. Patients may encounter financial barriers to accessing high cost treatments, resulting in a cycle of health degradation and worse perception of QoL [6]. Additionally, the effort to put in place specific prevention strategies, including restrictive diets, adoption of healthy behaviors, and chronic use of medications—which are sometimes very expensive—can further cause low perception of QoL [6,8].
In our study, only chronic mRankin and income emerged as a predictor of poorer QoL. The mRankin scale is used to evaluate the functional neurological outcome after stroke and is one of the most widely used scales [11,22]. Therefore, it is expected that a higher mRankin score or higher dependency would be associated with a lower perception of QoL. Others have also demonstrated that patients with worse functional outcomes or more severe strokes have poor perception on some specific domains of HRQoL such as physical, psychological, and general health. These domains are highly associated with autonomy or dependence on their caregivers [8,22]. Improvement of post-stroke QoL demands an integrated view of each patient. Management of specific social or health problems, for instance, spasticity, can have a large impact in multiple domains of QoL [23].
The percentage of ischemic stroke versus haemorrhagic stroke is similar to that described in the medical literature, where it is reported that around 85–90% of all strokes are ischemic and the remaining are haemorrhagic strokes [24]. Despite that, haemorrhagic stroke is often more deadly than ischemic stroke. The justification may be related to the pathophysiology of the stroke itself, which may lead to a lower response of deficits to rehabilitation, more sequelae, greater dependence, and dysfunction, and consequently a worse perception of QoL [8,9,24].
There are several limitations to be considered. Depression, a major contributor for HQoL [3,16,18] was not specifically evaluated. The inclusion of mental health in the HRQoL partially attenuates this limitation. There is no consensus on when to evaluate the QoL of post-stroke patients. We evaluated patients with different post-stroke follow-up durations, which may have reduced the possibility of identifying meaningful differences. Nevertheless, in some studies, on the long-term follow-up no significant changes occurred in perception of QoL in stroke survivors [9,21]. Finally, the number of participants was small, preventing a more detailed and robust statistical analysis.

5. Conclusions

Stroke long term health impact constitutes an important problem for survivors, relatives, caregivers, and society. Measuring HRQoL in post-stroke patients represents an important contribution to the better understanding of the overall health status of stroke survivors and should be prioritized for health professionals [5].
Our study showed that the patient’s subjective wellbeing is influenced by social, economic and health factors. Further studies, with larger samples, are needed in order to analyse the relationship between QoL and different clinical and socio-economic factors.

Author Contributions

Conceptualization, methodology and analysis—E.L., M.R.d.M.S., H.N., E.I.C. and J.L.S.R.; writing—original draft preparation—E.L., M.R.d.M.S.; writing—review—E.L., H.N., E.I.C., J.L.S.R. All authors have read and agreed to the published version of the manuscript.

Funding

This research received no external funding.

Institutional Review Board Statement

The study was conducted according to the guidelines of the Declaration of Helsinki, and approved by the Ethics Committee of Algarve Health Administration (CES 34/2018).

Informed Consent Statement

Informed consent was obtained from all subjects involved in the study.

Data Availability Statement

Authors agree to make data and materials supporting the results or analyses presented in their paper available upon reasonable request.

Conflicts of Interest

The authors declare no conflict of interest.

References

  1. Feigin, V.L.; Norrving, B.; Mensah, G.A. Global Burden of Stroke. Circ. Res. 2017, 120, 439–448. [Google Scholar] [CrossRef] [PubMed]
  2. Vos, T.; Abajobir, A.A.; Abate, K.H.; Abbafati, C.; Abbas, K.M.; Abd-Allah, F.; Abdulkader, R.S.; Abdulle, A.M.; Abebo, T.A.; Abera, S.F.; et al. Global, regional, and national incidence, prevalence, and years lived with disability for 328 diseases and injuries for 195 countries, 1990–2016: A systematic analysis for the Global Burden of Disease Study 2016. Lancet 2017, 390, 1211–1259. [Google Scholar] [CrossRef] [Green Version]
  3. Jaracz, K.; Jaracz, J.; Kozubski, W.; Rybakowski, J.K. Post-stroke quality of life and depression. Acta Neuropsychiatr. 2002, 14, 219–225. [Google Scholar] [CrossRef]
  4. Lai, S.M.; Studenski, S.; Duncan, P.; Perera, S. Persisting consequences of stroke measured by the stroke impact scale. Stroke 2002, 33, 1840–1844. [Google Scholar] [CrossRef] [Green Version]
  5. Bergstrom, A.L.; Eriksson, G.; Von Koch, L.; Tham, K. Combined life satisfaction of persons with stroke and their caregivers: Associations with caregiver burden and the impact of stroke. Heal. Qual. Life Outcomes 2011, 9, 1–10. [Google Scholar] [CrossRef] [Green Version]
  6. Pedersen, S.G.; Friborg, O.; Heiberg, G.A.; Arntzen, C.; Stabel, H.H.; Thrane, G.; Nielsen, J.F.; Anke, A. Stroke-Specific Quality of Life one-year post- stroke in two Scandinavian country-regions with different organisation of rehabilitation services: A prospective study. Disabil. Rehabil. 2020, 1, 1–11. [Google Scholar] [CrossRef]
  7. Guyatt, G.H.; Feeny, D.H.; Patrick, D.L. Measuring health-related quality of life. Ann. Intern. Med. 1993, 118, 622–629. [Google Scholar] [CrossRef] [PubMed]
  8. Carod-Artal, J.; Egido, J.A.; González, J.L.; Varela de Seijas, E. Quality of life among stroke survivors evaluated 1 year after stroke: Experience of a stroke unit. Stroke 2000, 31, 2995–3000. [Google Scholar] [CrossRef] [PubMed] [Green Version]
  9. Choi-Kwon, S.; Choi, J.M.; Kwon, S.U.; Kang, D.-W.; Kim, J.S. Factors that Affect the Quality of Life at 3 Years Post-Stroke. J. Clin. Neurol. 2006, 2, 34. [Google Scholar] [CrossRef] [Green Version]
  10. Abubakar, S.A.; Isezuo, S.A. Health related quality of life of stroke survivors: Experience of a stroke unit. Int. J. Biomed. Sci. IJBS 2012, 8, 183–187. [Google Scholar] [PubMed]
  11. Mahesh, P.K.B.; Gunathunga, M.W.; Jayasinghe, S.; Arnold, S.M.; Liyanage, S.N. Factors influencing pre-stroke and post-stroke quality of life among stroke survivors in a lower middle-income country. Neurol. Sci. 2017, 39, 287–295. [Google Scholar] [CrossRef]
  12. INE. Censos 2011 Resultados Definitivos–Região Algarve; Instituto Nacional de Estatística: Lisboa, Portugal, 2012; p. 96. ISBN 978-989-25-0183-3. ISSN 0872-6493. [Google Scholar]
  13. WHO MONICA Project Investigators. The World Health Organization MONICA Project (Monitoring trends and determinants in cardiovascular disease). J. Clin. Epidemiol. 1988, 41, 105–114. [Google Scholar] [CrossRef]
  14. Quinn, T.J.; Dawson, J.; Walters, M.R.; Lees, K.R. Reliability of the modified Rankin Scale: A systematic review. Stroke 2009, 40, 3393–3395. [Google Scholar] [CrossRef] [PubMed] [Green Version]
  15. Smith, C.J.; Emsley, H.C.; Libetta, C.M.; Hughes, D.G.; Drennan, R.F.; Vail, A.; Tyrrell, P. The Oxfordshire Community Stroke Project classification in the early hours of ischemic stroke and relation to infarct site and size on cranial computed tomography. J. Stroke Cerebrovasc. Dis. 2001, 10, 205–209. [Google Scholar] [CrossRef]
  16. Lima, R.C.M.; Teixeira-Salmela, L.F.; Magalhaes, L.C.; Gomes-Neto, M. Psychometric properties of the Brazilian version of the Stroke Specifi c Quality of Life Scale: Application of the Rasch model. Braz. J. Phys. Ther. 2008, 12, 149–156. [Google Scholar]
  17. Canavarro, M.C.; Pereira, M.; Moreira, H.; Paredes, T. Qualidade de Vida e Saúde: Aplicações do WHOQOL; Alicerces: Sao Paulo, Brazil, 2010; Volume 3, pp. 243–268. [Google Scholar]
  18. Chen, T.; Zhang, B.; Deng, Y.; Fan, J.-C.; Zhang, L.; Song, F. Long-term unmet needs after stroke: Systematic review of evidence from survey studies. BMJ Open 2019, 9, e028137. [Google Scholar] [CrossRef]
  19. Viitanen, M.; Fugl-Meyer, K.S.; Bernspång, B.; Fugl-Meyer, A.R. Life satisfaction in long-term survivors after stroke. Scand. J. Rehabil. Med. 1988, 20, 17–24. [Google Scholar]
  20. King, R. Quality of life after stroke. Stroke 1996, 27, 1467–1472. [Google Scholar] [CrossRef]
  21. Hackett, M.L.; Duncan, J.R.; Anderson, C.S.; Broad, J.B.; Bonita, R. Health-related quality of life among long term survivors of stroke: Results from the Auckland Stroke Study, 1991–1992. Stroke 2000, 31, 440–447. [Google Scholar] [CrossRef] [Green Version]
  22. Drummond, A.E.R. Stroke: The Impact on the Family. Br. J. Occup. Ther. 1988, 51, 193–194. [Google Scholar] [CrossRef]
  23. Turcu-Stiolica, A.; Subtirelu, M.S.; Bumbea, A.M. Can Incobotulinumtoxin-A Treatment Improve Quality of Life Better Than Conventional Therapy in Spastic Muscle Post-Stroke Patients? Results from a Pilot Study from a Single Center. Brain Sci. 2021, 11, 934. [Google Scholar] [CrossRef] [PubMed]
  24. Unnithan, A.K.A.; Mehta, P. Hemorrhagic Stroke. In StatPearls; StatPearls Publishing: Treasure Island, FL, USA, 2021. [Google Scholar] [PubMed]
Table 1. Sociodemographic characteristics of the stroke survivors (n = 102).
Sociodemographic CharacteristicsAverageSD
Gender
Age
Current age70.23 12.6
Age at stroke onset67.75 12.3
Difference (months)29.52 32
N%
Gender
Male6563.7
Female3736.3
Marital status
Single65.9
Married/Unmarried couple6563.7
Widowed2120.6
Divorced/Separate109.8
Formal education
Can’t read or write87.8
Never went to school, but knows how to read and write1211.8
4 years5553.9
6 years11
9 years1211.8
12 years87.8
Bachelor/Degree65.9
Employment status
Employed1817.6
Unemployed32.9
Sick leave1211.8
Retired6967.6
Family income
Less minimal wage4746.1
Between 1 and 2 minimal wages4241.2
3 or more minimal wages1312.7
Existence of caregiver?
Yes51(50)
No51(50)
Table 2. Clinical characteristics of the stroke survivors (n = 102).
Cardiovascular Risk FactorN%
Hypertension8582.5
Smoking1615.5
Sedentary lifestyle5149.5
Type 2 Diabetes Mellitus3231.1
Type 1 Diabetes Mellitus54.9
Alcoholism2221.4
Atrial fibrillation2423.3
Ischemic heart disease21.9
Dyslipidemia6159.2
Obesity15 14.6
Stress11
Hyperuricemia1817.5
Admission using “Vía Verde” or stroke code1514.7
Neurological Syndrome (OCSP)
PACI4342.2
TACI87.8
LACI2726.5
POCI98.8
Not specified11
Hemorrhagic stroke1413.7
mRankin ScaleBefore strokeHospital dischargeChronic *
N%N%N%
No symptoms92 90.230 29.43938.2
No significant disability7 6.912 11.81615.7
Slight disability1 117 15.71918.6
Moderate disability2216 15.71211.8
Moderate severe disability 23 22.51312.7
Severe disability 43.932.9
Number of strokesN%
1st episode78 76.6
2nd episode1716.7
3rd or more episodes76.9
Treatment
Fibrinolysis1110.8
Conservative8280.4
Surgery22
Stent angioplasty43.9
Thrombectomy32.9
Clinical evolution
Positive without sequelae2928.4
Negative with sequelae7371.6
OCSP—Oxfordshire Community Stroke Project; TACI—total anterior circulation infarcts; PACI—partial anterior circulation infarcts; LACI—lacunar circulation infarcts; POCI—posterior circulation infarcts; * mRankin Scale at the time of the questionnaire application.
Table 3. Association between HRQoL domains and sociodemographic variables (n = 102).
VariableGeneralPhysical PsychologicalSocialEnvironmental
Current age R = −0.262 R = −0.247
p = 0.0081p = 0.0121
Civil StatusH = 12.891H = 13.141H = 17.099 H = 14.505
d.f. = 3d.f. = 3d.f. = 3d.f. = 3
p = 0.0052p = 0.0042p = 0.0012p = 0.0022
Formal educationRho = 0.261 Rho = 0.368 Rho = 0.337 Rho = 0.354 Rho = 0.272
p = 0.0083p = 0.0013p = 0.0013p = 0.0013p = 0.0013
Family incomeRho = 0.272Rho = 0.205 Rho = 0.261Rho = 0.396Rho = 0.272
p = 0.0063p = 0.0383p = 0.0083p = 0.0013p = 0.0063
Retiredt = −2.147t = −3.340 t = −2.652 t = −3.823
d.f. = 101 d.f. = 101 d.f. = 101 d.f. = 101
p = 0.0344p = 0.0014p = 0.0094p = 0.0014
Existence of a caregivert = −5.816 t = −6.890 t = −5.176 t = −3.192
d.f. = 101 d.f. = 101 d.f. = 101 d.f. = 101
p = 0.0014p = 0.0014p = 0.0014p = 0.0024
R: Pearson correlation; H: Kruskal–Wallis test; t-Student test; Rho: Spearmann correlation.
Table 4. Association between HRQoL domains of the and clinical variables (n = 102).
VariableGeneralPhysical PsychologicalSocialEnvironmental
Nº vascular risk factors R = −0.209
p = 0.0341
No medicationU = 476.5U = 426.5U = 290.5U = 439.5
p = 0.0062p = 0.0022p < 0.0012p = 0.0022
Without sequelaeU = 416.5 U = 504.0
p = 0.0052p = 0.0402
Discharge mRankinRho = −0.487Rho = −0.458Rho = −0.402Rho = −0.285
p = 0.0013p = 0.0013p = 0.0013p = 0.0033
Chronic mRankinRho = −0.622Rho = −0.629Rho = −0.550Rho = −0.314
p = 0.0013p = 0.0013p = 0.0013p = 0.0013
Haemorrhagic strokeU = 259.5U = 324.5U = 303.5
p = 0.0012p = 0.0042p = 0.0022
Clinical evolutiont = 6.133t = 5.571t = 5.472t = 4.686t = 2.679
d.f. = 101d.f. = 101d.f. = 101 d.f. = 101 d.f. = 101
p = 0.0014p = 0.0014p = 0.0014p = 0.0014p = 0.0094
R: Pearson correlation; U: Mann–Whitney test; t-Student test; Rho: Spearmann correlation.
Table 5. Multivariate analysis for Physical domain.
Physical DomainUnstandardized CoefficientsStandardized CoefficientstSig.95% Conf. Int.
BStd. ErrorBeta
(Constant)70.56611.164 6.3210.00048.39692.736
Current age4.9543.6363.3461.3630.176−2.26612.174
Disease age−5.0543.640−3.330−1.3880.168−12.2832.175
Difference (months)−0.4450.316−0.761−1.4060.163−1.0730.184
Sex−2.3413.115−0.061−.7510.454−8.5273.846
Family income3.1442.2250.1171.4130.161−1.2747.562
Number of Cardiovascular Risk Factors−1.1751.084−0.088−1.0850.281−3.3270.977
Previous mRankin2.2163.0030.0610.7380.463−3.7488.180
Discharge mRankin0.8021.5410.0710.5200.604−2.2593.863
Chronic mRankin−7.7611.674−0.645−4.6370.000−11.084−4.438
Table 6. Multivariate analysis for Psychological domain.
Psychological DomainUnstandardized CoefficientsStandardized CoefficientstSig.95% Conf. Int.
BStd. ErrorBeta
(Constant)72.72912.245 5.9400.00048.41497.045
Current age3.8903.9882-6270.9750.332−4.02911.809
Disease age−3.8363.993−2.528−0.9610.339−11.7654.093
Difference (months)−0.3680.347−0.630−1.0620.291−1.0570.320
Sex−5.8493.417−0.152−1.7120.090−12.6340.936
Family income0.6012.4400.0220.2460.806−4.2445.447
Number of Cardiovascular Risk Factors−0.6061.189−0.045−0.5100.611−2.9661.754
Previous mRankin −1.3163.294−0.036−0.3990.690−7.8575.225
Discharge mRankin 0.8661.6910.0770.5120.610−2.4914.223
Chronic mRankin −7.1751.836−0.597−3.9090.000−10.820−3.530
Table 7. Multivariate analysis for General domain.
General DomainUnstandardized CoefficientsStandardized CoefficientstSig.95% Conf. Int.
BStd. ErrorBeta
(Constant)65.02014.949 4-3500.00035.33494.705
Current age2.5504.8681.3390.5240.602−7.11812.217
Disease age−2.4454.874−1.253−0.5020.617−12.1257.234
Difference (months)−0.1710.423−0.227−0.4040.687−1.0120.670
Sex−3.7884.172−0.076−0.9080.366−12.0724.496
Family income−2.1222.979−0.061−0.7120.478−8.0383.794
Number of Cardiovascular Risk Factors−0.7411.451−0.043−0.5110.611−3.6222.141
Previous mRankin1.3094.0210.0280.3250.746−6.6779.294
Discharge mRankin0.9352.0640.0650.4530.652−3.1635.034
Chronic mRankin−11.1082.241−0.718−4.9570.000−15.558−6.658
Table 8. Multivariate analysis for Environmental domain.
Environmental DomainUnstandardized CoefficientsStandardized CoefficientstSig.95% Conf. Int.
BStd. ErrorBeta
(Constant)50.1669.844 5.0960.00030.61869.713
Current age−0.3053.206−0.278−0.0950.924−6.6716.061
Disease age0.2463.2100.2190.0770.939−6.1286.620
Difference (months)0.1280.2790.2960.4590.647−0.4260.682
Sex1.4352.7470.0500.5220.603−4.0206.890
Family income7.3931.9620.3713.7690.0003.49711.288
Number of Cardiovascular Risk Factors0.8020.9550.0810.8390.403−1.0962.699
Previous mRankin−2.4662.648−0.092−0.9310.354−7.7252.792
Discharge mRankin−1.0021.359−0.121−0.7370.463−3.7011.697
Chronic mRankin−0.4201.476−0.047−0.2850.777−3.3502.510
Publisher’s Note: MDPI stays neutral with regard to jurisdictional claims in published maps and institutional affiliations.

