
Deep Learning Approach for Screening Autism Spectrum Disorder in Children with Facial Images and Analysis of Ethnoracial Factors in Model Development and Application


Abstract
:1. Introduction
- The subjectiveness in diagnosis: ASD is currently diagnosed by behavioral observation, and thus, only experienced clinicians can reliably diagnose ASD for children around 2 years old, with the mean age for diagnosis being 4–5 years [6].
- Many families do not have access to experts/specialists, and the accessibility is even lower in underserved communities.
- Lack of awareness and screening is also a problem, particularly in rural regions.
- Additionally, children of racial and ethnic minority backgrounds who meet the criteria for ASD are less likely than White children to be diagnosed overall: they are more likely to be misdiagnosed.
2. Materials and Methods
2.1. Datasets
2.1.1. East Asia ASD Children Facial Image Dataset (East Asian Dataset)
2.1.2. Kaggle Autism Facial Dataset (Kaggle Dataset): The Only Publicly Available ASD Facial Image Dataset
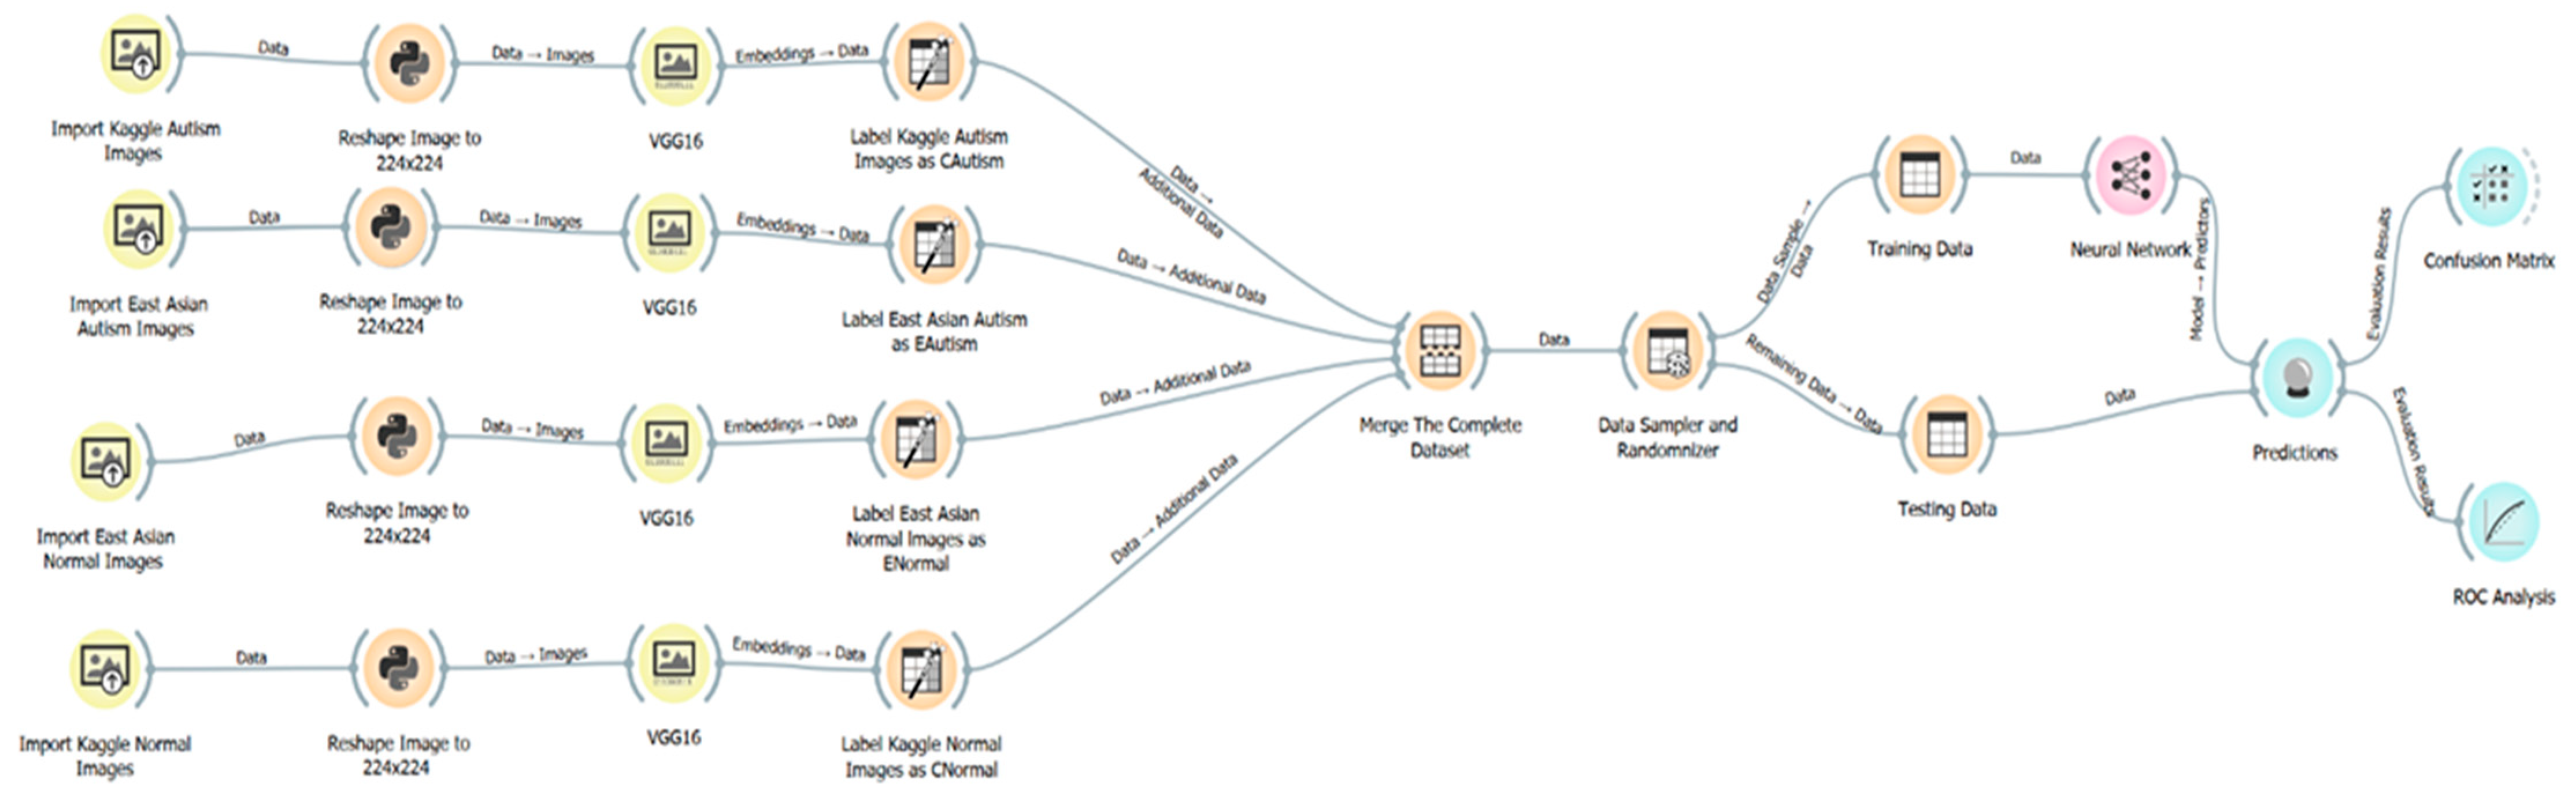
2.2. Method
- The feasibility and quality of applying deep learning in the detection of ASD in children using 2D facial images
- Understanding the significance of race factors in ASD detection or diagnosis using deep learning and facial images
- CA = (TP + TN)/(TP + FN + FP + TN)
- PRECISION = (TP)/(TP + FP)
- RECALL = (TP)/(TP + FN)
- F1-SCORE = 2 * (PRECISION * RECALL)/PRECISION + RECALL)
2.2.1. Feasibility and Classification Accuracy Study of Applying Deep Learning to Detect ASD in Children Using 2D Facial Images
2.2.2. Classification Improvement with Tensorflow/VGGFace
2.2.3. Understanding the Significant Impact of Race Factors on Deep-Learning-Based ASD Detection with Facial Images
3. Results
3.1. Evaluation of Deep-Learning Solution Viability and Accuracy with the East Asian Dataset
3.1.1. Results for Section 2.2.1
3.1.2. Improved Classification Results from the Fine-Tuned Tensorflow/VGGFace-Based Deep-Learning Model with the East Asian Dataset
3.2. Evaluation of the Results from Racial Factor Related Experiments Described in Section 2.2.3
3.2.1. Evaluation of the Results of Exp-1, Exp-2, and Exp-3 in Section 2.2.3
3.2.2. Evaluation of the Results from Exp-4 with Race Group Labeling
4. Discussion
4.1. Regarding Race Factors in Facial Image Based Diagnostic Solutions including ASD Detection
4.1.1. Understanding the Anthropometrics within the Context of Diagnosis Based on Facial Phenotype Distinctions
4.1.2. Findings from the Experiments Regarding the Race Impact on Deep-Learning- Based ASD Screening with Facial Images
- The neural network deep-learning model trained with the East Asian dataset achieved an F1-score of 0.928 and CA of 92.8% with the Orange platform.
- We achieved a high F1-score of 0.95 and a CA of 95% with the Tensorflow/VGGFace-based deep learning model on the East Asian dataset (see Table A1 for architecture). The results suggest that it is viable to use deep learning solutions for high-accuracy ASD screening.
- Due to the race factor impact in the Kaggle dataset, the model trained with the Kaggle dataset generated 75% and 86.7% FP rates for Black and East Asian test images, respectively.
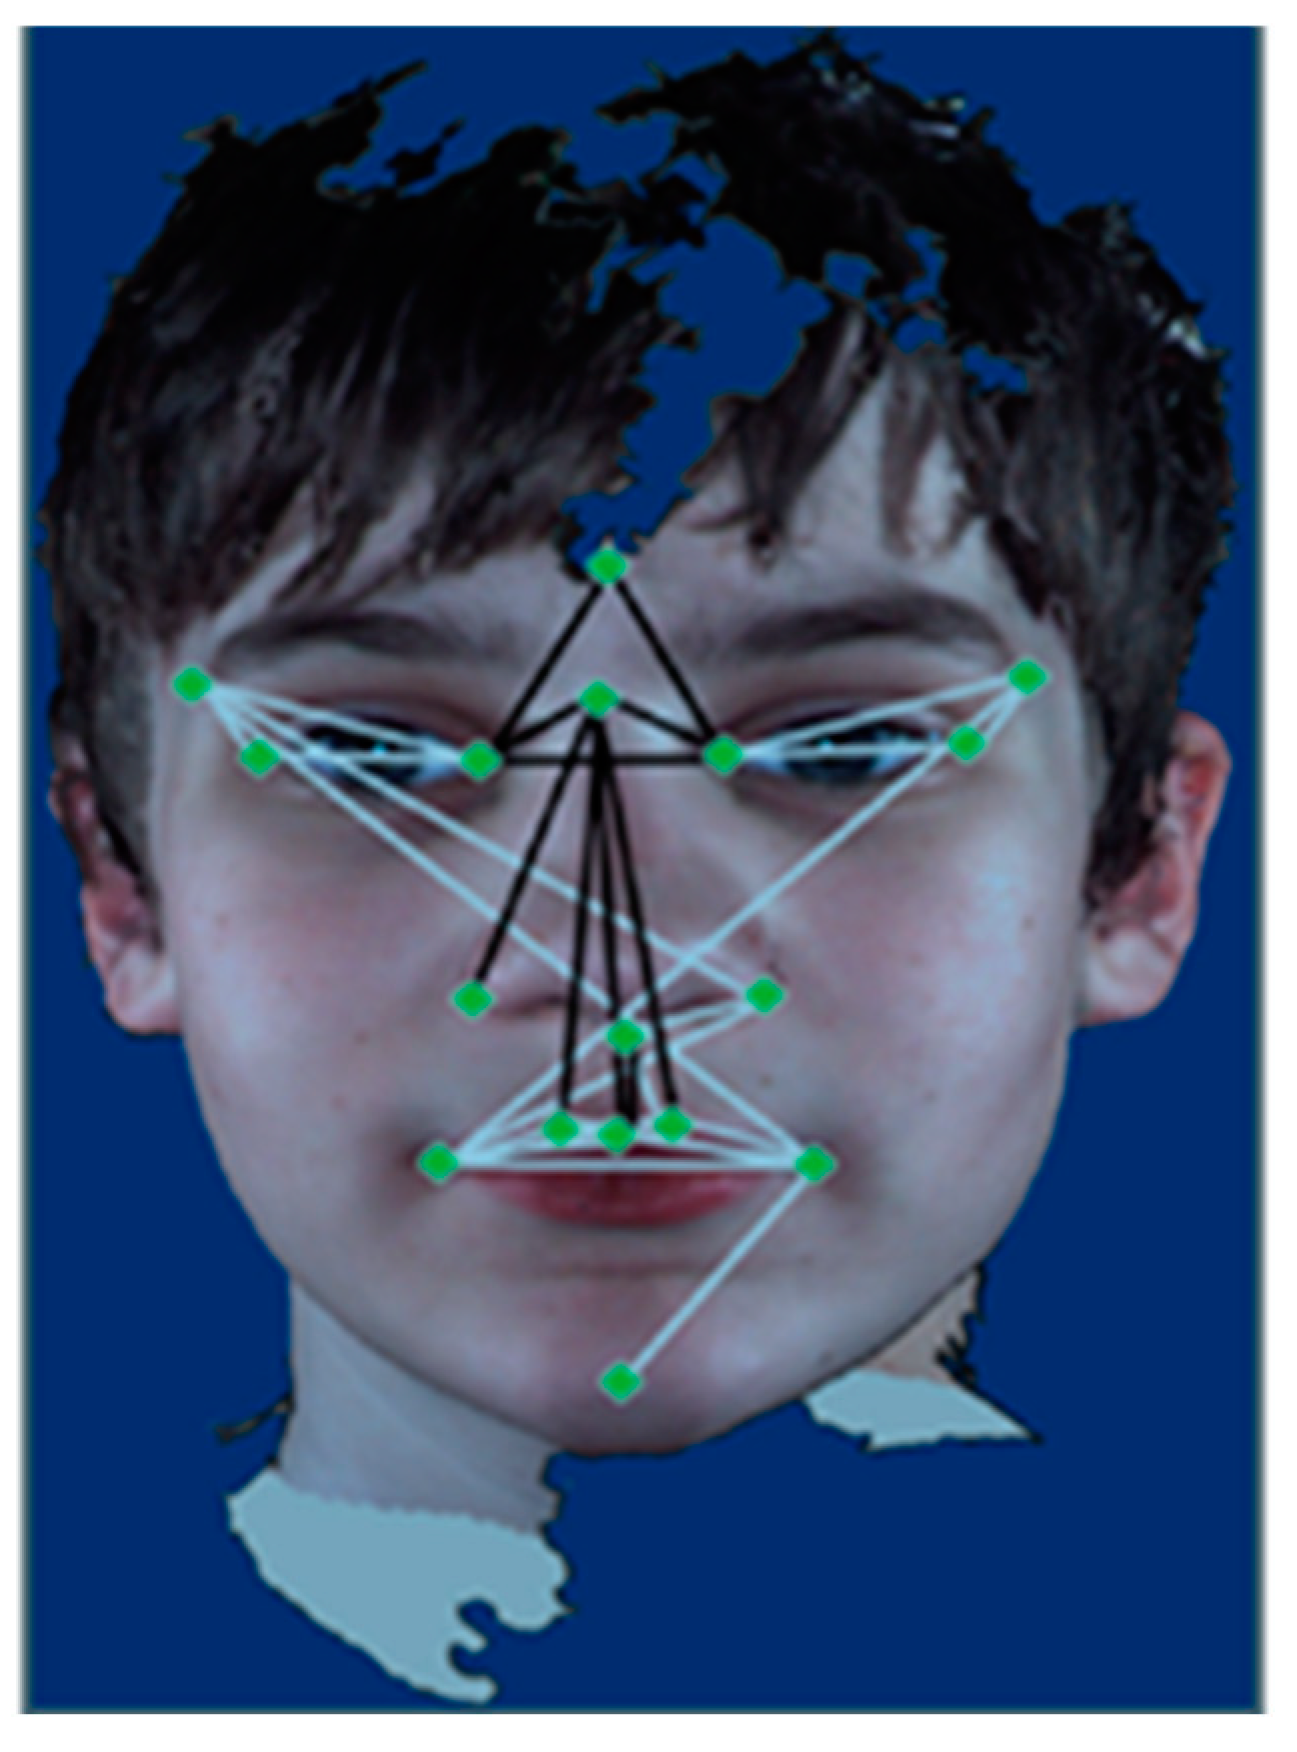
- When combining the Kaggle and East Asian datasets for training, which effectively increased the training images for East Asian children, we observed an improved FP rate for the East Asian test dataset, from 86.7% to 23.9%. However, compared with the 6.67% FP rate from the model trained and tested with the East Asian dataset, the single-race dataset indicated in Table 4 and Table 11, the 23.9% FP rate was still much worse, although each experiment had almost an equal number of training images for East Asian children. We think that this result is due to anthropometric differences amongst different races, for example, Whites vs. East Asians. It is possible that one race’s normal facial anthropometric measurements can fall into another race’s abnormal facial anthropometric measurements or vice versa, resulting in mistaken classifications, as in the cases shown in Table 13 and Table 14, where normal East Asian images labeled as ENormal were misclassified as CAutism. The comparison in Figure 9 and the anthropometry in Table 16, e.g., ex-ex/en-en lengths [34], indicates the possibility of one race’s facial anthropometric changes due to ASD falling into another race’s normal ranges, or vice versa. The analysis of Table 13 and Table 14 from the Exp-4 results confirms that this occurred when we added the labels to the combined dataset with race group information.
4.2. Brief Discussion of Video-Based Deep-Learning Approach and 2D Facial Image-Based Approach
4.3. Recommendations
5. Conclusions
Author Contributions
Funding
Institutional Review Board Statement
Informed Consent Statement
Data Availability Statement
Conflicts of Interest
Appendix A

| Layers (Type) | Output Shape |
|---|---|
| input | 224, 224, 1 |
| ConV_1 × 2 | 224, 224, 64 |
| Pool1 | 112, 112, 64 |
| ConV_2 × 2 | 112, 112, 128 |
| Pool2 | 56, 56, 128 |
| ConV_3 × 3 | 56, 56, 256 |
| Pool3 | 28, 28, 256 |
| ConV_4 × 3 | 28, 28, 512 |
| Pool4 | 14, 14, 512 |
| ConV_5 × 3 | 14, 14, 512 |
| Pool5 | 7, 7, 512 |
| flatten | 25088 |
| Fc6 (Dense)/fc6 reLU | 4096 |
| Fc7(Dense) | 4096 |
| dense (Dense) | 100 |
| Dropout | 100 |
| dense_1 (Dense) | 100 |
| classifier (Dense) | 2 |
| Confusion Matrix (Trained with the Combined (Cleaned) Kaggle and East Asia Datasets and Tested with East Asian Test Dataset | ||||
|---|---|---|---|---|
| Predicted | ||||
| Autism | Normal | Σ | ||
| Actual | Autism | 101 | 19 | 120 |
| Normal | 22 | 103 | 125 | |
| Σ | 121 | 122 | 245 | |
| Confusion Matrix: Model trained with Kaggle and East Asia Datasets Combined with 4 Target Classes as in Table 13. The Cleaned Kaggle Dataset Only Contains White Children. | ||||||
|---|---|---|---|---|---|---|
| Predicted | ||||||
| CNormal | Enormal | EAutism | CAutism | Σ | ||
| Actual | CNormal | 168 | 5 | 1 | 48 | 222 |
| ENormal | 2 | 102 | 9 | 9 | 122 | |
| EAutism | 0 | 7 | 105 | 6 | 118 | |
| CAutism | 44 | 10 | 5 | 115 | 174 | |
| Σ | 214 | 124 | 120 | 293 | 636 | |
| Image Name | Label | Mis-Classified as | Prediction Probabilities for Each Target | |||
|---|---|---|---|---|---|---|
| CNormal | ENormal | EAutism | CAutism | |||
| N756 | ENormal | CAutism | 0.48 | 0.01 | 0.01 | 0.51 |
| N510 | ENormal | CAutism | 0.00 | 0.03 | 0.01 | 0.96 |
| N187 | ENormal | CAutism | 0.00 | 0.45 | 0.00 | 0.54 |
| N476 | ENormal | CAutism | 0.00 | 0.00 | 0.00 | 1.00 |
| N279 | ENormal | CAutism | 0.10 | 0.38 | 0.00 | 0.52 |
| N686 | ENormal | CAutism | 0.07 | 0.00 | 0.00 | 0.93 |
| N495 | ENormal | CAutism | 0.27 | 0.00 | 0.00 | 0.73 |
| N316 | ENormal | CAutism | 0.00 | 0.02 | 0.00 | 0.98 |
| N689 | ENormal | CNormal | 0.47 | 0.23 | 0.00 | 0.30 |
| N317 | ENormal | CNormal | 0.00 | 0.36 | 0.00 | 0.64 |
| N170 | ENormal | CAutism | 0.00 | 0.01 | 0.00 | 0.99 |
| Experiment | Model Trained with | Version of Kaggle Dataset Used in the Combined Dataset | Test Dataset | FP Rate | Difference |
| Exp-1 | East Asian | N/A | East Asian | 6.7% | |
| Exp-3 | Combined Dataset of Kaggle and East Asian datasets | Original version with mixed races and invalid images; Dataset size is 2936 | East Asian | 23.9% | 6.3% |
| Exp-5 (repeat Exp-3) | Combined Dataset of Kaggle and East Asian datasets | Cleanup version with only White with removal of other identifiable invalid images; Dataset size is 1910 | East Asian | 17.6% | |
| Experiment | Model Trained with | Version of Kaggle Dataset Used in the Combined Dataset | Test Dataset | FP Rate (East Asian) | Difference |
| Exp-4 | Combined Dataset of Kaggle and East Asian datasets | Original version with mixed races and invalid images; Dataset size is 2936 | Combined | 22.3% | 5.9% |
| Exp-6 (repeat Exp-4) | Combined Dataset of Kaggle and East Asian datasets | Cleanup version with only White with removal of other identifiable invalid images; Dataset size is 1910 | Combined | 16.4% |
References
- Baio, J.; Wiggins, L.; Christensen, D.L.; Maenner, M.J.; Daniels, J.; Warren, Z.; Kurzius-Spencer, M.; Zahorodny, W.; Rosenberg, C.R.; White, T.; et al. Prevalence of Autism Spectrum Disorder Among Children Aged 8 Years—Autism and Developmental Disabilities Monitoring Network, 11 Sites, United States, 2014. MMWR Surveill. Summ. 2018, 67, 23. [Google Scholar] [CrossRef]
- Mandell, D.S.; Wiggins, L.D.; Carpenter, L.A.; Daniels, J.; DiGuiseppi, C.; Durkin, M.S.; Giarelli, E.; Morrier, M.J.; Nicholas, J.S.; Pinto-Martin, J.A.; et al. Racial/Ethnic Disparities in the Identification of Children With Autism Spectrum Disorders. Am. J. Public Health 2009, 99, 493–498. [Google Scholar] [CrossRef] [PubMed]
- Ma, M. Early Intervention Improves Long-Term Outcomes for Children with Autism. UW News, 9 June 2015. [Google Scholar]
- Estes, A.; Munson, J.; Rogers, S.J.; Greenson, J.; Winter, J.; Dawson, G. Long-term Out-comes of Early Intervention in 6-year-old Children with Autism Spectrum Disorder. J. Am. Acad. Child Adolesc. Psychiatry 2015, 54, 580–587. [Google Scholar] [CrossRef]
- Angell, A.M.; Empey, A.; Zuckerman, K.E. A Review of Diagnosis and Service Disparities Among Children With Autism From Racial and Ethnic Minority Groups in the United States. Int. Rev. Res. Dev. Disabil. 2018, 145–180, 145–180. [Google Scholar] [CrossRef]
- Zwaigenbaum, L.; Penner, M. Autism spectrum disorder: Advances in diagnosis and evaluation. BMJ 2018, 361, k1674. [Google Scholar] [CrossRef]
- Aldridge, K.; George, I.D.; Nicole, T.T.; Austin, J.R.; Takahashi, T.N.; Duan, Y.; Miles, J.H. Facial phenotypes in subgroups of prepubertal boys with autism spectrum disorders are correlated with clinical phenotypes. Mol. Autism 2011, 2, 15. [Google Scholar] [CrossRef] [PubMed]
- Obafemi-Ajayi, T.; Miles, J.H.; Takahashi, T.N.; Qi, W.; Aldridge, K.; Zhang, M.; Xin, S.-Q.; He, Y.; Duan, Y. Facial Structure Analysis Separates Autism Spectrum Disorders into Meaningful Clinical Subgroups. J. Autism Dev. Disord. 2015, 45, 1302–1317. [Google Scholar] [CrossRef]
- Tan, D.W.; Gilani, S.Z.; Maybery, M.T.; Mian, A.; Hunt, A.; Walters, M.; Whitehouse, A.J.O. Hypermasculinised facial morphology in boys and girls with Autism Spectrum Disorder and its association with symptomatology. Sci. Rep. 2017, 7, 9348. [Google Scholar] [CrossRef] [PubMed]
- Boutrus, M.; Gilani, S.Z.; Alvares, G.A.; Maybery, M.T.; Tan, D.W.; Mian, A.; Whitehouse, A.J.O. Increased facial asymmetry in autism spectrum conditions is associated with symptom presentation. Autism Res. 2019, 12, 1774–1783. [Google Scholar] [CrossRef]
- Ozgen, H.; Hellemann, G.S.; De Jonge, M.V.; Beemer, F.A.; Van Engeland, H. Predictive Value of Morphological Features in Patients with Autism versus Normal Controls. J. Autism Dev. Disord. 2013, 43, 147–155. [Google Scholar] [CrossRef]
- Marr, B. 7 Amazing Examples of Computer and Machine Vision in Practice. Forbs. 8 April 2019. Available online: https://www.forbes.com/sites/bernardmarr/2019/04/08/7-amazing-examples-of-computer-and-machine-vision-in-practice/?sh=4eca093d1018 (accessed on 16 August 2021).
- de Belen, R.A.J.; Bednarz, T.; Sowmya, A.; Del Favero, D. Computer vision in autism spectrum disorder research: A systematic review of published studies from 2009 to 2019. Transl. Psychiatry 2020, 10, 1–20. [Google Scholar] [CrossRef] [PubMed]
- Rahman, O.L.U.M. A Review of Machine Learning Methods of Feature Selection and Classification for Autism Spectrum Disorder. Brain Sci. 2020, 10, 949. [Google Scholar] [CrossRef]
- Piosenka, G. Detect Autism from a Facial Image. Available online: https://cutt.ly/ibIXt5a (accessed on 27 January 2021).
- Rajaram, M. Concerns with ‘Detect Autism’ Dataset. Kaggle. Available online: www.kaggle.com/melissarajaram/concerns-with-detect-autism-dataset (accessed on 6 August 2021).
- Musser, M. Detecting Autism Spectrum Disorder in Children with Computer Vision. Medium. 24 August 2020. Available online: https://towardsdatascience.com/detecting-autism-spectrum-disorder-in-children-with-computer-vision-8abd7fc9b40a (accessed on 1 August 2021).
- Vo, T.; Nguyen, T.; Le, T. Race Recognition Using Deep Convolutional Neural Networks. Symmetry 2018, 10, 564. [Google Scholar] [CrossRef]
- Chaudhuri, A. Deep Learning Models for Face Recognition: A Comparative Analysis. In Deep Biometrics; Springer: Singapore, 2020; pp. 99–140. [Google Scholar]
- Gwyn, T.; Roy, K.; Atay, M. Face Recognition Using Popular Deep Net Architectures: A Brief Comparative Study. Future Internet 2021, 13, 164. [Google Scholar] [CrossRef]
- Simonyan, K.; Zisserman, A. Very deep convolutional networks for large-scale image recognition. arXiv 2014, arXiv:1409.1556. [Google Scholar]
- Parkhi, O.M.; Vedaldi, A.; Zisserman, A. Deep Face Recognition. In Proceedings of the British Machine Vision Conference 2015, Swansea, UK, 7–10 September 2015. [Google Scholar] [CrossRef]
- Abadi, M.; Barham, P.; Chen, J.; Chen, Z.; Davis, A.; Dean, J.; Devin, M.; Ghemawat, S.; Irving, G.; Isard, M.; et al. Tensorflow: A system for large-scale machine learning. In Proceedings of the 12th {USENIX} Symposium on Operating Systems Design and Implementation ({OSDI} 16), Savannah, GA, USA, 2–4 November 2016; pp. 265–283. [Google Scholar]
- Malli, R. GitHub—Rcmalli/Keras-Vggface: VGGFace Implementation with Keras Framework. GitHub. Available online: Github.com/rcmalli/keras-vggface (accessed on 18 March 2021).
- Bioinformatics Laboratory, University of Ljubljana. Documentation. Orange Documentation. Available online: Orangedatamining.com/docs (accessed on 18 February 2021).
- Kingma, D.P.; Ba, J. Adam: A method for stochastic optimization. arXiv 2014, arXiv:1412.6980. [Google Scholar]
- Jason, B. A Gentle Introduction to the Rectified Linear Unit (ReLU). Machine Learning Mastery. 20 August 2020. Available online: Machinelearningmastery.com/rectified-linear-activation-function-for-deep-learning-neural-networks (accessed on 7 July 2021).
- Neural Networks. IBM. Available online: www.ibm.com/cloud/learn/neural-networks (accessed on 15 January 2021).
- Khalil, A.; Ahmed, S.G.; Khattak, A.M.; Al-Qirim, N. Investigating Bias in Facial Analysis Systems: A Systematic Review. IEEE Access 2020, 8, 130751–130761. [Google Scholar] [CrossRef]
- Akter, T.; Ali, M.; Khan, I.; Satu, S.; Uddin, J.; Alyami, S.; Ali, S.; Azad, A.; Moni, M. Improved Transfer-Learning-Based Facial Recognition Framework to Detect Autistic Children at an Early Stage. Brain Sci. 2021, 11, 734. [Google Scholar] [CrossRef]
- Zhuang, Z.; Landsittel, D.; Benson, S.; Roberge, R.; Shaffer, R. Facial Anthropometric Differences among Gender, Ethnicity, and Age Groups. Ann. Occup. Hyg. 2010, 54, 391–402. [Google Scholar] [CrossRef]
- Farkas, L.G.; Posnick, J.C.; Hreczko, T. Anthropometry of the head and face in 95 Down syndrome patients. Prog. Clin. Biol. Res. 1991, 373, 53–97. [Google Scholar] [PubMed]
- Preedy, V.R. Handbook of Anthropometry: Physical Measures of Human Form in Health and Disease, 2012th ed.; Springer Science & Business Media: Berlin/Heidelberg, Germany, 2012; p. 2537. [Google Scholar]
- Virdi, S.S.; Wertheim, D.; Naini, F.B. Normative anthropometry and proportions of the Kenyan-African face and comparative anthropometry in relation to African Americans and North American Whites. Maxillofac. Plast. Reconstr. Surg. 2019, 41, 9. [Google Scholar] [CrossRef] [PubMed]
- Farkas, L.; Forrest, C.; Litsas, L. Revision of Neoclassical Facial Canons in Young Adult Afro-Americans. Aesthetic Plast. Surg. 2000, 24, 179–184. [Google Scholar] [CrossRef] [PubMed]
- Farkas, L.G. Accuracy of anthropometric measurements: Past, present, and future. Cleft Palate-Craniofacial J. 1996, 33, 10–22. [Google Scholar] [CrossRef]
- Sarna, K.; Sonigra, K.J.; Ngeow, W.C. A Cross-Sectional Study to Determine and Compare the Craniofacial Anthropometric Norms in a Selected Kenyan and Chinese Population. Plast. Surg. 2021. [Google Scholar] [CrossRef]
- Fang, F.; Clapham, P.J.; Chung, K.C. A Systematic Review of Interethnic Variability in Facial Dimensions. Plast. Reconstr. Surg. 2011, 127, 874–881. [Google Scholar] [CrossRef]
- Tariq, Q.; Daniels, J.; Schwartz, J.N.; Washington, P.; Kalantarian, H.; Wall, D.P. Mobile detection of autism through machine learning on home video: A development and prospective validation study. PLoS Med. 2018, 15, e1002705. [Google Scholar] [CrossRef]
- Kojovic, N.; Natraj, S.; Mohanty, S.P.; Maillart, T.; Schaer, M. Using 2D video-based pose estimation for automated prediction of autism spectrum disorders in young children. Sci. Rep. 2021, 11, 15069. [Google Scholar] [CrossRef]
- Chang, Z.; Di Martino, J.M.; Aiello, R.; Baker, J.; Carpenter, K.; Compton, S.; Davis, N.; Eichner, B.; Espinosa, S.; Flowers, J.; et al. Computational Methods to Measure Patterns of Gaze in Toddlers With Autism Spectrum Disorder. JAMA Pediatr. 2021, 175, 827–836. [Google Scholar] [CrossRef]
- Sarmiento, J.A.; Naval, P.C. Behavioral Phenotyping for Autism Spectrum Disorder Biomarkers Using Computer Vision. J. Image Graph. 2020. [Google Scholar] [CrossRef]
- Burkett, K.; Morris, E.J.; Manning-Courtney, P.; Anthony, J.; Shambley-Ebron, D. African American Families on Autism Diagnosis and Treatment: The Influence of Culture. J. Autism Dev. Disord. 2015, 45, 3244–3254. [Google Scholar] [CrossRef] [PubMed]
- Canal-Bedia, R.; García-Primo, P.; Martín-Cilleros, M.V.; Santos-Borbujo, J.; Guisuraga-Fernández, Z.; Herráez-García, L.; Herráez-García, M.D.M.; Boada-Muñoz, L.; Fuentes-Biggi, J.; La Paz, M.P.-D. Modified Checklist for Autism in Toddlers: Cross-Cultural Adaptation and Validation in Spain. J. Autism Dev. Disord. 2010, 41, 1342–1351. [Google Scholar] [CrossRef] [PubMed]
- Screening and Diagnosis|Autism Spectrum Disorder (ASD)|NCBDDD. Centers for Disease Control and Prevention. 13 March 2020. Available online: www.cdc.gov/ncbddd/autism/screening.html (accessed on 27 October 2021).
- Wang, W.; Li, Y.; Zou, T.; Wang, X.; You, J.; Luo, Y. A Novel Image Classification Approach via Dense-MobileNet Models. Mob. Inf. Syst. 2020, 2020, 7602384. [Google Scholar] [CrossRef]
- Véstias, M.P. A Survey of Convolutional Neural Networks on Edge with Reconfigurable Computing. Algorithms 2019, 12, 154. [Google Scholar] [CrossRef]
- Naini, F.B. Facial Aesthetics: Concepts and Clinical Diagnosis; John Wiley & Sons: Hoboken, NJ, USA, 2011. [Google Scholar]


| Race/Ethnicity | Percentage | Count |
|---|---|---|
| Black | 3.10% | 126 |
| East Asian | 28.44% | 1154 1 |
| Other children of color | 4.07% | 165 |
| White | 64.39% | 2613 |
| Total | 100.00% | 4058 |
| Dataset | Subset | Label 1 |
|---|---|---|
| Kaggle | Autism | CAutism |
| Non-Autism | CNormal | |
| East Asian | Autism | EAutism |
| Non-Autism | ENormal |
| Model | UAC | CA | F1 | Precision | Recall |
|---|---|---|---|---|---|
| Neural Network | 0.983 | 0.933 | 0.928 | 0.932 | 0.923 |
| Predicted | ||||
|---|---|---|---|---|
| Autism | Normal | Σ | ||
| Actual | Autism | 96 | 8 | 104 |
| Normal | 8 | 112 | 120 | |
| Σ | 104 | 120 | 224 | |
| Predicted | ||||
|---|---|---|---|---|
| Autism | Normal | Σ | ||
| Actual | Autism | 112 | 3 | 115 |
| Normal | 8 | 107 | 115 | |
| Σ | 120 | 110 | 230 | |
| Precision | Recall | F1-Score | Support | |
|---|---|---|---|---|
| Autism | 0.93 | 0.97 | 0.95 | 115 |
| Normal | 0.97 | 0.93 | 0.95 | 115 |
| Accuracy | 0.95 | 230 | ||
| Macro average | 0.95 | 0.95 | 0.95 | 230 |
| Weighted average | 0.95 | 0.95 | 0.95 | 230 |
| Predicted | ||||
|---|---|---|---|---|
| Autism | Normal | Σ | ||
| Actual | Autism | 127 | 26 | 153 |
| Normal | 26 | 115 | 141 | |
| Σ | 153 | 141 | 294 | |
| Kaggle Dataset | Total Count | Black Children Image Count | Black Children Images Percentage of Total |
|---|---|---|---|
| Images labeled as ASD | 1468 | 58 | 3.95% |
| Images Labeled as non-ASD | 1468 | 68 | 4.63% |
| Predicted | ||||
|---|---|---|---|---|
| Autism | Normal | Σ | ||
| Actual | Autism | 106 | 7 | 113 |
| Normal | 98 | 15 | 113 | |
| Σ | 204 | 22 | 226 | |
| Predicted | ||||
|---|---|---|---|---|
| Autism | Normal | Σ | ||
| Actual | Autism | 84 | 29 | 113 |
| Normal | 27 | 86 | 113 | |
| Σ | 111 | 115 | 226 | |
| Experiment Section | Training Dataset | Test Dataset | % of East Asians in Training Dataset | Normal Images in the Test Dataset | FP Cases | FP Rate |
|---|---|---|---|---|---|---|
| Section 2.2.1 | East Asian | East Asian | 100% | 120 | 8 | 6.67% |
| Section 2.2.3. Exp-2 | Kaggle | East Asian | 1.1% | 113 | 98 | 86.73% |
| Section 2.2.3. Exp-3 | Combined 1 | East Asian | 28.44% | 113 | 27 | 23.89% |
| Experiment Section | Training Dataset | Test Dataset | CA | F1 | Precision | Recall |
|---|---|---|---|---|---|---|
| Section 2.2.1 | East Asian | East Asian | 0.933 | 0.928 | 0.932 | 0.923 |
| Section 2.2.3. Exp-2 | Kaggle | East Asian | 0.513 | 0.667 | 0.507 | 0.973 |
| Section 2.2.3. Exp-3 | Combined 1 | East Asian | 0.752 | 0.750 | 0.757 | 0.743 |
| Predicted | ||||||
|---|---|---|---|---|---|---|
| Actual | CNormal | ENormal | EAutism | CAutism | Σ | |
| CNormal | 231 | 3 | 0 | 55 | 289 | |
| ENormal | 3 | 80 | 9 | 11 | 103 | |
| EAutism | 1 | 6 | 105 | 8 | 120 | |
| CAutism | 63 | 11 | 6 | 219 | 299 | |
| Σ | 298 | 100 | 120 | 293 | 811 | |
| Test ID | Image Name | Label | Misclassified as | Prediction Probabilities for Each Target | |||
|---|---|---|---|---|---|---|---|
| CNormal | ENormal | EAutism | CAutism | ||||
| 82 | N691 | ENormal | CAutism | 0.000 | 0.180 | 0.010 | 0.810 |
| 276 | N600 | ENormal | CAutism | 0.000 | 0.050 | 0.000 | 0.950 |
| 310 | M-4 | ENormal | CAutism | 0.000 | 0.060 | 0.020 | 0.920 |
| 541 | N583 | ENormal | CAutism | 0.000 | 0.360 | 0.000 | 0.640 |
| 462 | N728 | ENormal | CAutism | 0.010 | 0.400 | 0.140 | 0.450 |
| 476 | N730 | ENormal | CAutism | 0.000 | 0.130 | 0.000 | 0.860 |
| 413 | N168 | ENormal | CAutism | 0.000 | 0.470 | 0.010 | 0.510 |
| 648 | N716 | ENormal | CAutism | 0.050 | 0.140 | 0.010 | 0.800 |
| 38 | N335 | ENormal | CAutism | 0.000 | 0.330 | 0.060 | 0.600 |
| 541 | N583 | ENormal | CAutism | 0.000 | 0.360 | 0.000 | 0.640 |
| 618 | N497 | ENormal | CAutism | 0.380 | 0.050 | 0.000 | 0.570 |
| Test ID | Image Name | Label | Misclassified as | Prediction Probabilities for Each Target | |||
|---|---|---|---|---|---|---|---|
| CNormal | ENormal | EAutism | CAutism | ||||
| 82 | N691 | ENormal | CNormal | 0.830 | 0.150 | 0.010 | 0.010 |
| 276 | N600 | ENormal | CNormal | 0.700 | 0.160 | 0.010 | 0.130 |
| 310 | M-4 | ENormal | CNormal | 0.700 | 0.160 | 0.010 | 0.130 |
| Kenyan Women’s Faces | |||||
|---|---|---|---|---|---|
| KM Mean (n = 36) | NAW (SD) (n = 200) | p Value | AA (SD) (n = 50) | p Value | |
| Vertical measurements | |||||
| Forehead height II tr-n | 67.5 (2.9) | 63.0 (6.0) | <0.001 * | 67.1 (5.9) | 0.693 |
| Nasal height n-sn | 47.6 (3.1) | 50.6 (3.1) | <0.001 * | 48.8 (3.7) | 0.114 |
| Lower face height sn-me | 69.5 (4.8) | 64.3 (4.0) | <0.001 * | 71.5 (5.2) | 0.061 |
| Upper lip height sn-sto | 24.0 (2.5) | 20.1 (2.0) | <0.001 * | 24.5 (3.0) | 0.435 |
| Lower lip height sto-sl | 20.7 (1.1) | 17.8 (4.7) | <0.001 * | 20.2 (2.4) | 0.163 |
| Horizontal measurements | |||||
| Intercanthal distance en-en | 32.1 (1.4) | 31.8 (2.3) | 0.225 | 34.4 (0.5) | <0.001 * |
| Eye width ex-en | 33.7 (1.5) | 30.7 (1.2) | <0.001 * | 32.2 (2.0) | 0.087 |
| Biocular width ex-ex | 94.4 (4.9) | 87.8 (3.2) | <0.001 * | 92.9 (5.3) | 0.185 |
| Nasal width al-al | 40.7 (3.7) | 31.4 (2.0) | <0.001 * | 40.1 (3.2) | 0.411 |
| Mouth width ch-ch | 52.0 (4.0) | 50.2 (3.5) | 0.012 | 53.6 (4.0) | 0.073 |
Publisher’s Note: MDPI stays neutral with regard to jurisdictional claims in published maps and institutional affiliations. |
© 2021 by the authors. Licensee MDPI, Basel, Switzerland. This article is an open access article distributed under the terms and conditions of the Creative Commons Attribution (CC BY) license (https://creativecommons.org/licenses/by/4.0/).
Share and Cite
Lu, A.; Perkowski, M. Deep Learning Approach for Screening Autism Spectrum Disorder in Children with Facial Images and Analysis of Ethnoracial Factors in Model Development and Application. Brain Sci. 2021, 11, 1446. https://doi.org/10.3390/brainsci11111446
Lu A, Perkowski M. Deep Learning Approach for Screening Autism Spectrum Disorder in Children with Facial Images and Analysis of Ethnoracial Factors in Model Development and Application. Brain Sciences. 2021; 11(11):1446. https://doi.org/10.3390/brainsci11111446
Chicago/Turabian StyleLu, Angelina, and Marek Perkowski. 2021. "Deep Learning Approach for Screening Autism Spectrum Disorder in Children with Facial Images and Analysis of Ethnoracial Factors in Model Development and Application" Brain Sciences 11, no. 11: 1446. https://doi.org/10.3390/brainsci11111446
APA StyleLu, A., & Perkowski, M. (2021). Deep Learning Approach for Screening Autism Spectrum Disorder in Children with Facial Images and Analysis of Ethnoracial Factors in Model Development and Application. Brain Sciences, 11(11), 1446. https://doi.org/10.3390/brainsci11111446