Abstract
A curved bridge test model with a scale ratio of 1:10 was constructed to investigate the influence of site conditions on curved bridges with longitudinal slopes based on a similar theory. The natural ground motions of five different groups, namely, Sites A–E, were selected from the Pacific Earthquake Engineering Center (PEER) seismic database, and the shaking table model test was conducted under horizontal unidirectional and bidirectional excitations. Results showed that the structural response of the curved bridge is sensitive to the ground motion of different site conditions. Spatial characteristics are observed in the main girder structural response of the curved bridge. When the curved bridge is parallel to the direction of the principal ground motion, the rotation effect of the main girder is greater than that perpendicular to the direction of the principal ground motion. The rotation effect of the main girder leads to evident beam end and bearing displacements at the low pier. The seismic excitation direction and pier height notably affect the displacement response of the pier, and the tangential displacement response of the fixed pier is sensitive to seismic excitation.
1. Introduction
In recent years, with the development of traffic construction, curved bridges have been used widely in expressway and urban transportation systems [1,2,3] due to their various characteristics, such as flexible linetype (which can select different curvature radii and longitudinal slopes), adaptability to terrain (they can be used in mountainous areas), and connection to traffic routes (they can be connected to different transportation hubs). Curved bridges have a curvature and longitudinal slope, which enable the structure to have bending–torsion coupling, and their internal force is complicated. The structural response of a curved bridge under seismic excitation is different from that of an ordinary bridge; thus, the curved bridge is prone to earthquake damage [4,5,6].
Currently, numerous researchers have analyzed the structural response of curved bridges under seismic action via numerical simulation and theory. Amjadian et al. [7] investigated the dynamic characteristics of curved bridges under the action of earthquakes and found that seismic excitation remarkably affects the in-plane response of horizontally curved bridges. Ni et al. [8] evaluated the influence of different seismic input angles on the response of curved girder bridges and emphasized that the seismic response is closely related to the seismic input angle. Pahlavan et al. [9] established a set of brittle analysis curves of horizontally curved highway bridges and conducted the probabilistic vulnerability assessment of curved girder bridges on the basis of OpenSees finite element software. Goel et al. [10] developed the fault rupture-response spectrum analysis method, which effectively validated a curved bridge. Angelidakis et al. [11] examined the structural response characteristics of a curved reinforced concrete bridge under directivity pulse ground motions. Results showed that the effect of directivity pulses remarkably amplifies the response of curved bridges, which is maximized when the structural period is close to half of the main pulse cycles. Jiao et al. [12] analyzed the seismic performance of the curved bridge by considering the soil-abutment superstructure and discussed the influence of different factors on the seismic performance of structures. Yan et al. [13,14] used the transfer matrix method to analyze the mechanical characteristics of curved bridges. Shan et al. [15] adopted the general coordinate method, Hamilton theory, and energy theory to derive the motion equation of the curved bridge. Li et al. [16] proposed a simplified model for studying the stiffness eccentricity parameters of curved bridges and presented the formula for calculating the seismic response of curved bridges.
A shaking table test is more advantageous than numerical simulation due to the reappearance of the destruction process of the earthquake. Several researchers have conducted a shaking table test on curved bridges with the improvement of test equipment and technology. Li et al. [17] analyzed the structural response of curved bridge under the action of traveling wave effect and local site effect ground motion through the shaking table test. Results showed that the structural response of a curved bridge is evident under the action of the traveling wave effect and local site effect earthquake. Yan et al. [18] conducted a comparative study of the shaking table test and finite element analysis of the S-shaped curved bridge. Monzon et al. [19] performed a seismically isolated test of the curved bridge via a shaking table test. They found that the seismic response of the curved bridge is asymmetric and the rotation of the superstructure presents a non-linear increase with the earthquake level. Li et al. [20] analyzed the seismic damage mechanism of curved bridge with high pier through a shaking table test; with the increase of load, the fundamental frequency of the curved bridge tends to decline, the damping gradually increases, the energy dissipation capacity increases, and the dynamic response presents evident growth. Li et al. [21] conducted a shaking table test of a curved rigid bridge under the action of near-fault ground motion and concluded that the structural response of the curved rigid bridge was evident under the action of near-fault impulse and traveling wave effect. Yan et al. [22] performed a seismic isolation test of a curved girder bridge. They found that the seismic damage of isolated curved bridges is less than that of non-isolated curved bridges, the fundamental frequency of bridges decreases with the increase of seismic intensity, and the damping ratio increases. Large-scale curved bridge tests [23] were conducted at the University of Nevada, Reno, which will be incorporated into future industry design codes.
The current shaking table test research mainly focuses on straight and generally curved bridges. Numerous studies are mainly focused on theoretical and numerical analyses because a curved bridge with longitudinal slope is still rare. Therefore, a curved bridge with 5% longitudinal slope was taken as the research object, and a curved bridge test model with a scale proportion of 1:10 was designed and manufactured. The seismic waves of different site types were selected, and the shaking table tests of horizontal unidirectional and bidirectional excitation were carried out. The structural response characteristics of the curved ramp bridge under the seismic excitation of different site types were investigated and discussed.
2. Shaking Table Test of the Curved Bridge Model
2.1. Similar Ratio
For the shaking table test model, the physical parameters that the structure must meet included geometric features, material characteristics, load characteristics, and dynamic indicators. After determining the geometric similarity ratio of the scale model, the similarity coefficient of other important physical quantities can be established by setting the equivalent mass density similarity coefficient [24]. The main research object of the shaking table test was the bridge structure and not the high-rise structure. Thus, the second-order effects of gravity were not considered. The model bridge used the same material as the prototype bridge so that the model and prototype bridges were simultaneously damaged under seismic excitation.
Considering the conditions of the laboratory space and the actual output capacity of the shaking table, the similarity ratio is set as 1/10 in this experiment. On the basis of similitude relation, the equivalent mass density is set as 2.
Table 1 shows the other physical volume similarity parameters based on known similarity parameters.

Table 1.
Similarity ratio of the test.
2.2. Design of the Curved Bridge Model
The prototype bridge is a three-span, curved, continuous girder bridge with a curvature radius of 50 m and a longitudinal slope of 5%. The bridge span is 40 m + 40 m + 40 m. The main girder is a single box with a double-chamber concrete continuous box girder. The piers are symmetrically arranged in double-column piers with a diameter of 1.5 m and pier heights of 15, 17, 19, and 21 m.
The curved bridge test model was constructed in accordance with the similarity ratio of 1:10. A steel box girder with a single-box double chamber was utilized to replace the concrete box girder in the model bridge because if the model bridge used concrete materials, then the main girder section was too small to arrange the steel bar; hence, the accessory requirements cannot be met (Figure 1a). On the basis of the similarity relation requirement, 3.2 tons of artificial mass was used to replace the mass loss of the concrete box girder. Fixed pot bearings were arranged at pier 2#, and unidirectional sliding pot bearings were arranged at piers 1#, 3#, and 4# along the tangential direction. The model bridge piers were composed of C30 concrete with the same strength grade as the prototype bridge. The longitudinal and volumetric reinforcement ratios were the same as the prototype bridge, wherein the longitudinal reinforcement ratio was 3.6% and the volumetric reinforcement ratio of the spiral hoop was 2.3%. Figure 1b shows the bridge reinforcement details. Figure 2 presents the curved bridge test model.
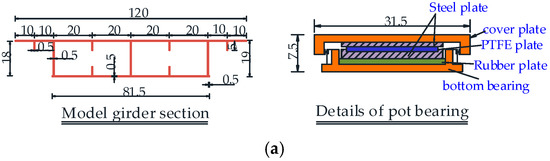

Figure 1.
Bridge model design (unit: cm): (a) superstructure; (b) substructure.

Figure 2.
1/10 curved bridge model.
2.3. Layout of the Shaking Tables and Sensors
The shaking table test was completed with the shaking table array system, which consists of nine independent shaking tables (1 × 1 m). They are independent of each other and can be assembled, disassembled, and arranged in accordance with the test requirements. Figure 3c presents the shaking table details. Table 2 lists the shaking table output parameters.

Figure 3.
Bridge structure model layout (unit: cm): (a) elevation view, (b) plan view, (c) shaking table details.
Table 2.
Performance parameters of shaking table.
Four 1 m × 1 m shaking tables are arranged in this test in accordance with the curved bridge line type. The direction of the connecting line between piers 1# and 4# is defined as the X-direction, and the direction perpendicular to the X-direction is defined as the Y-direction. The piers are arranged symmetrically relative to the Y-direction. The angle between the Y-direction and tangential direction of piers 1# and 4# is ±21°, and the angle between the Y-direction and tangential displacement direction of piers 2# and 3# is ±67°, as shown in Figure 3b.
During the test, the experimental measurement data mainly included acceleration, displacement, and strain responses at the key position.
(1) A total of 30 integrated circuit piezoelectric acceleration sensors (measuring range, ±5g) were distributed in the main girder and piers along the tangential and radial directions.
(2) A total of 30 991 B displacement sensors (measuring range, ±200 mm; frequency passband, 0.25–100 Hz) were distributed in the main girder and piers along the tangential and radial directions.
(3) Six pull-line displacement sensors (measuring range, 0–500 mm) were installed in each bearing to measure their relative displacements.
(4) A total of 26 strain gauges were distributed in webs on both sides of the main girder, which were the pivot, 1/4, 1/2, and 3/4 sections along the axial direction motions.
Figure 4 shows the layout details of the sensors installed on the bridge model. In addition, all sensors are collected using a dynamic acquisition system, namely, integrated measurement control.

Figure 4.
Layout of sensors. (a) Details of the sensors installed on the bridge model. (b) Layout of acceleration sensors. (c) Layout of displacement sensors.
3. Seismic Wave Selection and Test Case Setting
3.1. Seismic Wave Selection
The seismic waves of different sites were selected in accordance with the National Earthquake Hazards Reduction Program (NEHRP) site classification standard in the United States to study the influence of the ground motion of various site types on the structural response of the curved bridge with 5% longitudinal slope. The target spectrum was generated using the Pacific Earthquake Engineering Center (PEER) NGA 2 Spectrum model for different site grounds, which was determined by the ground motion of . Table 3 lists the different site parameters. The seismic waves used in this study were obtained from the ground motion database of the Pacific Earthquake Engineering Research Center [25]. The acceleration time series of different site ground motions could be obtained by the target spectrum. The mean square error (MSE) is used to measure the matching degree, and the small MSE value indicates that the selected seismic wave remarkably matches the target spectrum as follows:
where is the target response spectrum and refers to the response spectrum of the selected ground motion records. denotes the weight function that can define different weight functions in the range of cycles of interest. represents the linear scale factor (SF) applied to the response spectrum of the entire natural seismic record. Table 4 lists the feature parameters of the selected seismic waves. To produce statistically significant test results, seven seismic waves were selected for each site, as shown in Figure 5. The MSE value of the selected record is between 0.015 and 0.151, indicating that the selected records remarkably matched the target response spectrum (Figure 6).
Table 3.
Parameters of the Pacific Earthquake Engineering Center (PEER) NGA 2 spectra model under different site conditions.
Table 4.
Details of the selected PEER ground motion records.
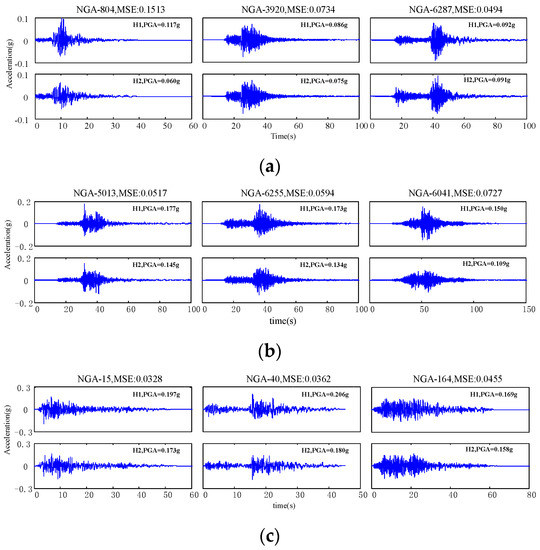

Figure 5.
Earthquake histories for different sites. (a) Earthquake histories of Site A. (b) Earthquake histories of site B. (c) Earthquake histories of site C. (d) Earthquake histories of site D. (e) Earthquake histories of site E.

Figure 6.
Spectra of selected ground motions. (a) Target response spectra. (b) Response spectra of site A. (c) Response spectra of site B. (d) Response spectra of site C. (e) Response spectra of site D. (f) Response spectra of site E.
3.2. Test Case Setting
As each natural ground motion include two seismic waves that are perpendicular to each other, the ground motion direction with high peak acceleration is defined as the principal seismic direction, which is represented by P, and the other ground motion direction with a small peak acceleration is defined as a secondary seismic direction, which is denoted by S. The curved bridges parallel and perpendicular to the principal seismic direction were considered to reflect the influence of the principal seismic direction on the structural response of the curved bridge (Figure 7). When the curved bridge was parallel to the principal seismic direction, the unidirectional excitation was recorded as XP, and the bidirectional excitation was recorded as XP + YS. When the curved bridge was perpendicular to the principal seismic direction, the unidirectional excitation was recorded as YP, and the bidirectional excitation was recorded as XS + YP. Table 5 lists the test cases for different site effects.

Figure 7.
Relative position of model bridge and principal ground motion direction. (a) Position A, curved bridge parallel to the principal seismic direction. (b) Position B, curved bridge perpendicular to the principal seismic direction.
Table 5.
Test cases for different sites.
4. Test Results and Discussion
4.1. Dynamic Characteristics of the Curved Bridge Model
The longitudinal and transverse modals of the curved bridge under white-noise excitation in the X- and Y-directions were identified using the stochastic subspace identification (SSI) method [26]. Figure 8a shows the stabilization diagram of the SSI method for tangential and radial acceleration sensors and the first four-order natural frequencies of the model bridge, namely, 2.549, 3.306, 5.701, and 13.52 Hz. The first-order mode was longitudinal vibration and the second- to fourth-order modes were transverse vibration. Figure 8b presents the first four mode shapes of the model bridge, that is, the main girder along the longitudinal drift (mode 1), the transverse symmetrical lateral bend of the main girder (mode 2), the main girder opposing the lateral bend (mode 3), and the transverse symmetrical lateral bend of the main girder (mode 4).

Figure 8.
Identified frequencies and mode shapes of the bridge model: (a) stabilization diagram of the stochastic subspace identification (SSI) method; (b) identified natural frequencies and mode shapes.
4.2. Strain of the Main Girder Web
Figure 9 shows the strain peak value of the main girder web. The strain response of the main girder web increases from Sites A to E. When the seismic wave was excited in the XP-direction, the web strain response in the first span of the main girder was considerably greater than that of the third span. The main girder of the curved bridge moved horizontally along the seismic excitation direction and rotated with pier 2# when the seismic wave was excited along the XP-direction, which caused the main girder to bend in the plane, because the main girder of the curved bridge was asymmetrically relative to pier 2#. The rotation radius of the second and third spans to pier 2# was greater than the rotation radius of the first span to pier 2#, which resulted in greater bending of the main girder in the first span and increased the web strain response of the main girder in the first span. When the seismic wave was excited in the YP-direction, the web strain response on both sides of the main girder was smaller to that in the XP-direction. The main girder was mainly translational under transverse seismic excitation, resulting in small rotation and bending. In the case of bidirectional seismic excitation, the strain response of the main girder webs in the curved bridge parallel to the principal seismic direction was greater than that perpendicular to the principal seismic direction. The main girder rotates greatly and produces bending parallel to the principal seismic direction. The strain response of the inner web is larger than that of the outer web, and the maximum strain value appears in the second mid-span, indicating that the inner web response is sensitive to the rotation effect of the main girder.

Figure 9.
Web strain of girder: (a) position A: curved bridge parallel to the direction of the principal ground motion; (b) position B: curved bridge perpendicular to the direction of the principal ground motion.
4.3. Displacement Response of Mid-Span
Figure 10 shows that the displacement response of mid-span increased from site A to site E. When the seismic wave was excited in the XP-direction, a large tangential displacement was generated in each mid-span, and the tangential displacement of the mid-span was the largest in the second span and the smallest in the third span. The main girder rotated along fixed pier 2# while moving horizontally along the seismic input direction. As the main girder and pier 2# moved synchronously, the displacement of the pier top was transmitted directly to the main girder, and the first span was close to fixed pier 2#, which led the tangential displacement in the first mid-span to be larger than that in the third mid-span. When seismic waves were excited in the YP-direction, the displacement response in the third mid-span was larger than that in the first mid-span because the curved bridge was mainly translational and the rotation effect was relatively small in the transverse seismic excitation, and the displacement response in the high mid-span was evident. In bidirectional seismic excitation, the displacement response in the third mid-span was greater than that in the first mid-span due to the participation of transverse seismic excitation; the main girder was translational and this increases the displacement response in the third mid-span.

Figure 10.
Mid-span displacement peak (unit: mm): (a) position A: curved bridge parallel to the direction of the principal ground motion; (b) position B: curved bridge perpendicular to the direction of the principal ground motion.
4.4. Displacement Response of the Beam End
The radial relative displacement of the main girder and pier was limited by unidirectional sliding bearing. Thus, only the tangential displacement of the beam end was analyzed. Table 6 shows that the displacement response of the beam end increased from Sites A to E. When the seismic wave was excited in the XP-direction, the displacement response of beam end 1# was greater than that of beam end 4#. When the seismic wave was excited in the YP-, XP + YS-, and XS + YP-directions due to the participation of seismic excitation in the Y-direction, the displacement of beam end 4# was more evident than that of beam end 1#.
Table 6.
Displacement response of beam end (unit.mm).
In summary, the rotation of the main girder makes the beam end displacement evident at the low pier. The participation of seismic excitation in the Y-direction makes the beam end displacement of the high pier evident, which is likely to cause the girder to fall or collide between the beam end and abutment.
4.5. Displacement Response of Bearing
Figure 11 shows that the displacement response of bearing increased from Site A to E. When the seismic wave was excited in the XP-direction, the main girder generated rotation, leading to the relative displacement of the bearing remarkably at pier 1#. The bearing displacement at pier 4# was greater than that at pier1# when the seismic wave was excited in the YP-, XP + YS-, and XS + YP-directions. The displacement response of the bearing at the high pier was greater than that of the lower pier because the rotation effect of the main girder was relatively small and the structural response was evident at the high pier.

Figure 11.
Relative displacement of bearing: (a) position A: curved bridge parallel to the direction of the principal ground motion; (b) position B: curved bridge perpendicular to the direction of the principal ground motion.
In summary, the main girder is rotated under XP-direction seismic excitation, and the bearings at the low pier are likely to fall off. When the seismic wave is excited in the YP-, XP + YS-, and XS + YP-directions, the bearings at the high pier easily falls off. Therefore, the influence of the seismic excitation direction on the bearing displacement should be considered in the seismic analysis.
4.6. Displacement Response of Piers
Figure 12 shows that the displacement response of the piers continuously increased from Site A to Site E. The tangent displacement response of Piers 2# and 3# in the XP seismic excitation was greater than that in the YP seismic excitation. Furthermore, the radial displacement was opposite because the angle from the tangential displacement direction of Piers 2# and 3# to the X-direction (±23°) was smaller than the angle from the tangential displacement direction of Piers 2# and 3# to the Y-direction (±67°). The angle from the radial displacement direction of Piers 2# and 3# to the X-direction (±67°) was greater than that from the radial displacement direction of Piers 2# and 3# to the Y-direction (±23°). Similarly, the tangent relative displacement of Piers 1# and 4# in XP seismic excitation was smaller than that in YP seismic excitation, whereas the radial relative displacement of Piers 1# and 4# in XP excitation was evident. Similar results were found in the cases of bidirectional excitation. Fixed pier 2# moved synchronously with the main girder and obtained the inertial force of the main girder, thereby increasing the displacement of the pier top so that the tangential displacement of pier top 2# was larger than those of other piers. The height from Pier 1# to Pier 4# continuously increased, and the piers were symmetrically distributed so that the relative displacement response of pier 4# was greater than that of pier 1#. In the case of the participation of Y-direction seismic excitation, the radial relative displacement of pier 3# was greater than that of pier 2#.
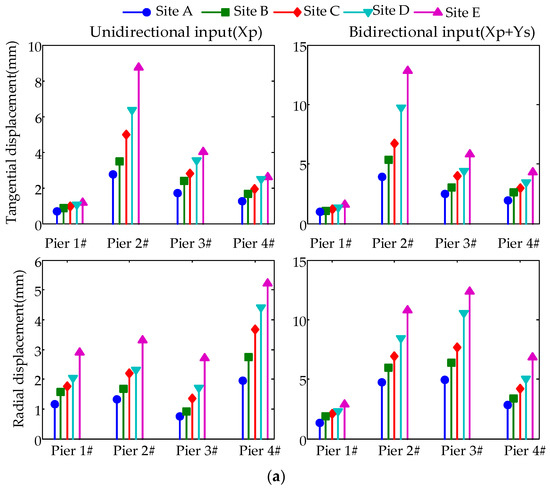

Figure 12.
Pier top displacement response peak: (a) position A, curved bridge parallel to the direction of the principal ground motion; (b) position B, curved bridge perpendicular to the direction of the principal ground motion.
Results show that the relative displacement of the pier is related to the seismic wave excitation direction, and the smaller the angle between the displacement direction of the pier and the direction of the seismic wave excitation, the more evident the relative displacement response of the pier. The tangential relative displacement of the fixed pier is larger than those of other piers. The pier height has a certain influence on the relative displacement of the pier, and the relative displacement of the high pier is large.
5. Conclusions
In this research, a 1/10 scaled curved bridge test model with 5% longitudinal slope was designed and manufactured. A series of shaking table tests of a curved bridge model under different site conditions was conducted. Conclusions can be drawn as follows:
(1) The structural response of the curved bridge is sensitive to the ground motion of different site conditions. From Site A to Site E, the structural response of the curved bridge gradually increases, and structural amplification is evident. Site conditions cannot be ignored in the seismic analysis.
(2) Spatial characteristics are observed in the main girder structural response of the curved bridge. The main girder rotates along the fixed pier while moving horizontally in the direction of seismic excitation, thereby causing the main girder to bend. When the curved bridge is parallel to the principal ground motion direction, the rotation effect of the main girder is greater than that perpendicular to the direction of the principal ground motion.
(3) When the curved bridge is parallel to the direction of the principal ground motion, the beam end and bearing displacements at the low pier are evident in the XP seismic excitation due to the rotation effect of the main girder. In other test cases, the beam end and bearing displacements at the high pier are evident. Thus, a reasonable analysis should be conducted in seismic design and analysis to avoid girder falling and bearing shedding.
(4) The seismic excitation direction and pier height remarkably influence the displacement response of the pier, and the tangential displacement response of the fixed pier is sensitive to seismic excitation and cannot be ignored.
Author Contributions
W.Y. and Y.C. conceived the method; P.S. wrote the paper. Z.Z. offered useful suggestions for the preparation and writing the paper.
Funding
This research was funded by the National Natural Science Foundation of China (51378037 and 51378039), and National Key R&D Program of China (No. 2017YFC1500604).
Acknowledgments
The work reported herein was supported by the National Natural Science Foundation of China (51378037 and 51378039), and National Key R&D Program of China (No. 2017YFC1500604).
Conflicts of Interest
The authors declare no conflict of interest.
References
- Gupta, T.; Kumar, M. Flexural response of skew-curved concrete box-girder bridges. Eng. Struct. 2018, 163, 358–372. [Google Scholar] [CrossRef]
- Fatemi, S.J.; Mohamed Ali, M.S.; Sheikh, A.H. Load distribution for composite steel–concrete horizontally curved box girder bridge. J. Constr. Steel Res. 2016, 116, 19–28. [Google Scholar] [CrossRef]
- Lin, W.; Yoda, T. Numerical study on horizontally curved steel-concrete composite beams subjected to hogging moment. Int. J. Steel Struct. 2014, 14, 557–569. [Google Scholar] [CrossRef]
- Mya Nan, A.; Kasai, A.; Shigeishi, M. An Investigation of Damage Mechanism Induced by Earthquake in a Plate Girder Bridge Based on Seismic Response Analysis: Case Study of Tawarayama Bridge under the 2016 Kumamoto Earthquake. Adv. Civ. Eng. 2018, 2018, 1–19. [Google Scholar] [CrossRef]
- Han, Q.; Du, X.L.; Liu, J.B.; Li, Z.X.; Li, L.Y.; Zhao, J.F. Seismic damage of highway bridges during the 2008 Wenchuan earthquake. Earthq. Eng. Eng. Vib. 2009, 8, 263–273. [Google Scholar] [CrossRef]
- Kawashima, K.; Takahashi, Y.; Ge, H.B.; Wu, Z.S.; Zhang, J.D. Reconnaissance Report on Damage of Bridges in 2008 Wenchuan, China, Earthquake. J. Earthq. Eng. 2009, 13, 965–996. [Google Scholar] [CrossRef]
- Amjadian, M.; Agrawal, A.K. Rigid-Body Motion of Horizontally Curved Bridges Subjected to Earthquake-Induced Pounding. J. Bridge Eng. 2016, 21. [Google Scholar] [CrossRef]
- Ni, Y.; Chen, J.; Teng, H.; Jiang, H. Influence of earthquake input angle on seismic response of curved girder bridge. J. Traffic Transp. Eng. 2015, 2, 233–241. [Google Scholar] [CrossRef]
- Pahlavan, H.; Zakeri, B.; Amiri, G.G.; Shaianfar, M. Probabilistic Vulnerability Assessment of Horizontally Curved Multiframe RC Box-Girder Highway Bridges. J. Perform. Constr. Facil. 2016, 30. [Google Scholar] [CrossRef]
- Goel, R.; Qu, B.; Tures, J.; Rodriguez, O. Validation of Fault Rupture-Response Spectrum Analysis Method for Curved Bridges Crossing Strike-Slip Fault Rupture Zones. J. Bridge Eng. 2014, 19. [Google Scholar] [CrossRef]
- Angelidakis, V.; Kardoutsou, V.; Psycharis, I.; Taflampas, I. Investigation of the effect of directivity pulses on the seismic response of a curved RC bridge. Procedia Eng. 2017, 199, 2985–2990. [Google Scholar] [CrossRef]
- Jiao, C.Y.; Liu, L.Y.; Long, P.H.; Shi, X.P.; Hou, S.W. Study on ‘Creeping’Phenomenon of Curved Continuous Girder Bridge. Eng. Mech. 2015, 32, 177–183. (In Chinese) [Google Scholar]
- Yan, X.; Li, Q. The Spatial Transfer Matrix of Curved Box-Girder Bridge. J. Harbin Eng. Univ. 2014, 35, 1212–1218. (In Chinese) [Google Scholar]
- Sun, J.; Li, Q. Precise Transfer Marix Method for Solving in-Plane Internal Forces and Displacements of Curved Beams with Pinned-Pinned Ends. Eng. Mech. 2010, 27, 119–123. (In Chinese) [Google Scholar]
- Shan, D.; Li, Q. An Ahalytical Method of Vibration Analysis for Curved-Girder Bridges. China Civ. Eng. J. 2005, 38, 61–65, 87. (In Chinese) [Google Scholar]
- Li, W.; Xiyuan, Z.; Weiming, Y.A.N. Simplified Analysis Method for Seismic Response of Curved Bridges. Eng. Mech. 2006, 23, 77–84. (In Chinese) [Google Scholar]
- Li, X.; Zhang, D.Y.; Yan, W.M.; Chen, Y.J.; Xie, W.C. Shake-Table Test for a Typical Curved Bridge: Wave Passage and Local Site Effects. J. Bridge Eng. 2015, 20. [Google Scholar] [CrossRef]
- Yan, L.; Li, Q.N.; Cheng, M.L.; Yin, J.H.; Sun, J.P. Shaking table tested and finite element analysis on the curved bridge with floating seismic system. J. Vib. Shock 2016, 35, 1–6. [Google Scholar] [CrossRef]
- Monzon, E.V.; Buckle, I.G.; Itani, A.M. Seismic Performance and Response of Seismically Isolated Curved Steel I-Girder Bridge. J. Struct. Eng. 2016, 142. [Google Scholar] [CrossRef]
- Li, X.; Jia, H.Y.; Li, Q. Shaking table tests for a long-Span curved rigid bridge under near-fault ground motions. J. Vib. Shock 2017, 36, 199–207. [Google Scholar] [CrossRef]
- Li, Q.; Cheng, M.; Yin, J.; Zhou, C. Study on seismic disaster mechanism of irregular C-shaped curved bridge with high piers. KSCE J. Civ. Eng. 2015, 20, 1429–1436. [Google Scholar] [CrossRef]
- Yan, L.; Li, Q.N.; Han, C.; Jiang, H.T. Shaking Table Tests of Curved Bridge considering Bearing Friction Sliding Isolation. Shock Vib. 2016. [Google Scholar] [CrossRef]
- University of Nevada. Available online: https://www.unr.edu/cceer/projects/curved-bridge (accessed on 5 February 2019).
- Wang, T.W. Structural Testing of Civil Engineering; Wuhan University of Technology Press: Wuhan, China, 2006; pp. 16–19. [Google Scholar]
- PEER (Pacific Earthquake Engineering Center). Ground Motion Database. 2010. Available online: http://ngawest2.berkeley.edu (accessed on 18 March 2018).
- Priori, C.; De Angelis, M.; Betti, R. On the selection of user-defined parameters in data-driven stochastic subspace identification. Mech. Syst. Signal Process. 2018, 100, 501–523. [Google Scholar] [CrossRef]
© 2019 by the authors. Licensee MDPI, Basel, Switzerland. This article is an open access article distributed under the terms and conditions of the Creative Commons Attribution (CC BY) license (http://creativecommons.org/licenses/by/4.0/).