Article

Influence of Frost Growth and Migration in Cryogenic Heat Exchanger on Air Refrigerator

1
College of Mechanical and Electronic Engineering, Northwest A&F University, Yangling 712100, China
2
College of Mechanical and Electrical Engineering, Qingdao University of Science and Technology, Qingdao 266061, China
3
Institute of Plasma Physics, Chinese Academy of Sciences, Hefei 230031, China
*
Author to whom correspondence should be addressed.
Appl. Sci. 2019, 9(4), 753; https://doi.org/10.3390/app9040753
Submission received: 29 January 2019 / Revised: 14 February 2019 / Accepted: 19 February 2019 / Published: 21 February 2019
(This article belongs to the Special Issue Sciences in Heat Pump and Refrigeration)

Abstract

:
Frost formation degrades the performance of heat exchangers greatly, thus influencing the cryogenic refrigerator. Different from frost formation on the evaporator surface, the growth and migration of frost layer inside the heat exchanger is of low temperature and humidity. In addition to the constantly changing boundary conditions, the effective prediction is difficult. In the present study, a numerical model was proposed to analyze the frost formation in the cryogenic heat exchanger of a reverse Brayton air refrigerator. Under small amounts of moisture, the growing of frost layer was simulated through the numerical heat and mass transfer by adopting semiempirical correlations. The frost formation model was inserted into the transient model of refrigerator, and numerical calculations were performed on heat and mass transfer rates, and growth and migration of frost layers in forced convection conditions. Experiments were conducted under different air humidity to investigate the frost formation and verify the numerical model. Through the model, the influences of frosting on the refrigerator were evaluated under different moisture contents and running time. It can be used to predict the performance of air refrigerators with low humidity and provide a basis for improving the system operation and efficiency.

1. Introduction

The heat transfer in reverse Brayton cycles has the characteristics of no phase change and the one between the cold and hot fluids in the cryogenic regenerator is gas–gas [1,2]. As the gas–gas heat transfer coefficient is small, the cryogenic regenerator of the reverse Brayton refrigerator is required to have great heat transfer area. Due to high efficiency, great specific surface area, compactness and light weight, the plate-fin heat exchanger is widely used in the reverse Brayton refrigerator [3,4]. The cryogenic heat exchanger is a very important equipment in low temperature equipment. It not only affects the economy of the cryogenic equipment, but also affects the possibility of process realization [5,6,7,8].
Employing air as the working fluid has brought the reverse Brayton refrigerator many advantages. For example, the open cycle can be conducted and related equipment and losses are reduced. Meanwhile there are some downsides, of which the biggest one is the influence of air humidity. As the refrigerator runs, new air enters the system continuously. Although most of the water is removed by the precooling system, some of the water vapor still enters the system [7]. In the operation process of the cryogenic refrigerator, the temperature inside the heat exchanger might be below −100 °C or even lower for a long time [3,7]. The frosting will occur when the wet air flows through the heat exchanger, thus affecting the system performance. Frost formation on the surface of a heat exchanger raises the heat barrier and flow resistance, thus affecting the heat exchanger performance.
Much research has been conducted on plate-fin heat exchanger both theoretically and experimentally. Yang et al. [8] simulated the dynamic performance of a cryogenic heat exchanger under different energy utilization modes using the numerical method. Kays and London et al. [9] specialized in the experimental study of compact surface, and their famous literature contained the experimental data of 56 types of plate fin surface. Zhan et al. [10] performed numerical simulation of a cryogenic heat exchanger in nitrogen expansion cycle. With the application in gas separation and liquefaction plant, the research of plate-fin heat exchanger has been developed rapidly. Joshi [11] fitted the experimental correlations off factor and j factor respectively according to the experimental data of pressure loss and heat transfer of various fins. The heat transfer performance of the plate-fin heat exchanger in reverse Brayton refrigerator is usually calculated by numerical methods. Chang et al. [12] performed the numerical solution of the plate-fin heat exchanger in methane gas liquefaction of inverse Brayton cycle, and optimized the size of the heat exchanger. Shin et al. [13] studied the plate-fin heat exchanger for the reverse Brayton cycle of an LNG carrier. The finite difference method was used to solve the heat exchanger, and a dynamic model was established.
To remove the water in air refrigerator, there are several methods to adopt. In the aircraft environmental control system (ECS), the high-pressure water separation is commonly used to reduce air humidity. For example, Zhao et al. [14] conducted a bootstrap air cycle refrigeration system, using a compressor to raise the pressure of air stream, and then cooled it down to the dew-point in a condenser. Chen et al. [15] proposed the water injection subsystem (in the blue frame) for cabin humidity control. Daniel [16] conducted energy and exergy analyses of humidity control in the environmental control system of aircraft. In the model, the three-wheel bootstrap cycle was involved and evaluated.
The prediction models for frosting in evaporator have been developed in the past several decades [17,18,19]. Silva et al. [20] reviewed the most simulation models available in open literatures. Sommers et al. [21] proposed a semi-empirical frost density correlation, which was within a 20% error band. Whereas, the scope of application was surface temperatures from −13 °C to −5 °C under natural convection conditions. Hermes et al. [22] newly proposed a semi-empirical model to simulate the frost accretion on different surfaces. The model had an average predictive error of 11.7%.
Few studies have been focused on the frost formation inside the cryogenic heat exchanger of air refrigerator. To accurately calculate the frosting characteristics is difficult. The frosting occurs inside the plate-fin heat exchanger with small humidity and low temperature. The frosting surface of the heat exchanger is quite different from that of the evaporator. The boundary conditions of frosting (humidity, air velocity, and surface temperature) are constantly changing during the operation of refrigerator. All these make the frosting in the plate-fin heat exchanger extremely difficult to predict.
In this work, the frosting analysis of the cryogenic heat exchanger in air refrigerator was carried out firstly. The heat and mass transfer characteristics during frosting was analyzed in detail and related control equations were expressed using numerical methods. A simulation model was proposed to calculate the frost formation in the cryogenic heat exchanger under small amounts of moisture. Using the method of dual non-steady time steps to simulate the changing boundary conditions, the frosting model of the cryogenic heat exchanger was developed via Visual C++ code. Experiments were conducted to investigate the frosting condition and verify the frosting model. The growth and migration of frosting were clarified through simulation. Numerical simulations are performed on the heat and mass transfer features, the heat exchanger effectiveness, and the influence of frosting on the air refrigerator. The purpose of this study was to simulate the frosting performance of the air refrigerator accurately, provide a basis for the design and operation of air refrigerators, reduce economic costs and improve energy efficiency.

2. Frost Formation in Heat Exchanger

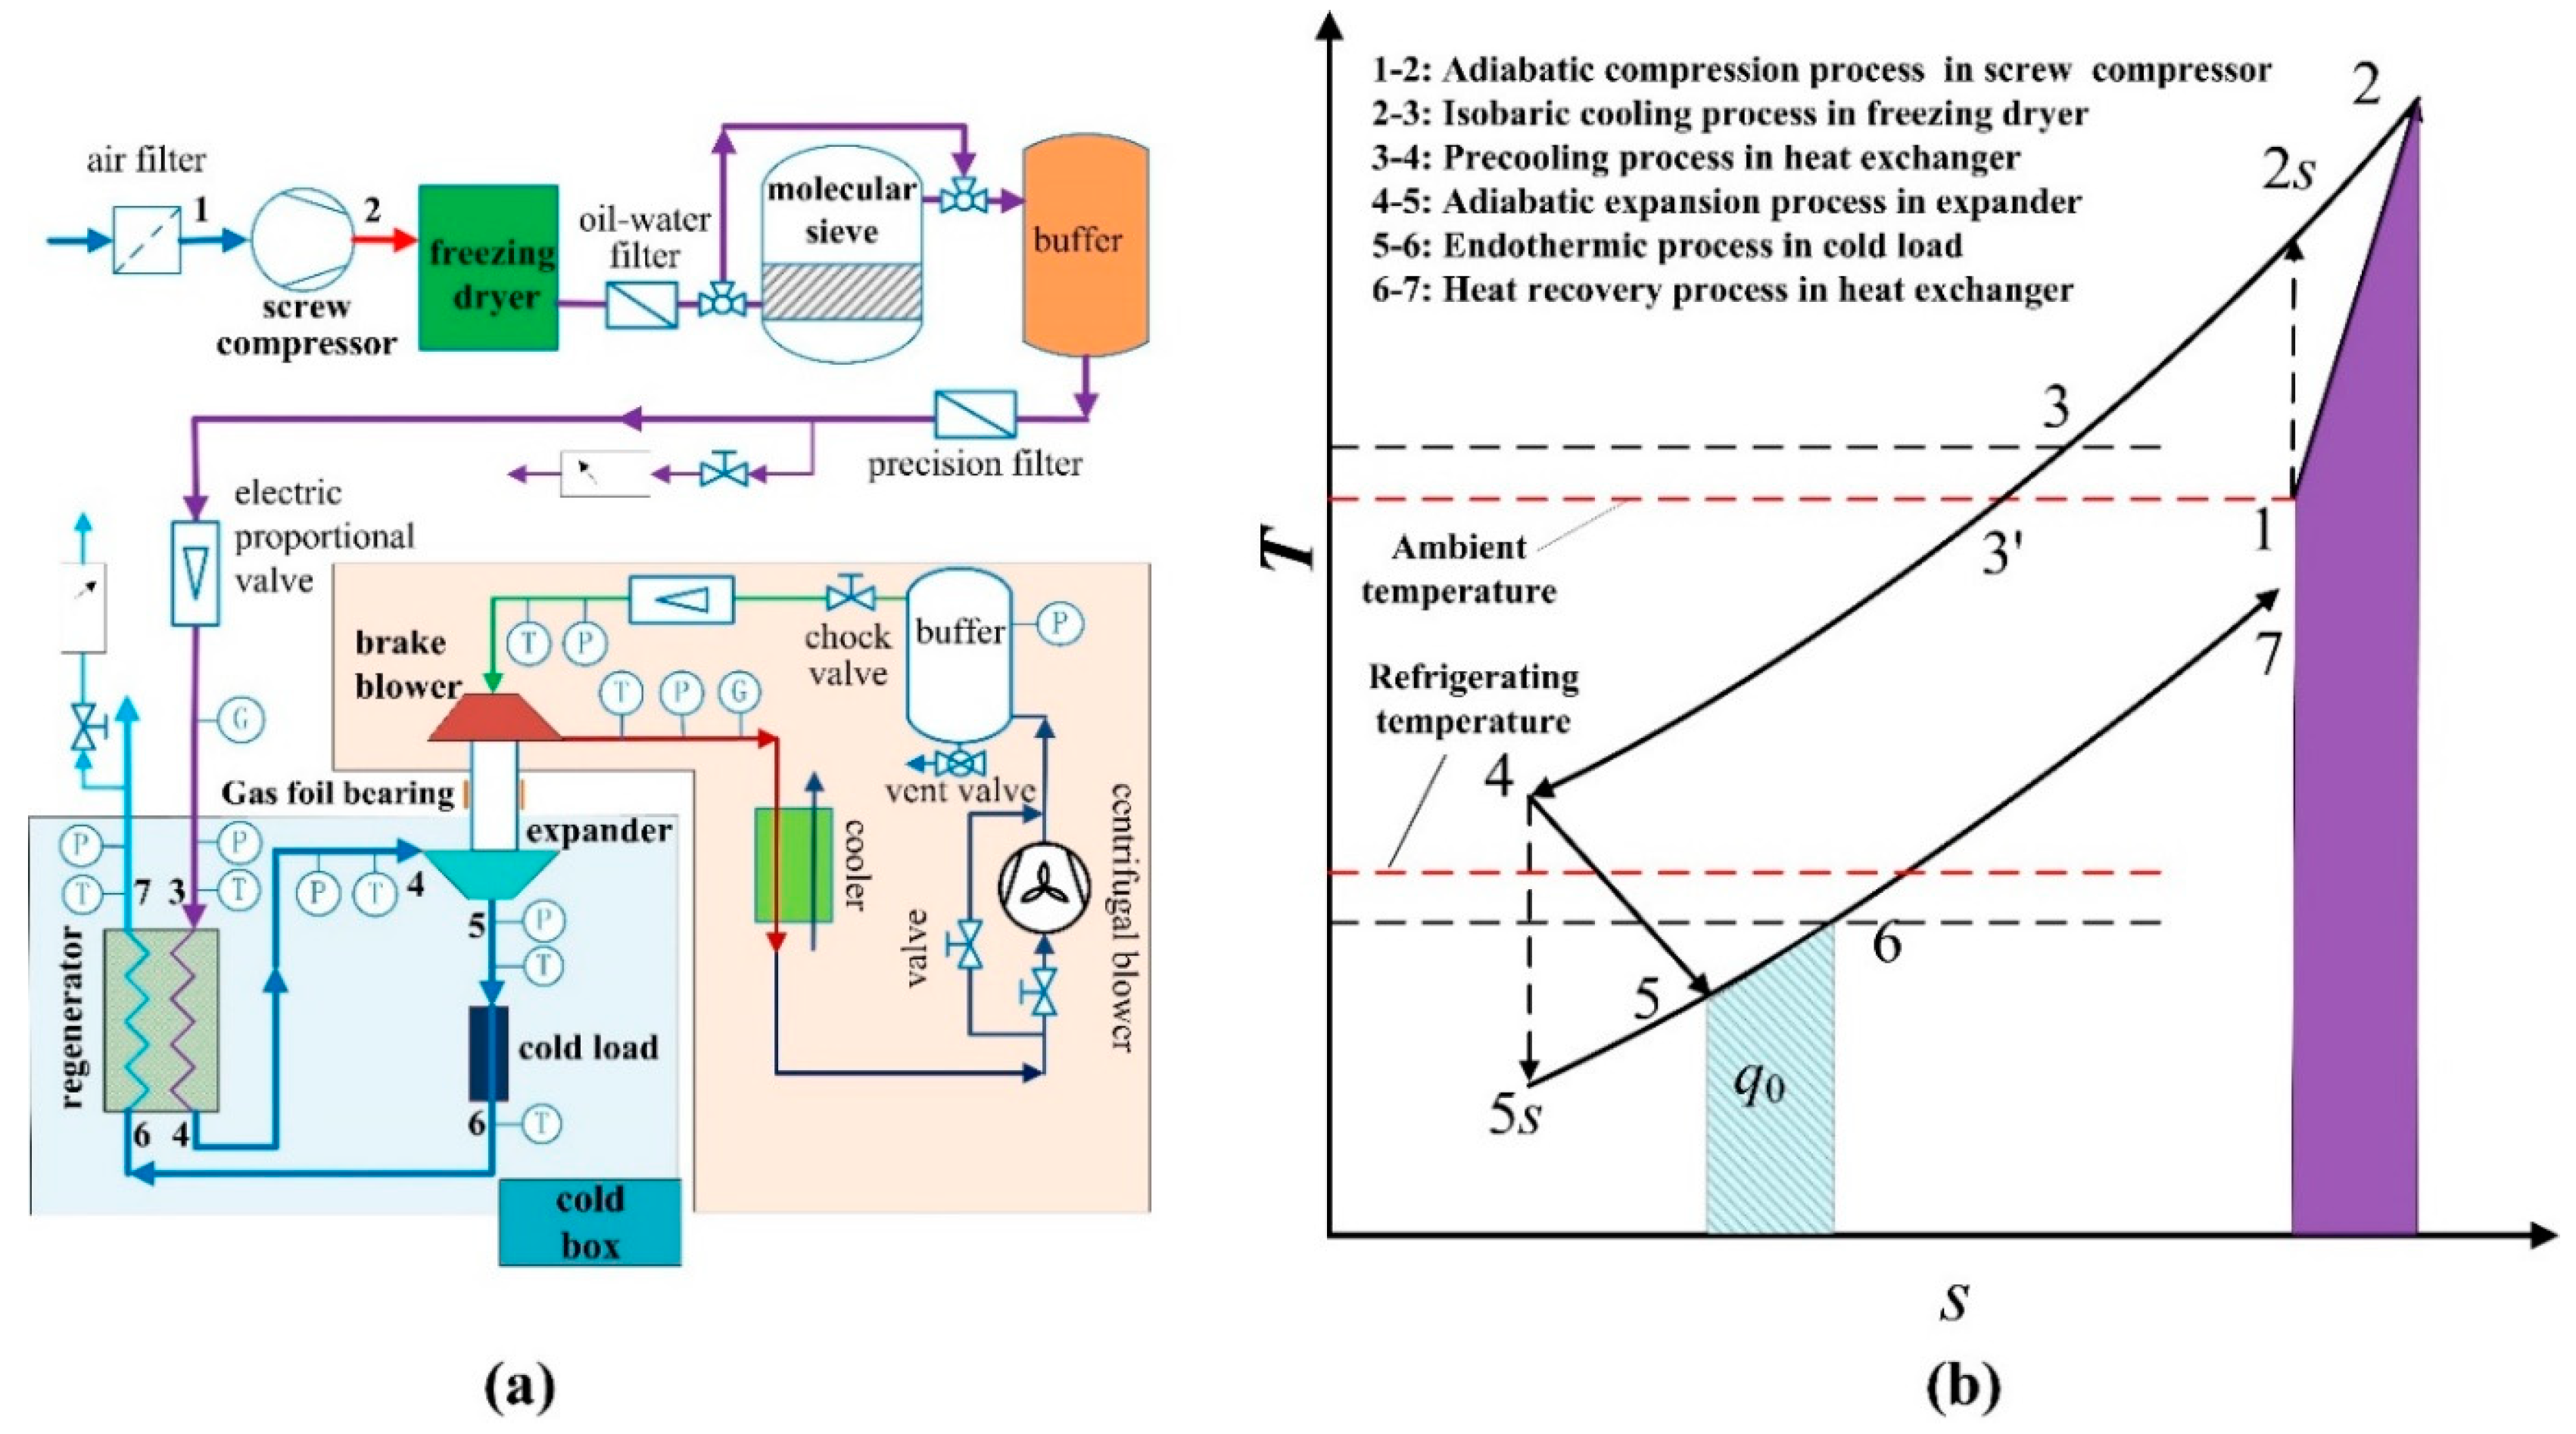
2.1. The Air Refrigerator

The flow chart and T-s diagram of the cryogenic reverse Brayton air refrigerator are presented in Figure 1. The front compressor was an injection screw air compressor and could provide 0.087 kg s−1 pressure air at 1.000 MPa. The freezing dryer, molecular sieve and the oil–water filter were used to reject the impurities, oil and water after the compressor. Two three way switching valves were equipped before and behind the molecular sieve. The air could be treated by the molecular sieve as needed. Two hygrometers were used to test the air humidity at the inlet and outlet of the heat exchanger. The turboexpander was supported by air foil bearings and can operates stably under the rotating speed of higher than 200 krpm. The hot end of turboexpander is a brake blower. An independent brake cycle is built for adjusting the turboexpander. The brake pressure can be regulated through the centrifugal blower, electric proportional valve, throttle vale, and vent valve. The expander (cold end of the turboexpander) was placed verticality in the cold box. The cold box has a vacuum degree of 0.01 Pa, which is used to insulate against cold loss and achieve low temperatures. The cold box includes the cryogenic heat exchanger, pipes, and a cold load (an electric heater). While in the present study, the refrigerator was free-load, and the refrigerator performance is evaluated using the ultimate temperature [6]. Due to advantages of compactness, light weight, high efficiency, small flow loss, the plate-fin heat exchanger is commonly applied in cryogenic refrigerators. Despite the advantages, it is easy to be plugged and the clean working medium is required.
In the test apparatus, the maximum uncertainty of temperatures was ± 0.1 K in the range of 55.0 K to 320.0 K. The full-scale uncertainty of the piezoresistive pressure sensor was ± 0.25% in the range of 0 to 1.000 MPa. The rotating speed of turboexpander was measured by an eddy current sensor through the Fourier transform. The measuring accuracy of the hygrometer was ± 0.8% in the range of 0–100% rh.

2.2. The Cryogenic Heat Exchanger

The structure sketch of the plate-fin heat exchanger is shown in Figure 2. The main design parameters of the heat exchanger are listed in Table 1. The feature of the plate-fin heat exchanger is the fin with secondary heat transfer. As the basic element of plate-fin heat exchanger, the fin increases the heat transfer area and makes the structure compact, resulting in the large specific surface area. The heat transfer efficiency is improved and the thermal resistance is reduced. Also, the strength of the heat exchanger is increased.
As the refrigerator runs, new air enters the system continuously. Although most of the water is removed by the precooling system, some of the water vapor still enters the system. In the operation process, the temperature at cold end of the heat exchanger might be below −100 °C or even lower for a long time. The frosting will occur when the wet air flows through the middle of the heat exchanger.
When the humidity of inlet air is low, a thin layer of frost is formed along the wall in the heat exchanger channel, as shown in Figure 2. Currently, the convection heat transfer coefficient decreases and thermal resistance increases. The performance of heat exchanger is greatly affected, and its outlet temperature arises. When the humidity is high, the thick frost layer will accumulate in the middle of the channel, which further reduces the heat transfer coefficient and increases the flow resistance. More seriously, the flow channel of heat exchanger will be blocked and the system will be unable to operate. Moreover, the pressure air at the hot side will carry frost particles into the expander. Because of high rotating speed, the blades of expansion wheel will be damaged by frost particles

2.3. The Cryogenic Heat Exchanger

2.3.1. Heat Transfer Characteristics

In the plate-fin heat exchanger, the energy is transferred mainly through the heat conduction inside the fin and heat convection between the fin and fluid. The fin efficiency ηf should be considered when the temperature difference of the primary heat transfer surface is applied in calculation. The fin efficiency ηf and surface efficiency ηs can be obtained as:
η f = tanh ( m l ) m l
where m is the fin parameter, l is the conduction distance.
η s = 1 A 2 A S ( 1 η f )
According to the structure and heat transfer features of the plate-fin heat exchanger, some assumptions were introduced for solving the problem easily [6,11]. There was a one-dimensional flow, and the distributions of fluid were even among channels. The heat from friction and the pressure drop gradient in the equation of momentum were negligible. These can be validated by the three-dimensional CFD method [10]. With the assumptions, conservation laws of the mass and momentum were satisfied, and only the energy conservation equation needed to be resolved [10,11].
With numerical methods of flow and heat transfer, a transient simulation method of the plate-fin heat exchanger was newly proposed [6]. In the model, influences of the cold loss, axial conduction, and thermal capacity were all considered. The methods of control volume integral and finite difference were applied to disperse the partial differential equations.
The convective heat transfer coefficient and pressure loss in the heat exchanger can be calculated as [6]:
h = c p μ Pr 2 / 3 1 D h j Re = j / Pr 2 / 3 c p G
Δ p = 4 f l D h G 2 2 ρ
where Pr = c p μ / λ , Δ p is the pressure loss (Pa).
The friction factor f and heat transfer factor j used for the plate-fin heat exchanger could be calculated as in [6,11]. The heat exchanger was of two-fluid and there were 8 sets inside it. Thus, only a cold fluid and a hot fluid and the parting plate between them were calculated to speed up the calculation.
The finite volume method was adopted to disperse the energy equations. The fluid and plate areas were divided with uniform grids. The grids of the heat exchanger in the simulation are presented in Figure 3. As shown in Figure 3, the heat transfer inside the plates consists of the heat convection between the parting plate and fluid and the heat conduction inside the plates. The heat transfer could be calculated through the non-steady equation of heat conduction, as shown in Equation (5). In the differential equation, the heat convection could be presented as a source term.
T τ = λ ρ c 2 T 2 x + Φ ρ c
Integrating Equation (5) in the time interval Δ τ and the volume shown in Figure 5, the expression of integral form is as below:
x x + Δ x τ τ + Δ τ T τ d τ d x = τ τ + Δ τ x x + Δ x 2 T 2 x d x d τ + τ τ + Δ τ x x + Δ x Φ i d x d τ
For integrating the diffusion term, the first derivative was changed explicitly with time. The heat convection between the plate and fluid was presented as the heat source of the control volume. Using the lumped parameter method, the following equation is obtained [6]:
ρ w c p , w ( T w , i j + 1 T w , i j ) Δ τ = λ w ( T w , i + 1 j 2 T w , i j + T w , i 1 j ) Δ x 2 + 1 V w [ h h , i j b h , i ( T h , i j T w , i j ) + h c , i j b c , i ( T c , i j T w , i j ) ]
where Vw is a single control volume (m3), hh,i is the coefficient of convective heat transfer in hot side (W m−2 K−1), bh,i is the area of convective heat transfer in hot side (m2), hc,i is the coefficient of convective heat transfer in cold side (W m−2 K−1), and bc,i is the area of convective heat transfer in cold side (m2).
As shown in Equation (7), the diffusion term is discretized into a central difference scheme. Also, it has a 2-order intercept precision.
The heat transfer of the fluid is the transient heat convection. The transient equation of convection–diffusion heat transfer is:
ρ T τ + ρ u T x = x ( λ c T x ) + S
The energy transfer of the control volume in fluid usually contains the convection term cause by flow, the diffusion term caused by conduction, and the source term. The heat transfers of the hot fluid in the moment of j and j + 1 are shown in Figure 4. Compared with the one in [6], the energy flow conditions in fluid area were improved with both the blue and cyan bars to reflect the convection flow more clearly. The heat coming in and out of the control volume was transferred through the convective flow. The heat transited between the fluid and the wall could be recognized as a source item. According to the physical properties of air, the Peclet Number is great under low velocity. Therefore, the effect of diffusion could be ignored and the first term on the right side of Equation (9) could be omitted.
When the numerical calculation is carried out, the transient, convection and source terms should all be discretized both temporally and spatially. Equation (8) could be expressed as:
x x + Δ x τ τ + Δ τ ρ T τ d τ d x = τ τ + Δ τ x x + Δ x ρ u T x d x d τ + τ τ + Δ τ x x + Δ x S d x d τ = τ τ + Δ τ x x + Δ x ρ u T x d x d τ + τ τ + Δ τ x x + Δ x b i h h , i ( T w , i T h , i ) c p , h a h Δ x d x d τ
The second order windward format was used to disperse the convection term. Using the time explicit, the transient equation of convection–diffusion heat transfer was dispersed through the method of finite difference [6]:
a h c p , h ( ρ h , i j + 1 T h , i j + 1 T h , i j ρ h , i j ) Δ τ = m j c p , h ( 3 T h , i j 4 T h , i 1 j + T h , i 2 j ) 2 Δ x + h h , i j b h , i ( T w , i j T h , i j ) Δ x
where m j = ρ h , i j u h , i j a h ; i = 3,…, n; j = 1,2, …, m − 1.
The equation of convection–diffusion heat transfer of the cold fluid has the same form as that of the hot fluid. According to the above analysis, the transient heat transfer conditions of the plate-fin heat exchanger could be calculated numerically. When the characteristics of frost formation are obtained, we could connect it with the heat transfer characteristics, and establish a transient heat and mass transfer model with frost formation in the heat exchanger.
In the transient numerical simulation, the Courant–Friedrichs–Lewy (CFL) condition must be considered for the compute convergence and numerical stability [23,24]. The time step must be properly selected and the ratio of the time and space mesh should not be too large in the differential equation. As the explicit upwind format was adopted in the hyperbolic equations, the CFL number CFL should be less than 1.0. CFL is expressed as:
C F L = u Δ τ Δ x
where u is the local fluid velocity at the grid (m s−1), Δ τ is the time step at the grid (s), Δ x is the spatial step at the grid (m).

2.3.2. Property Characteristics of Frost Layer

The study of frost formation mainly consists of two aspects: one is to analyze the formation and growth of the whole frost layer from a macro perspective. Another is to analyze the nucleation and growth of single ice crystals from a microscopic perspective. From a macro perspective, variations of the frost density, thermal conductivity, and thickness are studied. Because the research mainly focuses the overall effect of frosting on the system, the macro analysis was conducted in the present study.
In order to solve the heat and mass transfer of the frost layer, it is necessary to determine the relevant thermal parameters of the frost layer in combination with boundary conditions. The structure of frost layer is extremely complex, and the properties of the frost layer change with the time, boundary conditions, and locations of the frosting. In the present study, the experimental correlations were adopted for predict the distribution and variation of the frost property. The density and thermal conductivity are two important physical properties of frost layer. Frost is a soft and loose pore structure composed of fine ice crystals. The average density of frost layer is generally considered in calculation. Based on experimental data, Tao et al. [25] put forward a widely used experimental correlation of frost density, in which the density was considered as a function of the temperature and wind speed on the layer surface. In this paper, the formula was applied to calculate the density of the frost layer. Many experimental correlations of the frost density were related to the cold surface temperature of above −25 °C, which might be enough to calculated the frosting condition in evaporators. Whereas, in a cryogenic heat exchanger, the wall temperature is much low., When the temperature of the cold surface is low, the frost will grow rapidly and the physical properties stabilized soon [26,27]. Then the density of the frost layer under cryogenic condition was given according to [28] and is expressed as below:
ρ f r = 340 | T w | 0.455 + u 0 25   ° C < T w < 5   ° C ρ f r = 180 T w < 25   ° C
where ρ f r is the density of the frost layer (kg m−3), T w is the local temperature of the cold surface (°C), u 0 is the velocity of mainstream (m s−1).
The heat transfer within the frost layer includes the thermal conduction in ice crystal, convection heat transfer of wet air, latent heat transfer caused by the phase change of water vapor, etc. The thermal conductivity of frost layer refers to the effective thermal conductivity including the above heat transfer forms. The structure of frost layer directly determines the proportion of various heat transfer forms and has obvious effects on the thermal conductivity. The simplest parameter reflecting the structure of frost layer is its average density. The average density is influenced by both the frost quality and the thickness of the frost layer in growth direction. Therefore, the thermal conductivity can be considered as a function of the average density. Many experiments were conducted to find out the relationship between the two parameters. The formula proposed by Sanders et al. [29] was used with its accuracy and adaptability, as shown below:
λ f r = 0.001202 ρ f r 0.963
where λ f r is the thermal conductivity of the frost layer (W m−1 K−1).
The frosting process of wet air on cold surface is extremely complex, which is accompanied by phase transitions of gas-liquid, liquid-solid, gas-solid and moving boundary problems. Using the numerical heat transfer and computational fluid dynamics to illustrate the frosting process is one of the main research methods [30]. In the method, the semiempirical correlations of the frost properties are essential, which affects the accuracy of the simulation. Therefore, in-depth study of the corrections is required in the future, and the visible experiment is necessary to establish more accurate semiempirical correlations in such a cryogenic plate-fin heat exchanger.

3. Frost Model of the Cryogenic Heat Exchange

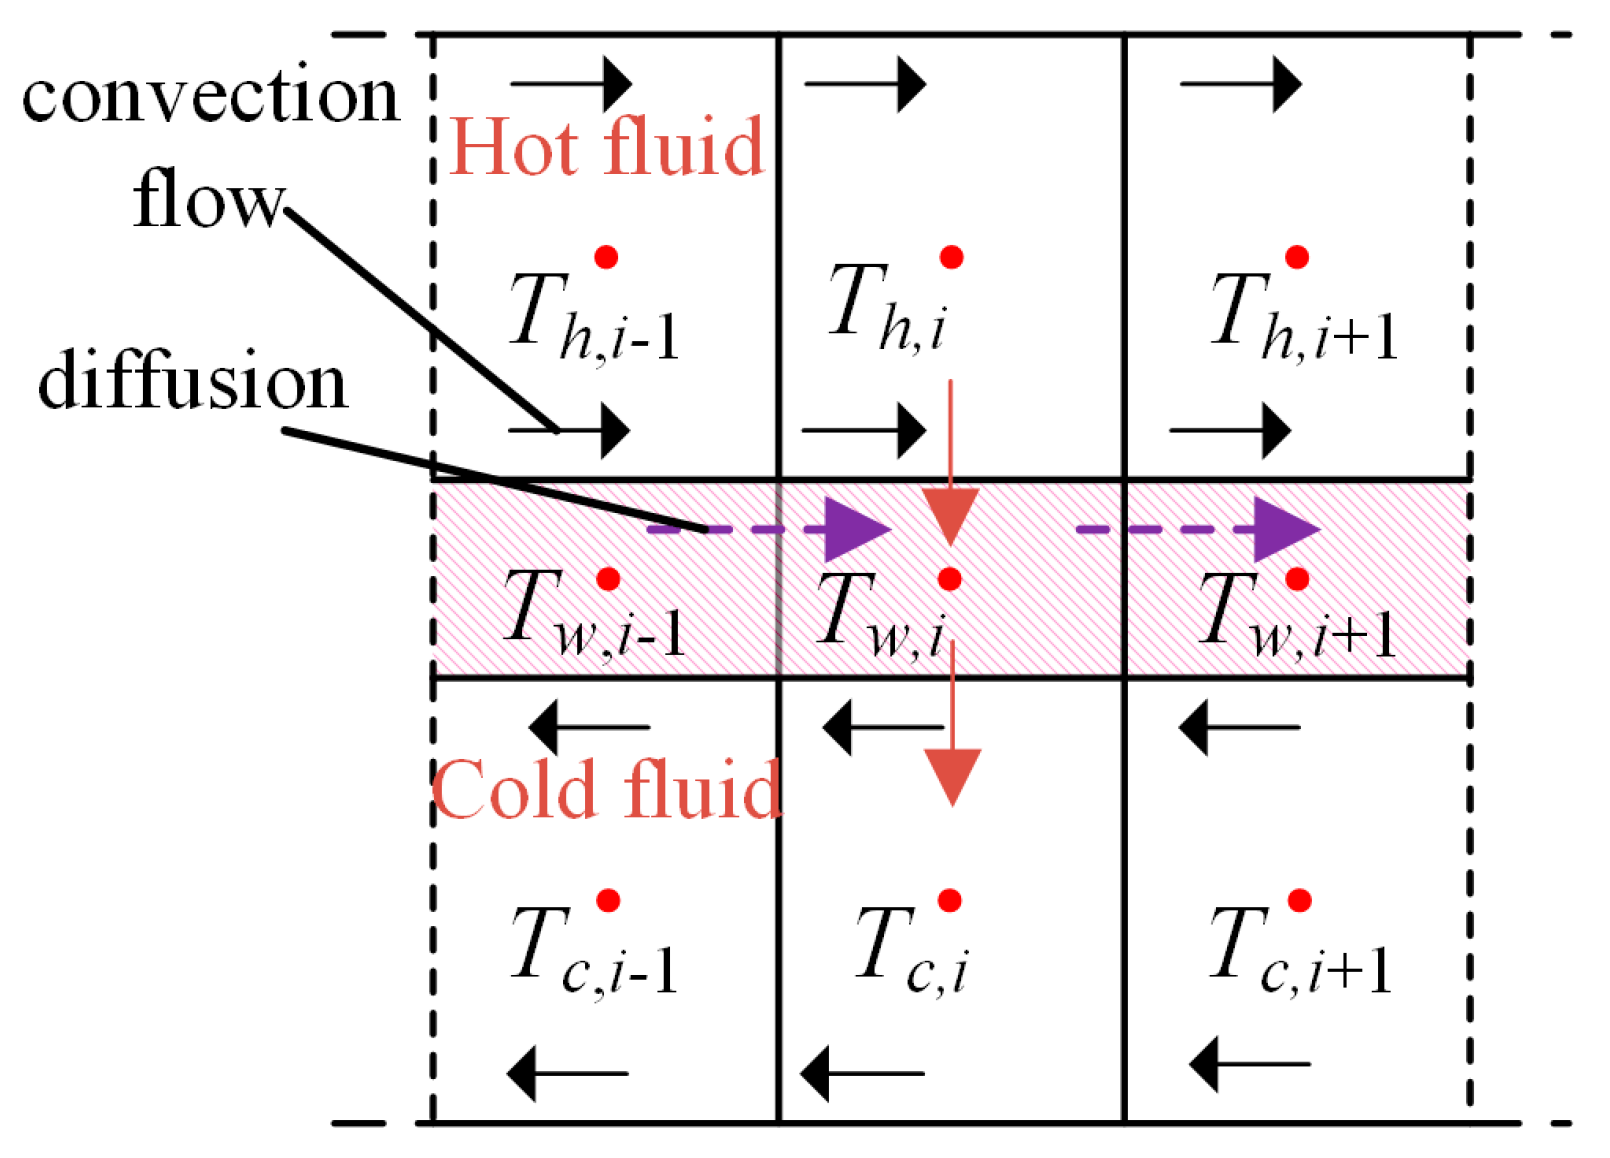
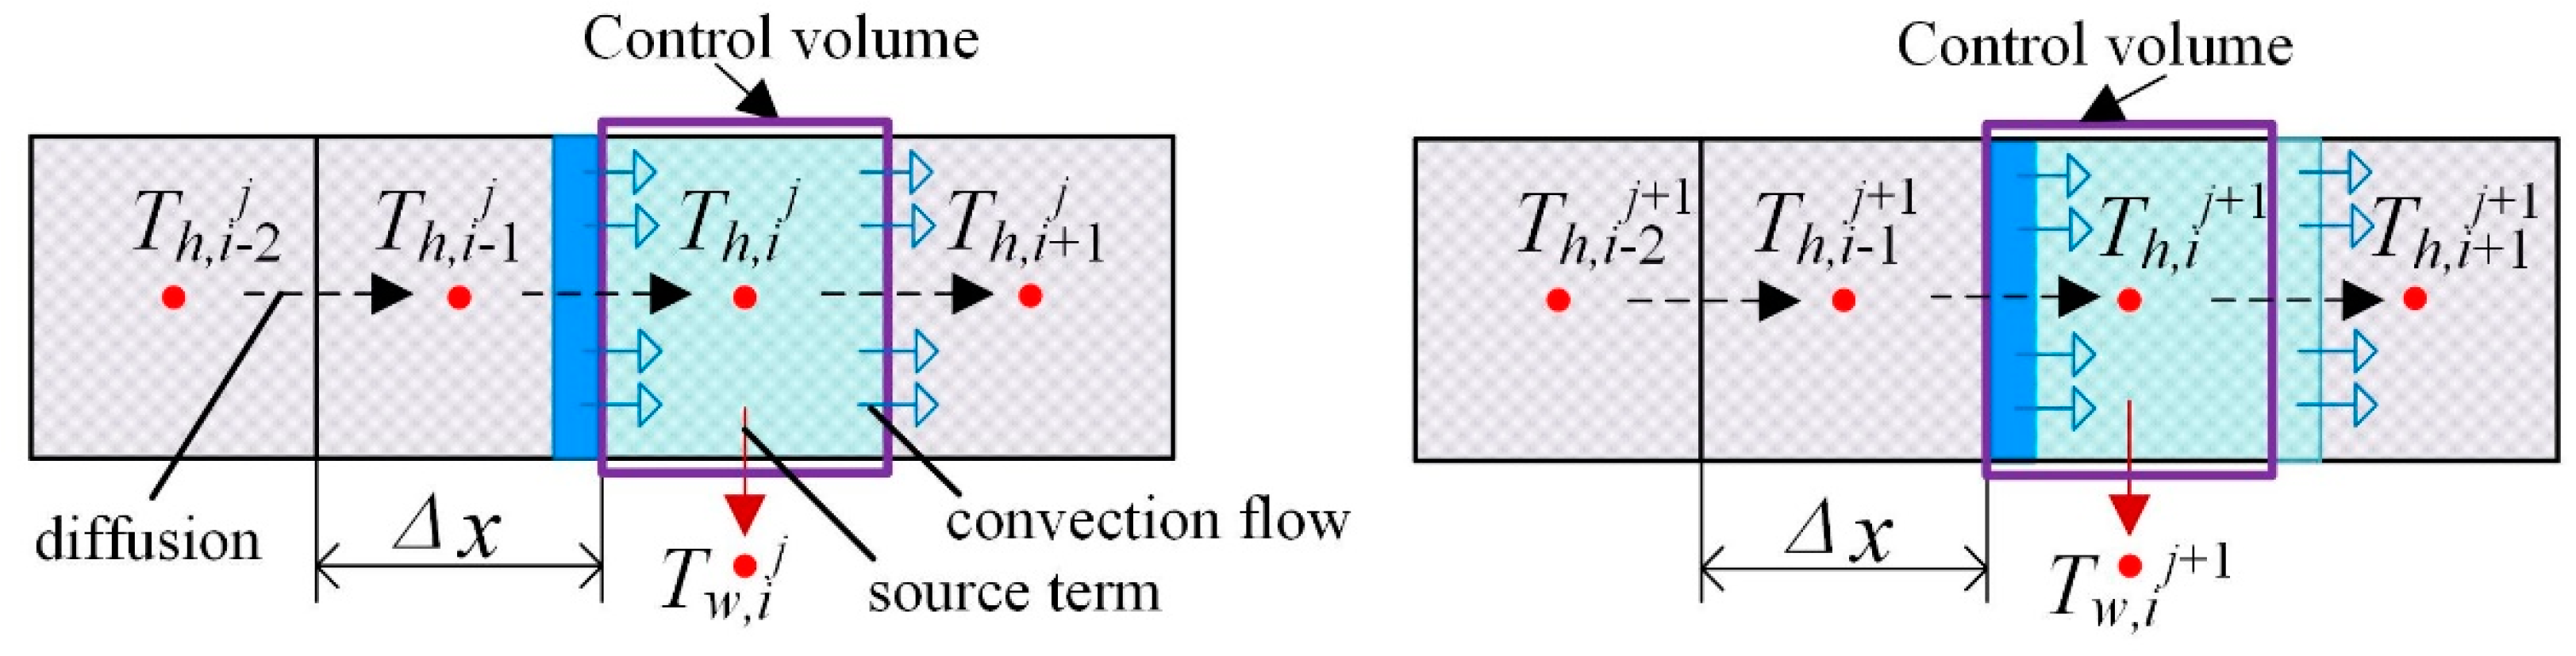
3.1. Heat and Mass Transfer During Frosting

Based on computational fluid dynamics and numerical heat transfer, the semi-empirical quasi-steady state frosting model was adopted for calculating frost growth. The heat transfer coefficient is calculated firstly and the corresponding heat transfer number is obtained. Then the mass transfer number could be calculated according to the heat transfer number and analogy formula. The total frosting amount is gained and the average thickness of the frosting layer at different times could be obtained according to variations of the frost layer density. In order to simplify the simulation, the following assumptions are made:
(1)
Frosting process in the heat exchanger is quasi-steady.
(2)
Frosting occurs in the hot side of the heat exchanger, the frost layer is filled with the entire fin spacing, and the frost is evenly distributed in the same control volume.
(3)
The density and thermal conductivity of frost layer are characterized by average values.
(4)
The heat transfer in the frost layer is one-dimensional heat conduction along the direction of thickness.
In the process of frosting, the frost layer can grow continuously as the water vapor in the air moves towards the cold surface and condenses under the action of transferring pressure.
m ˙ f r = M w h m ( C A h C A s )
For the water vapor on the surface of frost layer is rare, it could be ignored. With the ideal gas state equation, the mass transfer equation could be expressed as:
m ˙ f r = 0.018 h m p a R T a
Then the key to calculate mass transfer is to determine the coefficient h m . The determination of h m is complicated, which is related to the fluid properties, flow rate, and the geometrical shape and roughness of the wall surface. When the fluid flows through the object surface, there is mass and heat exchange between the fluid and the surface. According to the analogy theory of heat and mass transfer, the mass transfer coefficient can be calculated by analogy from the heat transfer coefficient. The well-known Lewis analogy theory was introduced. The Lewis relation was based on the analogy of heat and mass transfer [31]:
h m h = Le 2 3 ρ c p = ( a / D ) 2 3 ρ c p
where ρ is the density of wet air (kg m−3), c p is the specific heat capacity of wet air (J kg−1 K−1).
According to Equations (15) and (16), m ˙ f r can be expressed as:
m ˙ f r = 0.018 h ( a / D ) 2 3 ρ c p p a R T a
When the water vapor concentration in wet air is expressed in terms of moisture content, the above equation is as follows:
m ˙ f r = 0.018 h ( a / D ) 2 3 ρ c p p h d a ( 0.622 + d a ) R T a
The heat exchange between the frost and wet air is composed of two parts: one is the sensible heat, which is the convection heat transfer between the frost layer and the wet air. The other is the latent heat, which is released by the condensation of water from mass transfer. Therefore, the total heat exchange amount is:
q a = h h ( T h T s ) + m ˙ f r γ f r
The diffusion heat transfer coefficient h s , i is introduced to calculate the latent heat flow:
q a = ( h h , i + h s , i ) ( T h , i T s , i ) = ( h h , i + h s , i ) Δ T s , i
h s , i = m ˙ f r γ f r T h , i T s , i
For frosting areas, the control equation is discretized by the control volume balance method. The control volume balance method directly applies the conservation law to the control volume. It’s a deformation and supplement of the control volume integral method.
ρ f r , i j + 1 c p , f r b h , i y f r , i j + 1 T f r , i j + 1 + T w , i j + 1 2 ρ f r , i j c p , f r b h , i y f r , i j T f r , i j + T w , i j 2 = ( h h , i j + h s , i j ) b h , i ( T h , i j T s , i j ) Δ τ λ f r , i j y f r , i j ( T s , i j T w , i j ) b h , i Δ τ
where cp,fr is the specific heat capacity of frost (W m−1 K−1), yfr,i is the thickness of frost layer at the ith grid (m).
In each Δ τ , the frost layer thickness is recalculated as:
y f r , i j + 1 = ( ρ f r , i j y f r , i j + m ˙ f r , i j Δ τ ) / ρ f r , i j + 1
The influence of moisture precipitation on the quality of thermal fluid could be neglected when calculating the temperature change of thermal fluid. In the control volume of hot fluid corresponding to frost layer, the convection heat transfer equation is:
a h c p , h ( ρ h , i j + 1 T h , i j + 1 T h , i j ρ h , i j ) Δ τ = q k c p , h ( 3 T h , i j 4 T h , i 1 j + T h , i 2 j ) 2 Δ x + ( h h , i j + h s , i j ) b h , i ( T s , i j T h , i j ) Δ x
In the control volume of partition corresponding to frost layer, the non-steady heat conduction equation becomes:
ρ w c p , w ( T w , i j + 1 T w , i j ) Δ τ = λ ( T w , i + 1 j 2 T w , i j + T w , i 1 j ) Δ x 2 + 1 V w [ λ f r , i j b f r , i y f r , i j ( T s , i j T w , i j ) + h c , i j b c , i j ( T c , i j T w , i j ) ]

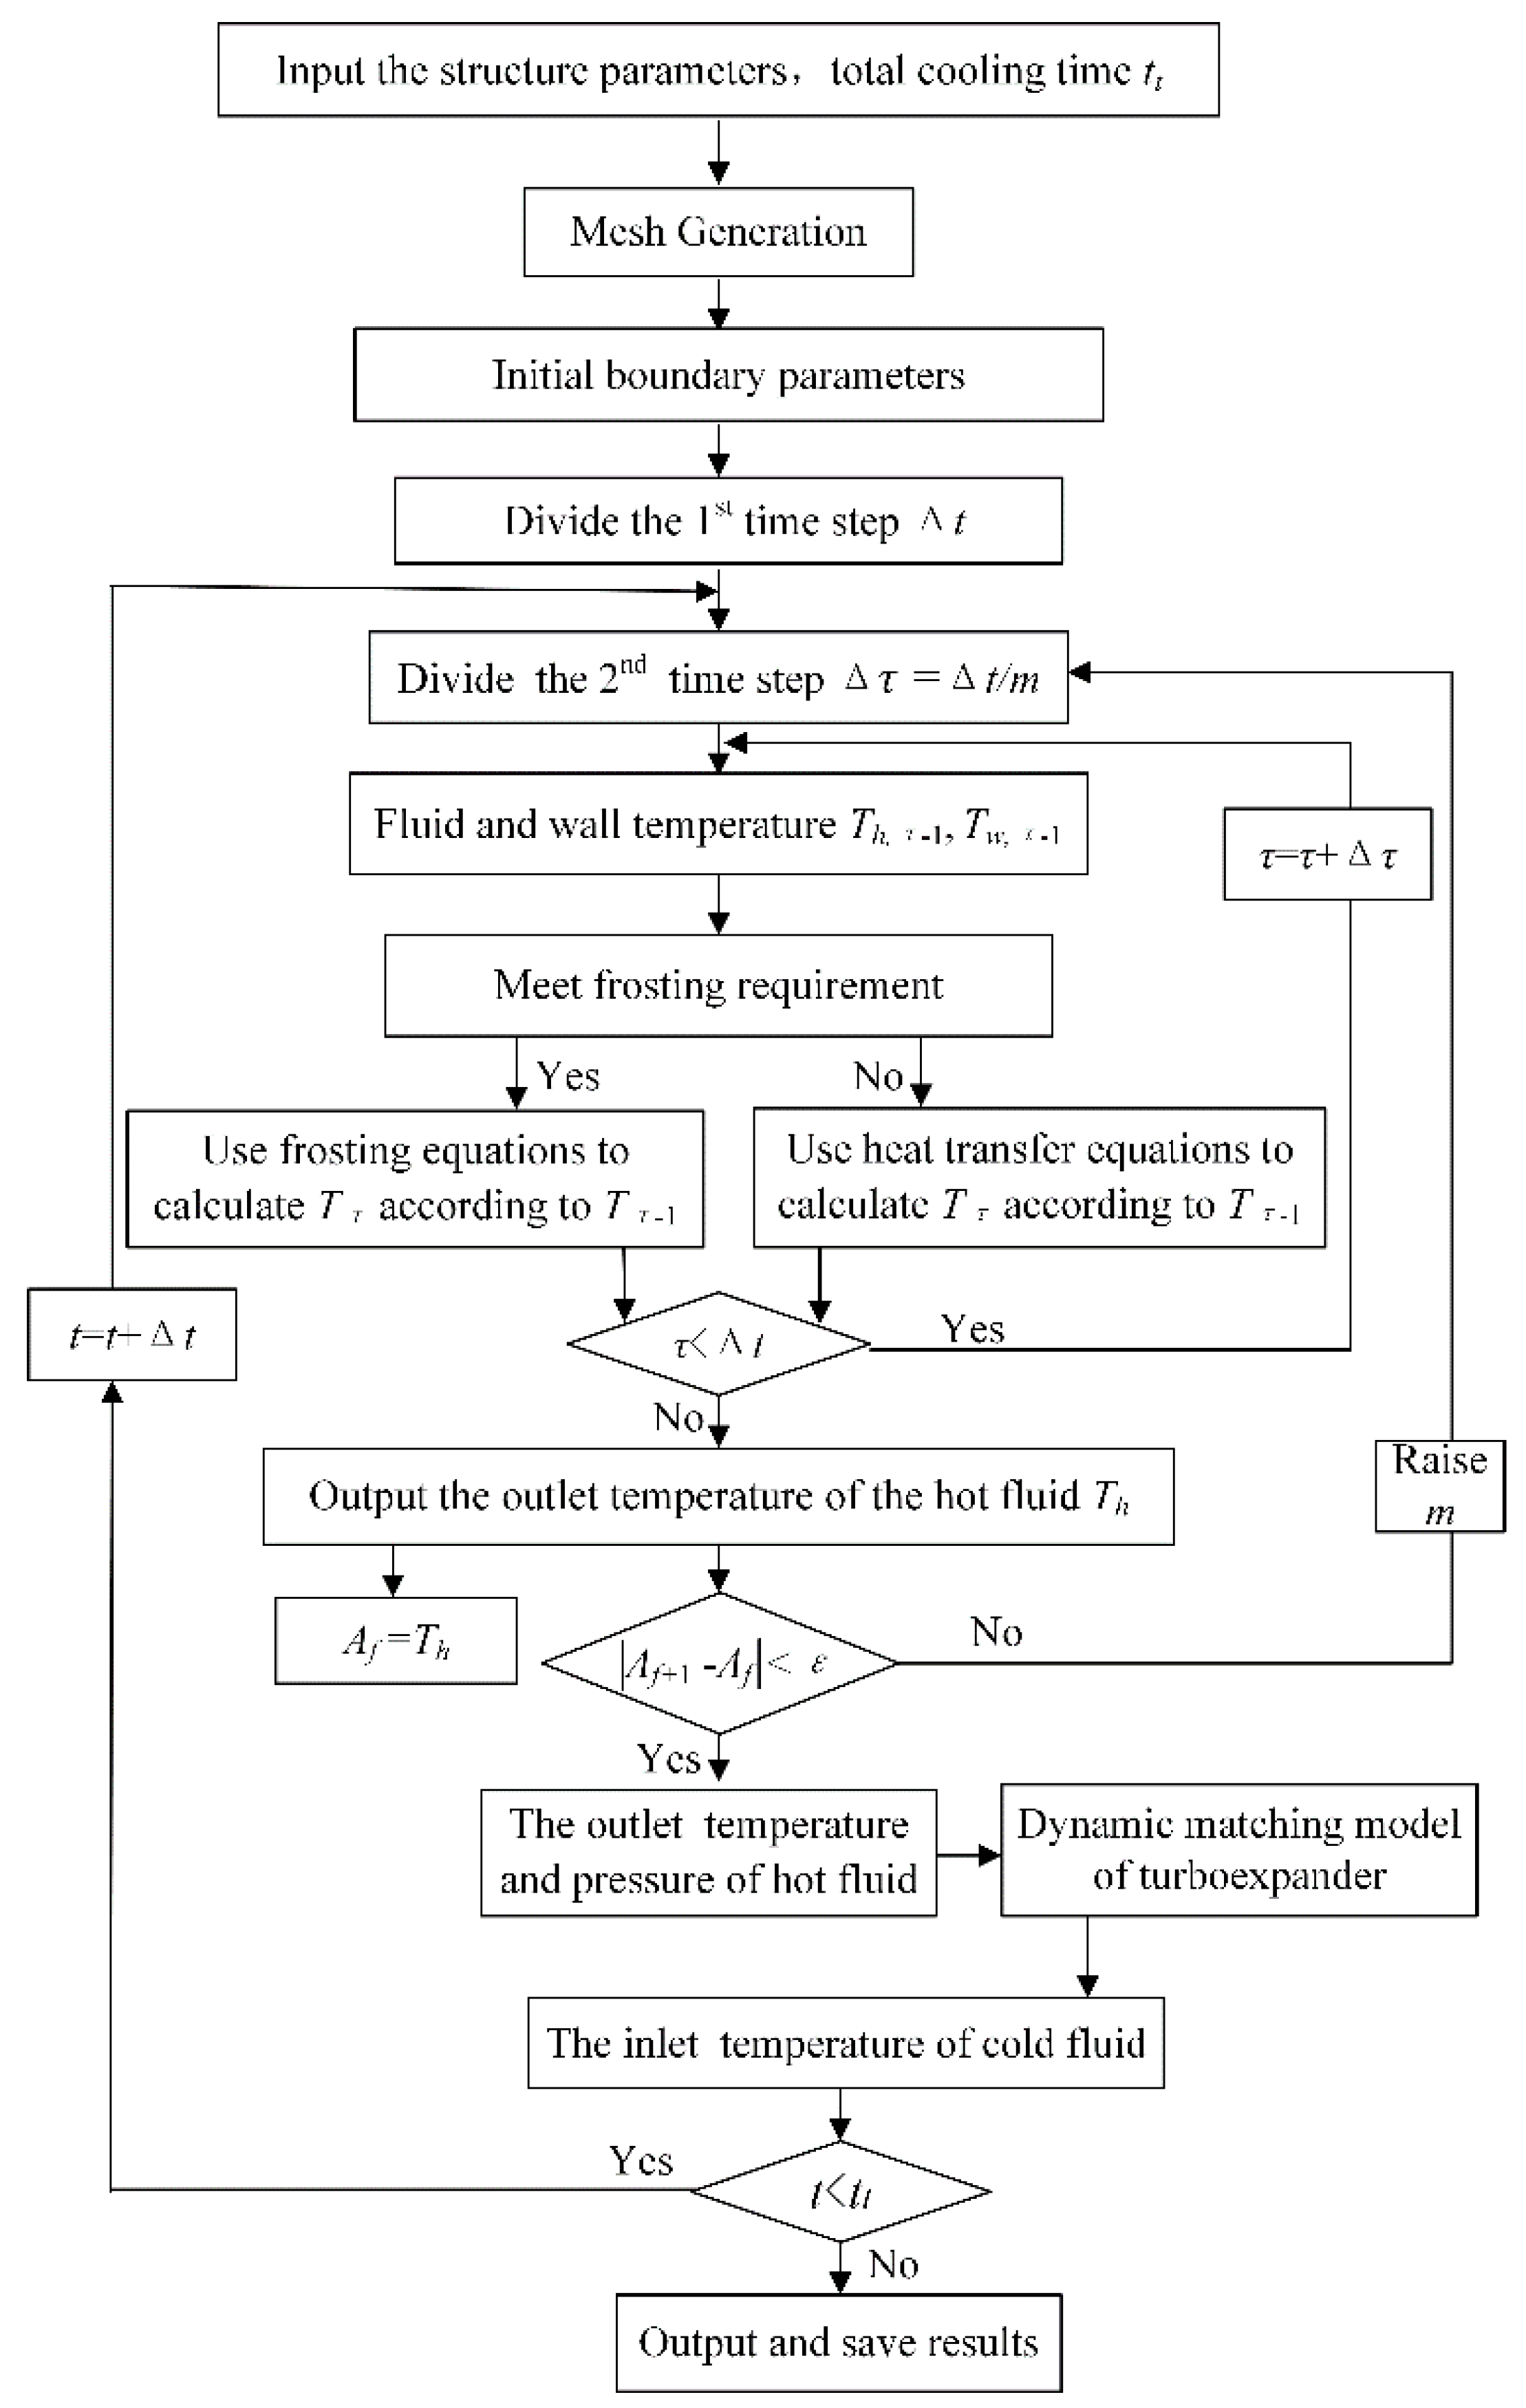
3.2. Build of the Frosting Model

In a cryogenic air refrigerator, there are mutual interactions between the expander and heat exchanger, which makes the boundary conditions of the heat exchanger constantly changing in cooling process. Thus, the heat and mass transfer characteristics of the cryogenic heat exchanger becomes more complex. The method of dual non-steady time steps was proposed to describe the transient flow and heat transfer characteristics of the cryogenic air refrigerator. Two components with different time scales were matched dynamically and effectively under the method. With the total cooling time of tt, the 1st time step is divided to Δ t . In every Δ t , the expander inlet temperature varies little. Given the relation of expansion, the expander outlet temperature could be assumed as constant, which means the inlet temperature of the cold fluid in heat exchanger is certain in Δ t . Then with Δ t as the total time, the 2nd time step is divided to Δ τ . The transient heat and mass transfer characteristic are calculated by Δ τ . At each spatial node, the frosting condition is first determined, then the corresponding control equations are selected to resolve the problem. Through the transient calculation, the outlet temperature of the hot fluid in the heat exchanger is gain at the end of Δ t . That is, the inlet temperature of expander is got. Thus, the outlet temperature of expander could be obtained according to the dynamic matching model of expander [4,6]. Then the one is treated as the cold fluid inlet temperature in next Δ t . Repeating this, the transient heat and mass transfer characteristics during frosting are obtained, as shown in Figure 5.
In the reverse Brayton air refrigerator, because the flow area of heat exchanger is great and the expander is fitted with nozzles, the mass flow rate is restricted by the boundary parameters of expander. The heat exchanger outlet pressure is approximately equal to the ambient one. The expander outlet pressure could be calculated through heat and mass transfer simulation. As analyzed above, the mass flow rate of refrigerator is recognized as a constant in Δ t . It is computed using the inlet temperature and pressure, and outlet pressure of expander [4,6].

4. Result and Discussion

4.1. Experimental Study

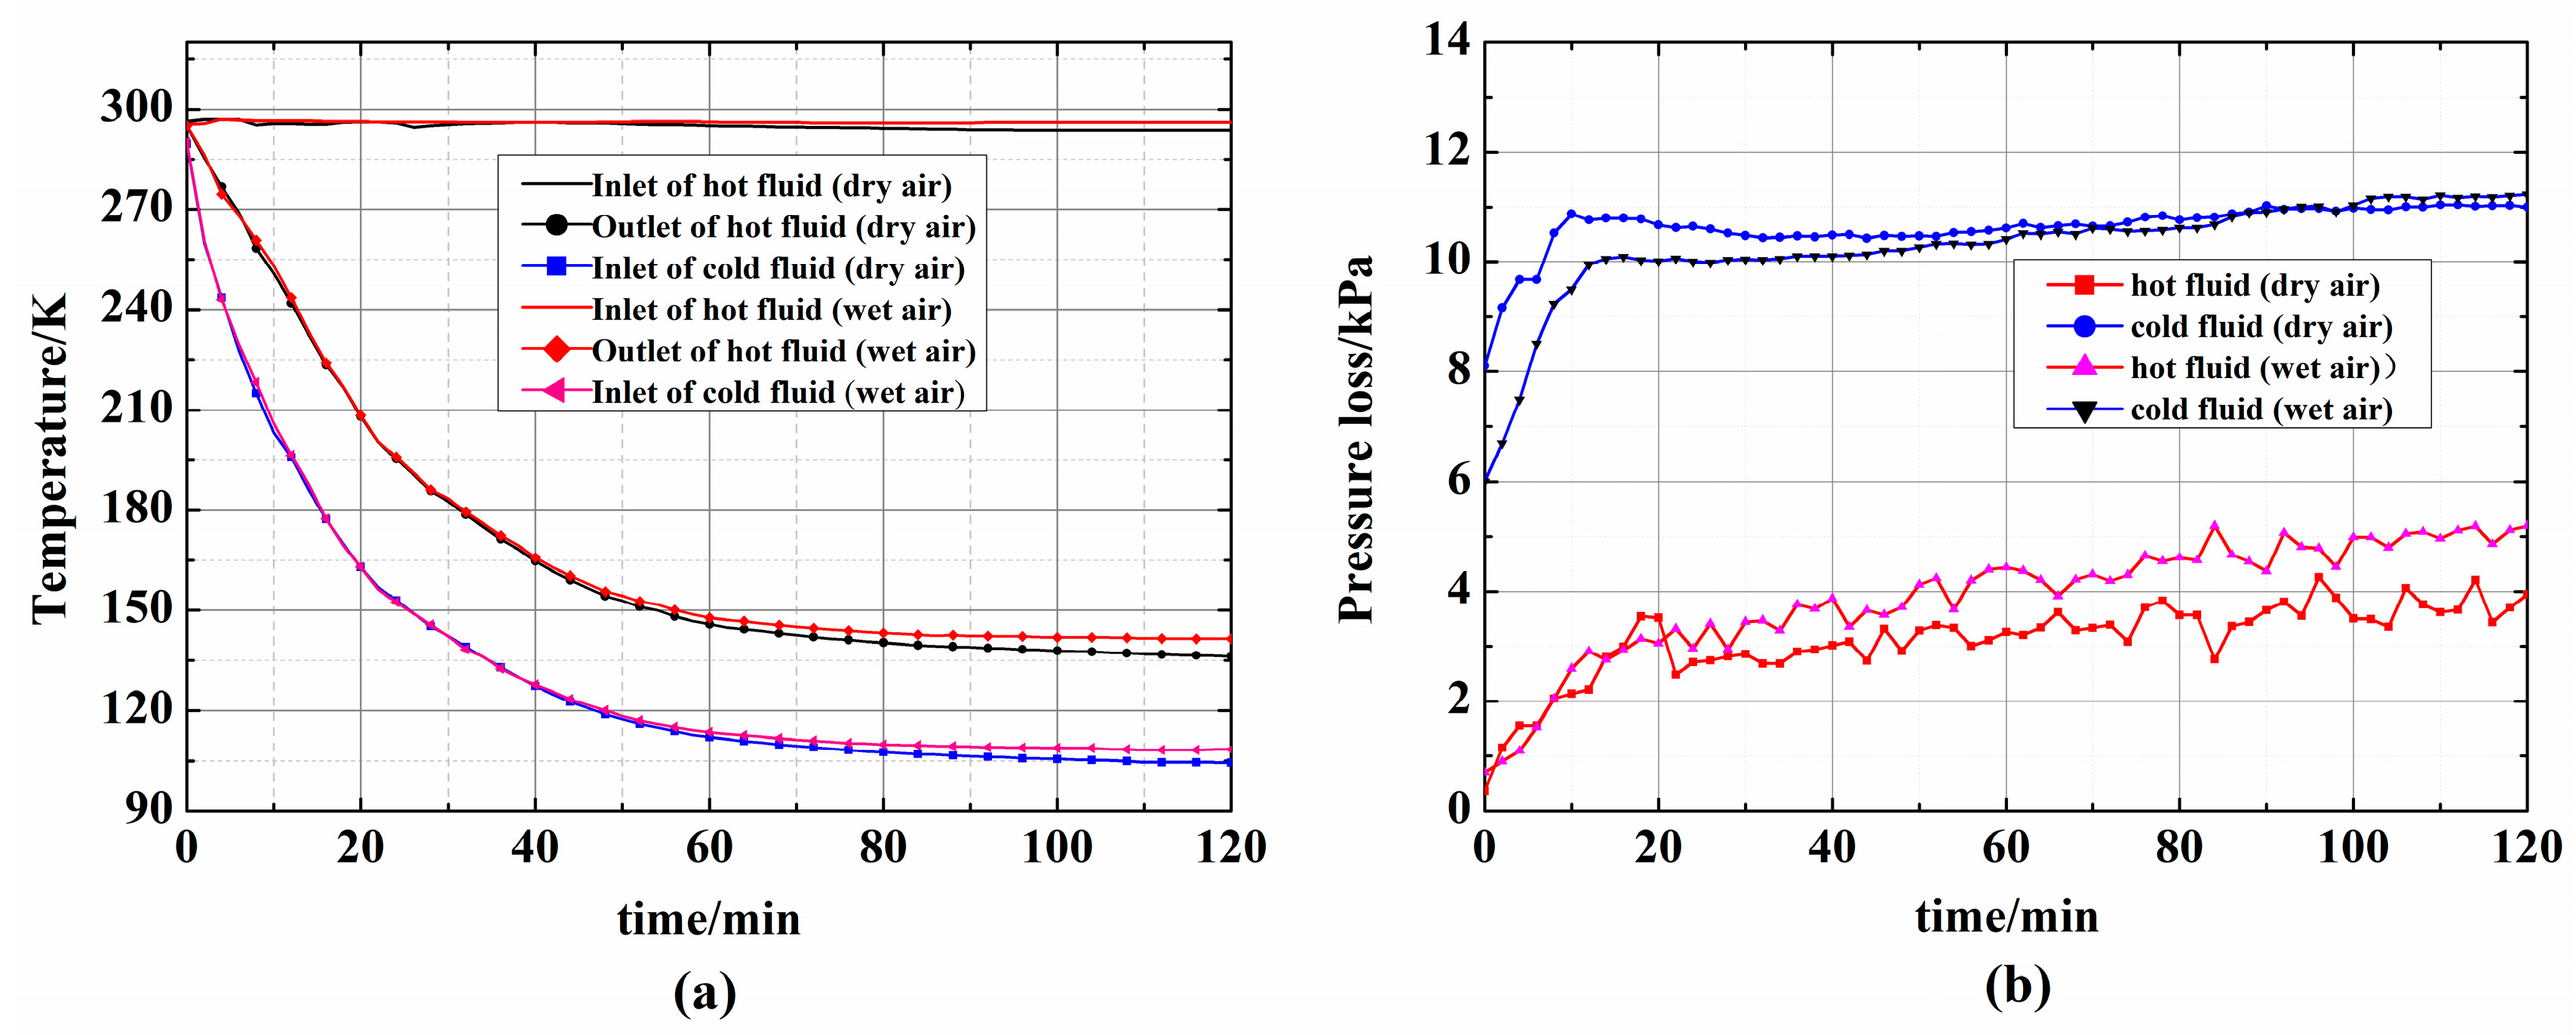
4.1.1. Heat Transfer Characteristics

To investigate the effect of air humidity on the refrigerator, the experimental comparison of dry and wet air was carried out under the same operating conditions. As shown in Figure 1a, when the freezing dryer and molecular sieve were working, the tested moisture content at inlet of the heat exchanger was lower than 0.0075 g (kg dry air)−1. Therefore, the air could be considered as dry at this time. When the freezing dryer and the molecular sieve were off, most of the moisture in the air was removed by the oil–water filter. Currently, the inlet air of the heat exchanger was wet with small amounts of moisture. Operation parameters of the wet and dry air experiments are shown in Table 2. Despite the inlet air humidity, the inlet and outlet boundary conditions of the heat exchanger in two tests were consistent, which were the design parameters of the heat exchanger.
As shown in Figure 6, the cooling curves of two conditions basically coincide in the initial stage of cooling. As the cooling went on, the inlet and outlet temperatures of the heat exchanger with wet air were gradually higher than those under the dry air condition after about 50 mins. At the 120th min, in the wet air condition, temperatures of the hot fluid outlet and cold fluid inlet were 5.1 K and 3.9 K higher than the other ones. As shown in Figure 6b, the pressure losses at the hot side of the heat exchanger were higher with the wet air applied. That is because there was frosting in the hot channel, which increased the flow resistance. The pressure loses at the cold side were nearly the same under two different conditions. It showed that even the frosting might occur in the cold side, the phenomena were not obvious. Therefore, it can be concluded that the assumption of frost formation in the hot side was reasonable.

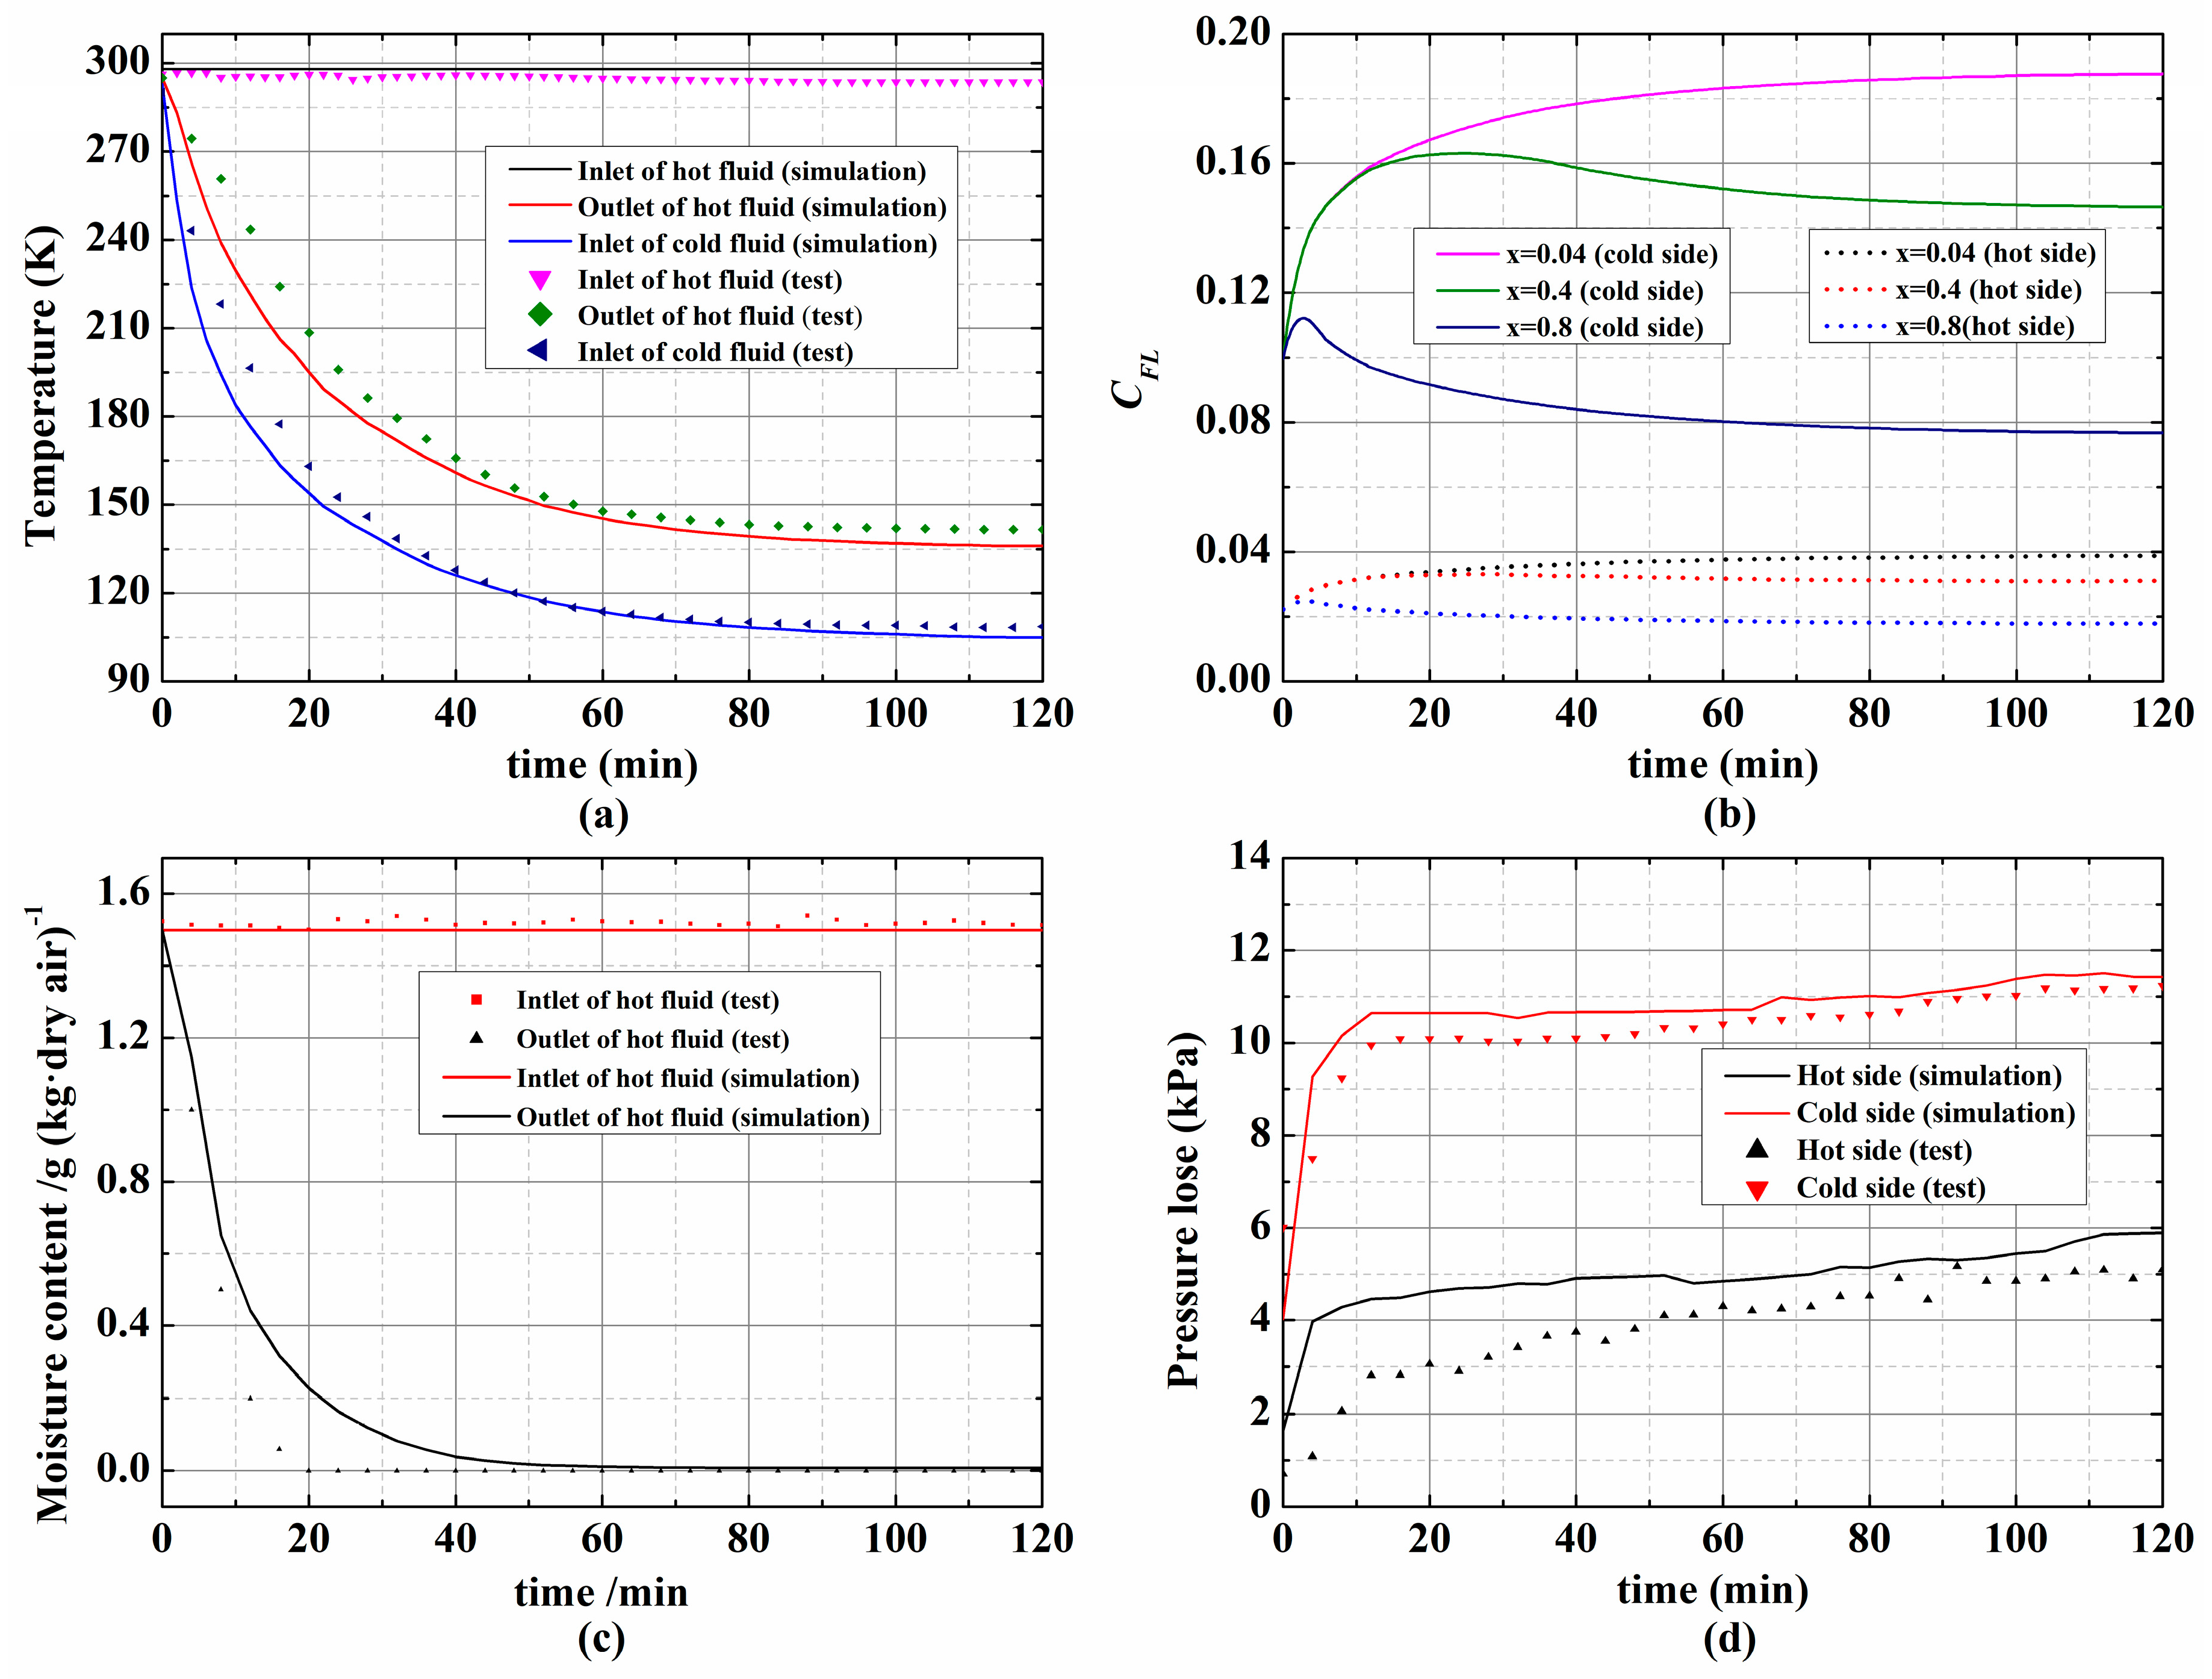
4.1.2. Experimental Verification

To verify the frosting model of heat exchanger, the simulation results were compared with the test data. The simulation was conducted under the same operating conditions as test 1.
The comparison of the heat exchanger characteristics between the simulation and test was illustrated in Figure 7. As shown in Figure 7a, the simulated non-steady cooling trend of the system under frosting condition agreed well with the experimental value. At the 120th min, the numerical and experimental deviations at the hot fluid outlet and the cold fluid inlet of heat exchanger were 5.6 K and 3.6 K respectively. The relative deviations of the hot fluid outlet and the cold fluid inlet were 4.0% and 3.3%. The maximum relative deviations of the two in the cooling process were 9.3% and 10.8%, which occurred at about the 11th min. As shown in Figure 7b, with certain spatial and temporal discretization, CFL changed with the variations of the space position and the time. In the cold channel of the heat exchanger, CFL was obvious greater than that in the hot side, which restricted the maximum value of CFL. That is because, the velocity of the cold fluid was higher than that of the hot fluid. In this simulated condition, the time and space steps were 0.5 ms and 4.0 mm, respectively. As shown in Figure 7c, the moisture content measured at the outlet of the heat exchanger was basically 0 after about 20 mins in the test. The simulation showed that the moisture content at the outlet of the hot side in heat exchanger was almost 0 after about 40 mins. It means that most of water vapor froze on the hot side of the heat exchanger. It once more proved the assumption of frost mainly occurring in the hot side of heat exchanger. As shown in Figure 7d, the simulated and tested pressure loses in heat exchanger were in good agreement. The pressure loss in the heat exchanger was little, which showed that the assumption of ignoring the moment equation was reasonable. There was a loose-coupled level between the pressure and velocity. The frosting model is adequate to simulate the dynamic heat and mass transfer characteristic in the cryogenic heat exchanger of air refrigerator to some extent.
Errors existed between the simulated and tested results. This was due to the simplifications and assumptions of both the models of the expander and heat exchanger. The heat exchanger was simulated using one-dimensional method, and the semiempirical correlations were introduced to describe the frosting, all of which caused the deviations. The models will be improved by adopting more accurate calculating of the heat exchanger and in-depth research of the frosting model. Also, the visible test apparatus were necessary for studying the frosting mechanism. The model in the present study, which combined the numerical heat transfer and the semi-empirical correlations of the Lewis analogy formula, could provide a basis and reference for related research.

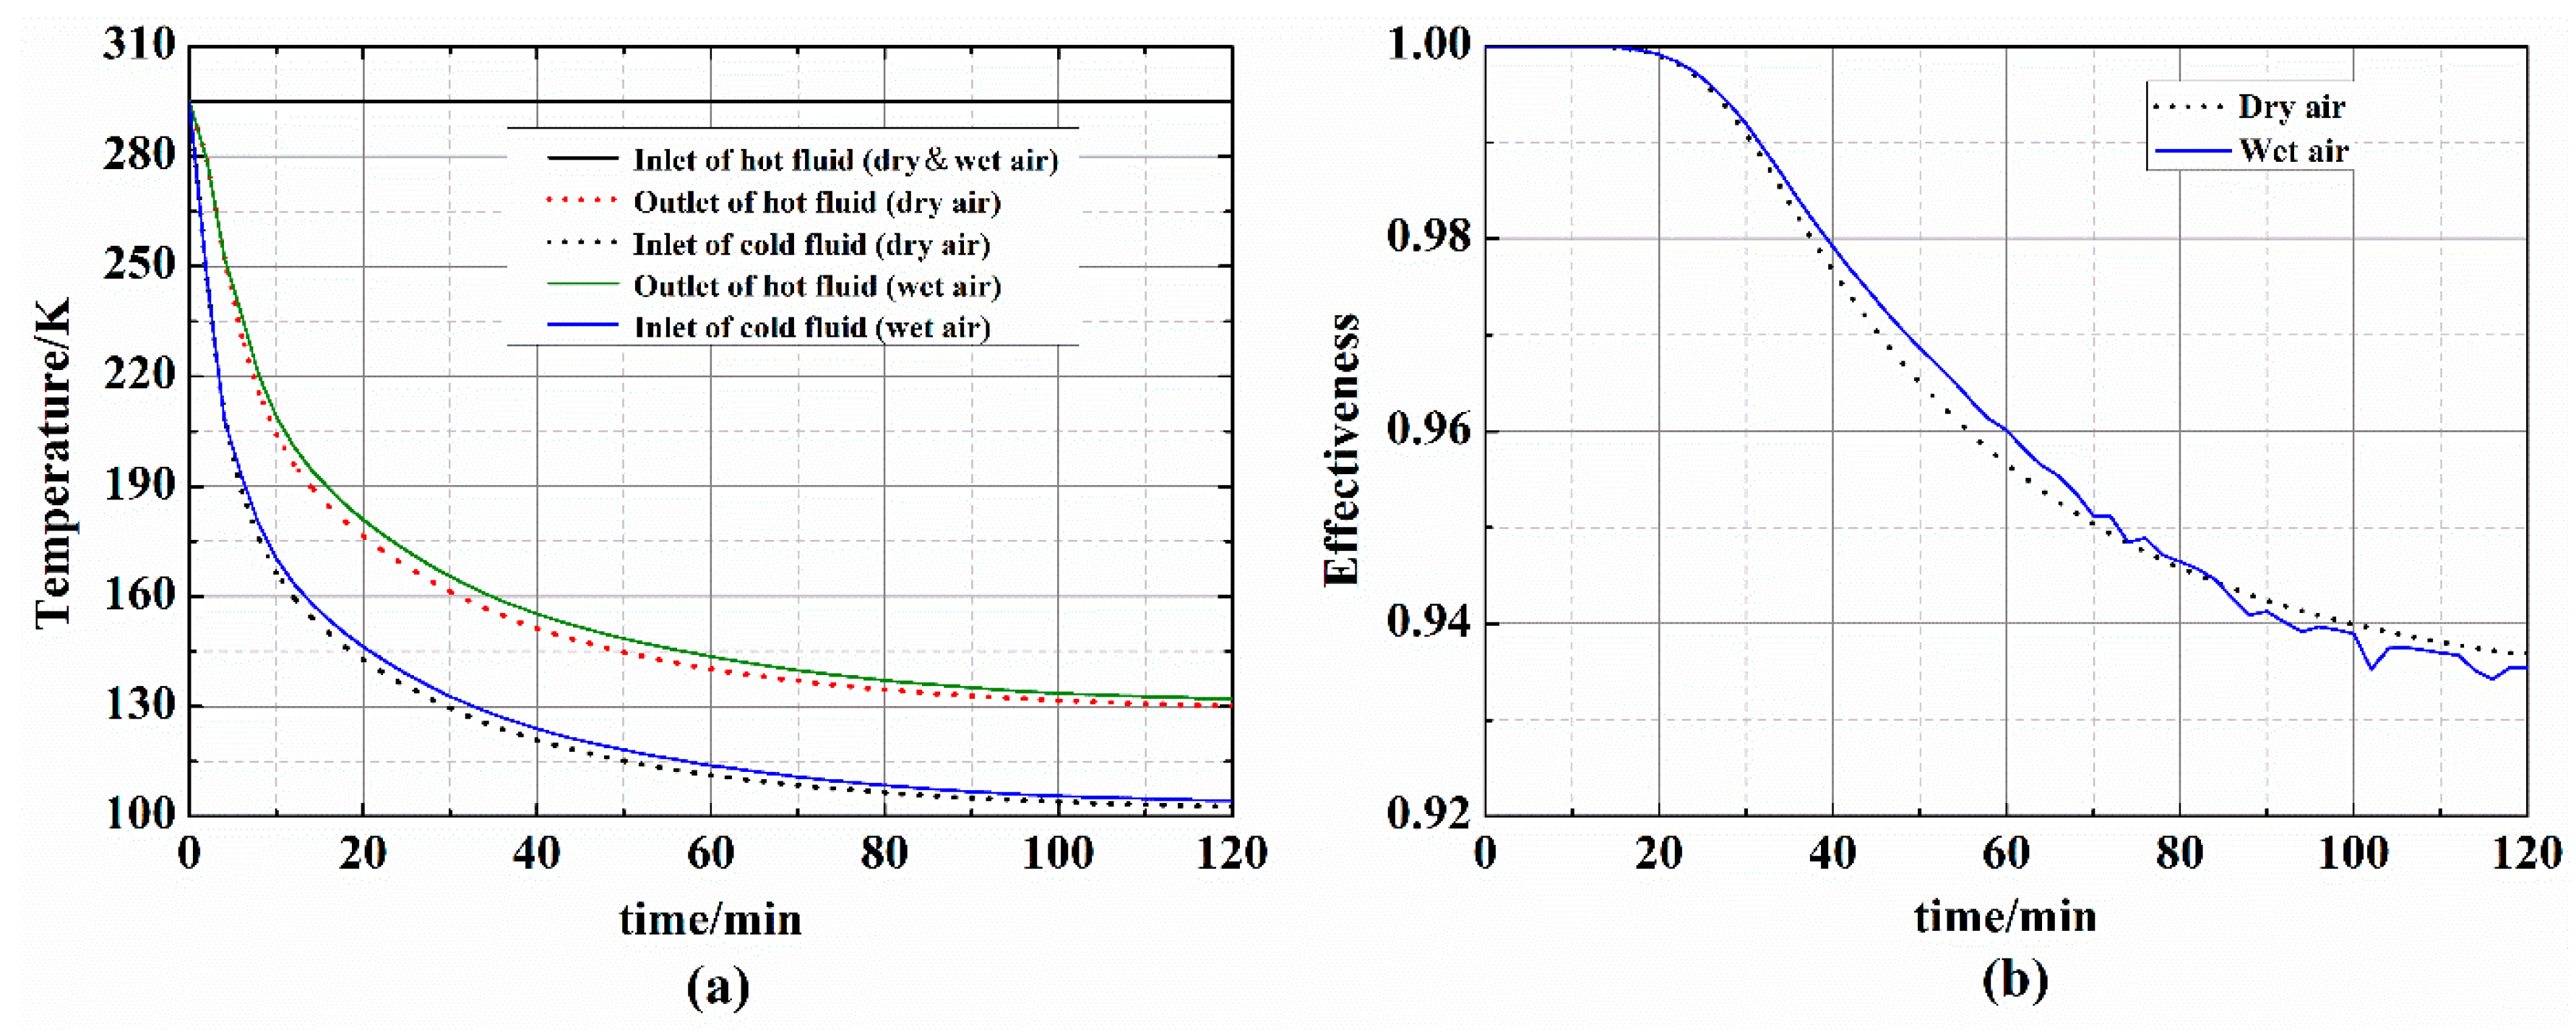
4.2. Growth and Migration of Frost Layer

To clarify the characteristics of the growth and migration of frost layer, simulations were conducted under the heat exchanger inlet temperature and pressure of 295.0 K and 0.510 MPa, outlet pressure of 0.100 MPa, inlet moisture content of 0.75 g (kg·dry air)−1, and expansion efficiency of 0.60.
As shown in Figure 8a, the cooling performance of wet air was not very different from that in the case of dry air. Under the frosting condition, temperatures of the hot fluid outlet and the cold fluid inlet are 2.0 K and 1.5 K higher than those under the non-frosting condition at the 120th min. As shown in Figure 8b, the heat exchanger effectiveness changed stably under the dry air condition. Variations of the effectiveness under the frosting condition was quite complex. As the cooling went on, the heat exchanger of frosting condition gradually had a higher effectiveness and then tended to another one. That was because, the cooling rate slowed down and the decline of effectiveness became slower when the frosting occurred. Then with the growth of frost layer, it gradually had a great impact on the heat transfer performance and the effectiveness began to decline obviously.
Figure 9 shows the growth of frost layer. The simulations showed that the frosting began at the 3.0th min, indicating that the moisture in the air quickly began to condense into frost under the rapid cooling effect of the refrigerator. As shown in Figure 9a, the frosting first occurred at the cold end of the heat exchanger, and gradually expanded to the hot end over time. That is because as the cooling went on, the area near the hot end of heat exchanger began to meet the frosting conditions. The moisture in the air was mainly frozen in the middle and hot end, while the moisture content in the wet air reaching the cold end gradually decreased. As shown in Figure 9b, after the refrigerator run for 40 min, the outlet moisture content was very low. At this time, more than half of the hot side of the heat exchanger had frosted, as shown in Figure 9a.
It also can be seen that the frost surface was not smooth. As the temperature decreased, the frost density increased. Although frost deposits continued, the increase in height was not stable especially in the hot end, as shown in Figure 9c. Because the moisture content reaching the area, the surface temperature, and the air velocity were all changing during the cooling process, resulting in such a distribution pattern. As shown in Figure 9c, the frost growth pattern was different in different areas. At the cold end, frosting occurred early and the frost layer grew gently. After running for a certain period, the physical properties of the frost layer at the cold end were relatively stable and no longer grew. Near the hot zone, the frost layer grew more rapidly. This was due to the continuous entry of moisture, which first froze at the hot end. As shown in Figure 9d, the temperature difference was smaller in the middle area, which was corresponding to a thicker frost layer.

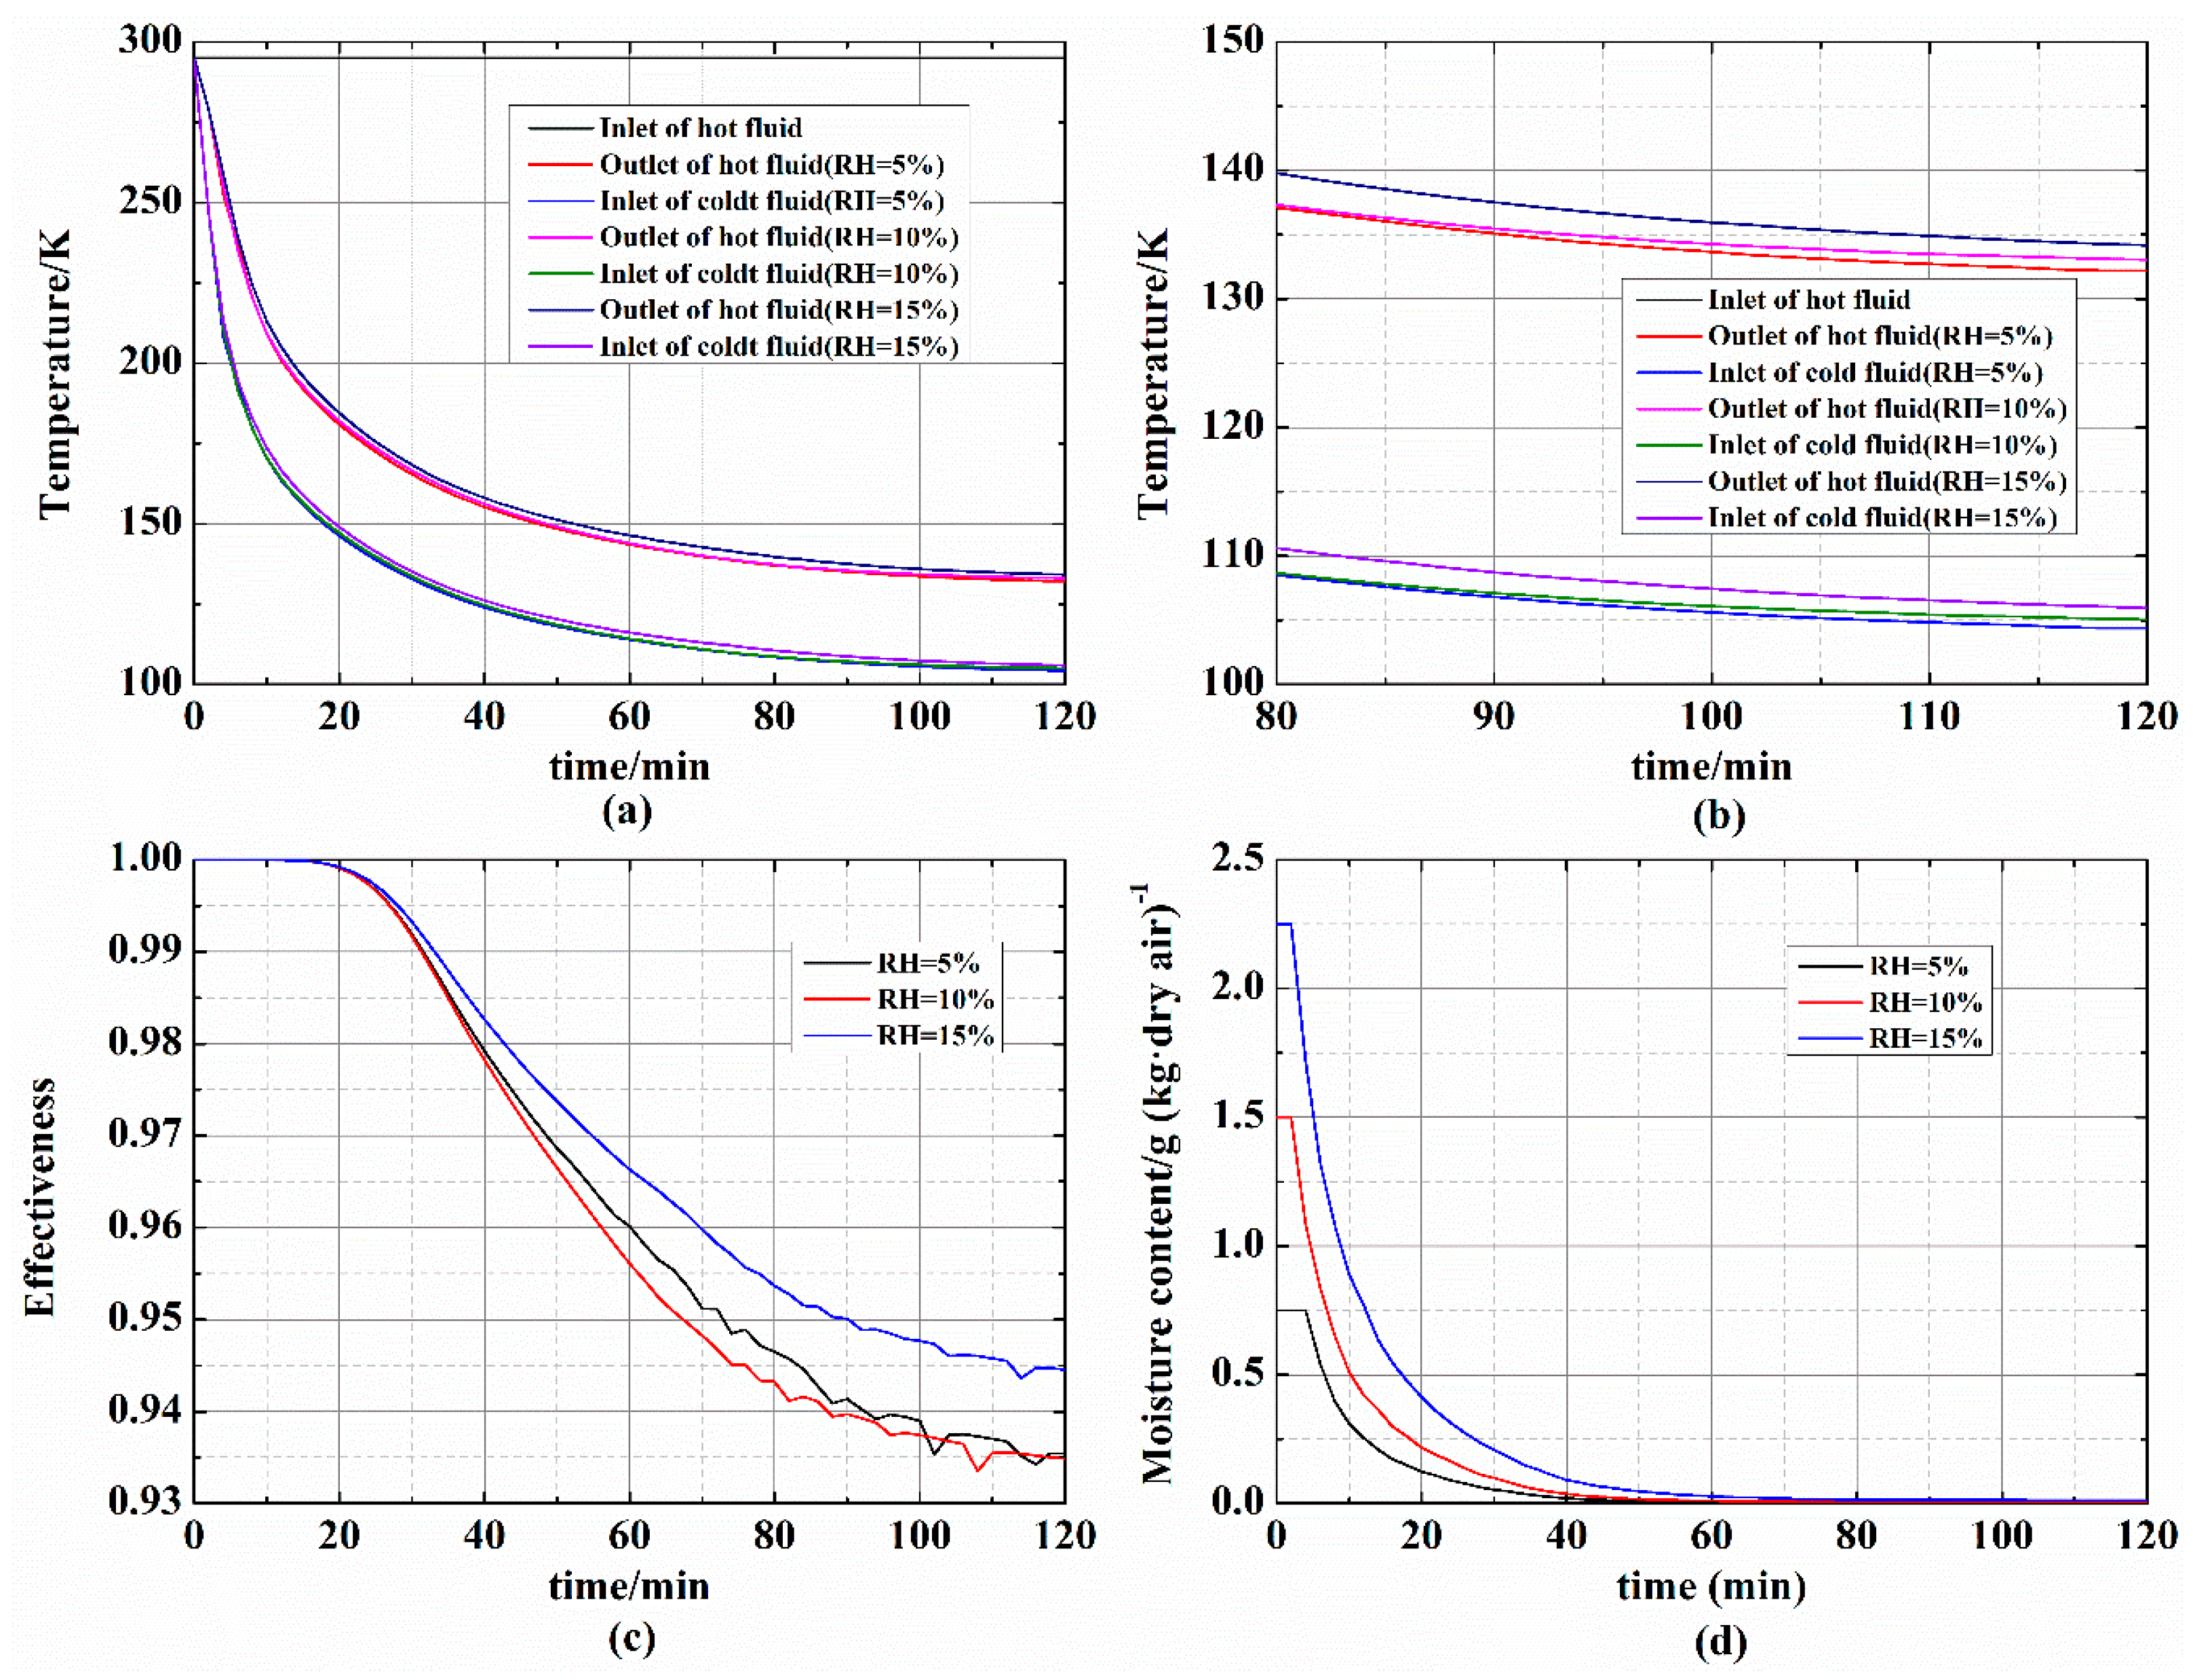
4.3. Influence of Inlet Humidity

The performance of the heat exchanger under different inlet relative humidity (RH) is shown in Figure 10. Simulations were conducted under the heat exchanger inlet temperature and pressure of 295.0 K and 0.510 MPa, outlet pressure of 0.100 MPa, and expansion efficiency of 0.60. As shown in Figure 10a,b, the inlet temperatures of hot fluid at the 120th min were 104.4, 105.1, and 106.0 K, respectively. When the RH is 15%, the frosting had a great influence on the system performance with the lowest temperature rise of 3.1 K comparing the dry air condition. The higher the inlet moisture content, the faster the frost layer grows, which leads to the faster the heat transfer resistance increases. As shown in Figure 10c, the effectiveness fluctuated under different inlet RH as the cooling went on, which was due to the growth and migration of the frost layer. The effectiveness under RH of 15% was higher, which just reflected the slower cooling down trend of the refrigerator, as shown in Figure 8b. As shown in Figure 10d, when the inlet humidity was higher, it took longer for the moisture to freeze completely on the hot side. After 60 mins, the outlet moisture contents were almost zero under three conditions.

4.4. Influence of Running Time

Figure 11 shows the heat exchanger performance and the frost layer development during a long period of operation. The simulations were conducted under the same operating parameters as those in Section 4.2. The cooling trend of the refrigerator stabilized after about 130 min. At about the 150th min, the cold end temperatures of the heat exchanger started to rise. As the refrigerator run, new air continued to enter the heat exchanger. Frost layer grew and developed continuously in the heat exchanger, as shown in Figure 11b. At the 200th min, the thickest frost layer grew to 2.05 mm, comparing to 0.97 mm at the 120th min. With the deposition of frost layer, the heat transfer performance was seriously affected and the heat exchanger effectiveness decreased continuously. These resulted in the raising fluid temperature in the heat exchanger, as shown in Figure 11c. The rising air temperature lead to the decrease of water vapor deposition in the wet air and the increase of moisture content at the outlet. As shown in Figure 11d, the moisture content at the outlet started to increase at about the 108th min. When the inlet humidity is low, it has small effect on the air refrigerator. But great attention should be paid to the air humidity during long time operation of air refrigerator.

5. Conclusions

In this article the heat and mass transfer characteristics of frost formation in a cryogenic plate-fin heat exchanger and its influence on the air refrigerator were investigated both theoretically and experimentally. The frost growth model was newly proposed based on the numerical heat transfer and the semi-empirical correlations by adopting the Lewis analogy formula.
The simulated and experimental results showed that the assumption of frost formation mainly occurring in the hot side was reasonable. The frosting first occurred at the cold end of the heat exchanger, and gradually expanded to the hot end over time. When the inlet RH is above 10%, the frosting began to have a great influence on the system performance. Efforts should be made to ensure that the inlet moisture content is not too high. Even though under low inlet humidity, the cold end temperatures of the heat exchanger started to rise after long time running. The higher the inlet moisture content, the faster the frost layer grows, which leads to the faster increase of the heat transfer resistance.
The frosting model can simulate the transient heat and mass transfer characteristic in the cryogenic heat exchanger of air refrigerator to some extent. It could provide a basis for the design, organization, and efficient and safety operation of the air refrigerator. The model will be improved by adopting more accurate calculation of the heat exchanger and in-depth research of the frosting model. Also, the visible test apparatus was necessary for studying the frosting mechanism.

Author Contributions

S.Y. and B.F. designed the simulation model; S.Y. and Y.C. compiled the program; S.Y. and Z.L. conducted the experiment; and S.Y. wrote the paper.

Funding

This research was funded by the National Natural Science Foundation of China (51506209), Fundamental Research Funds for the Central Universities and the Key Scientific Research Projects in Henan Colleges and Universities (18A470006).

Conflicts of Interest

The authors declare no conflict of interest.

Abbreviations

Symbols
AThermal diffusivity of wet air (m2 s−1)
afCutting length of the heat exchanger (m)
A2Secondary surface area (m2)
AsTotal surface area (m2)
cpSpecific heat (J K−1 kg−1)
CAhConcentration of water vapor in the main stream of wet air (mol m3)
CAsConcentration of water vapor in moist air at the frost surface (mol m3)
daMoisture content of wet air (g (kg· dry air) −1)
DMass diffusion coefficient of wet air (m2 s−1)
GMass velocity (kg m−2 s−1)
HHeat transfer coefficient (W m−2 K−1)
hmConvective mass transfer coefficient (m s−1)
mMass flow rate (kg s−1)
m ˙ f r Convective mass transfer rate (kg m2 s−1)
M w Molar mass of water vapor (kg mol−1)
paPartial pressure of water vapor (Pa)
phTotal pressure of wet air (Pa)
qaHeat transfer at the hot side (W m−2)
TTemperature (K)
TaTemperature of water vapor (K)
TsTemperature on the frost layer surface (K)
γfrLatent heat of condensation of water vapor (J kg−1)
λThermal conductivity (W m−1 K−1)
τTime (s)
ρDensity (kg m−3)
ρwDensity of parting plate (kg m−3)

References

  1. Flynn, T. Cryogenic Engineering, 2nd ed.; CRC Press Inc.: Boca Raton, FL, America, 2004; pp. 21–35. [Google Scholar]
  2. Deserranno, D.; Zagarola, M.; Li, X.; Mustafi, S. Optimization of a Brayton cryocooler for ZBO liquid hydrogen storage in space. Cryogenics 2014, 64, 172–181. [Google Scholar] [CrossRef]
  3. Hiraia, H.; Suzukia, Y.; Hirokawaa, M.; Kobayashia, H.; Kamiokaa, Y.; Iwakuma, M.; et al. Development of a turbine cryocooler for high temperature superconductor applications. Physica C. 2009, 469, 1857–1861. [Google Scholar] [CrossRef]
  4. Hou, Y.; Yang, S.; Chen, X.; Chen, S.; Lai, T. Study on the matching performance of a low temperature reverse Brayton air refrigerator. Energy Convers. Manag. 2015, 89, 339–348. [Google Scholar] [CrossRef]
  5. James, S.; Arsalan, R. Thermodynamic optimization of reverse Brayton cycles of different configurations for cryogenic applications. Int. J. Refrig. 2013, 36, 1529–1544. [Google Scholar]
  6. Yang, S.; Fu, B.; Hou, Y.; Cheng, S.; Li, Z.; Wang, S. Transient cooling and operational performance of the cryogenic part in reverse Brayton air refrigerator. Energy 2019, 167, 921–938. [Google Scholar] [CrossRef]
  7. Yang, S.; Cheng, S.; Chen, X.; Zhang, X.; Hou, Y. Study on the coupling performance of a turboexpander compressor applied in cryogenic reverse Brayton air refrigerator. Energy Convers. Manag. 2016, 122, 386–399. [Google Scholar] [CrossRef]
  8. Yang, S.; Liu, Z.; Fu, B. Simulation and evaluation on the dynamic performance of a cryogenic turbo-based reverse Brayton refrigerator. Appl. Sci. 2019, 9, 531. [Google Scholar] [CrossRef]
  9. William, M.K.; London, A.L. Compact Heat Exchangers, 3rd ed.; McGraw-Hill Book Company: New York, NY, USA, 1984; pp. 503–510. [Google Scholar]
  10. Zhan, Y.; Wang, J.; Wang, W.; Wang, R. Dynamic simulation of a single nitrogen expansion cycle for natural gas liquefaction under refrigerant inventory operation. Appl. Therm. Eng. 2018, 128, 747–761. [Google Scholar]
  11. Joshi, M.H. Heat transfer and friction in the offset strip-fin heat exchanger. Int. J. Heat Mass Tran. 1987, 30, 69–84. [Google Scholar] [CrossRef]
  12. Chang, H.; Chung, M.J.; Kim, M.J.; Park, S.B. Thermodynamic design of methane liquefaction system based on reversed-Brayton cycle. Cryogenics 2009, 49, 226–234. [Google Scholar] [CrossRef]
  13. Shin, Y.; Lee, Y.P. Design of a boil-off natural gas reliquefication control system for LNG carriers. Appl. Energy 2009, 86, 37–44. [Google Scholar] [CrossRef]
  14. Zhao, H.; Hou, Y.; Zhu, Y.; Chen, L.; Chen, S. Experimental study on the performance of an aircraft environmental control system. Appl. Therm. Eng. 2009, 29, 3284–3288. [Google Scholar] [CrossRef]
  15. Chen, L.; Zhang, X.; Wang, C.; Yang, C. A novel environmental control system facilitating humidification for commercial aircraft. Build. Environ. 2017, 126, 34–41. [Google Scholar] [CrossRef]
  16. Daniel, B. Integration of exergy analysis into model-based design and evaluation of aircraft environmental control systems. Energy 2017, 137, 739–751. [Google Scholar]
  17. Hayashi, Y.; Aoki, A.; Adashi, S.; Hori, K. Study of frost properties correlating with frost formation types. ASME J. Heat Transf. 1977, 99, 239–245. [Google Scholar] [CrossRef]
  18. Cheng, C.H.; Cheng, Y.C. Predictions of frost growth on a cold plate in atmospheric air. Int. Commun. Heat Mass Transf. 2001, 28, 953–962. [Google Scholar] [CrossRef]
  19. Cheikh, A.; Jacobi, A. A mathematical model for frost growth and densification on flat surfaces. Int. J. Heat Mass Transf. 2014, 77, 604–611. [Google Scholar] [CrossRef]
  20. Silva, D.L.; Melo, C.; Hermes, C.J.L. Effect of frost morphology on the thermal-hydraulic performance of fan supplied tube-fin evaporators. App. Therm. Eng. 2017, 111, 1060–1068. [Google Scholar] [CrossRef]
  21. Sommers, A.D.; Napora, A.C.; Truster, N.L.; Caraballo, E.J.; Hermes, C.J.L. A semi-empirical correlation for predicting the frost density on hydrophilic and hydrophobic surfaces. Int. J. Refrig. 2017, 74, 311–321. [Google Scholar] [CrossRef]
  22. Christian, J.L.H.; Andrew, D.S.; Colton, W.G.; Valter, S.N.J. A semi-empirical model for predicting frost accretion on hydrophilic and hydrophobic surfaces. Int. J. Refrig. 2018, 87, 164–171. [Google Scholar]
  23. Lax, P.D. Hyperbolic difference equations: A review of the Courant-Friedrichs-Lewy paper in the light of recent developments. IBM J. 1967, March, 235–238. [Google Scholar] [CrossRef]
  24. Trivellato, F.; Castelli, M.R. On the Courant–Friedrichs–Lewy criterion of rotating grids in 2D vertical-axis wind turbine analysis. Renew. Energy 2014, 62, 53–62. [Google Scholar] [CrossRef]
  25. Tao, Y.X.; Besant, R.W.; Rezkallah, K.S. A mathematical model for predicting the densification and growth of frost on a flat plate. Int. J. Heat Mass Transf. 1993, 36, 353–363. [Google Scholar] [CrossRef]
  26. Lee, Y.B.; Ro, S.T. An experimental study of frost formation on a horizontal cylinder cross flow. Int. J. Refrig. 2001, 24, 468–474. [Google Scholar] [CrossRef]
  27. Cheng, C.H.; Shui, C.C. Frost formation and frost crystal growth on a cold plate in atmospheric air flow. Int. J. Heat Mass Transf. 2002, 45, 4289–4303. [Google Scholar] [CrossRef]
  28. Fukuta, N. Experimental studies on the growth of small ice crystals. J. Atmos. Sci. 1969, 26, 522–531. [Google Scholar] [CrossRef]
  29. Sanders, C.T. The influence of frost formation and defrosting on the performance of air coolers. Ph.D. Thesis, Delft University, Delft, The Netherlands, 1974. [Google Scholar]
  30. Fossa, M.; Tanda, G. Study of free convection frost formation on a vertical plate. Exp. Therm. Fluid Sci. 2002, 26, 661–668. [Google Scholar] [CrossRef]
  31. Padki, M.; Sherif, S.; Nelson, R. A simple method for modeling the frost formation phenomenon in different geometries. Ashrae Trans. 1989, 95, 1127–1137. [Google Scholar]
Figure 1. Test rig and T-s diagram of the air refrigerator: (a) Test rig; (b) T-s diagram and thermodynamic process.
Applsci 09 00753 g001
Figure 2. The structure sketch of the plate-fin heat exchanger.
Applsci 09 00753 g002
Figure 3. The grids and heat transfer inside the plate.
Applsci 09 00753 g003
Figure 4. Heat transfer within the hot fluid.
Applsci 09 00753 g004
Figure 5. Flowchart of the frosting model.
Applsci 09 00753 g005
Figure 6. Comparison of heat exchanger between dry and wet air: (a) Cooling characteristics; (b) Pressure loss.
Applsci 09 00753 g006
Figure 7. Verification of the frosting model: (a) Cooling trend; (b) Courant–Friedrichs–Lewy (CFL) number; (c) moisture content; (d) pressure loss.
Applsci 09 00753 g007
Figure 8. Cooling characteristics under two moisture contents: (a) Cooling trend; (b) effectiveness.
Applsci 09 00753 g008
Figure 9. Growth and migration of the frost layer: (a) Growth along the length; (b) moisture content in the hot side; (c) growth with time; (d) temperature difference between fluid and frost surface.
Applsci 09 00753 g009
Figure 10. Cooling performance under different inlet humidity: (a) Cooling characteristics; (b) cooling performance after 80 mins; (c) heat exchanger effectiveness; (d) outlet moisture content.
Applsci 09 00753 g010
Figure 11. Influence of running time on cooling performance: (a) Cooling characteristic; (b) growth and migration of frost; (c) heat exchanger effectiveness; (d) moisture content.
Applsci 09 00753 g011
Table 1. Main parameters of the cryogenic heat exchanger [6].
ParametersHfsfδfxfyfδWaf
Value/mm9.51.20.21.09.31.210
Table 2. Operation parameters of the heat exchanger.
ParametersInlet Pressure/MPa (abs.)Outlet Pressure/MPa (abs.)Inlet Temperature/KInlet Moisture Content/g (kg· dry air)−1
Test 10.507–0.5100.100294.0–295.41.511–1.550
Test 20.508–0.5100.100–0.101294.1–295.0<0.0075

