3.1. Thermal Analysis of the Water Jacket under Static Reference Conditions
First, we investigate the thermal performance of the water jacket system under steady-state reference conditions. The reference condition was defined as water temperature at the inlet port of the water jacket,
Twater@inlet = 39 °C; water flow rate through the water jacket,
Qwater = 60 mL/min; free convection coefficient,
hair = 10 W/m
2K; ambient temperature,
Tair = 20 °C; Petri dish external diameter,
DPetri dish = 35 mm; target sample temperature,
Tsample = 37 °C; and volume ratio of the sample inside the Petri dish,
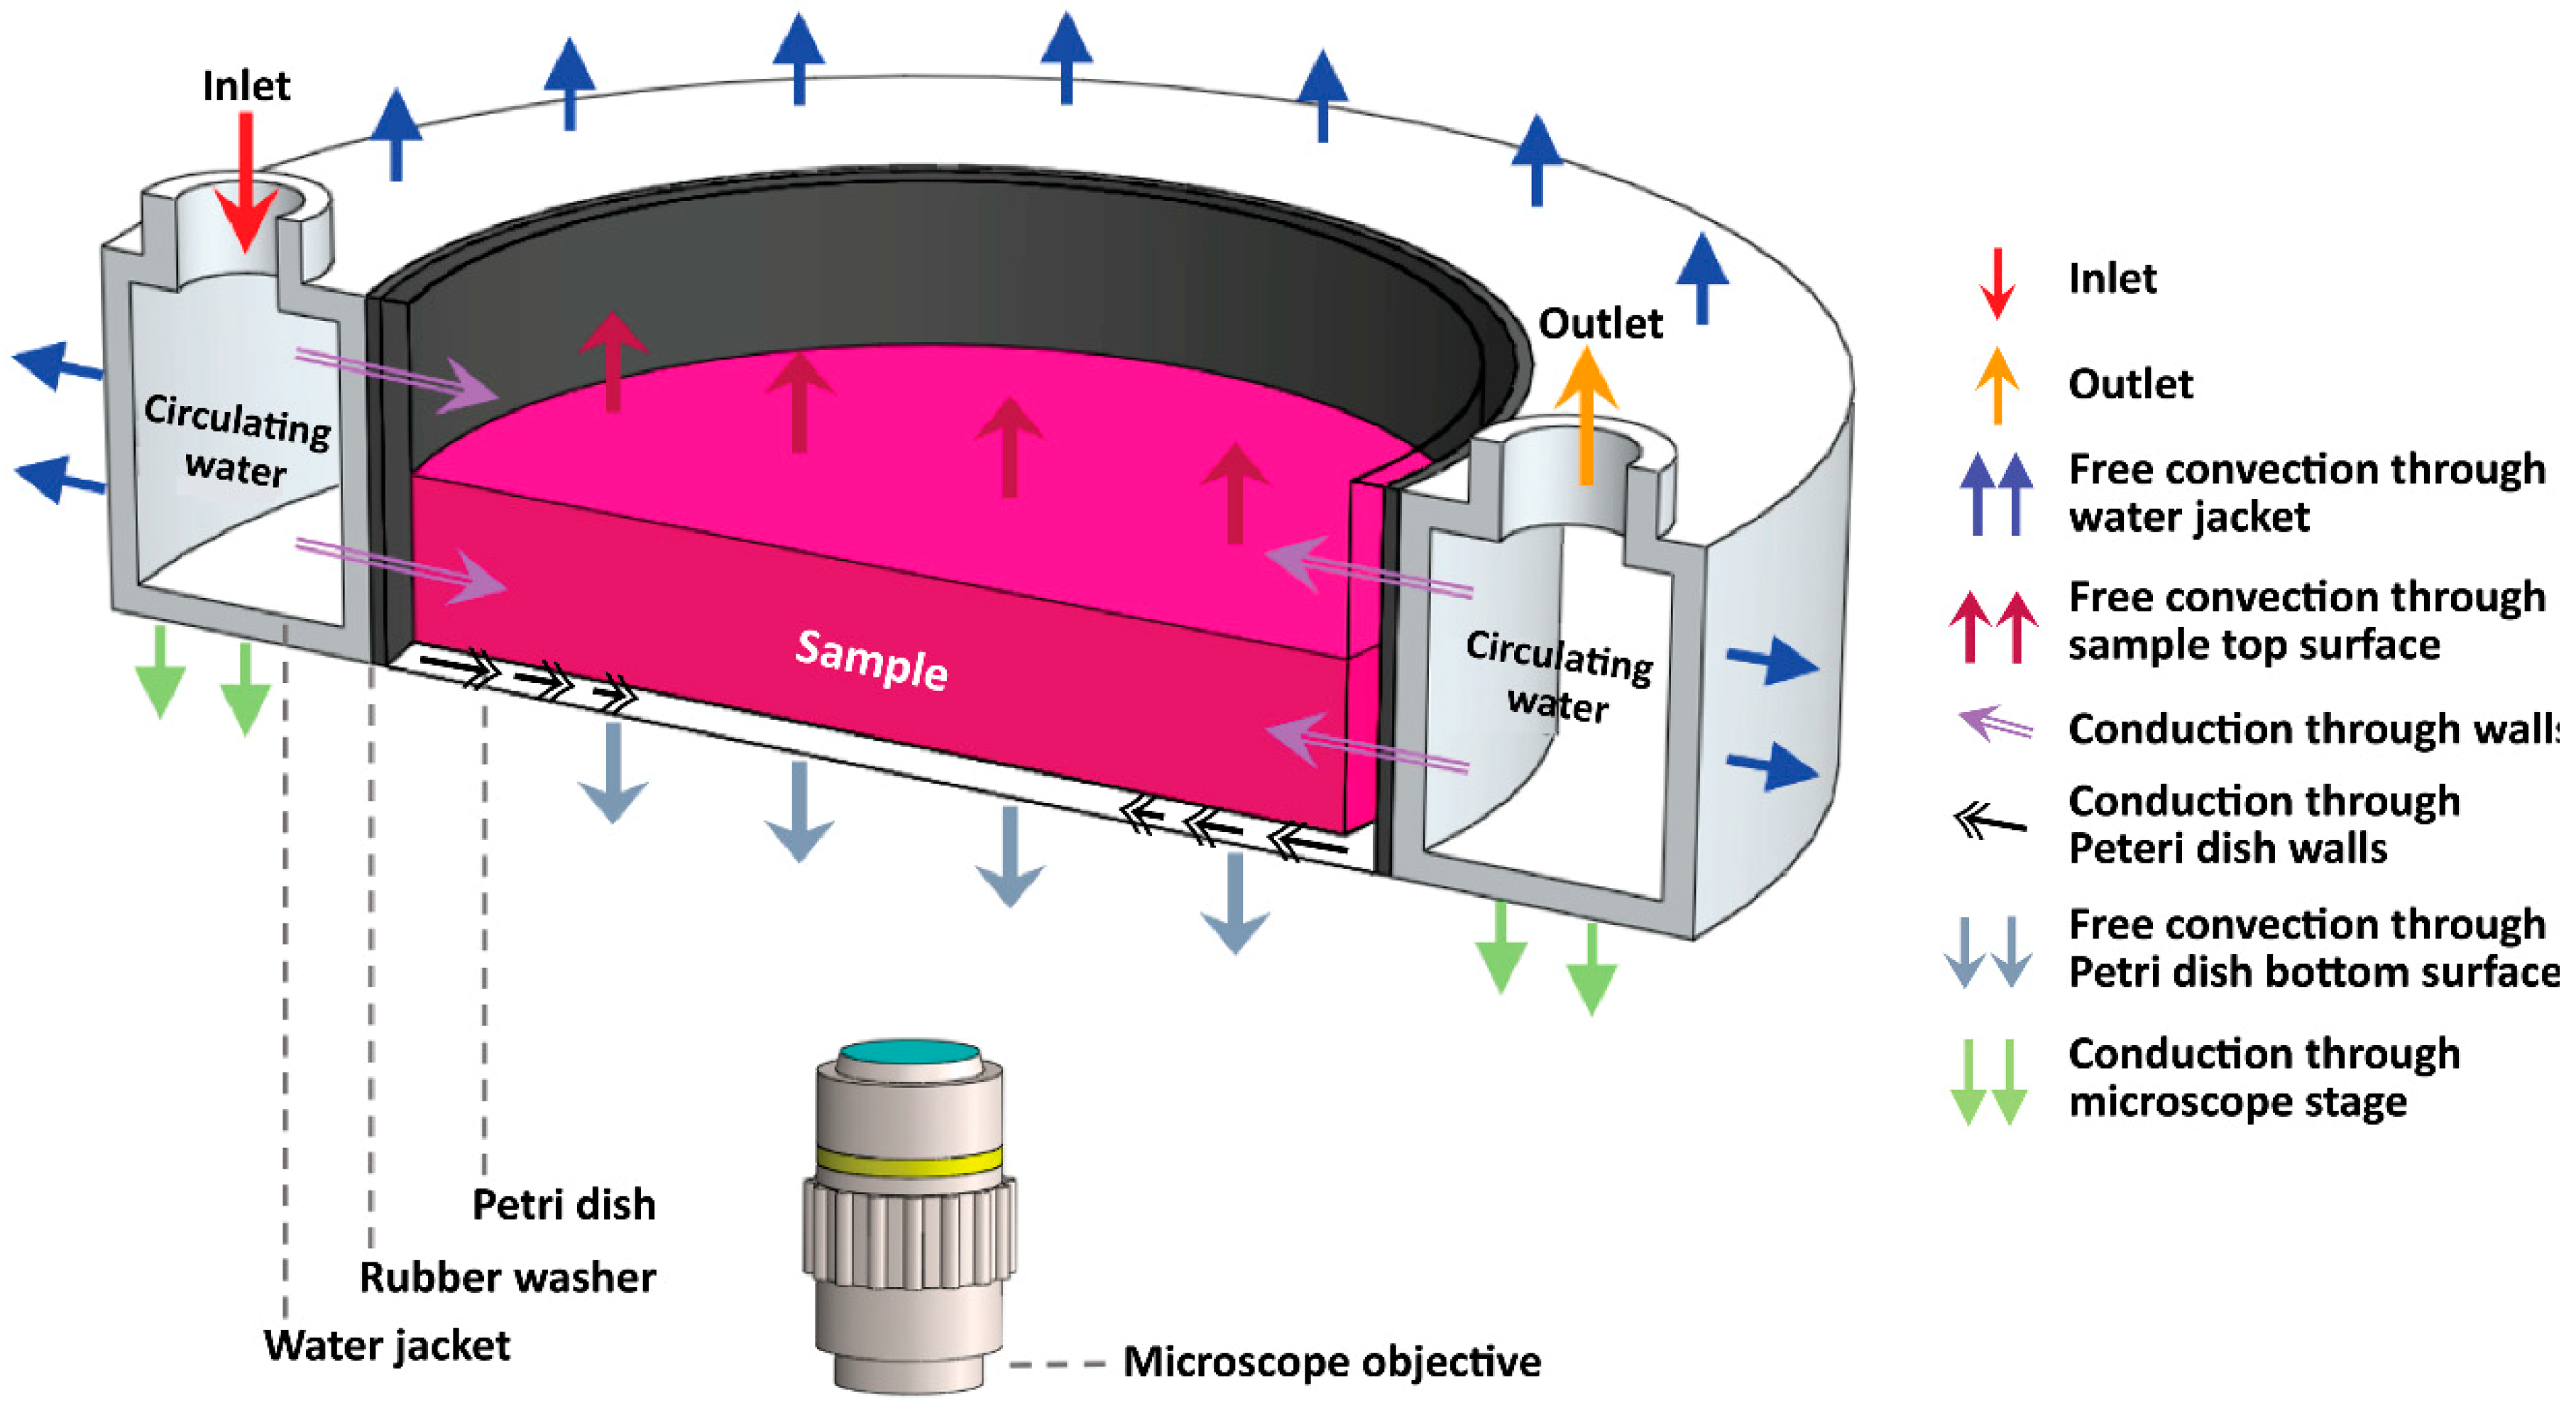
Vsample = 50%. Furthermore, the Petri dish was made of polystyrene, and a rubber washer was inserted between the water jacket and the Petri dish, as shown in
Figure 1.
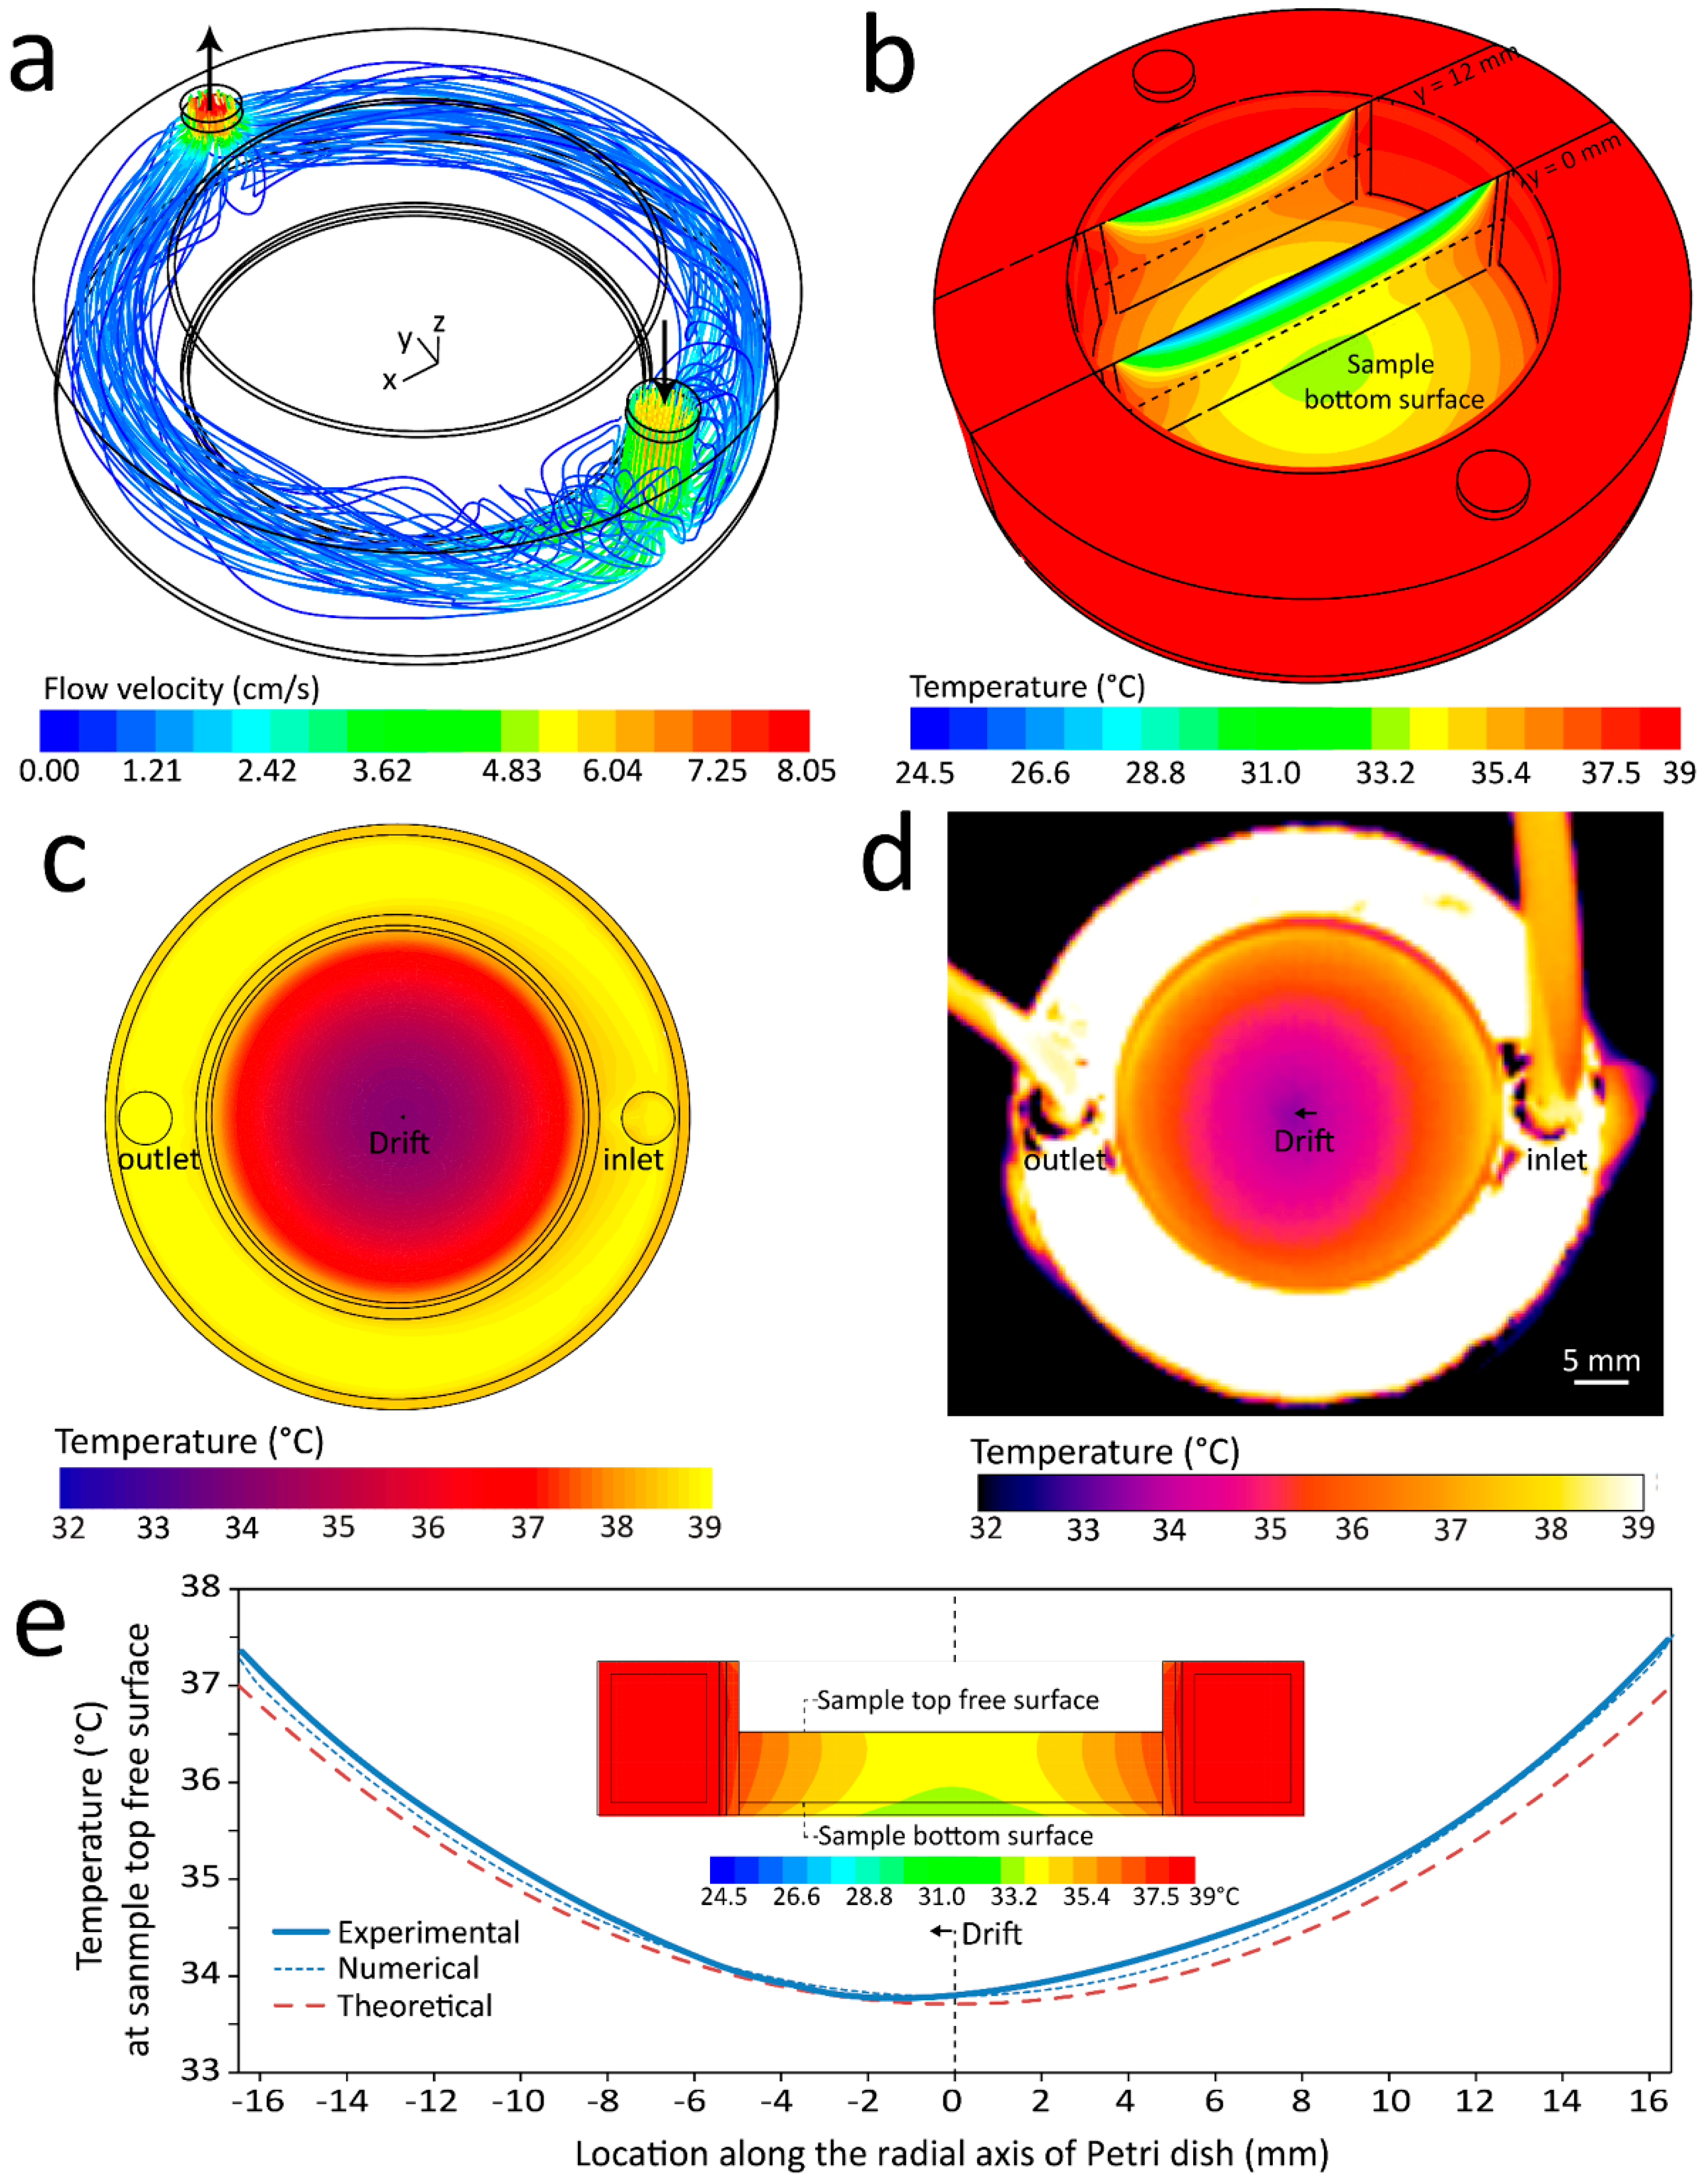
Figure 2a shows the flow streamlines of the water circulating through the water jacket chamber, colored by the magnitude of the flow velocity. The results were obtained at the reference water flow rate of 60 mL/min, as described above. The Reynolds number for recirculating water was ~50, reflecting the laminar nature of the recirculating flow at this rate. The flow streamlines were highly ordered across the water jacket due to the laminar flow characteristics, except at the inlet region where flow was not fully developed. A total pressure drop of 4.5 Pa was obtained along the water jacket cylinder (excluding the connecting tubes).
Figure 2b presents the temperature contours across the system. The simulations revealed an almost uniform temperature distribution across the water jacket surface, which was due to the dominance of forced convection. In contrast, a large temperature gradient was obtained along the radial axis of the Petri dish (from the side walls toward the middle), which was due to the dominance of conduction and the free convection heat loss across the free surfaces of the Petri dish, as defined in Equation (13). This free convection heat loss caused a temperature gradient along the height of the Petri dish. The filled level of the sample inside the Petri dish is shown by a dashed line.
Experimental measurements were also conducted to further investigate the temperature gradient along the radial axis of the Petri dish. We took advantage of a thermal imaging camera to monitor the temperature distribution across the top free surface of the system.
Figure 2c,d present the temperature contours at the top free surface of the system obtained by numerical simulations and thermal imaging, respectively. The results confirmed the existence of a temperature gradient along the radial axis of the Petri dish. Interestingly, the lowest temperature was not located at the center of the Petri dish, and instead drifted toward the colder side of the water jacket (toward the outlet port), which is attributed to the temperature drop of the water while passing through the water jacket. The numerical simulations predicted this drift as 0.4 mm, whereas the thermal imaging recorded this drift as 1.9 mm.
Figure 2e compares the temperature profiles along the radial axis of the Petri dish (parallel with the inlet/outlet ports axis) obtained from experimental, numerical and theoretical analyses. Good agreement was observed between the experimental and numerical results, both indicating the maximum temperature gradient along the radial axis of the Petri dish as 3.78 °C. The theoretical model calculated this value as 3.29 °C. The inset shows the temperature contours at the middle cross section of the Petri dish, obtained by numerical simulations. Simulations revealed that the maximum temperature gradient along the bottom surface of the Petri dish reduces to 3.28 °C (corresponding to 37 °C along the sidewalls, which decreased to 33.72 °C in the middle of the Petri dish). Given the biological organisms existing in the sample (such as cells) generally settle to the bottom surface of the Petri dish, the temperature at this surface was referred to as
Tsample. In particular, we investigated the variations of
Tsample along the radial axis of the Petri dish under different conditions.
3.2. Analyzing the Effect of Recirculating Water and Surrounding Air Parameters
Next, we characterize the thermal performance of the system with respect to the flow rate and temperature of the recirculating water (serving as the heat source), as well as the temperature and free convection coefficient of the surrounding air (serving as the heat sink), as discussed below.
Water flow rate:
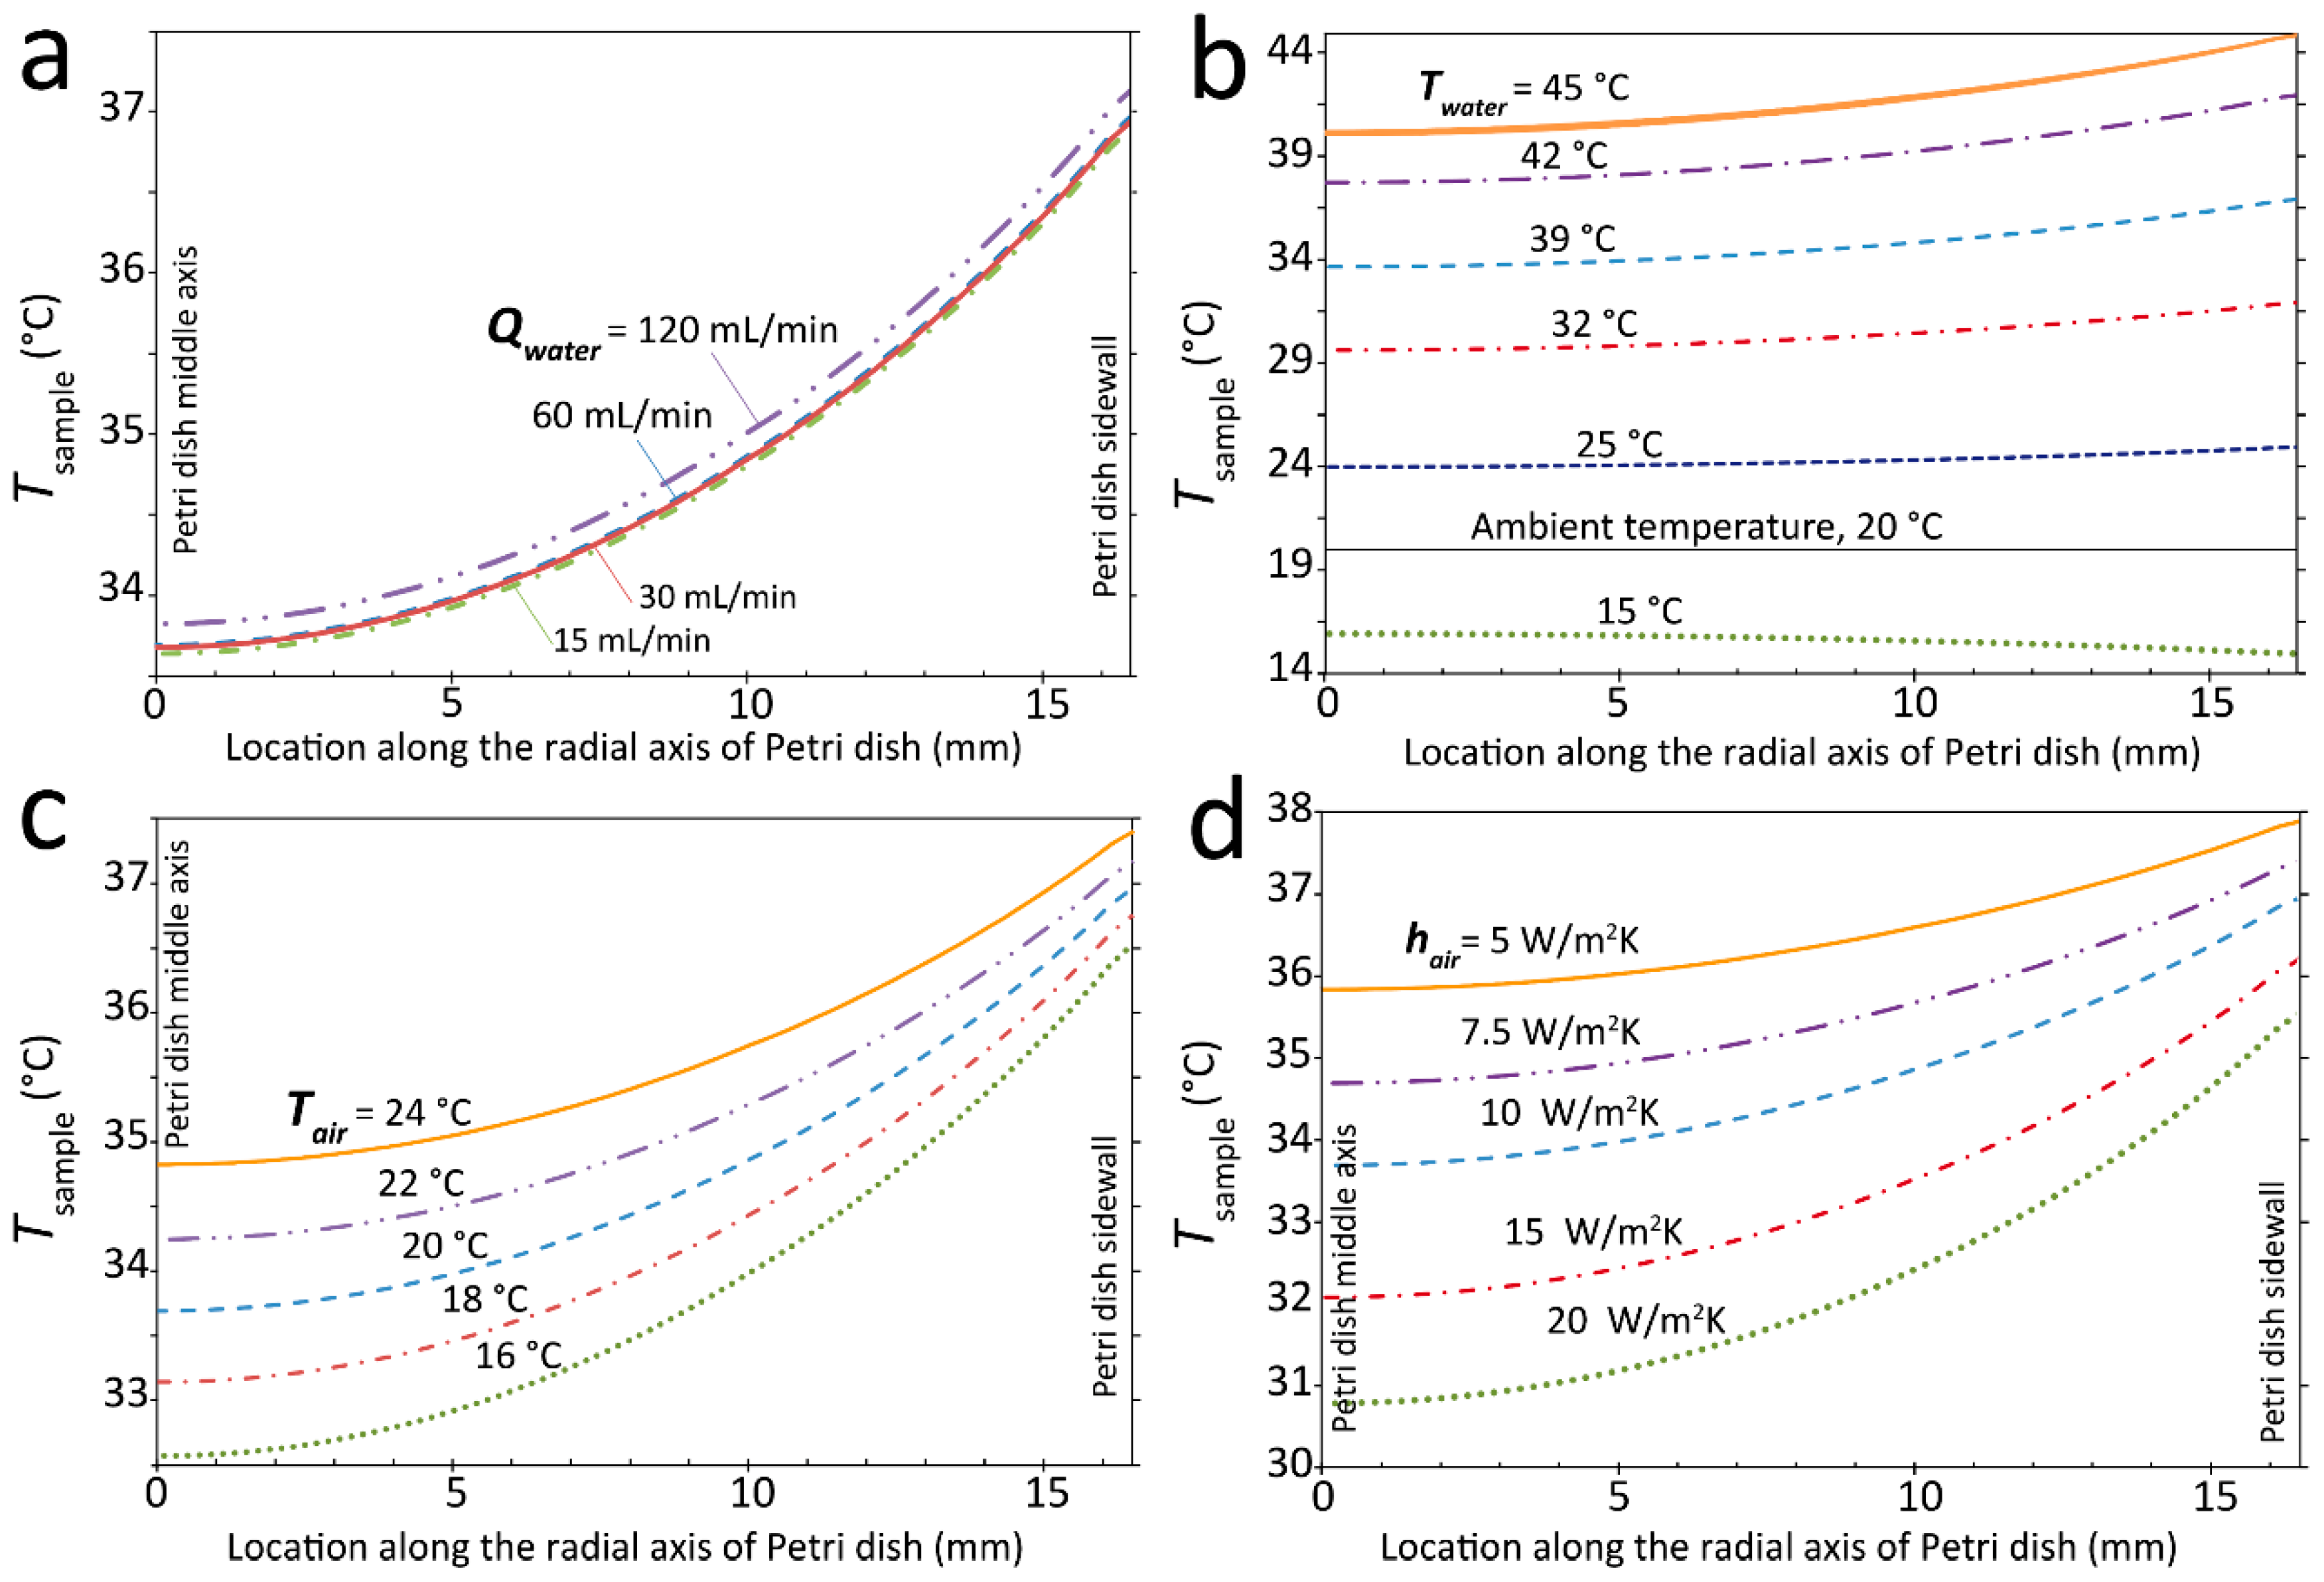
Figure 3a shows the temperature profile across the bottom surface of the Petri dish (referred to as
Tsample) when varying the flow rate of the water recirculating through the water jacket (
Qwater) from 15 to 120 mL/min. The temperature contours across the middle cross-section of the Petri dish at various water flow rates are presented in
Figure S2. Increase of
Qwater enhanced the convective heat transfer through the water jacket. However, the majority of the heat left via the outlet port of the water jacket without being injected into the Petri dish. Under these conditions, despite increasing the average temperature of the sample inside the Petri dish, the magnitude of the temperature gradient along the radial axis of the Petri dish did not change significantly.
Water inlet temperature:Figure 3b presents the temperature profile across the Petri dish when changing the temperature of the water entering the water jacket (
Twater@inlet) from 15 to 45 °C. The temperature contours at various water inlet temperatures are presented in
Figure S3. Increase of
Twater@inlet enhanced the conductive heat injected into the Petri dish via its sidewalls, which consequently increased the temperature gradient along the radial axis of the Petri dish. Decrease of
Twater@inlet below the ambient temperature reversed the conductive heat from the sample into the water jacket, leading to negative temperature gradients along the radial axis of the Petri dish.
Ambient temperature:Figure 3c shows the temperature profile across the Petri dish when varying the temperature of surrounding air (
Tair) from 24 to 16 °C. The temperature contours at various ambient temperatures are presented in
Figure S4. Decrease of
Tair enhanced the convective heat losses at the free surfaces of the Petri dish, and consequently increased the temperature gradient along the radial axis of the Petri dish.
Convection coefficient:Figure 3d presents the temperature profile across the Petri dish when changing the free convection coefficient of surrounding air (
hair) from 5 to 20 W/m
2K. The temperature contours at various convection coefficients are presented in
Figure S5. Increase of
hair enhanced the convective heat losses at the free surfaces of the Petri dish and, accordingly, increased the temperature gradient along the radial axis of the Petri dish.
3.3. Analyzing the Effect of Petri Dish Parameters
Next, we investigate the thermal performance of the water jacket system with respect to the diameter of the Petri dish, volume of the sample stored inside the Petri dish, material of the Petri dish, and incorporation of an integrated heater as discussed below.
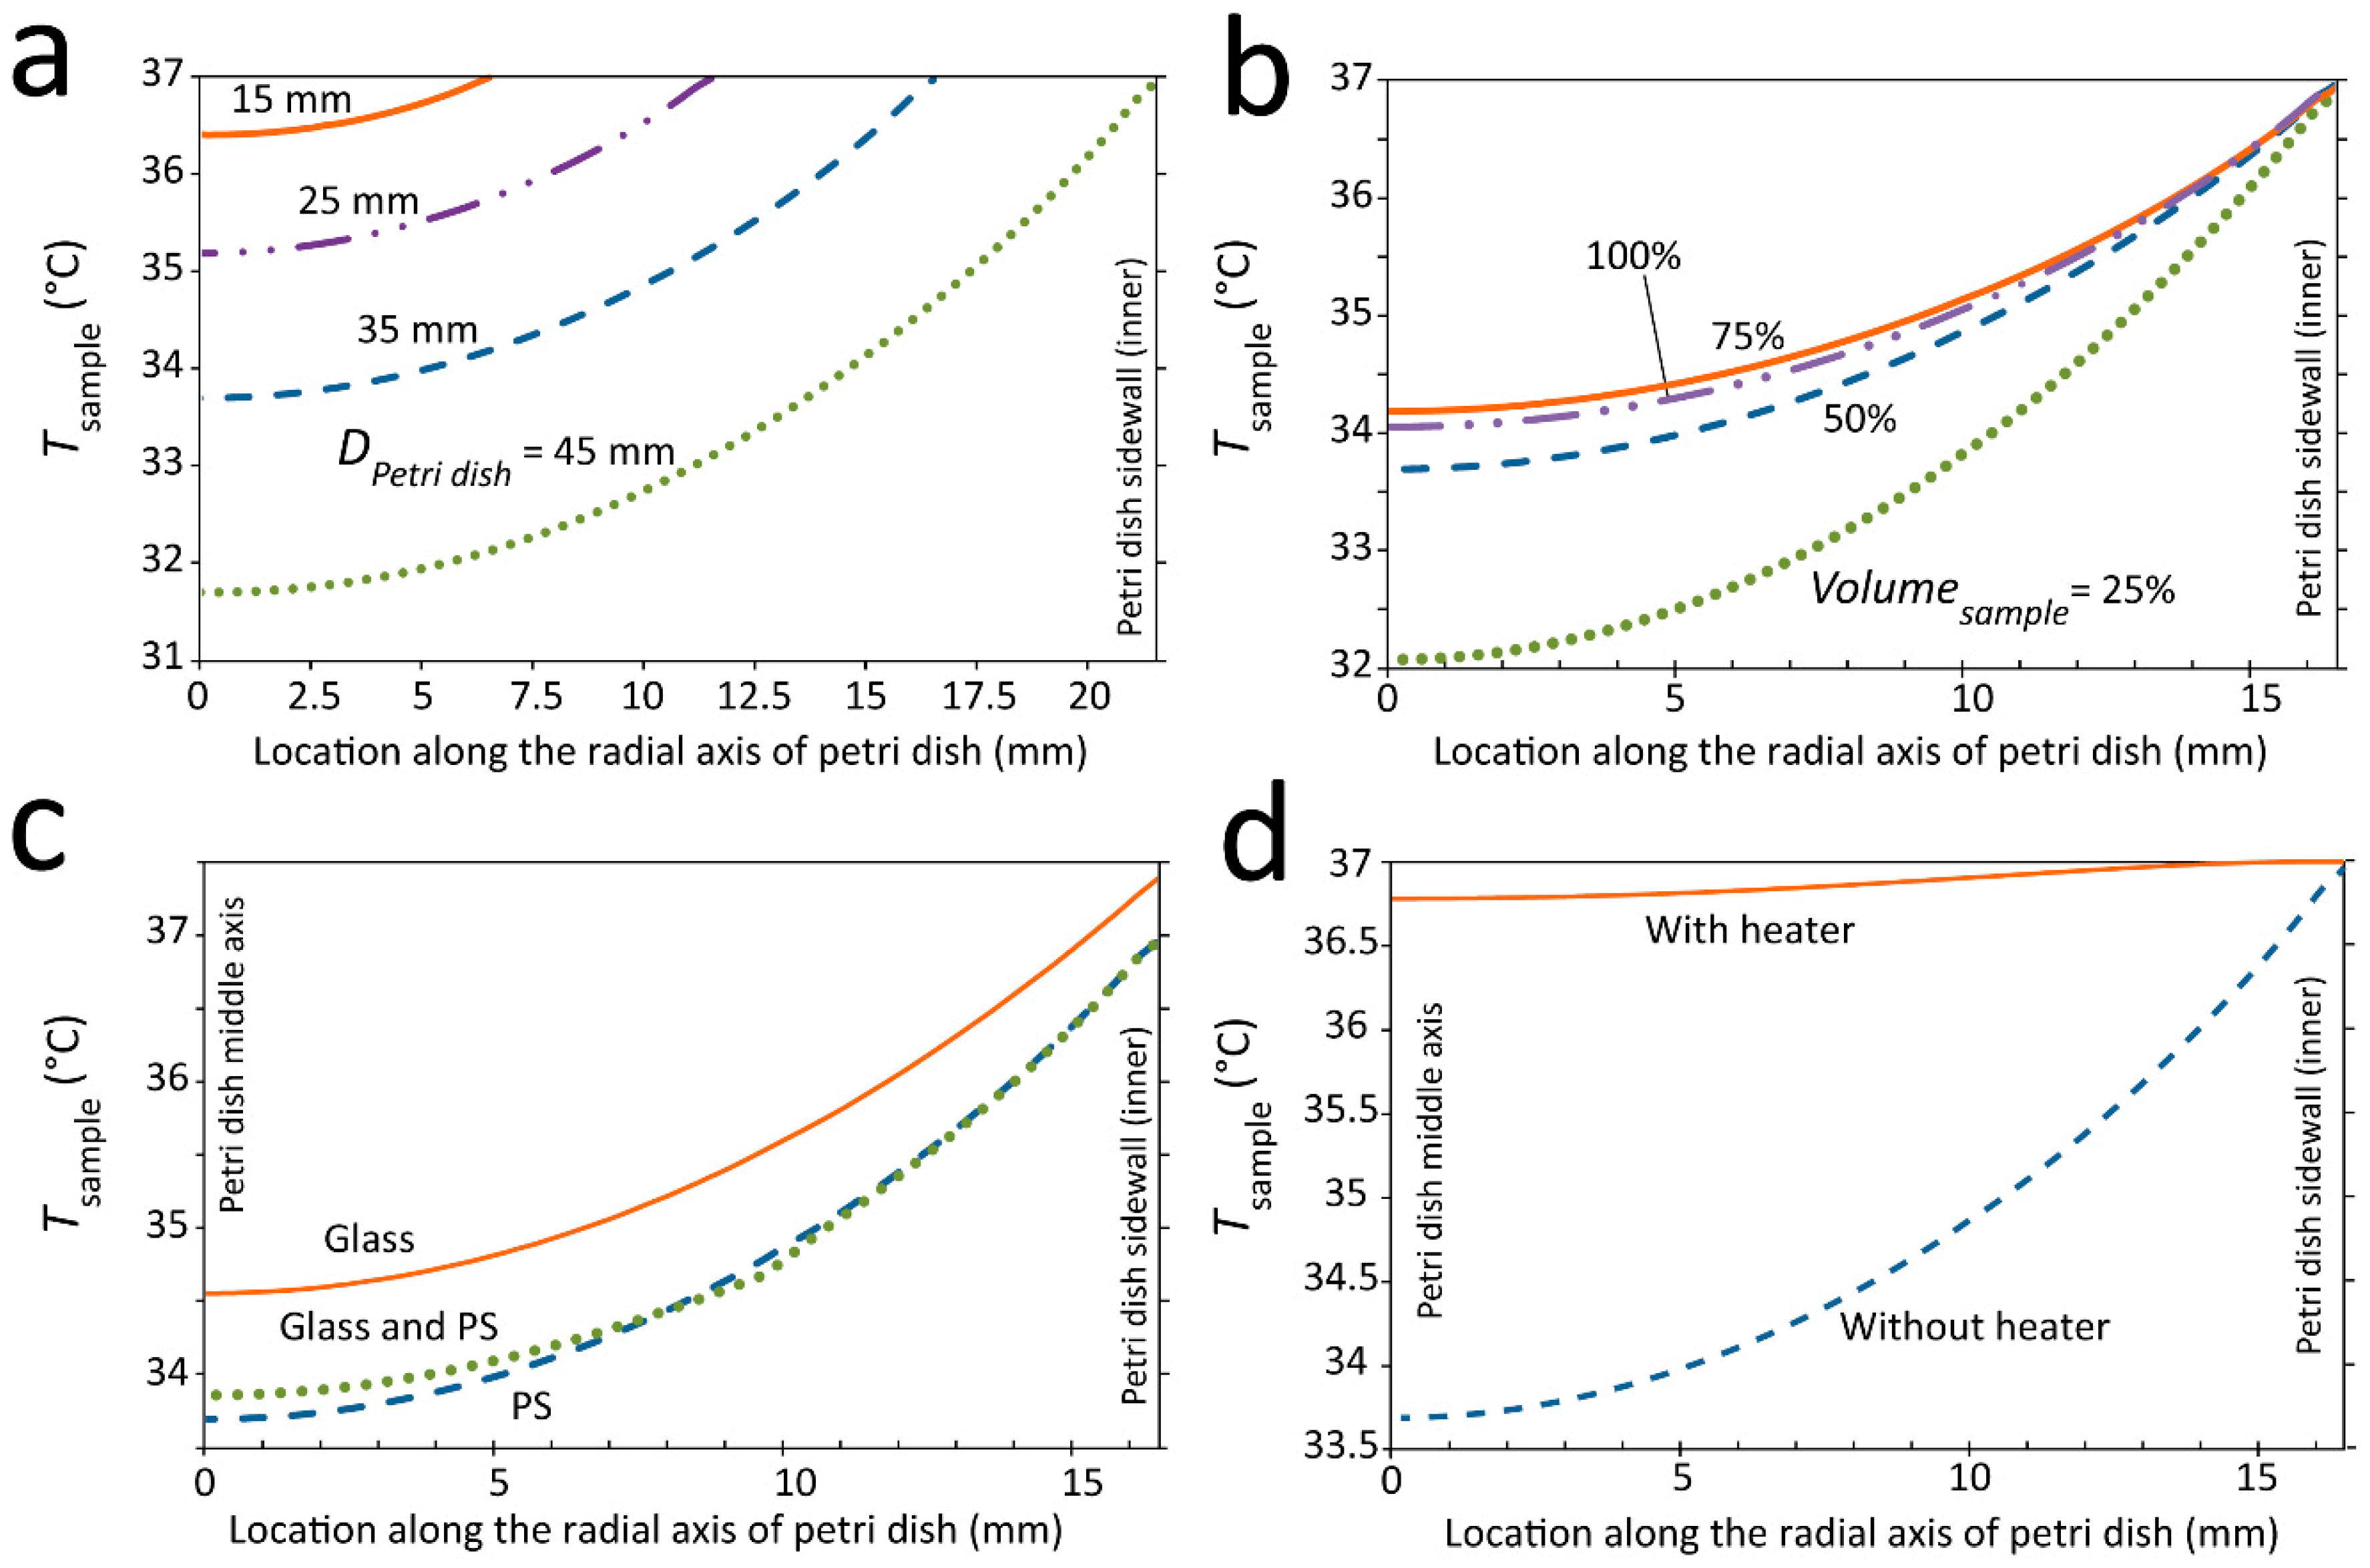
Petri dish diameter:Figure 4a shows the temperature profile across the radial axis of the Petri dish when varying the diameter of the Petri dish (
DPetri dish) from 15 to 45 mm. The temperature contours across the middle cross-section of the Petri dish at various Petri dish diameters are presented in
Figure S6. The amount of heat transferred into the Petri dish is proportional to the surface area of the side walls, and therefore proportional to
DPetri dish. However, the amount of heat lost through the bottom and top surfaces of the Petri dish is proportional to the surface area of these surfaces and, therefore, proportional to
. Hence, decrease of
DPetri dish reduced the ratio of heat loss to heat gain, leading to a more uniform temperature profile across the Petri dish.
Sample volume:Figure 4b presents the temperature profile when varying the volume of sample inside the Petri dish (
Vsample) from 25% to 100%. The temperature contours at various sample volumes are presented in
Figure S7. Decrease of
Vsample reduced the height of the sample, and consequently enhanced the conductive loss through the sample. This in turn increased the temperature gradient along the radial axis of the Petri dish.
Petri dish material:Figure 4c shows the temperature profile against the material of the Petri dish with the associated temperature contours presented in
Figure S8. The higher thermal conductivity of glass compared to that of polystyrene (0.3
vs. 0.15 W/mk) facilitated the conductive heat transfer across the bottom surface of the Petri dish, and consequently reduced the temperature gradient along the radial axis of the Petri dish. It should be noted that changing the material of the water jacket from aluminum to stainless steel did not change the temperature profile of the sample inside the Petri dish.
Heater integration:Figure 4d presents the temperature profile following the integration of a heater underneath the Petri dish. The heater consisted of a 100 µm thick glass substrate coated with ITO (indium tin oxide) that released 187 mW of thermal power uniformly across the bottom surface of the Petri dish with the associated temperature contour presented in
Figure S9. The heater compensated the convective heat loss at the free surfaces of the Petri dish, and decreased the temperature gradient along the radial axis of the Petri dish to ~0.4 °C.
3.4. Analyzing the Effect of Water Jacket Geometry
Furthermore, we investigate the effect of the water jacket geometry on the thermal performance of the system, as discussed here.
Square water jacket:Figure 5a shows the temperature contours of the system using a square water jacket. The temperature contours are similar to those of the reference circular water jacket presented in
Figure 2b. However, the extended external surfaces of a square water jacket increased the convective loss across those surfaces. The inlet water temperature was increased from 39 °C with the circular water jacket to 39.1 °C to compensate for those extra losses. The flow streamlines presented in
Figure S10 were similar to those of the reference circular water jacket presented in
Figure 2a. A total pressure drop of 4.5 Pa was observed between the inlet/outlet ports of the square jacket, which was similar to that obtained for the circular water jacket.
Semi-circular water jacket:Figure 5b presents the temperature contours obtained for the semi-circular water jacket. Compared to the reference circular water jacket presented in
Figure 2b, the semi-circular jacket produced an asymmetric temperature profile with a larger temperature gradient along the radial axis of the Petri dish. Despite a large temperature gradient, no buoyancy-driven flows were observed inside the Petri dish. The flow streamlines presented in
Figure S11 are similar to those of the reference circular water jacket presented in
Figure 2a.
Figure 5c compares the temperature profiles along the radial axis of Petri dish at
z = 1 mm obtained with circular and square water jackets. Both jackets produced symmetrical temperature profiles with almost similar temperature gradients of 3.28 and 3.29 °C obtained across the Petri dish, respectively. In contrast, the semi-circular water jacket produced an asymmetrical temperature profile with an impressive temperature gradient of 12 °C. Such a large temperature gradient might be of particular interest for researchers studying the sensitivity of cells to medium temperature, as presented in
Figure 5b.
3.5. Comparison of Temperature Gradients across a Petri Dish under Different Stable Conditions
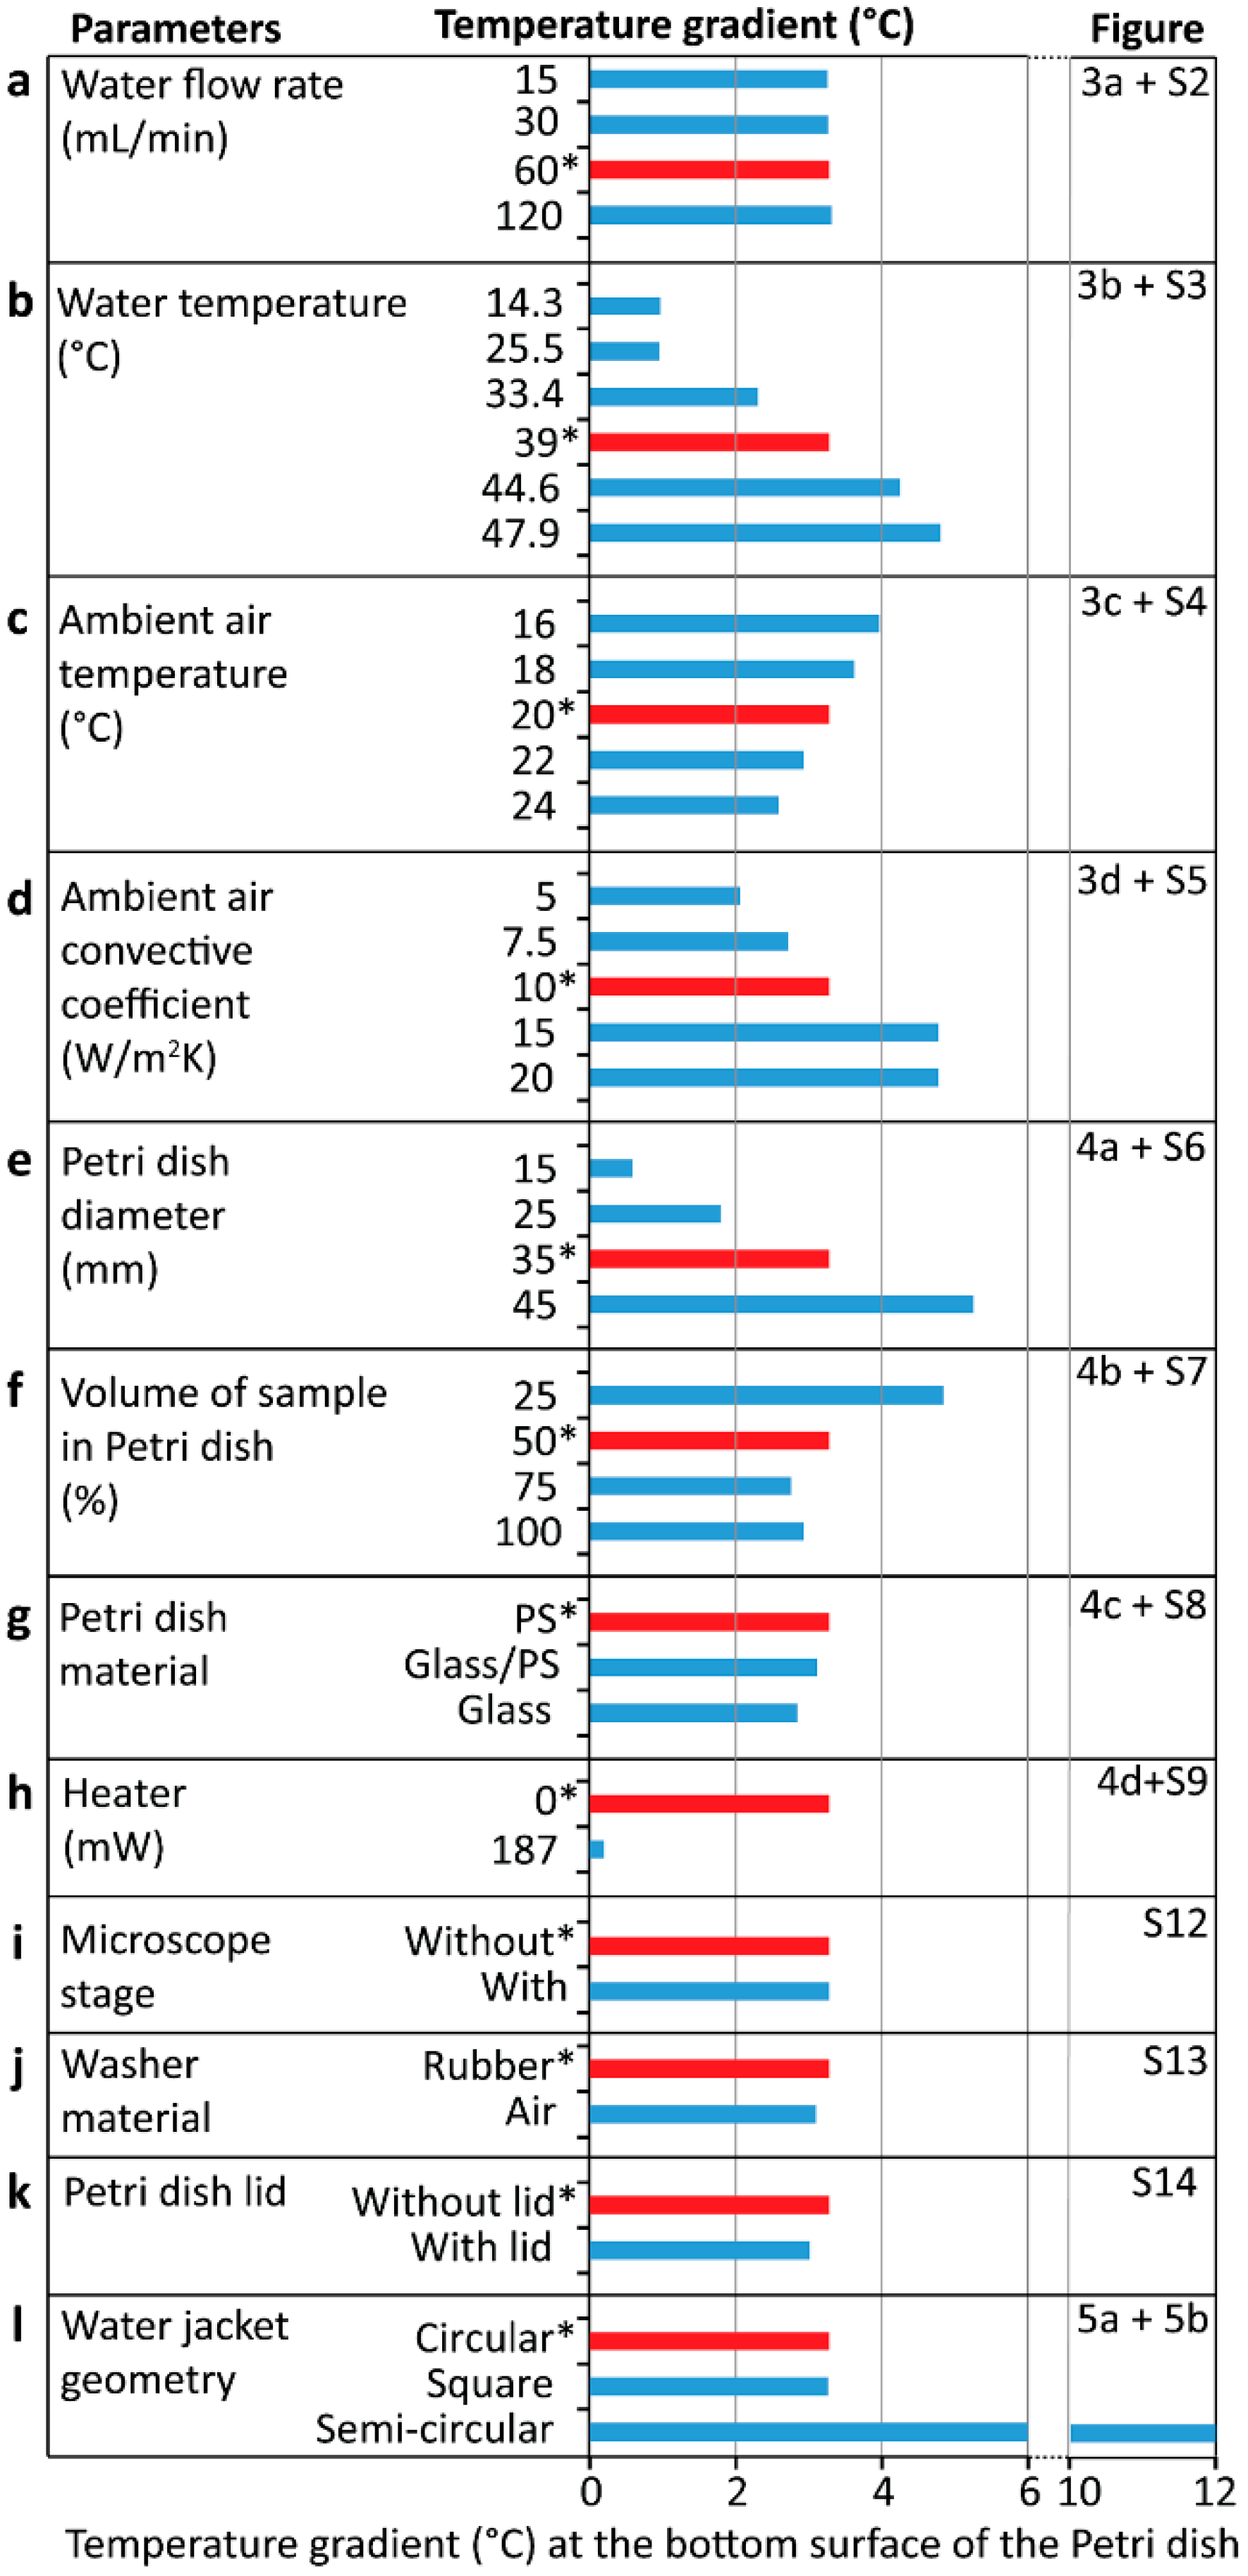
Figure 6 compares the magnitude of the temperature gradient along the radial axis of the Petri dish (
z = 1 mm) for all stable cases presented in
Figure 2,
Figure 3,
Figure 4 and
Figure 5. We also investigated the effect of microscope stage, washer material, and Petri dish lid on the thermal characteristics of the water jacket system, as presented in
Figures S12–S14. It should be noted that a lid is usually inserted on the Petri dish in order to maintain sterility of the sample, which is a crucial condition for cell culture. A quick look at this figure reveals that the following five parameters, including the (i) flow rate of the water recirculating through the water jacket, (ii) Petri dish material, (iii) placing of the Petri dish on a microscope stage, (iv) washer material, and (v) inserting a lid onto the Petri dish, did not change the temperature gradient significantly. In contrast, the following seven parameters significantly changed the temperature gradient across the sample, as summarized below:
Water inlet temperature: Increase of water inlet temperature from 25 to 45 °C increased the temperature gradient from 1 to 4.4 °C, as presented in
Figure 3b and
Figure S3. Interestingly, similar temperature gradients were obtained for water inlet temperatures of 15 °C (5 °C colder than ambient) and 25 °C (5 °C hotter than ambient), which clearly indicates the dependence of the temperature gradient on the ambient temperature.
Ambient temperature: Decrease of ambient temperature from 24 to 16 °C increased the temperature gradient from 2.4 to 4 °C, as presented in
Figure 3c and
Figure S4.
Free convection coefficient: Increase of free convection coefficient occurred at the free surfaces of the system from 5 to 20 W/m
2K increased the temperature gradient from 2.1 to 4.3 °C, as presented in
Figure 3d and
Figure S5.
Petri dish diameter: Decrease of the Petri dish diameter from 45 to 15 mm (50% filled in all cases) decreased the temperature gradient from 5.1 to 0.9 °C, as presented in
Figure 4a and
Figure S6.
Sample volume: Increase of the volume of the sample inside the Petri dish from 25% to 75% (for a 35 mm diameter Petri dish) decreased the temperature gradient from 4.2 to 2.9 °C, as presented in
Figure 4b and
Figure S7. A slightly higher temperature gradient was obtained when increasing the sample volume from 75% to 100%, which was attributed to higher convective loss at the top surface of the Petri dish due to higher thermal conductivity of water compared to air.
Water jacket geometry: A semi-circular water jacket led to an asymmetric temperature profile with a temperature gradient of 12 °C, the highest value obtained in our investigations, as presented in
Figure 5b.
Integrated heater: Integrating a heater underneath the Petri dish led to a uniform temperature across the sample with a temperature gradient of 0.2 °C, the lowest in our investigations, as presented in
Figure 4d and
Figure S9.
3.6. Thermal Analysis of the Water Jacket under Transient Conditions
We also investigated the thermal performance of the water jacket system under transient conditions. The inlet water temperature was increased from 39 to 48.5 °C to raise the sample temperature at the side walls from 37 to 45 °C.
An infrared thermal imaging camera was utilized to monitor the temperature distribution at the top surface of the water jacket system over a period of 30 min.
Supplementary Movie 1 presents the transient temperatures over the first 15 min of the process.
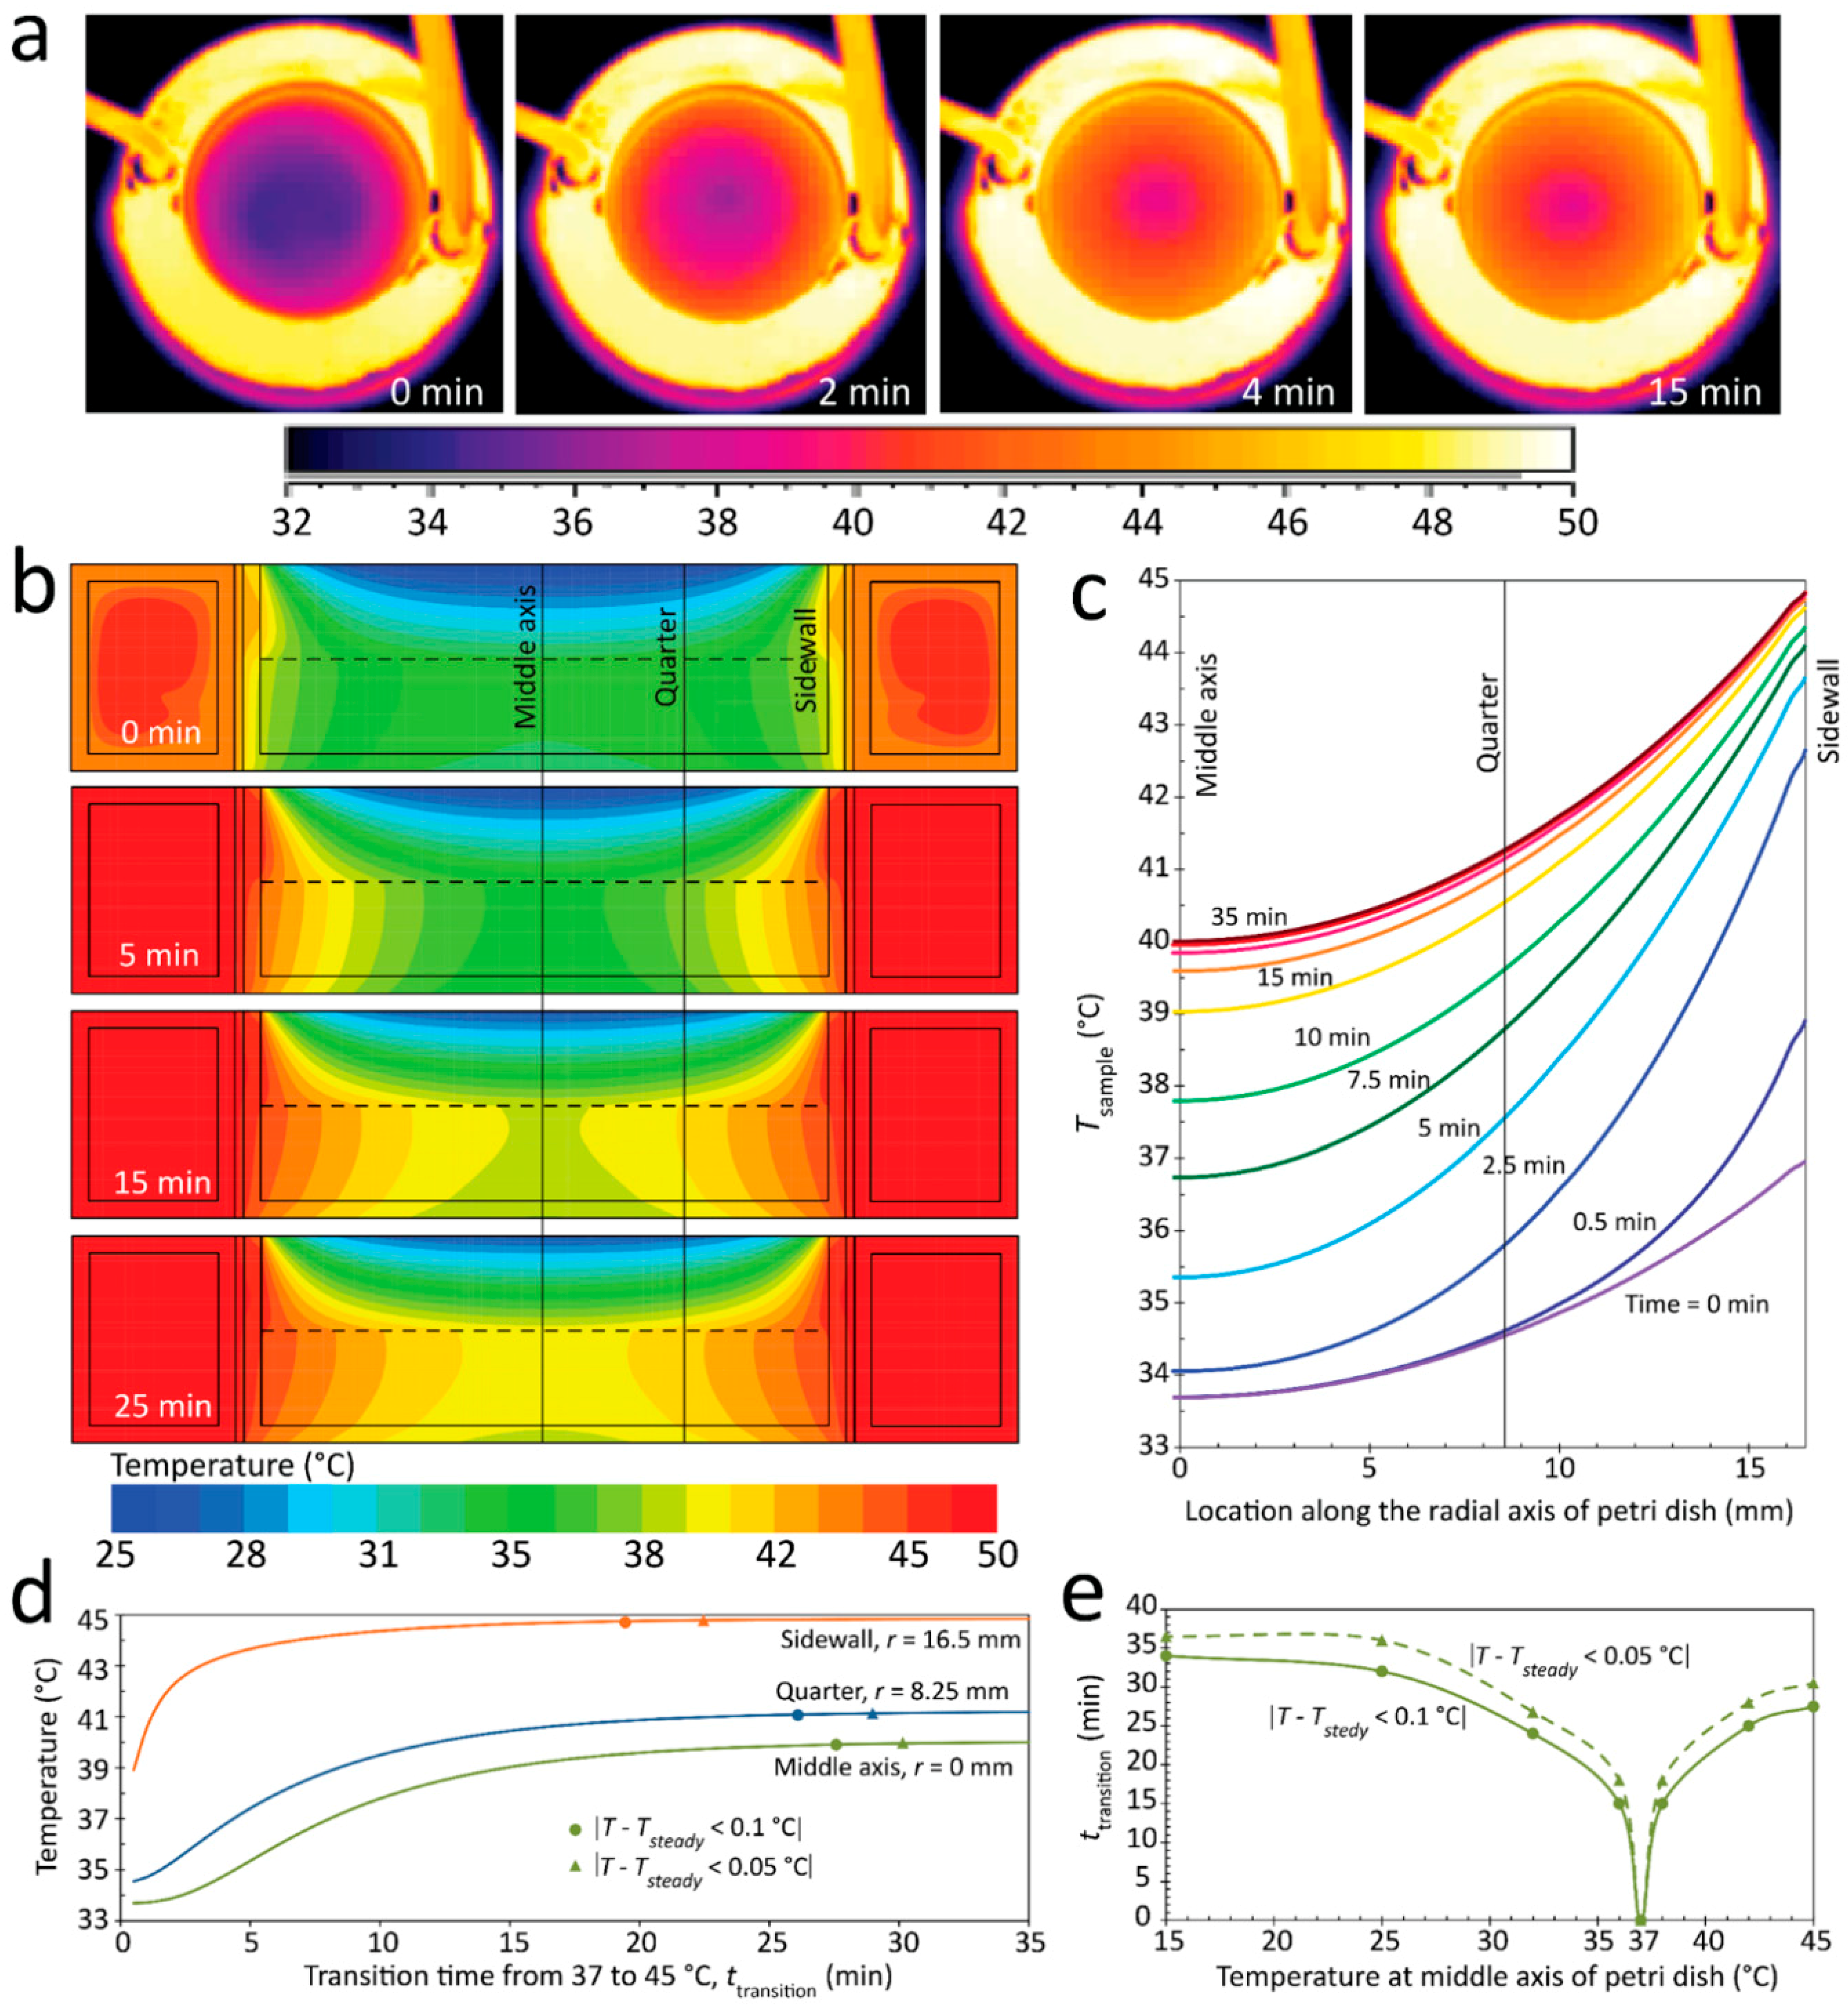
Figure 7a presents the experimental temperature contours at four snapshots, corresponding to 0.5, 2, 4 and 15 min. Our measurements revealed the rapid temperature change of the sample in the first few minutes of the process, which can be clearly seen by comparing the size of the cold region at the middle of the Petri dish that is colored in purple. The system reached its steady-state conditions within ~25 min.
Figure 7b shows the temperature contours of the system 0.5, 5, 15, and 25 min after the inlet water temperature was increased. Simulations revealed that the temperature of the water recirculating through the water jacket reaches steady-state conditions in less than 1 min due to the dominance of forced convection. In contrast, the temperature of the sample inside the Petri dish reached steady-state conditions in >25 min due to dominance of conduction. The detailed temperature contours from 0 to 35 min are presented in
Figure S15.
Figure 7c compares the dynamic temperature profiles along the radial axis of the Petri dish at different time steps ranging from 0 to 35 min before the entire system reached steady-state conditions. The simulations revealed that the rate of temperature change reduces toward the end of the process, which is in line with our experiments. For example, while the middle region of the Petri dish experienced a temperature rise of ~5.5 °C from 0 to 15 min, it only experienced a temperature rise of ~1 °C from 15 to 35 min.
Figure 7d further investigates the temporal temperature changes at the three representative locations of the Petri dish, including the middle, quarter, and sidewall axes, as shown in
Figure 7c. The sidewall region, influenced by convection heat exchange through the sidewalls of the Petri dish, experienced a relatively quick temperature rise. Alternatively, the middle region, influenced by conductive heat exchange, experienced a relatively slow temperature rise. The quarter region, although symmetrically located between the sidewall and middle regions, was more influenced by the conduction mechanism.
Next, we defined the following two criteria to assess the “transition period,” or the amount of time required to obtain new steady state conditions across these three regions, in which Tsteady is the target steady-state temperature at each of those regions when the sample temperature is set to 45 °C.
Using the first criteria, the “transition periods” across the sidewall, quarter, and middle regions were 19, 26, and 27 min, respectively, as shown by the circles in
Figure 7d. In comparison, using the second criteria, the “transition period” across the sidewall, quarter, and middle regions increased to 22, 28.5, and 30.5 min, respectively, as shown by the triangles in
Figure 7d.
Figure 7e shows the “transition period” based on the middle region of the Petri dish for different transient conditions obtained from both criteria defined in Equations (14) and (15). These transient conditions include three “heating” cases set to increase the temperature of the sample from 37 to 38, 42 and 45 °C, and four “cooling” cases set to decrease the temperature of the sample from 37 to 36, 32, 25, and 15 °C, as presented in
Figures S16–S18. The simulations revealed that the “transition period” depended on the magnitude of the temperature change, defined as
. For example, using the first criterion, the “transition period” can be described as
for the “heating” cases and
for the “cooling” cases. Interestingly, the transition period was almost symmetrical with respect to the initial temperature of the sample, as shown for the cases of 37 ± 1 °C and 37 ± 5 °C. More interestingly, the “transition period” for the case of 37 ± 1 °C was 15 min, indicating the ineffectiveness of the water jacket system for handling small temperature changes.
3.7. Comparison of Sample ‘Transition Period’ under Different Dynamic Conditions
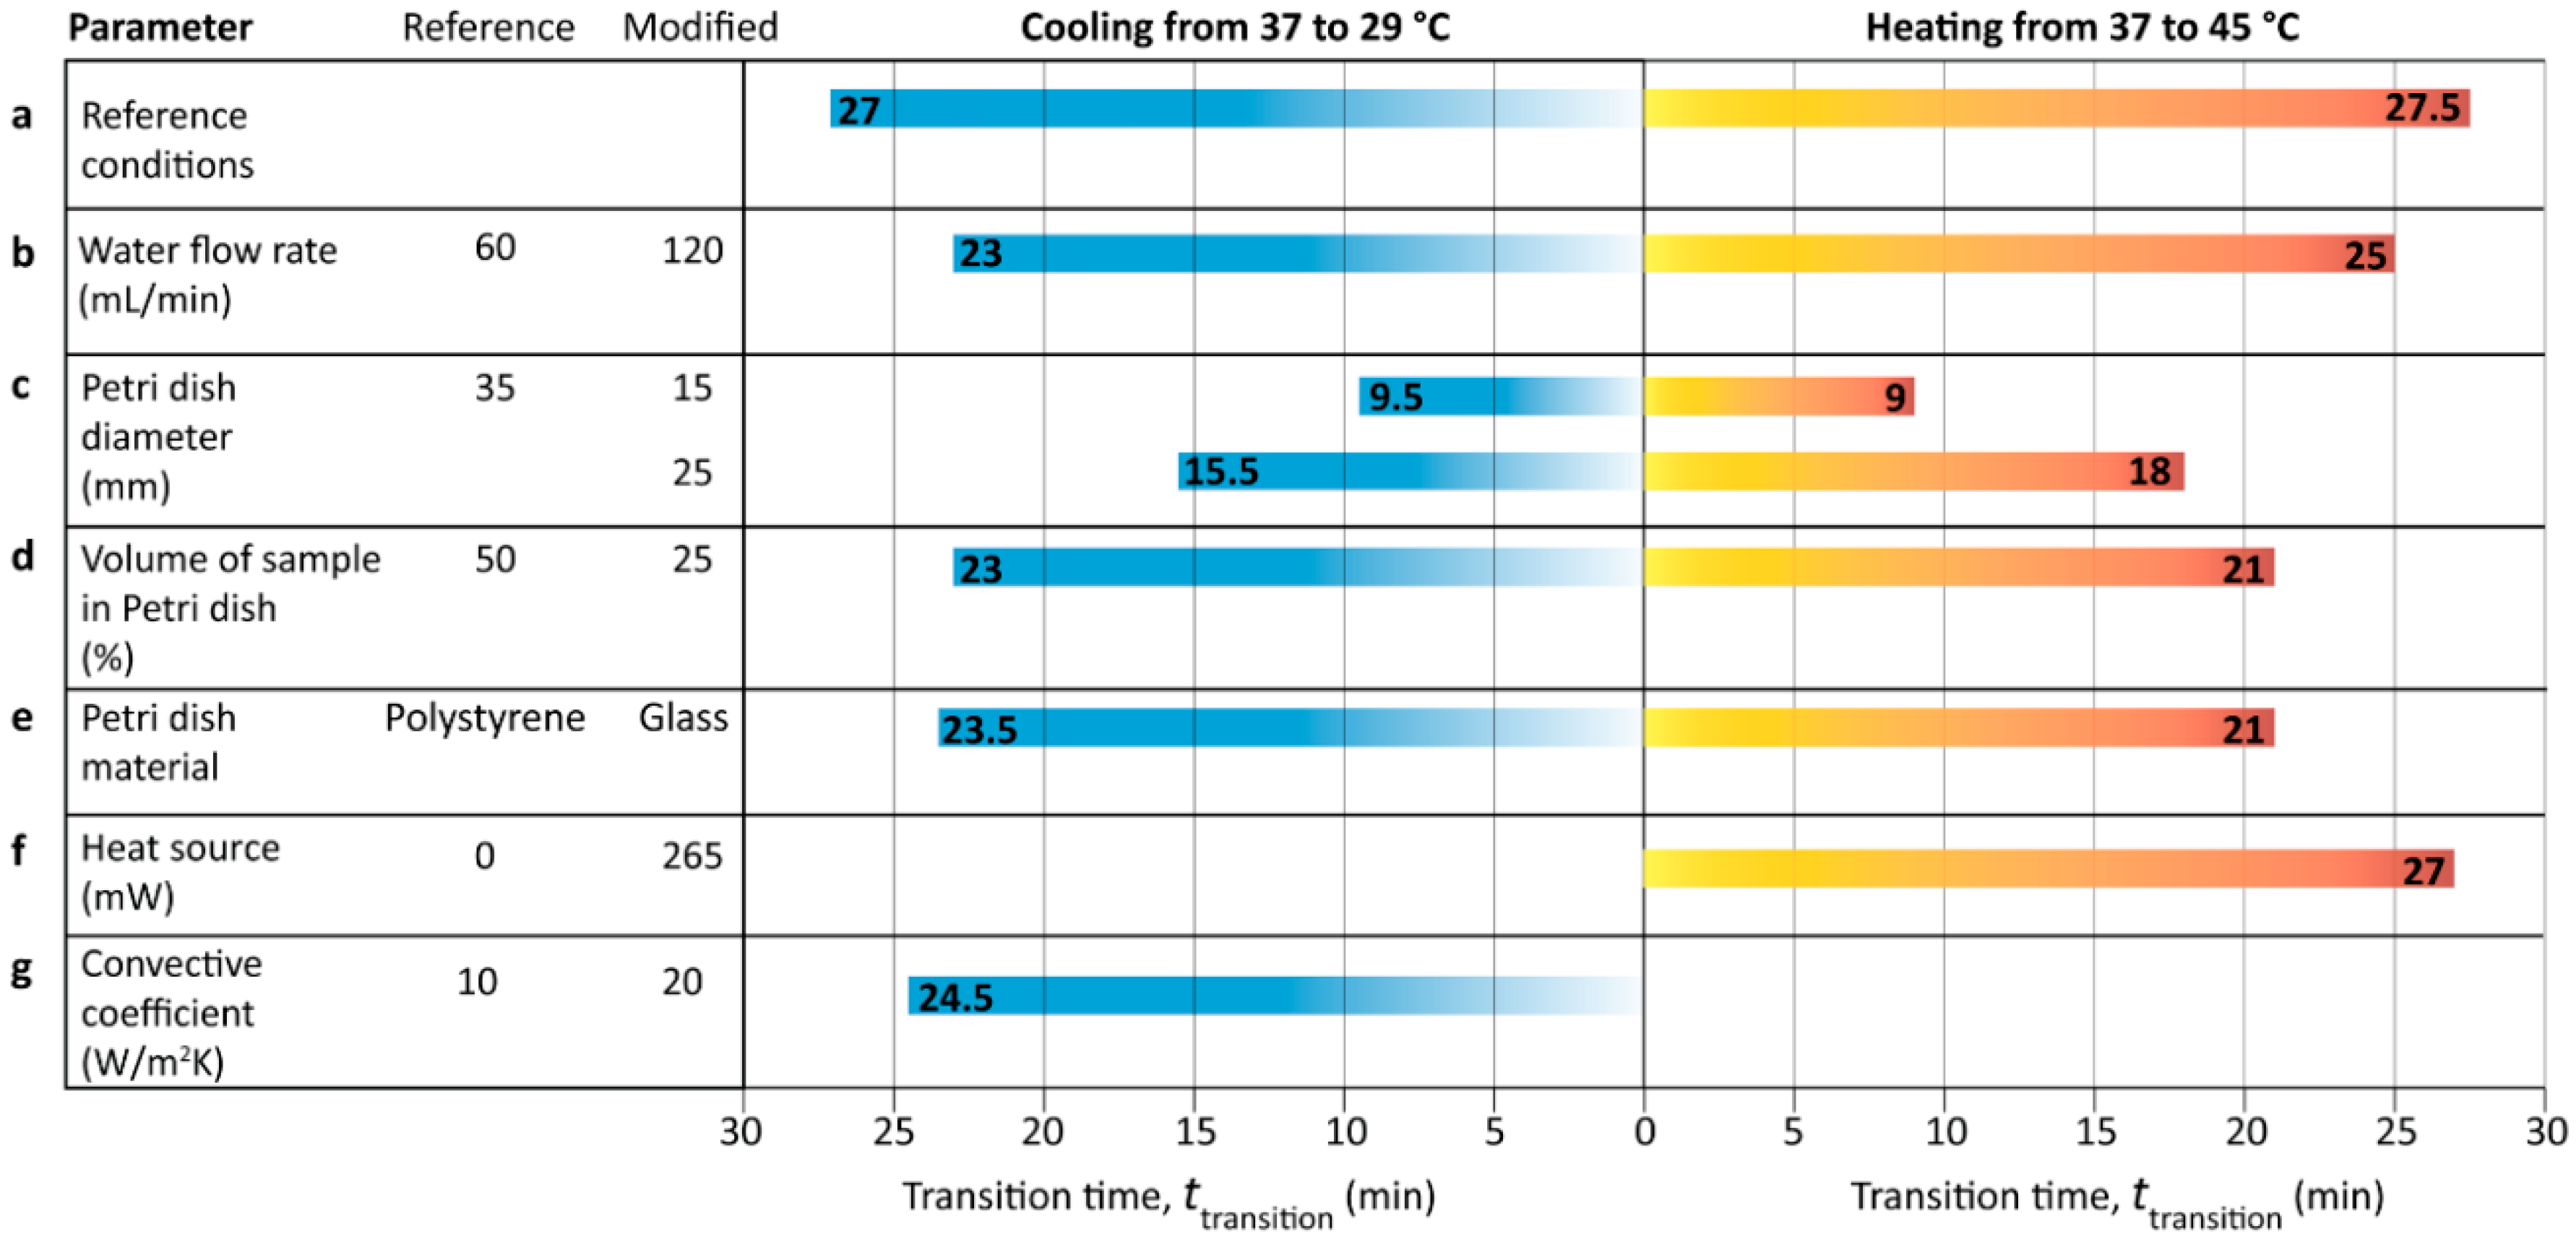
The transient simulations were further extended to analyze the transition period of the sample using different strategies and based on Equation (14), as summarized in
Figure 8. Simulations were conducted under the 37 ± 8 °C condition, corresponding to the heating (37 to 45 °C) and cooling (37 to 29 °C) cases. The detailed transient temperature contours corresponding to the different cases are presented in
Figures S19–S25. No significant differences were observed between the transition period of the heating and cooling cases, which is in line with our findings shown in
Figure 7e.
Based on our results, the strategies can be categorized into three groups according to their effectiveness for shortening the transition period, as discussed below:
Group one: doubling the flow rate of recirculating water, integrating the heater underneath the Petri dish, and doubling the localized convective heat transfer coefficient at the bottom surface of the Petri dish (by placing a small fan) shortened the transition period by ~10%. The integrated heating system described here operates by setting the water inlet temperature to 45.7 °C, and the heater power to 265 mW, under which the sample temperature reaches 45 °C under steady state conditions, and the temperature gradient across the Petri dish decreases to 0.5 °C, as presented in
Figure S9. Despite its effectiveness under stable conditions, the integrated heating system is unable to reduce the “transition period” of the sample significantly. This suggests a more holistic approach by varying the water inlet temperature and the heater power to reduce the response time of the sample while producing a low temperature gradient across the sample and avoiding overheating of the sample.
Group two: reducing the sample volume inside the Petri dish to 25%, and using a glass Petri dish instead of a polystyrene dish shortened the “transition period” by ~20%.
Group three: reducing the Petri dish diameter to 25 mm shortened the “transition period” by ~30%, and more interestingly, further reducing the Petri dish diameter to 15 mm shortened the “transition period” by ~60%.
