Article

The Wettability and Numerical Model of Different Silicon Microstructural Surfaces

1
Institute of Thermal Engineering, School of Mechanical Electronic and Control Engineering, Beijing Jiaotong University, Beijing 100044, China
2
Beijing Key Laboratory of Flow and Heat Transfer of Phase Changing in Micro and Small Scale, Beijing Jiaotong University, Beijing 100044, China
3
Beijing Huanengda Power Technology Company, Beijing 100052, China
4
Institute of Microelectronics of Chinese Academy of Sciences, Beijing 100029, China
*
Author to whom correspondence should be addressed.
Appl. Sci. 2019, 9(3), 566; https://doi.org/10.3390/app9030566
Submission received: 26 November 2018 / Revised: 22 January 2019 / Accepted: 3 February 2019 / Published: 8 February 2019

Abstract

:
Wettability is an important property of solid surfaces and is widely used in many industries. In this work, seven silicon microstructure surfaces were made by plasma immersion ion implantation (PIII) technology. The experimental contact angles and theoretical contact angles of various surfaces were compared, which indicated that the classical theory had great limitations in predicting the static contact angles of complex structures. A parameterized microstructure surface was established by computational fluid dynamics (CFD) with a volume-of-fluid (VOF) model to analyze the reasons for the differences between experimental and theoretical contact angles. Comparing the results of experiments and simulations, it was found that the VOF model can simulate the contact angle of these surfaces very well. The geometrical models of the different microstructures were simplified, and waveforms of the surfaces were obtained.

1. Introduction

Wettability describes the spreading of a liquid on a surface, and is one of the important characteristics of a solid surface [1]. Wettability has been widely used in many industries, such as surface self-cleaning [2,3,4], antibacterial products [5], fluid drag reduction [6], inkjet printing [7,8], anti-fouling products [9], anti-adhesives [10], and environmental applications [11]. Moreover, surface wettability plays an important role in boiling and condensation, such as in homogeneous nucleation, vapor condensation, and bubble growth [12,13]. The contact angle is the main parameter that characterizes the wettability of the solid surface, and it changes following variations in the surface morphology or chemical properties.
The contact angle refers to the angle formed by the tangent of the gas–liquid interface at the gas–liquid–solid intersection on the sample surface, when the droplet reaches a thermodynamic equilibrium on the solid surface. The relationship between surface tension and contact angle can be expressed as Young’s equation [14], and the wetting model is shown in Figure 1a.
cos θ Y = ( γ s g γ s l ) / γ lg
where θ Y is Young’s contact angle, γ s g , γ s l and γ l g , andare the surface tension at the solid–gas, solid–liquid, and liquid–gas interfaces, respectively. Young’s equation is applied to smooth ideal surfaces, which greatly limits its practical applications. On the basis of Yang’s theory, Wenzel [15] proposed a contact-angle prediction theory for practical surfaces, and the wetting model is shown in Figure 1b.
cos θ W * = r cos θ Y
where r represents the roughness and is defined as the ratio of the true surface area to the projected surface area, namely r 1 . The Wenzel theory assumes that the liquid is in full contact with the rough structure on the solid surface. However, when | r cos θ Y | > 1 , the surfaces do not satisfy this rule in practical applications. The Cassie–Baxter theory [16] assumes that the solid–gas composite surface is in contact with the droplet on the rough surface; in other words, the groove under the droplet is filled with gas. The wetting model is shown in Figure 1c, such that
cos θ C * = f s cos θ Y + f s 1
where f s is the solid–liquid fractional surface area. The Cassie–Baxter theory indicates that the solid–liquid fractional surface area plays a decisive role in determining the apparent contact angle. Smaller f s values generate greater Young’s contact angles and apparent contact angles ( θ C * ).
Both the Wenzel and Cassie–Baxter theories indicate that the contact angle of the actual surface is determined by both the surface morphology and Young’s contact angle. In recent years, many scholars have examined the properties of superhydrophobic surfaces owing to their excellent performances in industrial applications. The wettability of a solid surface is determined by its surface chemical energy and surface roughness. To increase the contact angle of the surface, it is necessary to reduce the surface chemical energy and to increase the surface roughness [17]. Wang et al. [18], Feng et al. [19], and Wu et al. [20] characterized the surfaces of different materials using different chemical methods, all of which enlarged the surface roughness and reduced the surface free energy with the aim of generating a hydrophobic surface and augmenting the surface contact angle. In addition, some scholars changed the surface wettability by increasing the surface roughness. Emelyanenko [21] prepared a stable and wear-resistant coating on a stainless steel surface using nanosecond laser processing, which enhanced the surface roughness and the contact angle. Kwon et al. [22] fabricated a micro-pillar array with a re-entrant structure on stainless steel by laser ablation and electrodeposition, the results of which indicated that the presence of the re-entrant structure and the increase in the surface roughness generated an increase in the surface contact angle and created a superhydrophobic surface. Hao et al. [23] measured the contact angles of five different surfaces. The measurement results indicated a decrease in the contact angles of the hydrophilic silicon wafer and the polished silicon wafer, whereas the contact angles of the other three surfaces were relatively larger. For micro-grooved surfaces, Song et al. [24] observed a larger apparent contact angle parallel to the grooves as compared to that of the smooth surface, and the microstructures exhibited a minimal effect on the contact angle perpendicular to the grooves. An increase in the grooved area and the surface energy resulted in a more anisotropic droplet. Das et al. [25] coated the metal surface with tiny nanoparticles, and Yang et al. [26] fabricated microstructures on the silicon surface by plasma immersion ion implantation (PIII) technology, both of which resulted in the contact angles of the surfaces exhibiting no obvious change. Bell et al. [27] presented a two-dimensional (2-D) thermodynamic model to describe the wetting on hierarchically grooved surfaces by droplets, of which the results indicated that the influence of gravity was negligible. Bell et al.’s results indicated that the nanoscale roughness increased the effective Young’s angle of the microscale features, thereby generating smaller required aspect ratios (height to width) for the surface structures.
In our study, we first used plasma immersion ion implantation (PIII) technology [28] to prepare microstructures on the surface of monocrystalline silicon, and studied their wetting characteristics. There was a great difference between the experimental results and the theoretical results. It was seen that the Cassie–Baxter theory had great limitations in predicting the static contact angle of complex structures. In order to analyze the reasons for the observed differences, the contact angle numerical model was set up on the basis of the volume-of-fluid (VOF) model, and a simplified waveform of the microstructure surfaces was obtained.

2. Surface Properties of Silicon Prepared by PIII Technology

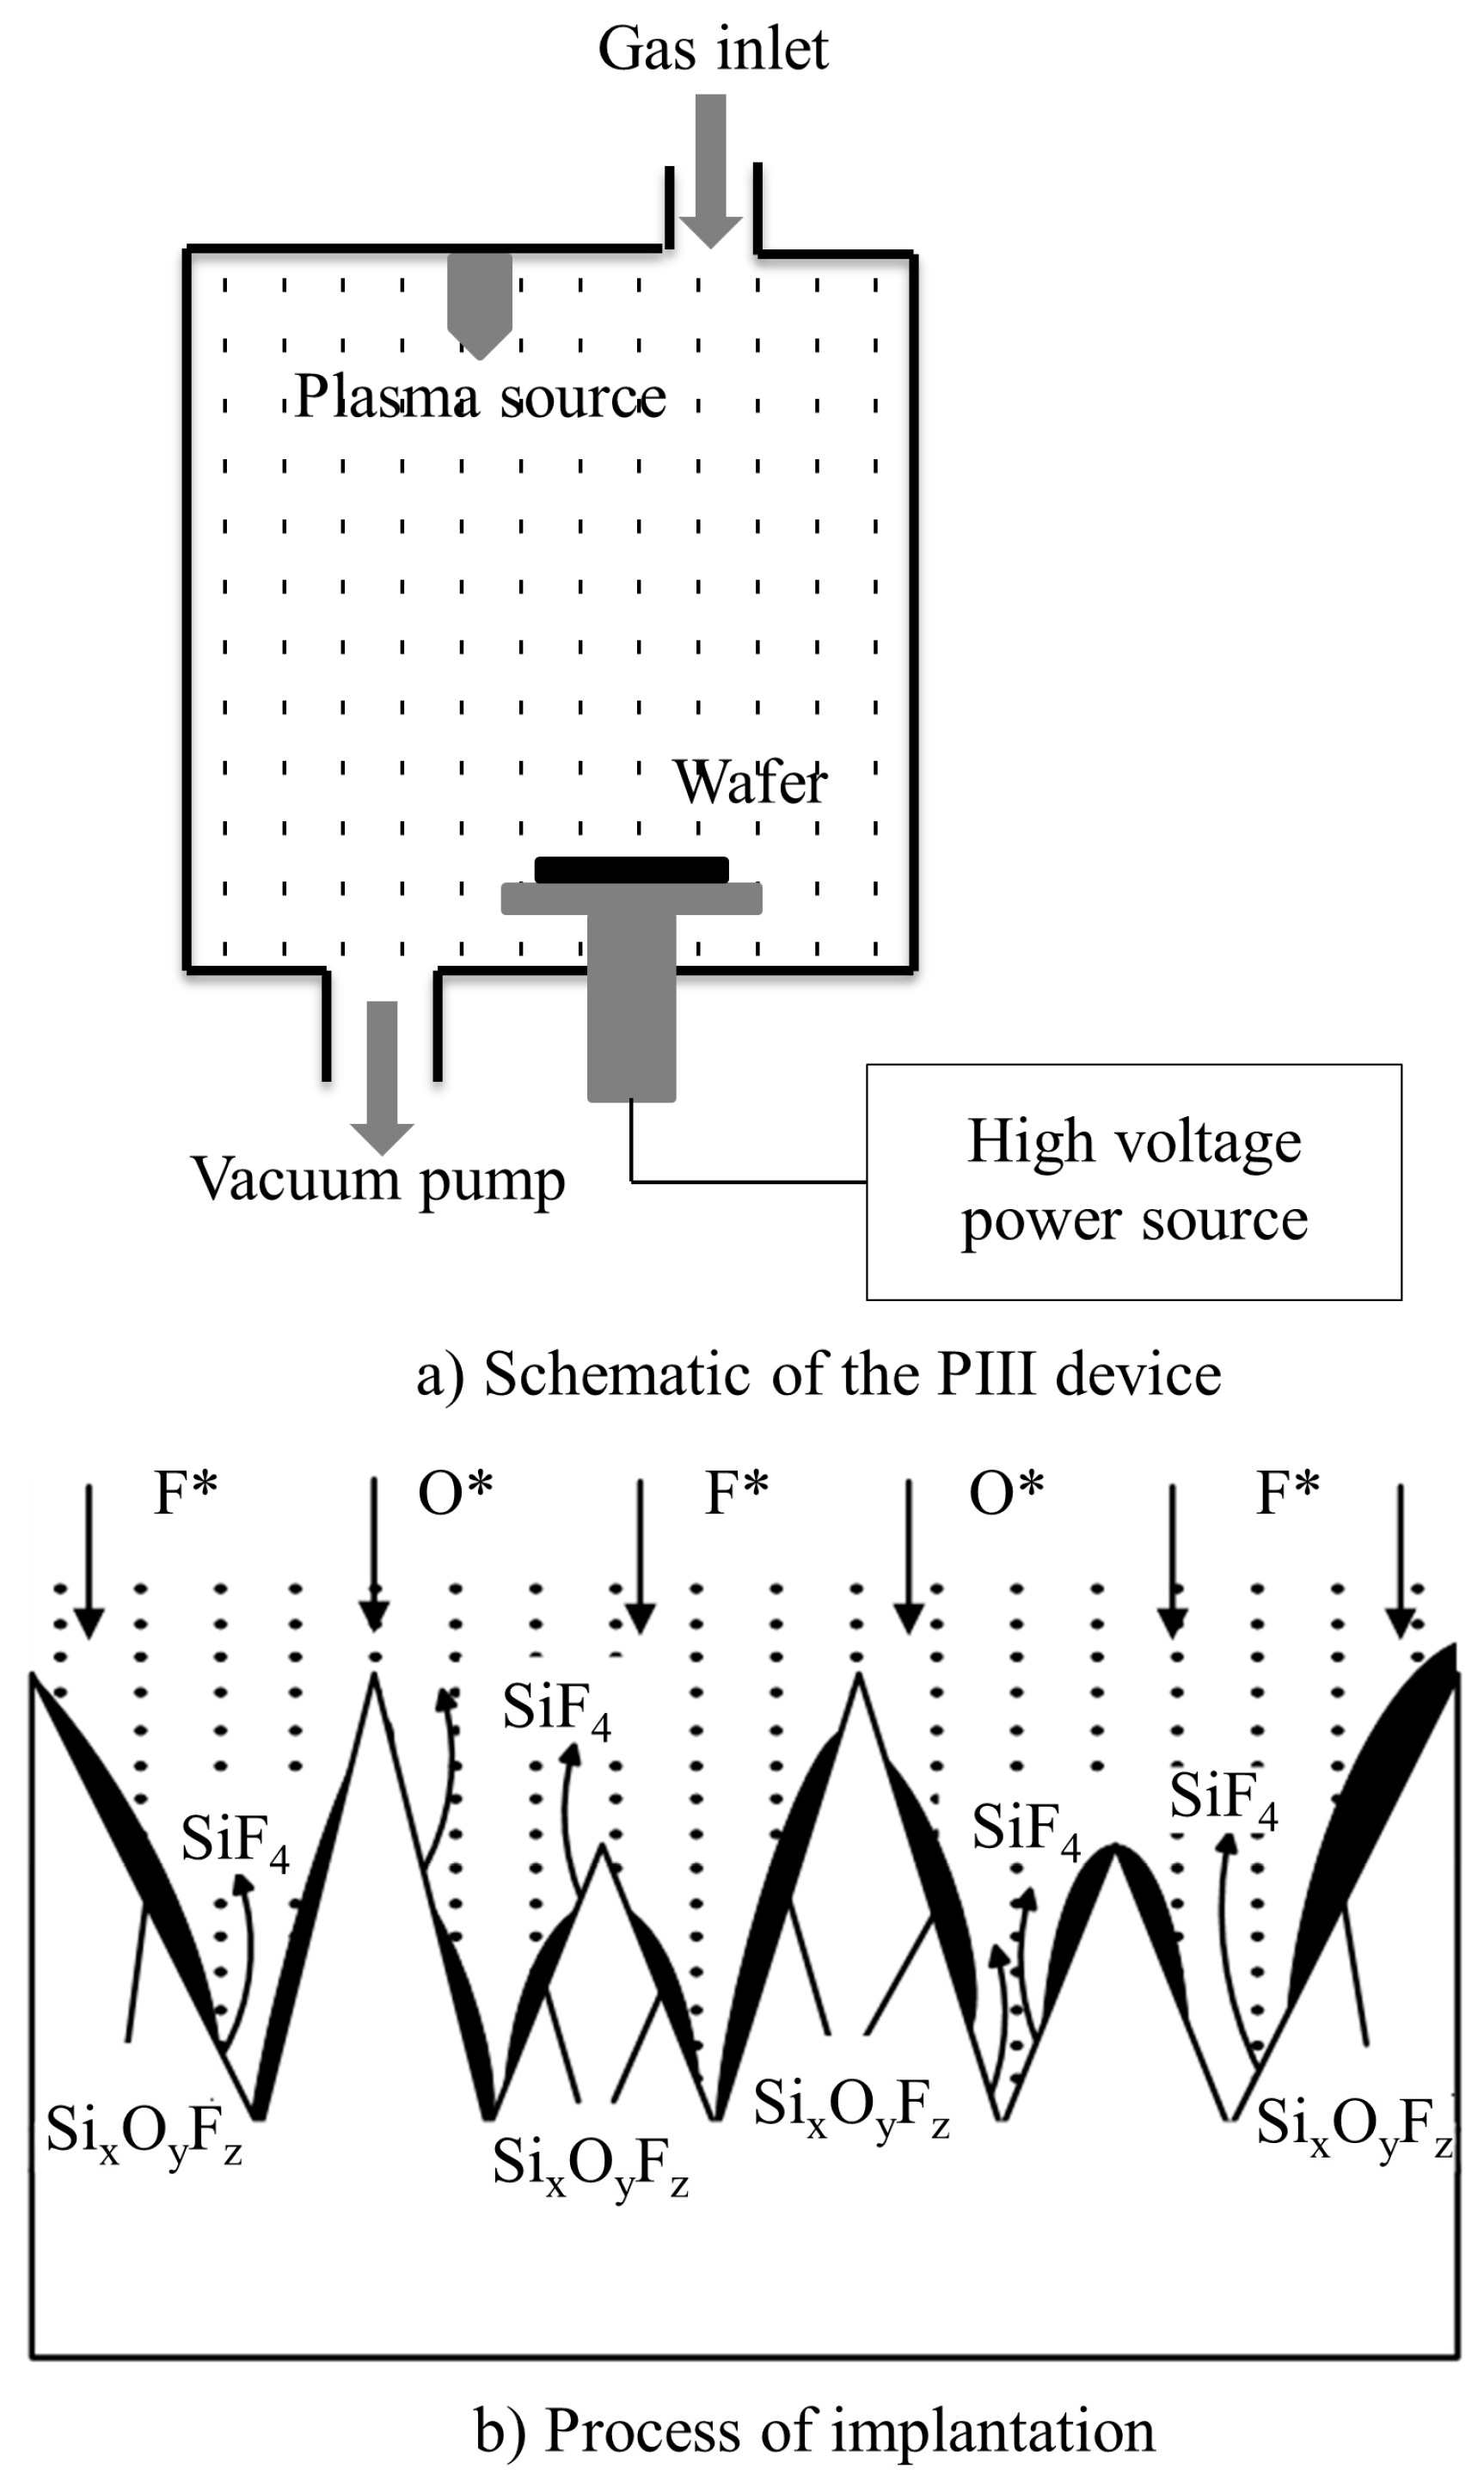
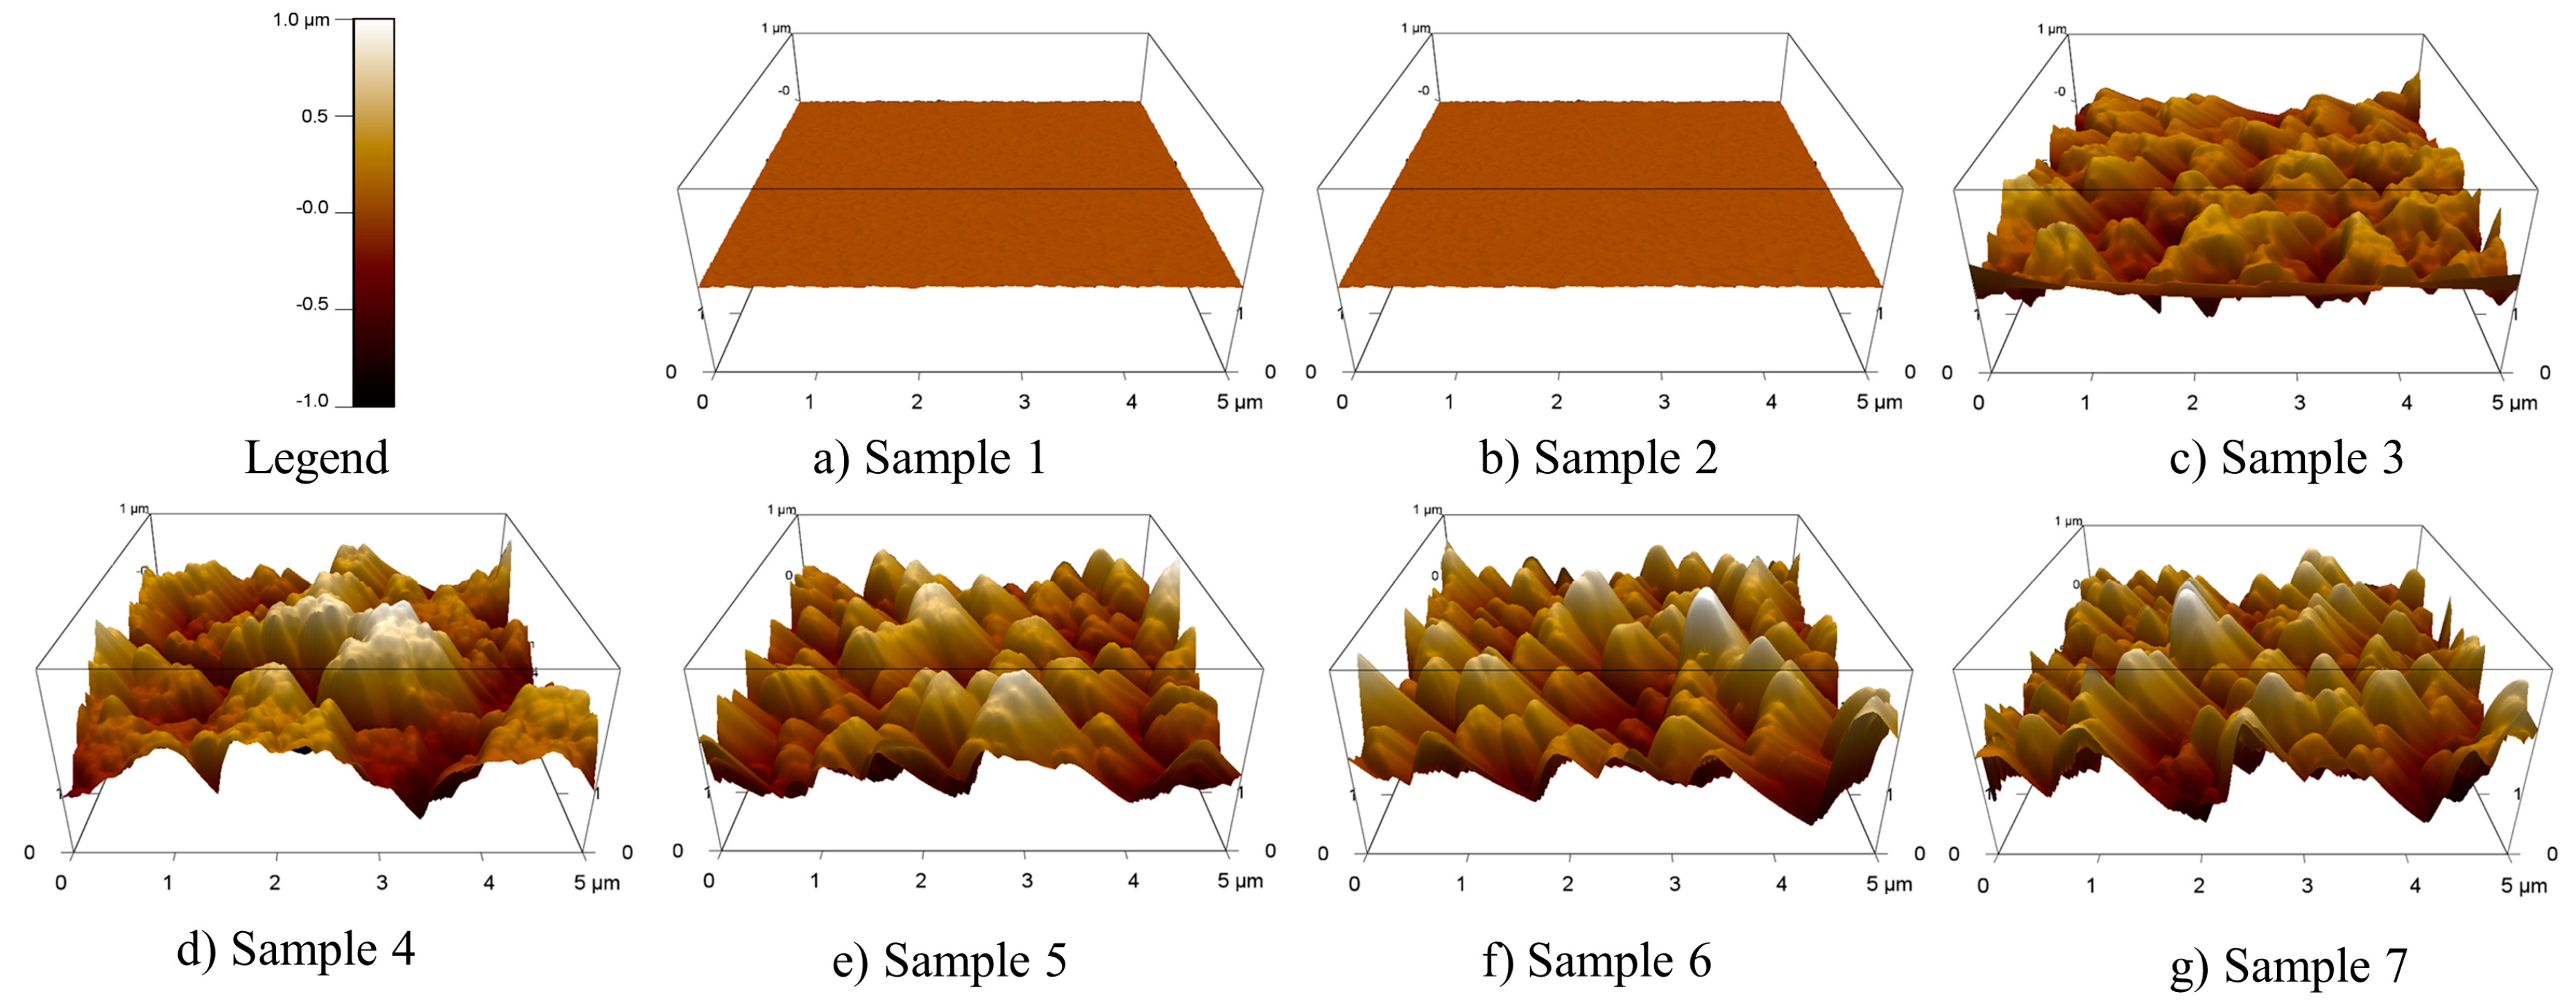
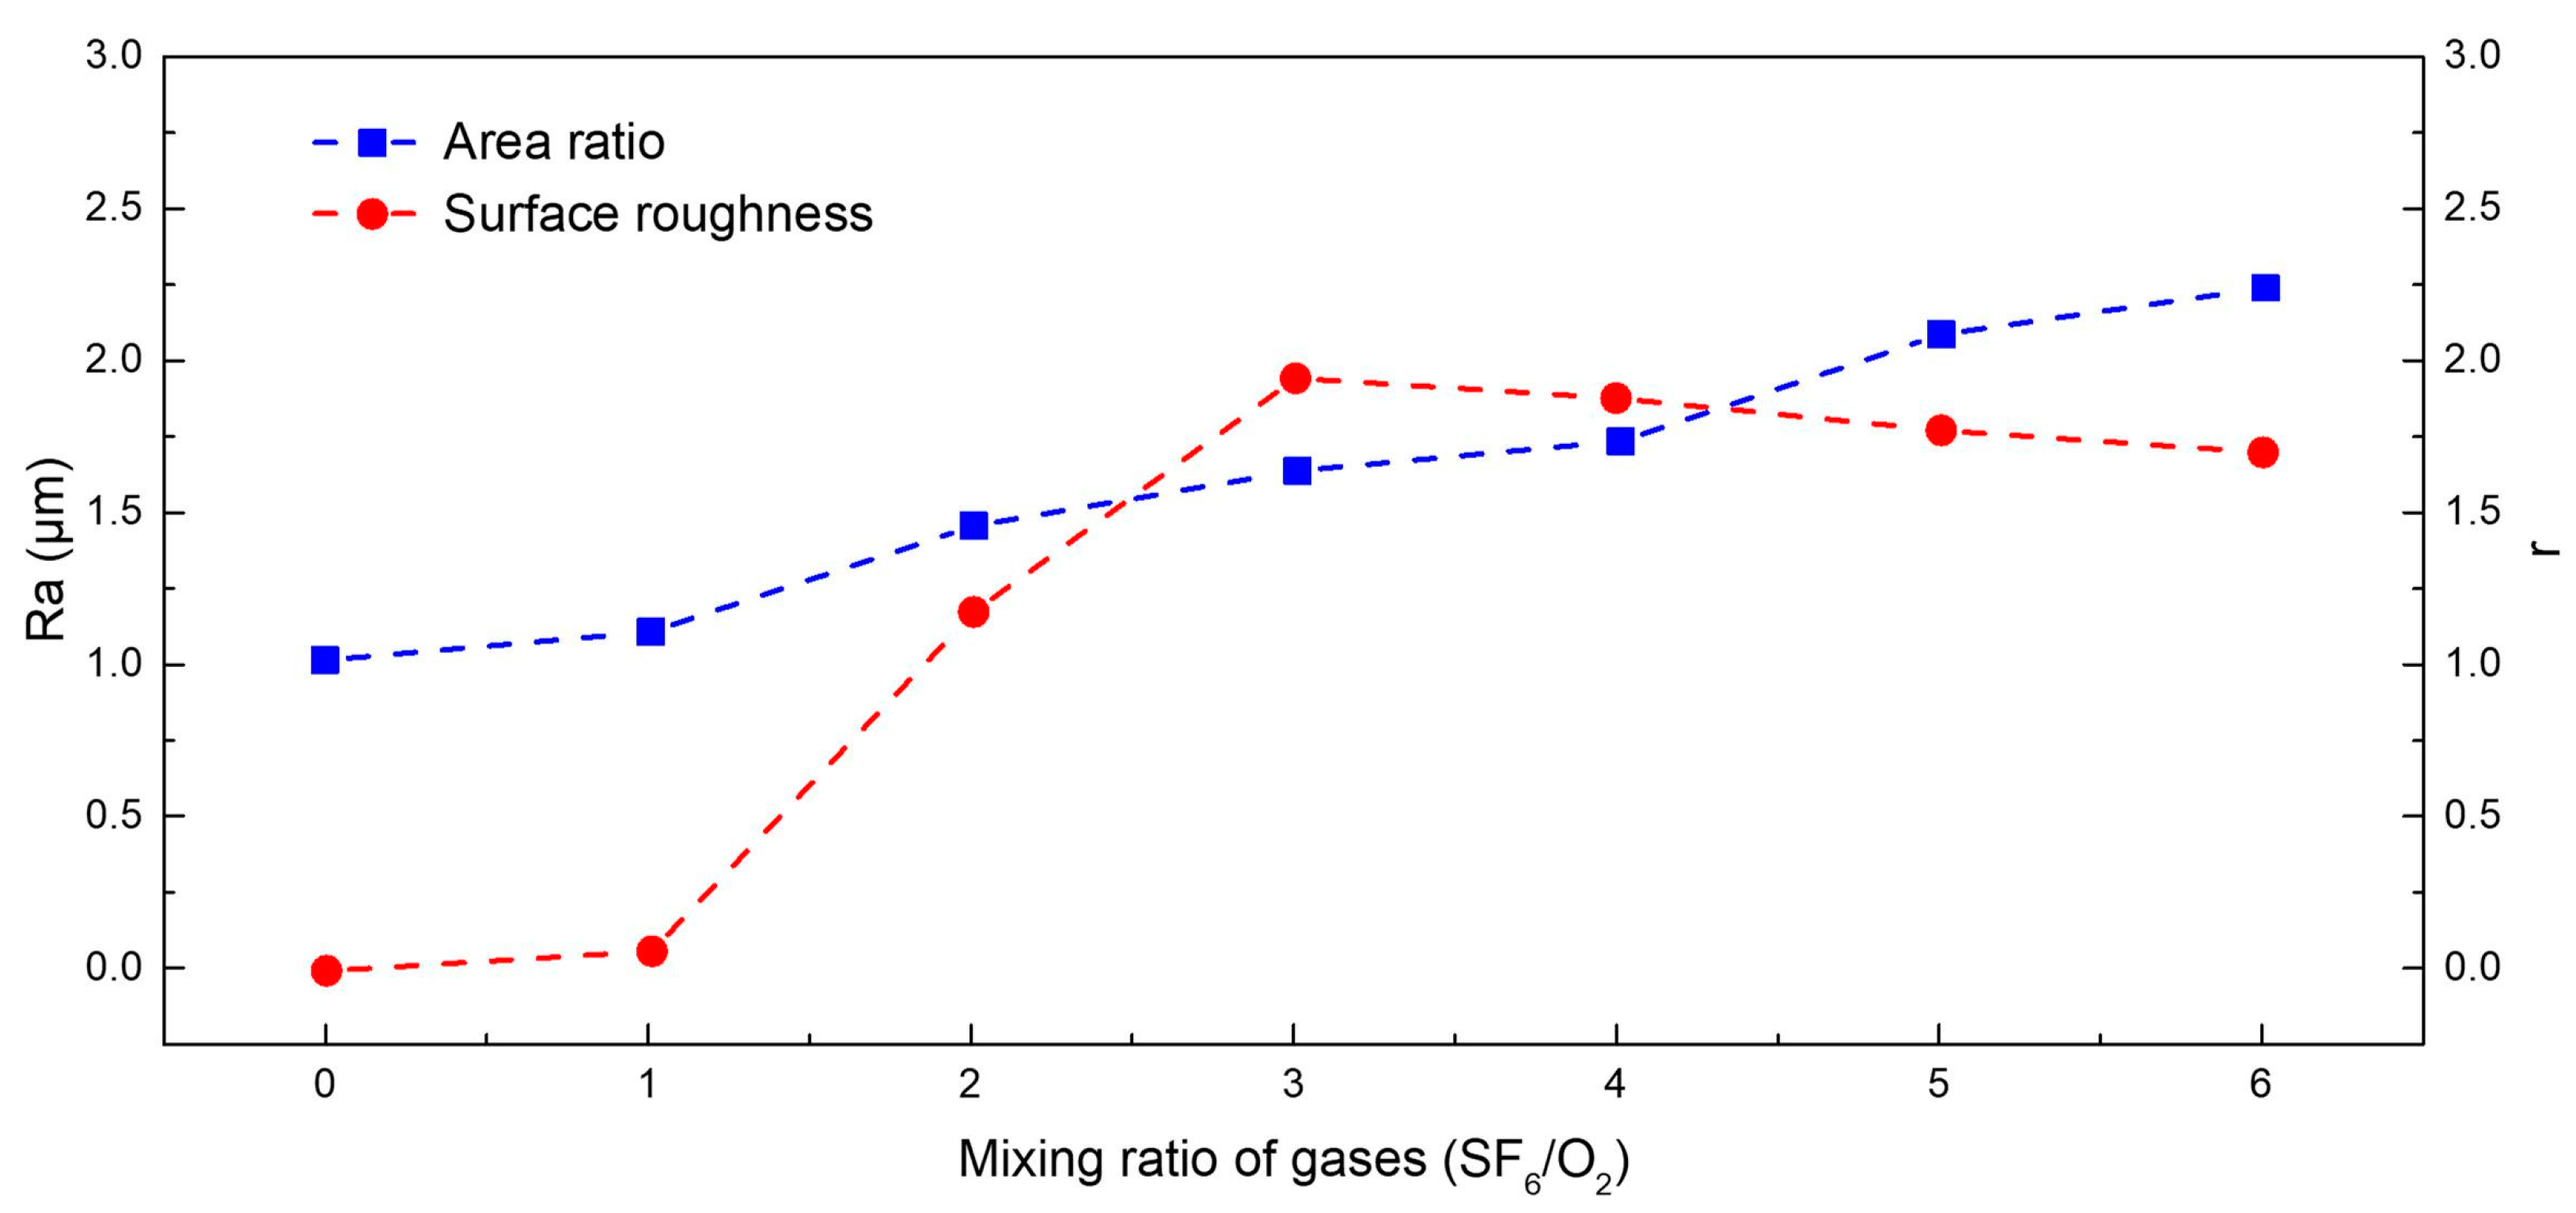
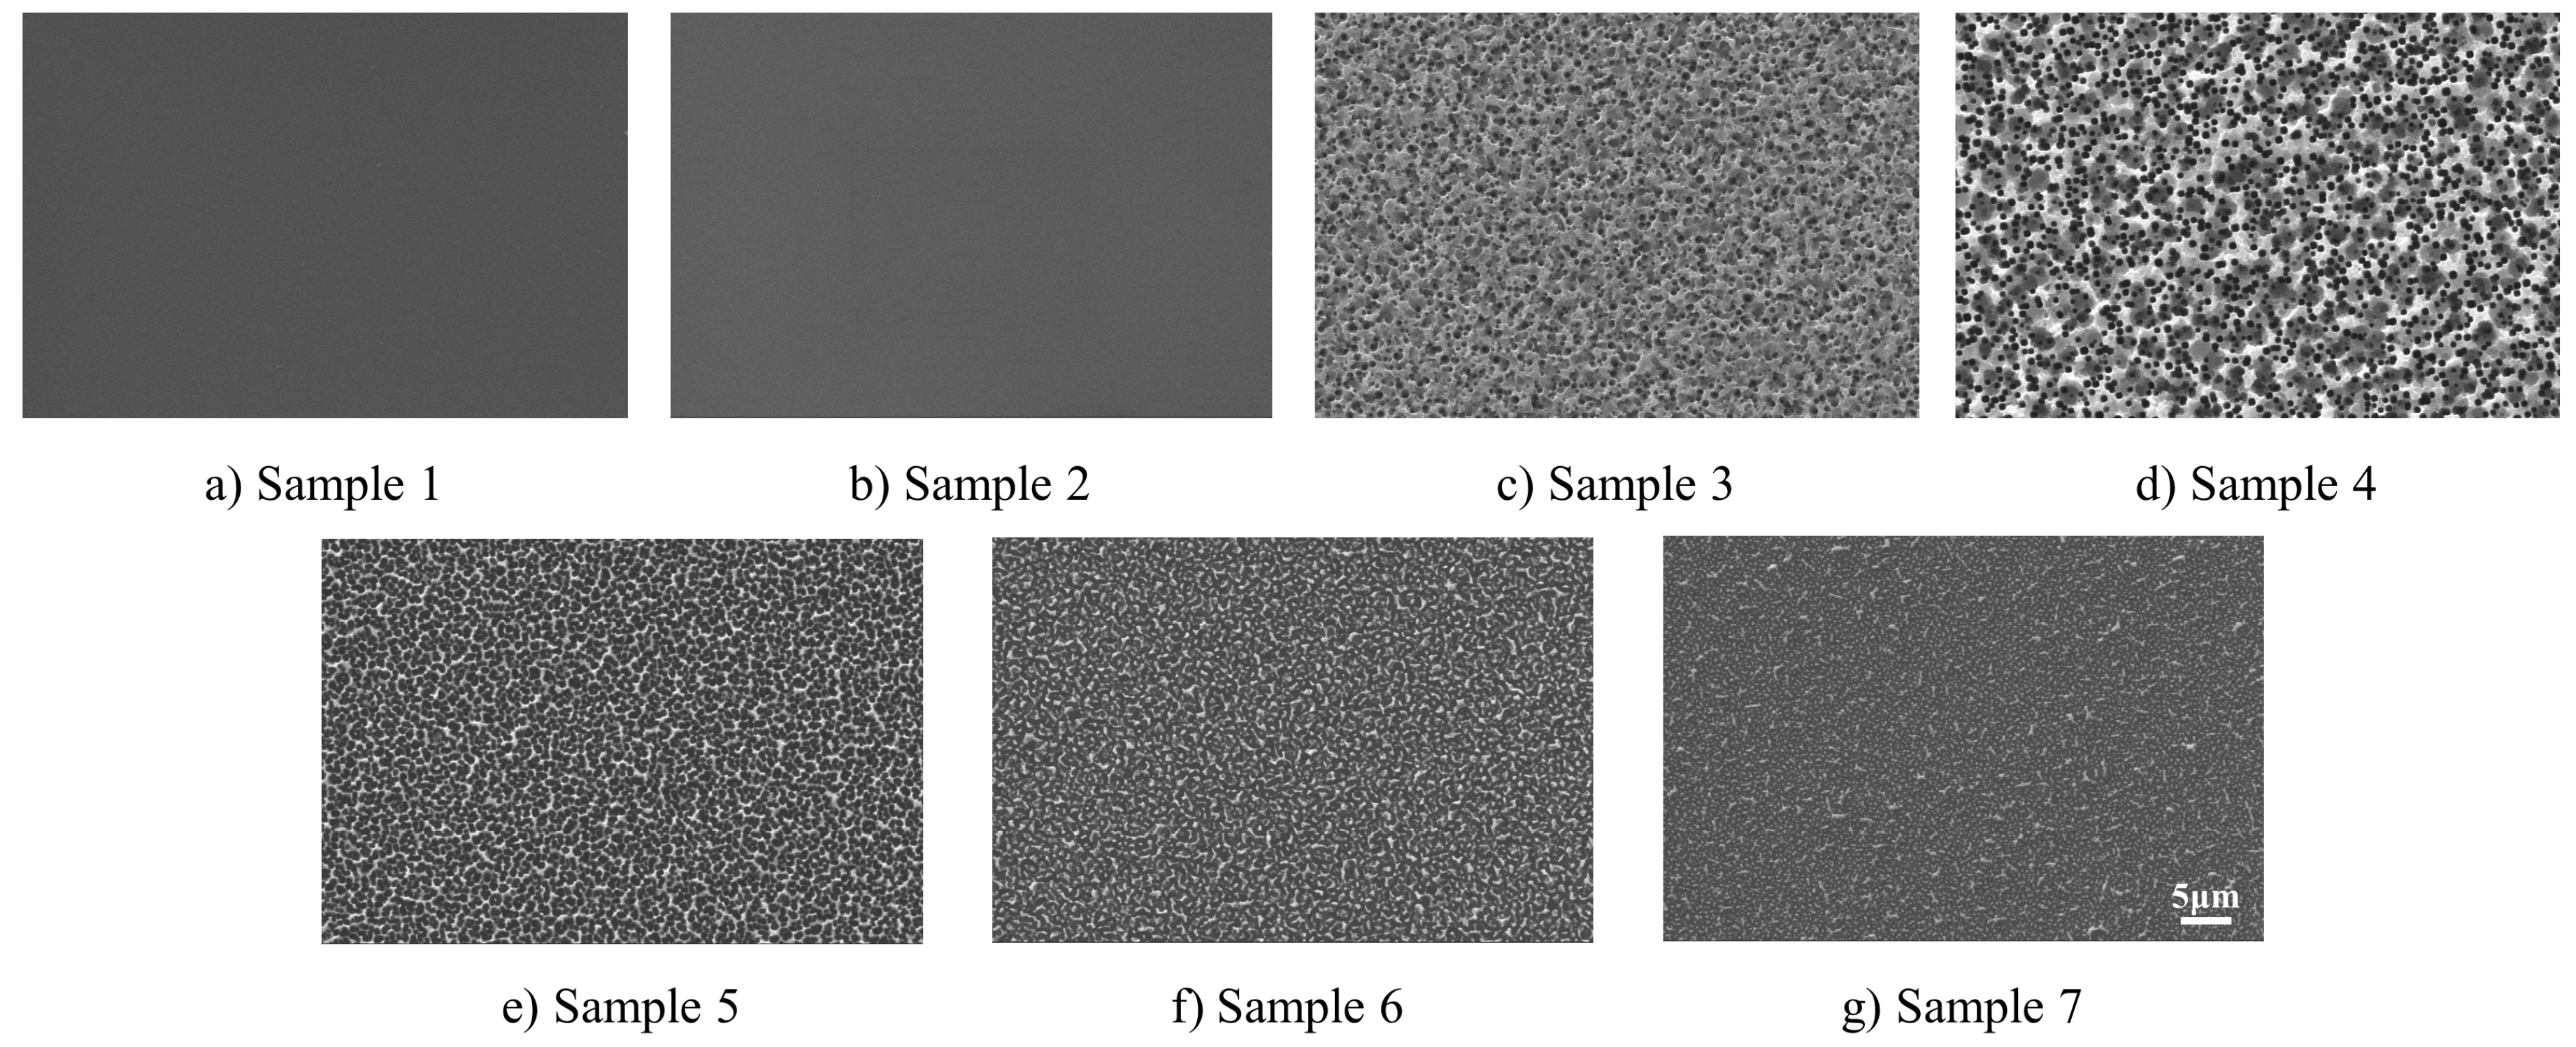
2.1. Preparation and Characterization of Microstructural Silicon Surfaces

The experimental sample was a microstructural surface prepared by plasma immersion ion implantation (PIII) technology on the surface of polished monocrystalline silicon. Figure 2a shows a schematic diagram of a plasma immersion ion implantation (PIII) device, which includes a plasma source, a vacuum chamber, a high-voltage pulse power source, and a worktable on which the sample was placed [29]. The preparation process was implemented as follows—first, the Si slice was placed on the worktable and the high-voltage pulse power source was turned on. At the same time, the SF6 and O2 produced a lot of S*, F*, and O* plasma under the ionization of the plasma source. Finally, plasma impinged the Si surface and initiated a reaction, thereby forming micro/nanostructures on the sample surface.
The process of PIII preparation included the etching reaction and the passivation reaction. Figure 2b presents the ion implantation process. The mixture of the etching gas (SF6) and the passive gas (O2) entered the vacuum chamber and the atomic groups, such as F*, SF*, S*, and O*, were generated by the ionization of the SF6 and O2 gases. When these atomic groups met the test sample, the F* entered the inside of the silicon wafer and formed a volatile gas SiF4 with the Si atoms [30]. The sample surface was etched following SiF4 gas escape from the silicon wafers. The etching reaction caused the silicon surface to be removed. Simultaneously, the O*, F*, and Si atoms underwent passivation reaction and produced SixOyFz. Passivation reaction inhibited etching reaction. When etching reaction and passivation reaction exist simultaneously, the surface of the sample formed inhomogeneous microstructures by the PIII process [29]. In order to control the surface microstructure, the SF6/O2 flow ratio, SF6 and O2 total flow rates, and reaction time were controlled during the experiment.
In this paper, six different microstructural surfaces were prepared by changing the gas mixture ratio (SF6/O2), while the reaction time and the total gas flow rate were constant. The experimental samples were numbered 1, 2, 3, 4, 5, 6, and 7 based on the ascending order of the gas mixture ratio. Eight samples were made for each mixed gas ratios. The corresponding relationship between the number and gas ratio is presented in Table 1. Sample 1 is an untreated Si surface, which is considered an ideally smooth surface. The surfaces of the samples were scanned by scanning electron microscopy (SEM) and atomic force microscopy (AFM), and the surface microstructural morphology was obtained.
The two-dimensional (2-D) surface morphology of the sample surface was obtained by SEM scanning, of which the distribution of the projection of the convex and concave structures on the surface was displayed well. The overhead views of the microstructural surface observed by SEM at 5000 times magnification are shown in Figure 3, wherein no obvious concave or concave structures on the surfaces of samples 1 and 2 are observed, whereas the surfaces of samples 3–7 exhibit obvious convex and concave structures. These results indicated the minimal presence of SF6 gas to prepare sample 2, and that the intensity of the etching reaction was far less than that of the passivation reaction. The surface of sample 2 was not significantly etched and was therefore characterized as smooth. An increase in the gas mixture ratio generated a gradual increase in the amount of SF6 gas and enhanced the intensity of the etching reaction, thereby forming an obvious microstructure on the surfaces of samples 3–7. The convex and concave microstructures were randomly distributed on the surface of the sample (the lighter the color, the higher the structure). At the same time, an increase in the SF6 gas generated a decrease in the shape and area of the local convex structure and an increase in the dispersion, thereby significantly increasing the percentage of the depression structure in the total area as well.
The SEM results exhibited an area ratio of the projection on the surface of the convex/concave structures. However, the shape and height of the convex/concave structures could not be clearly displayed through the projection. The surface morphology of the sample was further scanned by AFM, and the three-dimensional (3-D) morphology of the convex/concave structure was obtained, as seen in Figure 4. Similar to the SEM scanning results, the surfaces of samples 1 and 2 were smooth, and the surface of samples 3–7 exhibited an obvious convex structure of a volcanic heap. The AFM results also indicated that an increase in the gas mixture ratio, to a certain degree, did not exhibit any obvious physical changes in the microstructure, as observed in the surface structure of samples 5–7.
The Asylum Research AFM software (version 13.04.77, Oxford Instruments Asylum Research, Inc., CA, USA) was applied to analyze the AFM scanning data and to characterize both the surface roughness (Ra) and the area ratio (r) of the total surface area to the projected area of the microstructures. The Ra was obtained from the statistics of the average height of the convex structure, and r was obtained from the statistics of the surface area ratio of the convex/concave structure to its projection area at the horizontal plane. Figure 5 presents the relationship between the surface roughness and area ratio of the sample surface and the change in the mixing ratio of gases (SF6/O2). According to Figure 5, the change in the surface roughness and area ratio of sample 2 was very small when compared to that of sample 1, which further validated the significantly low intensity of the etching reaction to form microstructures on the sample surface under the condition of a low gas mixing ratio. In addition, an increase in the mixed gas proportion first generated a rapid increase and then a slight decrease in the surface roughness, whereas the area ratio of the sample increased continuously. These results indicated that an increase in the mixed gas proportion enhanced the etching reaction and more silicon surfaces participated in the etching reaction, thereby resulting in an increase in the area ratio. However, the surface roughness was determined by both the etching and passivation reactions. An extreme relationship was observed between the maximum roughness and the mixing ratio of the gases. In addition, too large of a mixing ratio reduced the roughness of the microstructural surfaces.

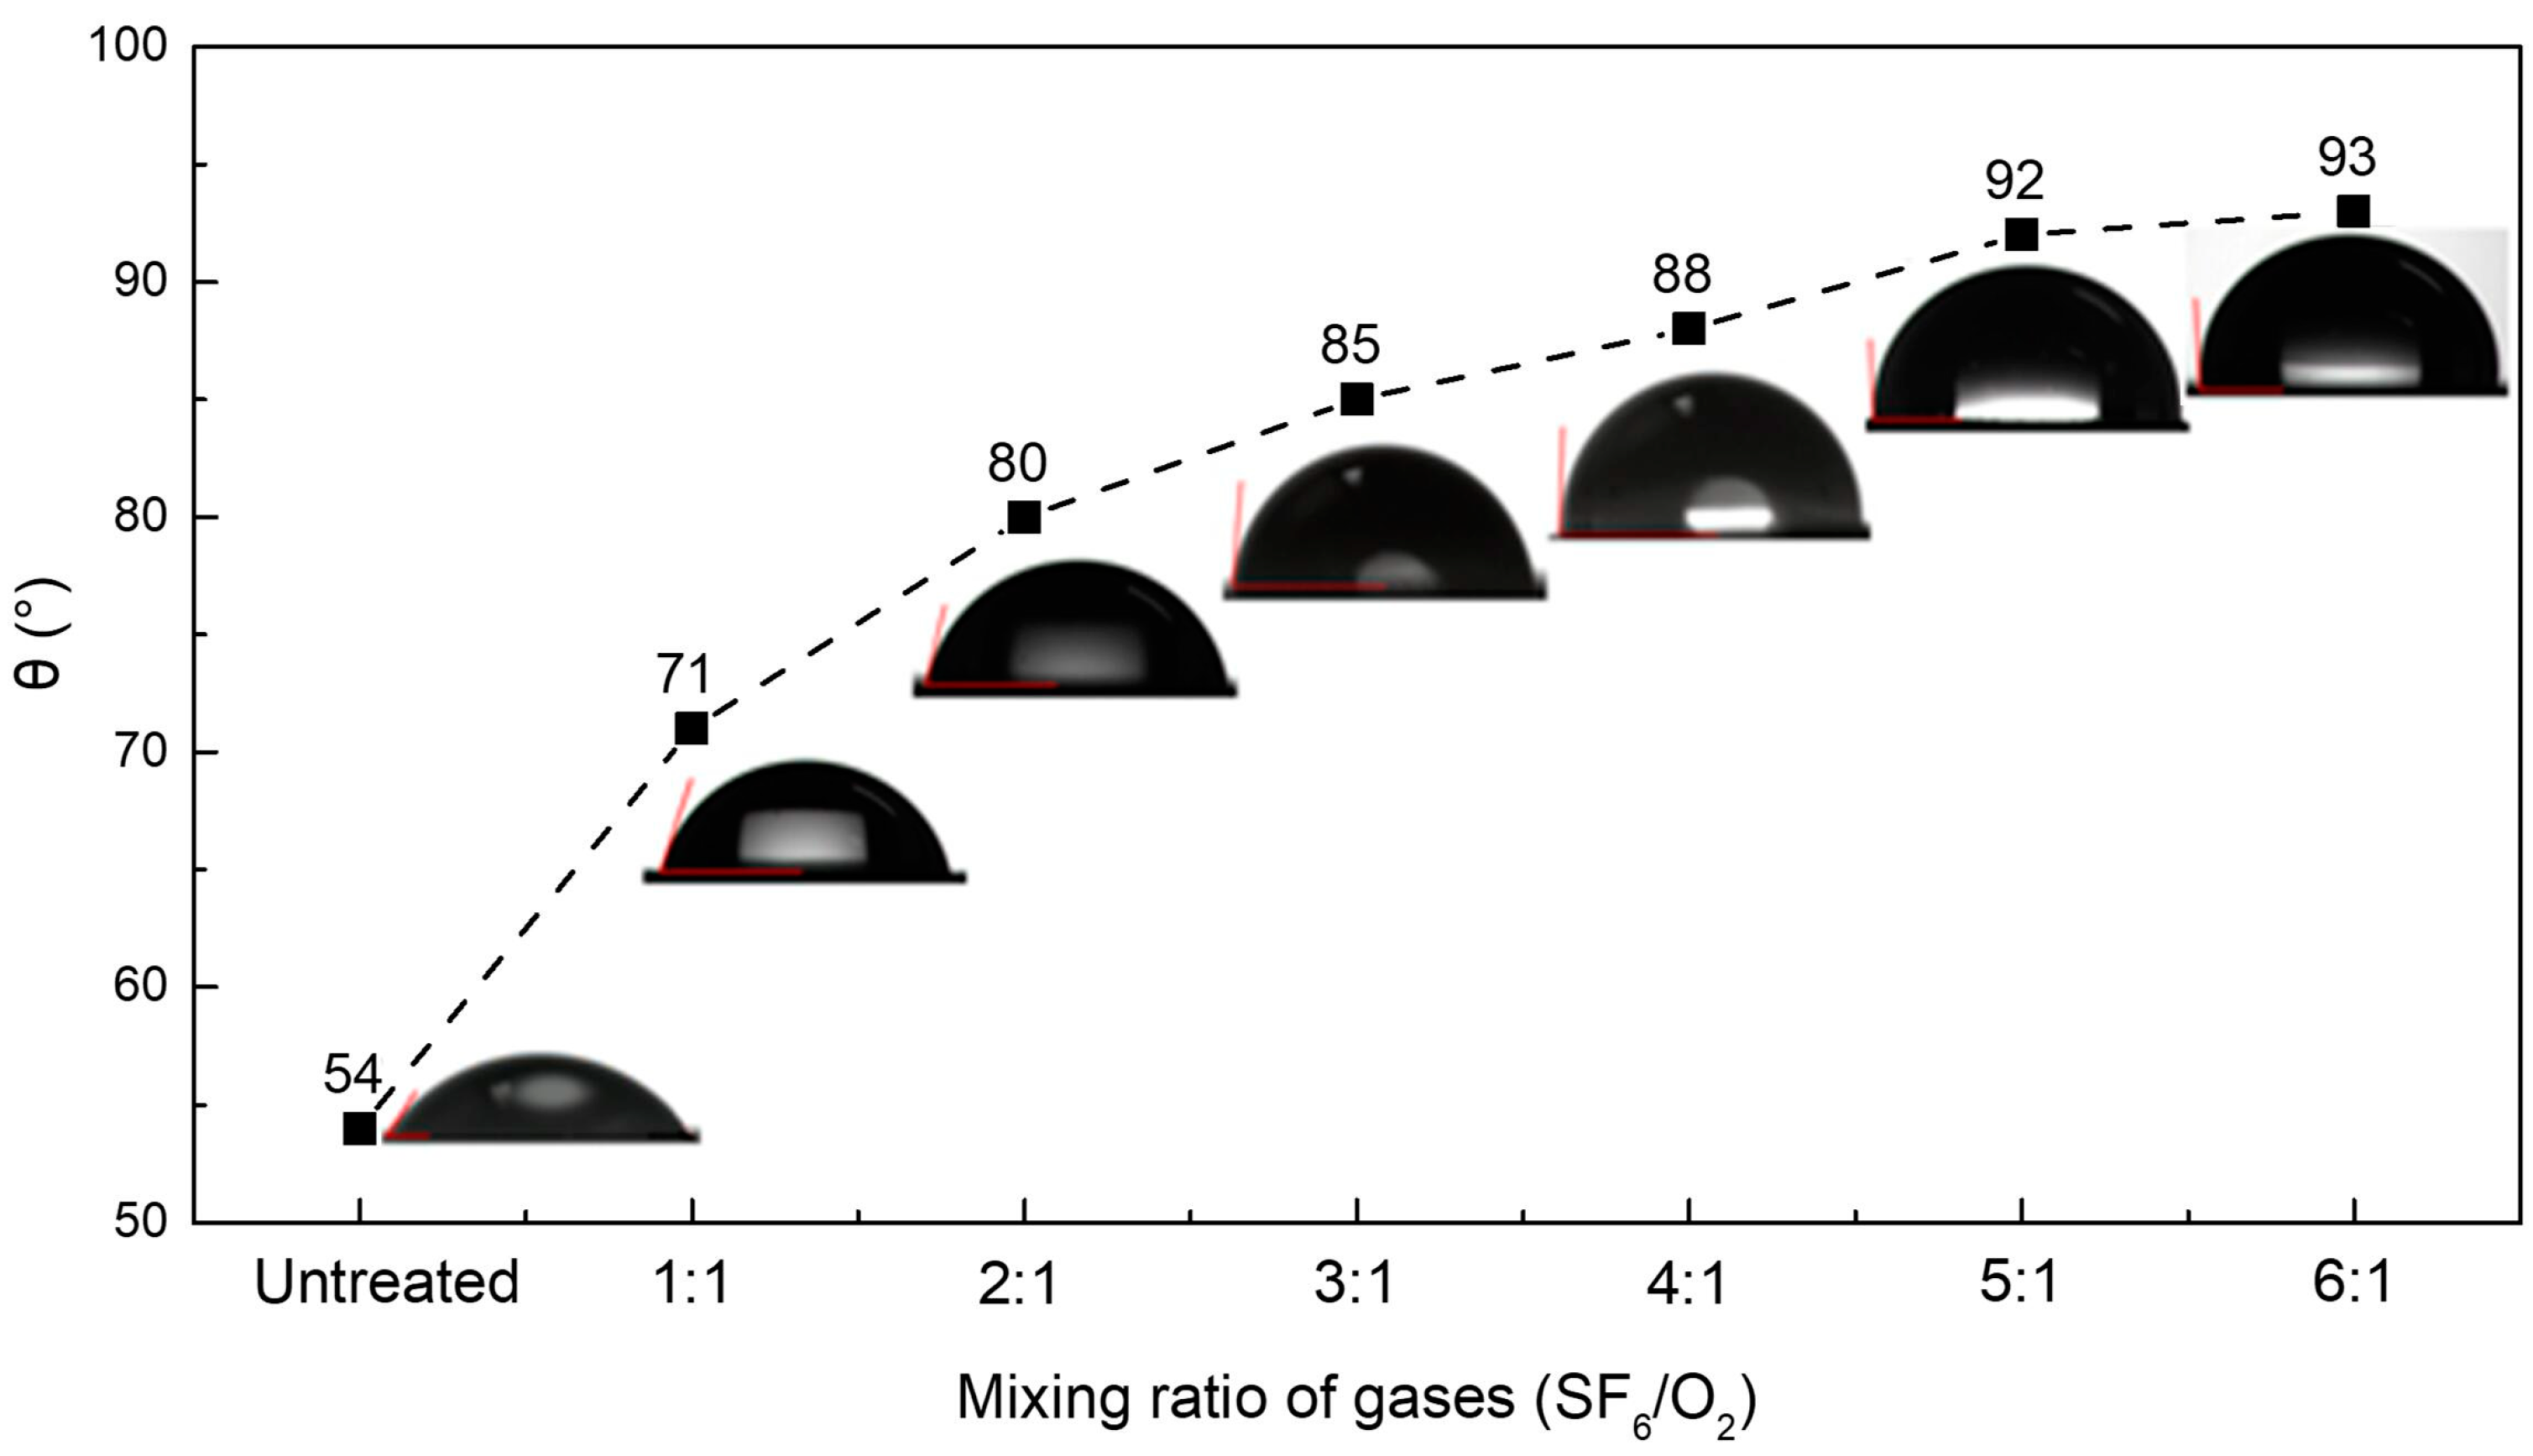
2.2. Static Contact Angle of the Sample Surfaces

The static contact angle of the sample surfaces was measured by the contact angle measuring instrument XG-GAMB1 (Xuanyichuangxi Industrial Equipment Co. Ltd., Shanghai, China). Ultrapure water with a volume of 2 μL was used as the experimental working medium, and the environmental temperature was set at 20 °C. The static contact angle measuring instrument was used to measure the contact angle of the sample surface using the height–width method. To reduce accidental error of the sample surface damage or surface structure non-uniformity, the contact angle was analyzed in at least three regions for each sample. The static contact angle results are shown in Figure 6.
Figure 6 exhibits a significant increase in the contact angle of the sample surface prepared by PIII technology. In addition, the hydrophilic surface was transformed into a hydrophobic surface (the contact angle was greater than 90°). Figure 3 and Figure 4 present a combination of the SEM and AFM surface morphologies, wherein sample 2 exhibited minimal changes in its surface morphology as compared to sample 1, whereas the contact angle exhibited significant changes because the intensity of the etching reaction was not enough to form an obvious microstructure on the surface of the sample at a low gas mixing ratio. However, the reaction continued to change the chemical properties of the surface of the sample, thereby generating a change in the wetting properties of the surface. An increase in the mixing ratio of the gases generated an increase in the value of the static contact angle of the surface, though this growth rate of contact angle gradually decreased. A combination of the previous figures with Figure 5 exhibited a simultaneous increase in the area ratio and roughness of the sample following an increase in the mixing ratio of the gases from 1:1 to 3:1. When the gas mixture ratio was greater than 3:1, the roughness exhibited a slight decrease, even when following an increase in the convex/concave area ratio. Therefore, the increased surface roughness (Ra) and area ratio (r) generated an increase in the contact angle. When the mixing ratio of the gases was less than 3:1, an increase in both the roughness and area ratio resulted in a significant increase in the contact angle. In addition, a gas-mixing ratio greater than 3:1 inhibited the increase of the contact angle due to the decrease in the roughness, thereby decreasing the growth rate of the contact angle under the condition of a large mixing ratio.

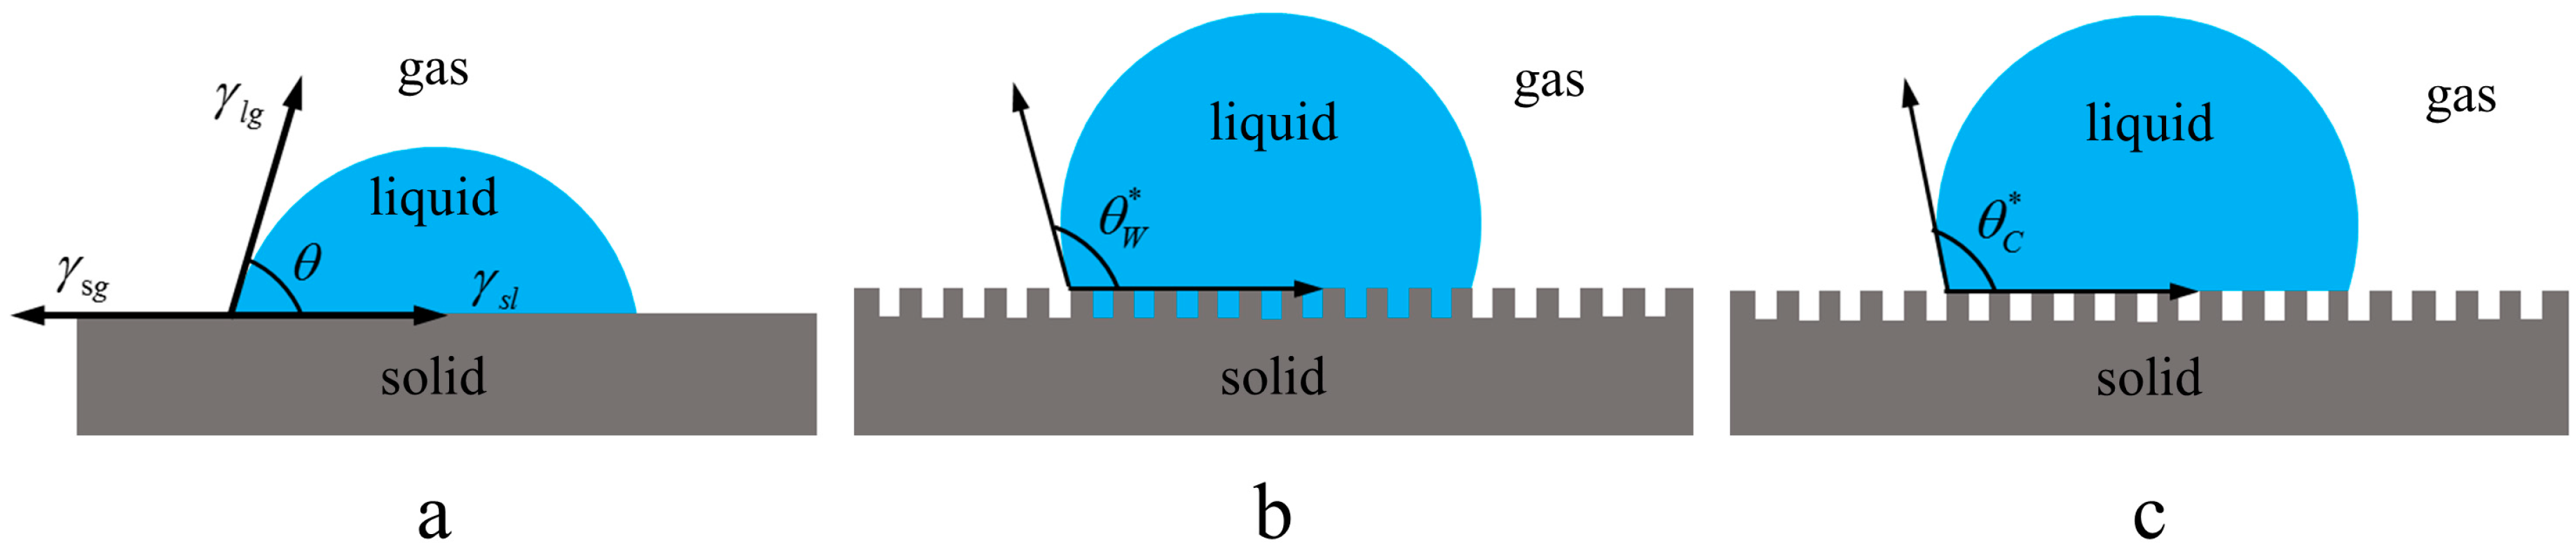
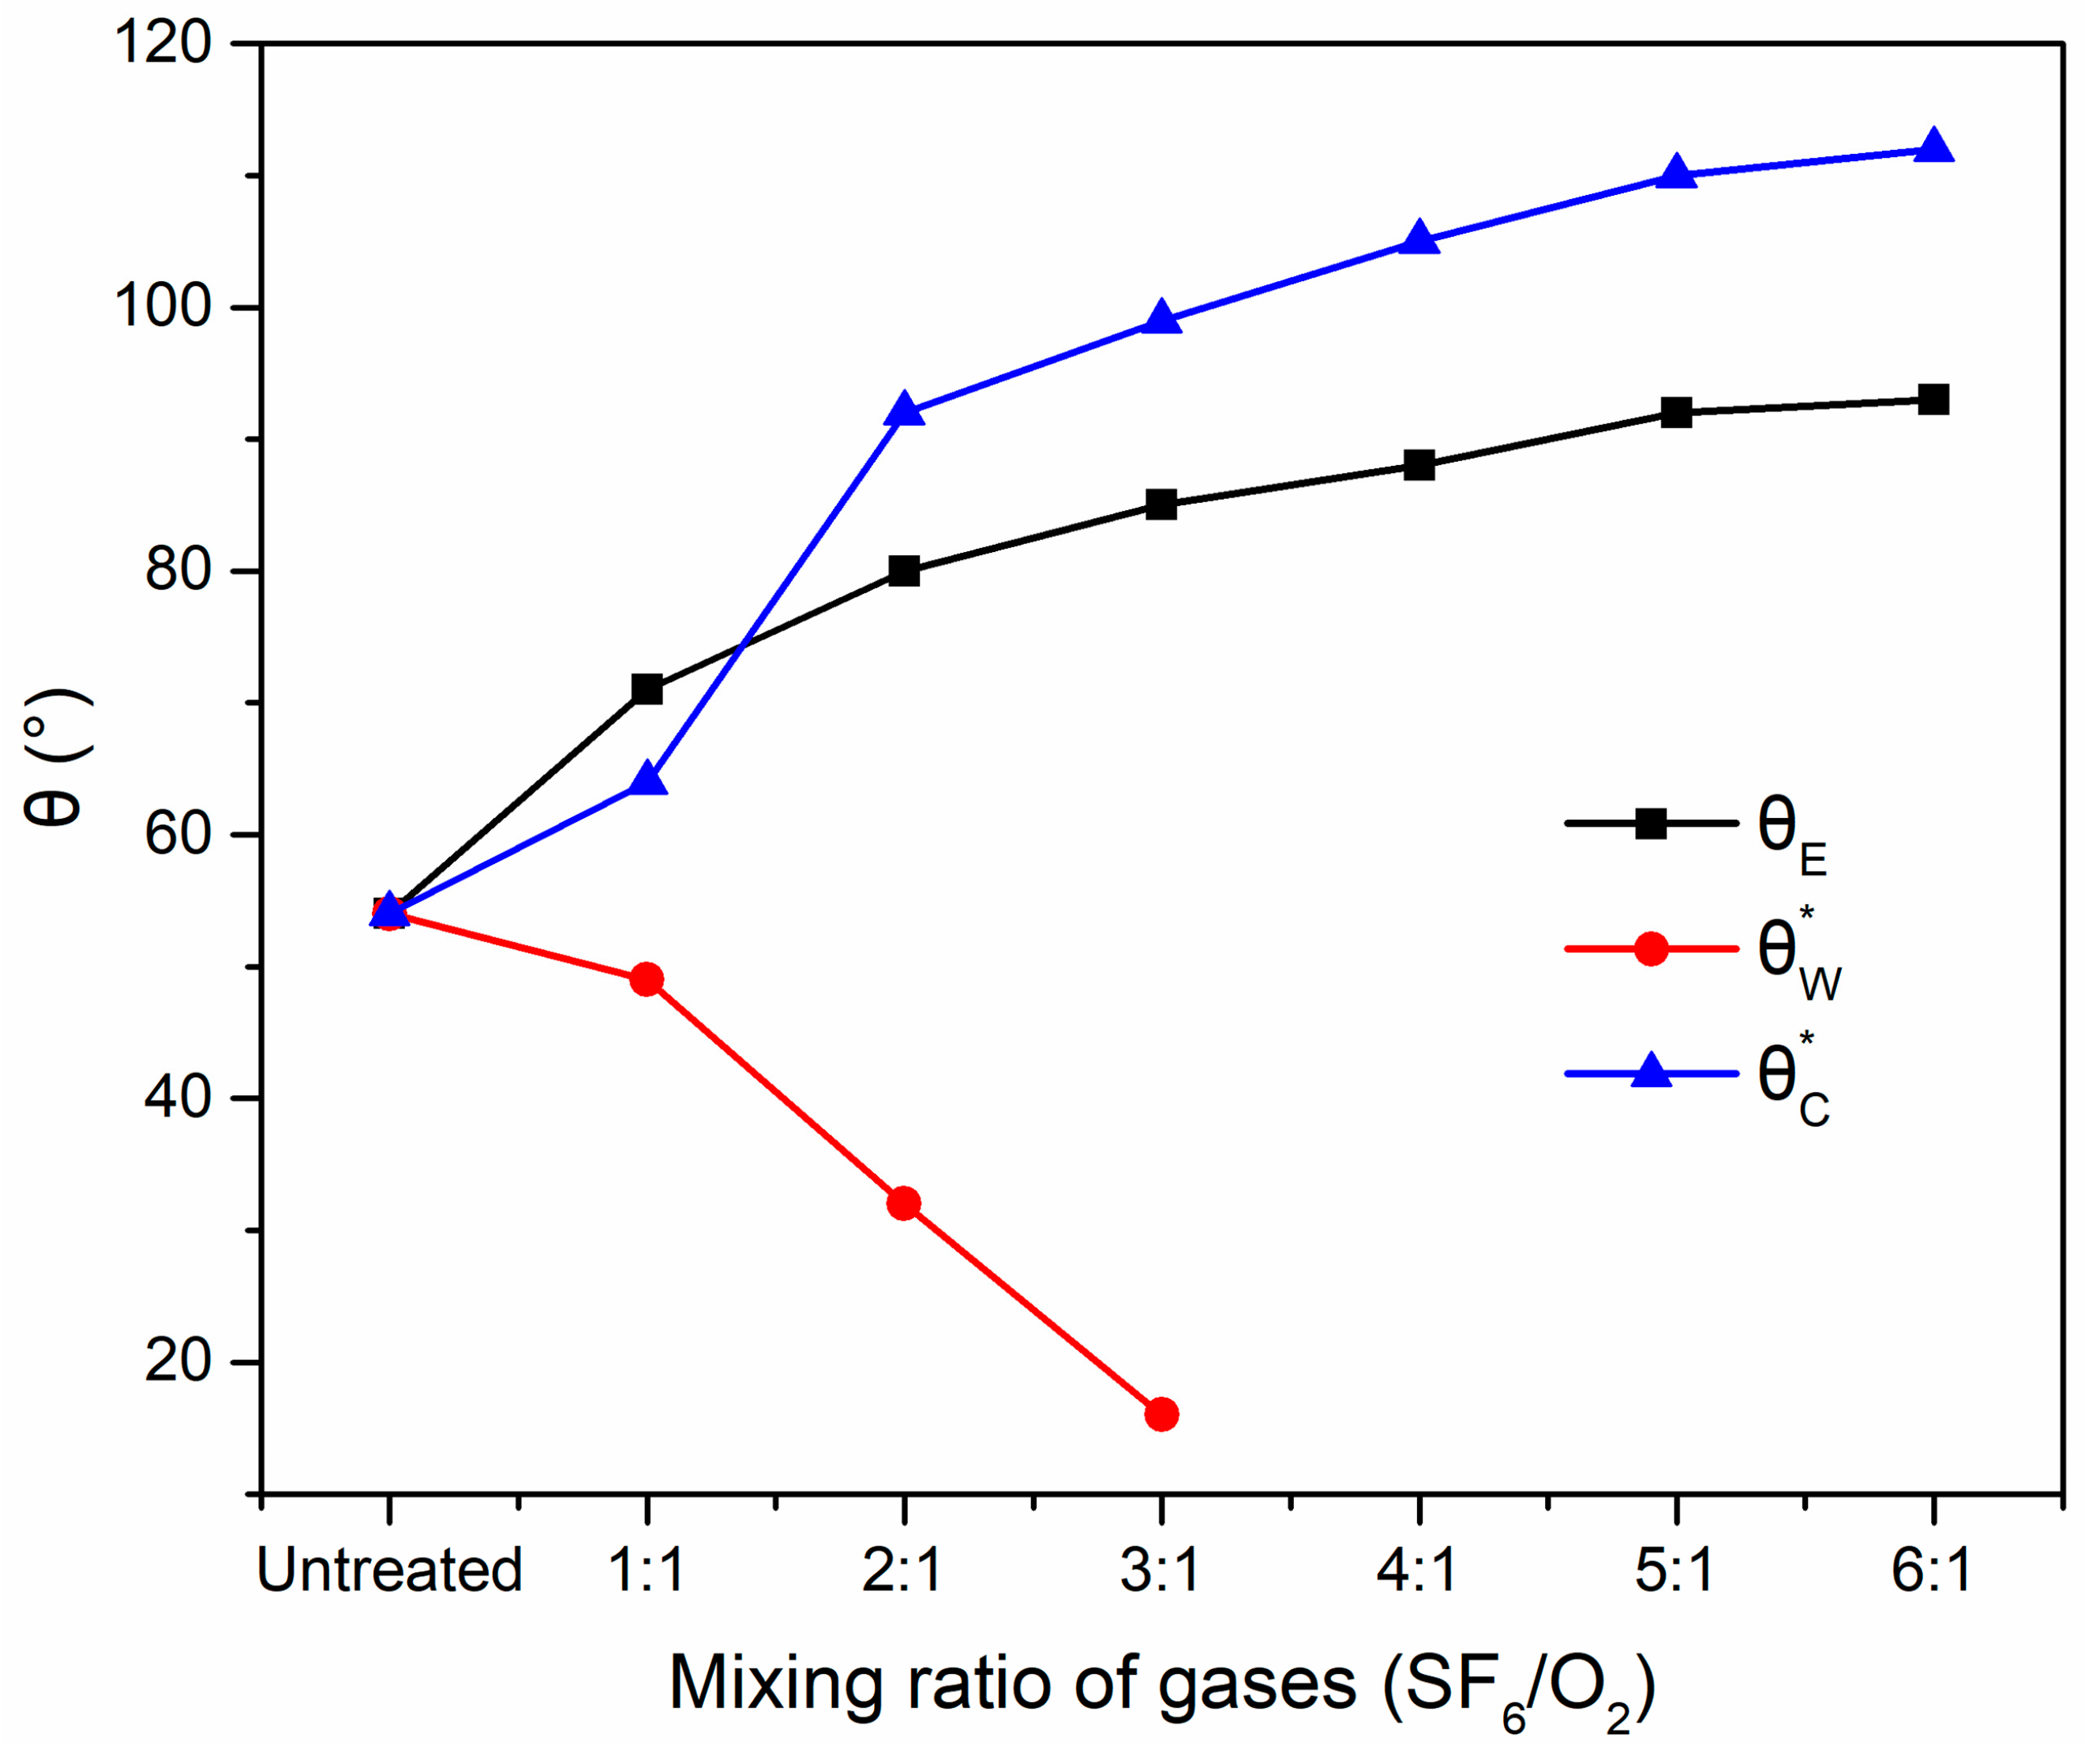
2.3. Theoretical Value of Static Contact Angle

The structural parameters corresponding to the theoretical model of the contact angle were extracted from the SEM and AFM characterization results. In addition, the static contact angles of the sample surface were calculated by the Wenzel and Cassie–Baxter theoretical models, respectively. According to the Wenzel theory, the Wenzel’s contact angle ( θ W * ) on the microstructural surfaces can be calculated based on Equation (2), where r was obtained by the AFM characterization results and the Young’s contact angle was 54°, which was obtained from the experiment with sample 1. Photoshop software (Adobe, Inc., CA, USA) was applied to extract the pixels of the different shades of gray from Figure 3. The proportion of the pixels in the lighter color region to the total number of pixels in the whole image was calculated, wherein the projection area of the protruding structure accounted for the percentage of the total projection area of the picture, namely, the solid–liquid fractional surface area ( f s ). According to the Cassie–Baxter theory, the Cassie–Baxter’s contact angle ( θ C * ) on the microstructural surfaces can be calculated based on Equation (3) for a Young’s contact angle of 54°. Table 2 presents the microstructural characteristic parameters of the sample surfaces and the contact angles of the corresponding theoretical models.
Variations in the contact angle of experimental measurements ( θ E ), the theoretical Cassie–Baxter contact angle ( θ C * ), and the theoretical Wenzel contact angle ( θ W * ) with the mixing ratio of the gases are presented in Figure 7, wherein the graph indicates that the trend of the theoretical Wenzel’s contact angle ( θ W * ) is the opposite of that of the contact angle of the experimental measurement ( θ E ). The presence of microstructures generated an obvious increase in the area ratio (r) of the sample surface, thereby resulting in a significant reduction in the contact angle. It was obvious that Equation (2) was not suitable for predicting the static contact angle of the sample. The trend of the theoretical Cassie–Baxter’s contact angle ( θ C * ) was the same as that of the contact angle of the experimental measurement ( θ E ), wherein an increase of the static contact angle caused an increase of the mixing ratio of the gases. When the mixing ratio of the gases was 1:1, the Young’s contact angle in Equation (3) still used the contact angle of the untreated silicon surface, which did not consider the change in the Young’s contact angle due to the chemical reaction. Therefore, a significant difference was observed between θ E and θ C * when the mixing ratio of the gases was 1:1, though this was not observed in the theoretical model. However, when the mixing ratio of the gases was greater than 3:1, θ C * continued to increase due to both the continuous decrease of f S and the increased deviation between θ C * and θ E . On one hand, these results indicated that the calculation method of f S greatly influenced the contact-angle calculation results. On the other hand, it also indicated that f S was not the only factor that affected the static contact angle. According to the analysis of the contact angle of the experimental measurements in the last section, the contact angle was co-influenced by the roughness and area ratio. However, the Cassie–Baxter theory unified all the influence factors of the contact angle to parameter f S . The present study could not get the exact f S of the microstructural surface as it had a volcanic shape, which was also the limitation of the Cassie–Baxter theory when predicting the contact angle of microstructural surfaces.

3. Numerical Methods and Setup

The calculation results of the theoretical contact angles in the last section indicated the difficulty in scientifically determining the parameters (such as f s and r) when applying the Cassie–Baxter theoretical model to predict the contact angle of the complex microstructural surface, which resulted in large prediction errors. In this section, the VOF numerical simulation method was used to study the simulation of the static contact angle according to the microstructural characteristics of the sample.
The macroscopic static contact angle was the comprehensive expression of the local infiltration characteristics of the droplets on the microstructural surface. The fluid was assumed to have continuum characteristics and satisfied the basic Young’s equation in any local area of the microstructure. In addition, the contact angle on the smooth surface and the local area of the microstructure were assumed to be equal. Therefore, the VOF model in the computational fluid dynamics (CFD) analysis method was used to study the macroscopic static contact angle of specific microstructural surfaces.
According to the analysis of the PIII preparation technology in Section 2.1, the locally exposed surface after corrosion can be assumed to have the same wettability as the initial surface. In addition, the 3-D morphology model was established according to the AFM pictures. This section systemically describes the CFD analyzing model and the numerical simulation results of the static contact angle on the microstructure surface prepared by PIII technology.

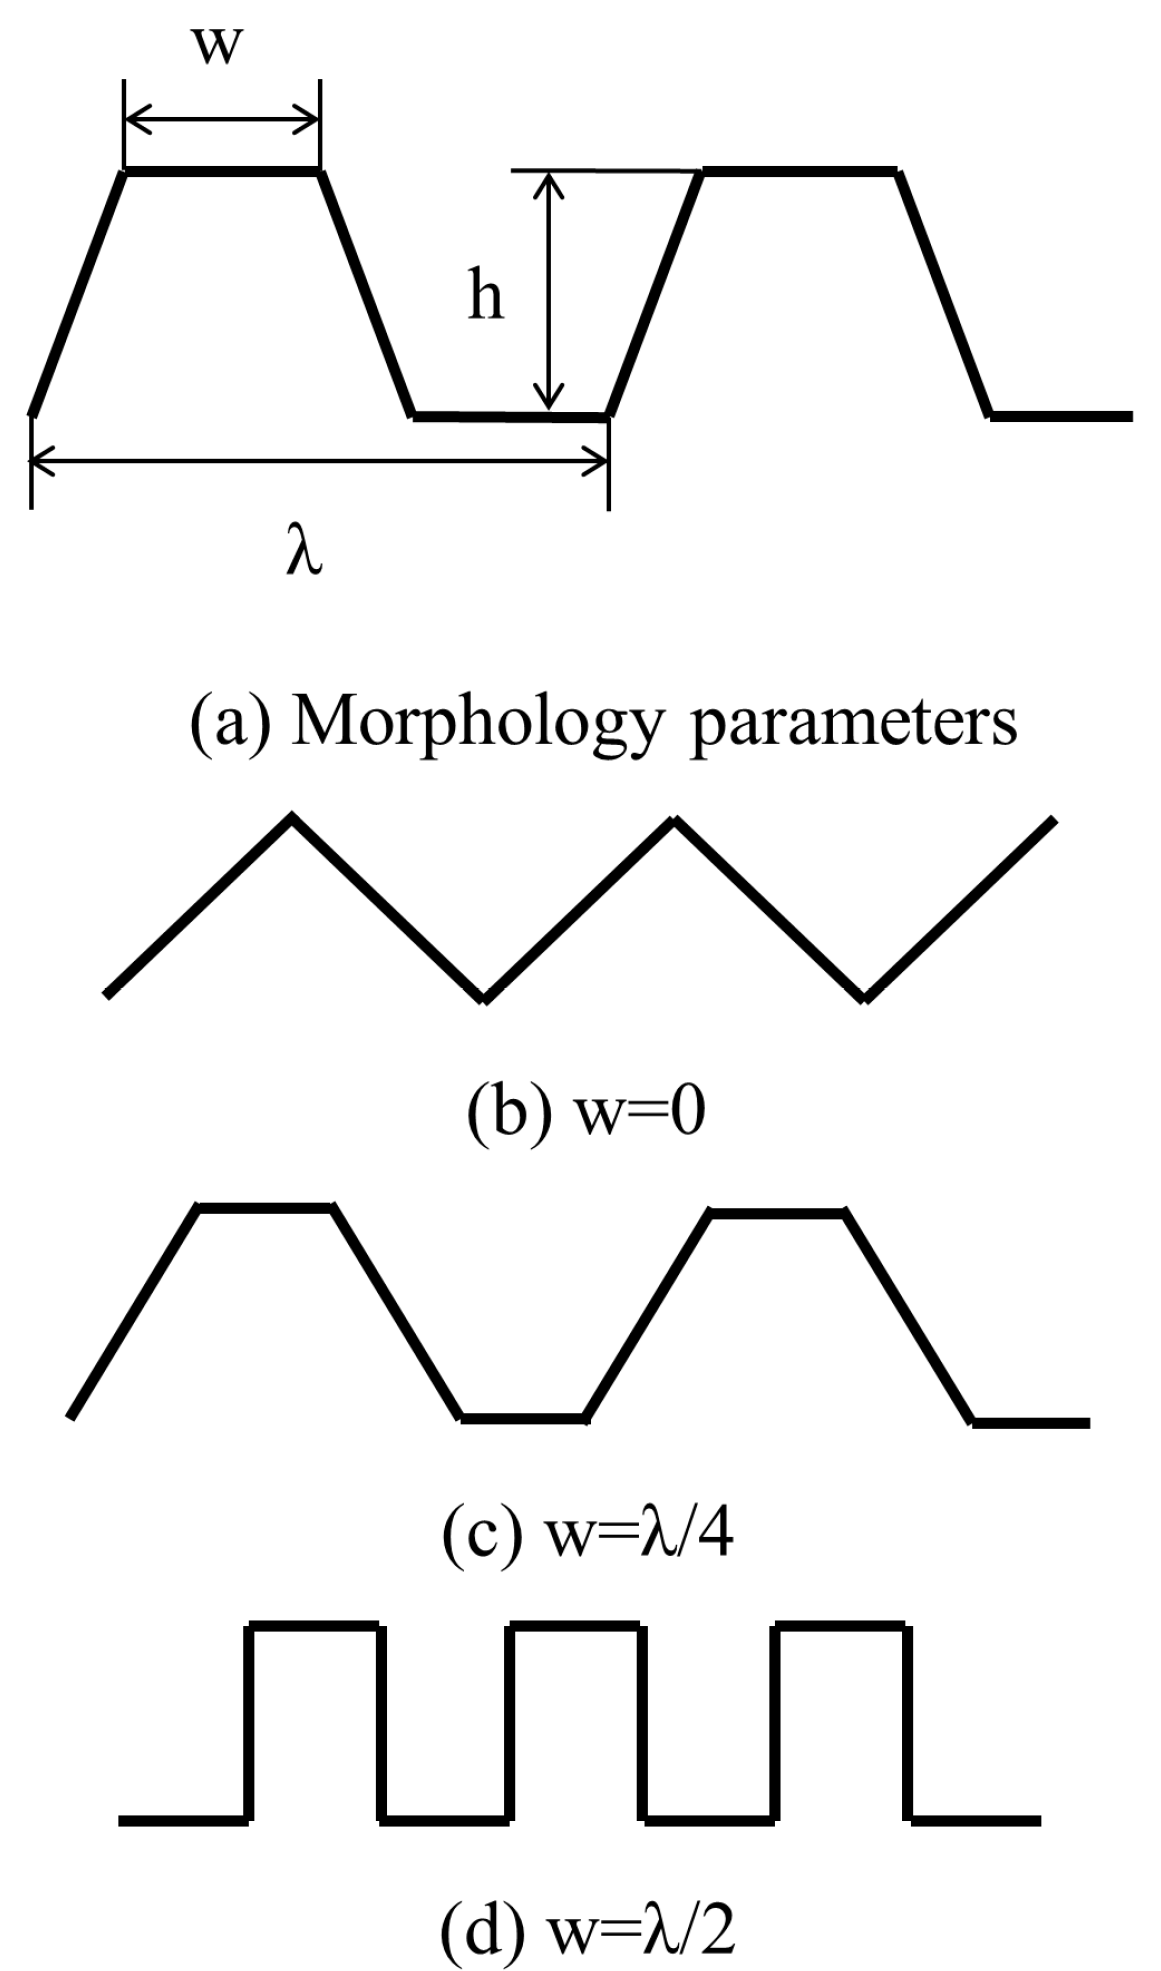
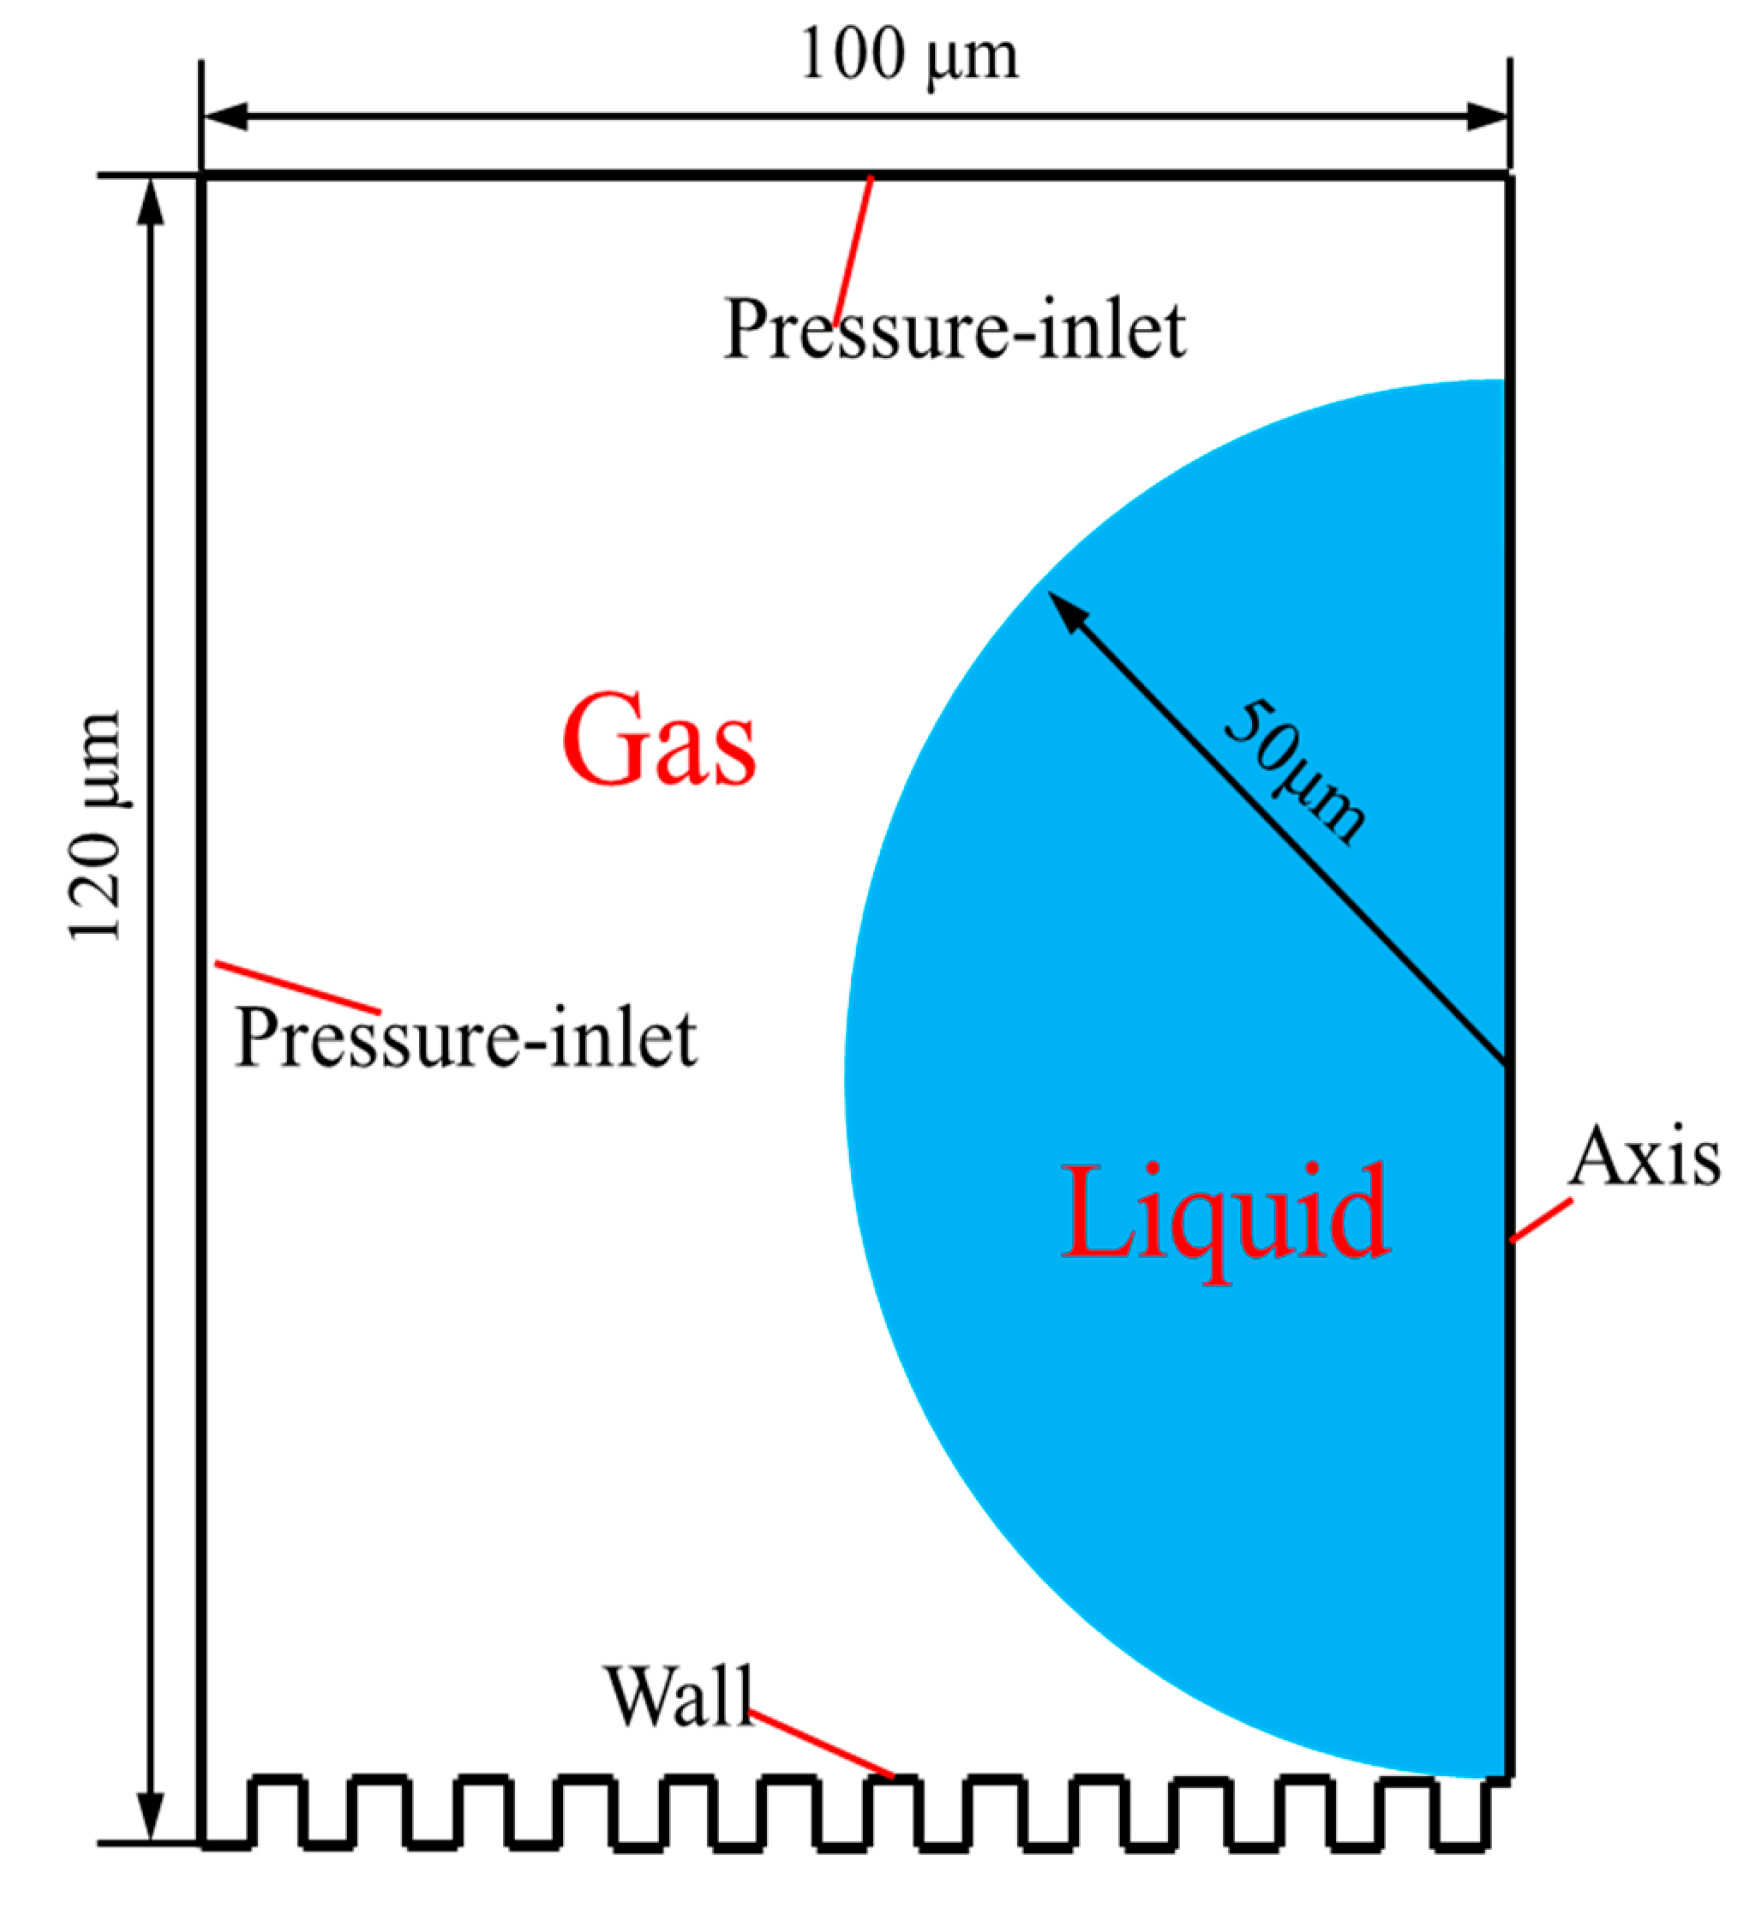
3.1. Establishment of the Parameterized Geometric Model

The AFM results (Figure 4) indicated that the 3-D surface topography was in an uneven “mountain peak” shape. Although the AFM picture can be used to directly construct the 3-D microstructural geometric surface, an enormous amount of the grid was required to describe the geometric topography of the microstructural area. In addition, the VOF method is a transient simulation and requires huge computing resources. Therefore, this section focused on the characterization of the 2-D model to describe the 3-D structure of the actual sample.
The 2-D parameterization microstructure surfaces are then built and are presented in Figure 8a. Finally, the microstructure surfaces depicted in Figure 8b–d were established through the parameter transformation of the model in Figure 8a. As presented in Figure 8a, the microstructural morphology was mainly determined by the width of the structure (λ), the height of the structure (h), and the width of the morphology (w). When w = 0, the morphology was a triangular wave (Figure 8b); when w = λ/4, the morphology was a trapezoid wave (Figure 8c); and when w = λ/2, the morphology was a rectangular wave (Figure 8d). The three derived shapes were compared and analyzed, and the parameters (h) in Figure 8a were characterized by the surface roughness values in the AFM diagram.

3.2. Geometric Model

The calculation model is a 2-D axisymmetric structure, as presented in Figure 9. The computational domain had a height of 120 μm and a width of 100 μm. The height of the structure (h) was 2 μm. The radius of semicircular water droplet was 50 μm.

3.3. VOF Model

The VOF model is a surface tracing method in a fixed Eulerian grid, and can handle arbitrary-free interfaces between different kinds of immiscible fluids. The VOF model recorded the position and shape of the free surface using the fluid volume fraction (F), wherein the volume of the fluid was estimated by the volume of the grid itself. The present study employed the gas–liquid two-phase flow of water droplet moving on the solid wall as the simulated object, wherein air was the main phase and water was the secondary phase. In this paper, the value of the fluid volume fraction was shown in Table 3.
The momentum equation of the two phases was defined as follows.
t ( F a ρ a V a ) + ( F a ρ a ν V a ) = S
t ( F w ρ w V w ) + ( F w ρ w ν V w ) = S
where script w is water and a is air, F a + F w = 1 , and S is the source term. The contact angle at any point on the wall boundary was assumed be equal to the contact angle of sample 1 (54°). The surface tension was the source term in the momentum equation, S = σ / A . The surface tension coefficient σ was determined to be 0.07275 N/m, the acceleration of gravity was 9.81 m/s2, and the direction was downward.

3.4. Initial Conditions and Boundary Conditions

The assumptions in initial conditions were:
  • The water droplet was circle in shape and located above the upper wall of the parameterized microstructure. The water droplet position was shown in Figure 9.
  • The microstructure channels were filled with air, without water.
The initial value of the fluid volume fraction was
{ F = 1 ( r = 50   μ m ,   0 θ π ) F = 0 ( Other   region )
The boundary conditions are shown in Figure 9. The surfaces of microstructure was set as wall, which had a contact angle of 54°, the right boundary was set as the axis, and the top and left boundaries were both set as the opening boundary with a pressure of 1 atm.
The calculation of the transient time step was 1 × 10⁻⁸ s, which was calculated till a balance of the droplet was obtained.

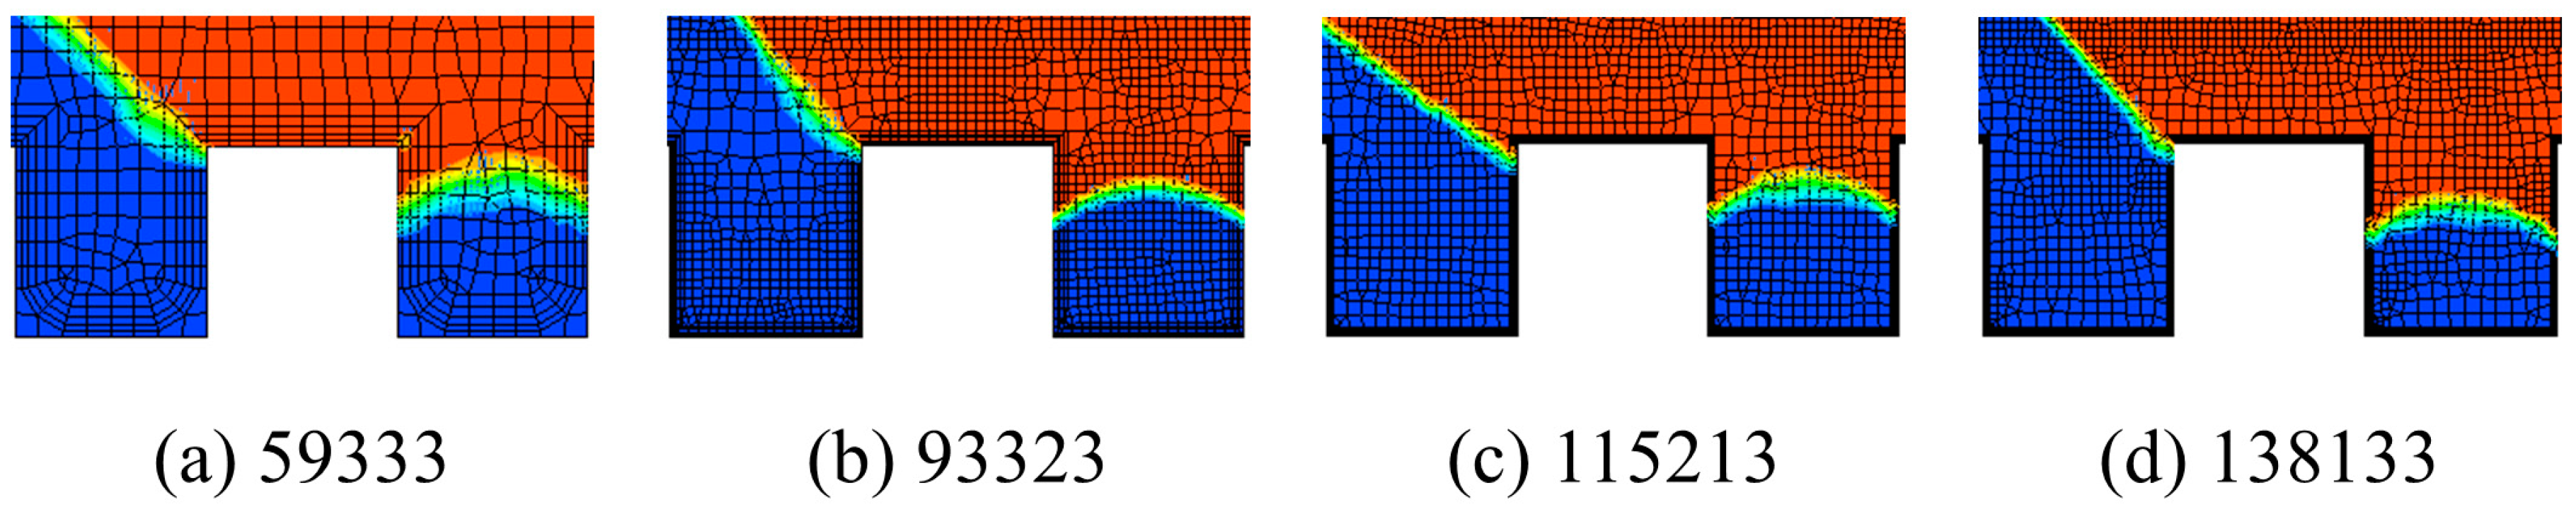
3.5. Grid Sensitivity Analysis and Model Verification

The accurate shape of the solid–gas–liquid three-phase contact line was used as the judgment basis for the grid sensitivity analysis. The mesh was divided into unstructured quadrilateral mesh portions, and the wall boundary layer was used to encrypt the grid. Figure 10 presents a local discharge diagram of the three-phase contact line obtained from grid numbers 59,333, 93,323, 115,213, and 138,133. According to Figure 10, the mesh with grid number 115,213 relative to the mesh with grid number 93,323 improved the clarity of the contact line, though it was not accurate at the three-point contact point. Grid number 115,213 clearly exhibited the contact line and contact point, and improved the calculation rate as compared to grid number 138,133. The setting parameters of the 115,213 grid number models were selected as the parameters of the subsequent model-grid generation.
Figure 11a presents the phase distribution map of the smooth surface (h = 0) after the simulated stationary state, wherein its macroscopic contact angle was equal to the experimental results of sample 1 (seen in Figure 11b), all of which had values of 54°. This, thereby, validated the reliability of the VOF analysis model established in this paper.

4. Analysis of the Numerical Results

The droplet spreading process on the solid surface was clearly observed given that the computational model was transient. To clearly indicate the influence of the surface microstructure on the contact angle, the change process of the droplet on the smooth and microstructure surfaces was analyzed in detail. Based on the analysis, a yellow dashed line with a rectangular frame was used as an auxiliary to characterize the changes in the droplets. In addition, the height and width of the rectangular frame were categorized as the height of the liquid drop and the length of the solid liquid contact line, respectively. The effects of the 2-D models on the simulation results were investigated and analyzed, and the 2-D geometric models were simplified by the various parameters.

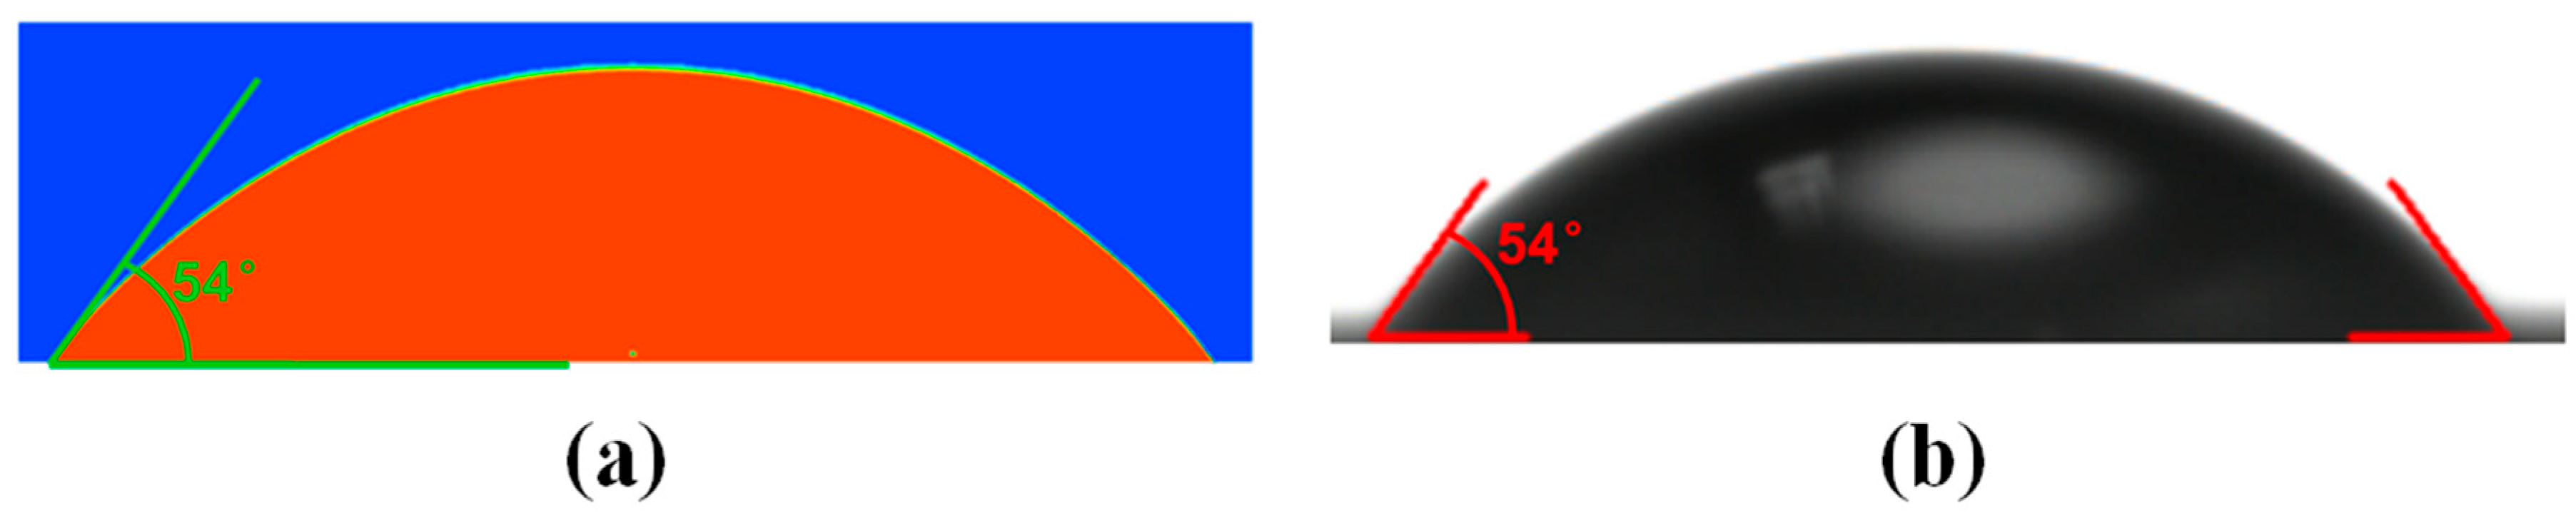
4.1. Static Contact Angle of the Smooth Surface

Figure 12 presents the droplet morphology of the typical time in the droplet change process on a smooth surface. The droplet process exhibited stages in the following order—initial state, rising, spreading, shrinking, oscillating, and stable state. The detailed changes of the droplet are as followed in Table 4.

4.2. Static Contact Angle of the Microstructural Surface

To examine the influence of the microstructures on the droplet change process, the change process of the droplet on the rectangular parameterized surface of w = h = 2 was observed. Figure 13 presents the droplet morphology of the typical times during the droplet change process on the microstructural surface. The droplet process exhibited stages in Table 5—initial state, rising, oscillating, and stable state.
The change process of the droplet on the two different surfaces was compared. For the smooth surface, the droplets exhibited an initial state, rising, spreading, shrinking, and oscillation to stabilize, wherein the oscillating process encompassed 50% of the whole variation process. For the microstructural surface, the droplets exhibited an initial state, rising, spreading, and oscillation to stabilize, wherein the oscillating process covered 80% of the whole variation process. Due to the hindrance in the microstructure of droplets and the interactions among the main droplets and those among the spreading droplets, the droplets were not completely spread on the surface of the microstructures, which enhanced the oscillation of the liquid. Therefore, the equilibrium state of the droplets on the microstructural surface required more time than the smooth surface. As seen in References [31] and [32], the wetting anisotropy of the micro-groove surface, i.e., the contact angle in the vertical direction was greater than that in the parallel direction because the droplet spreading in the parallel micro-groove was similar to the smooth surface, and the droplet spreading process in the vertical micro-groove was similar to the microstructural surface. The wettability was related to the characteristics of the microstructure surface, thereby resulting in a larger contact angle on the microstructure surface as compared to that of the smooth surface.

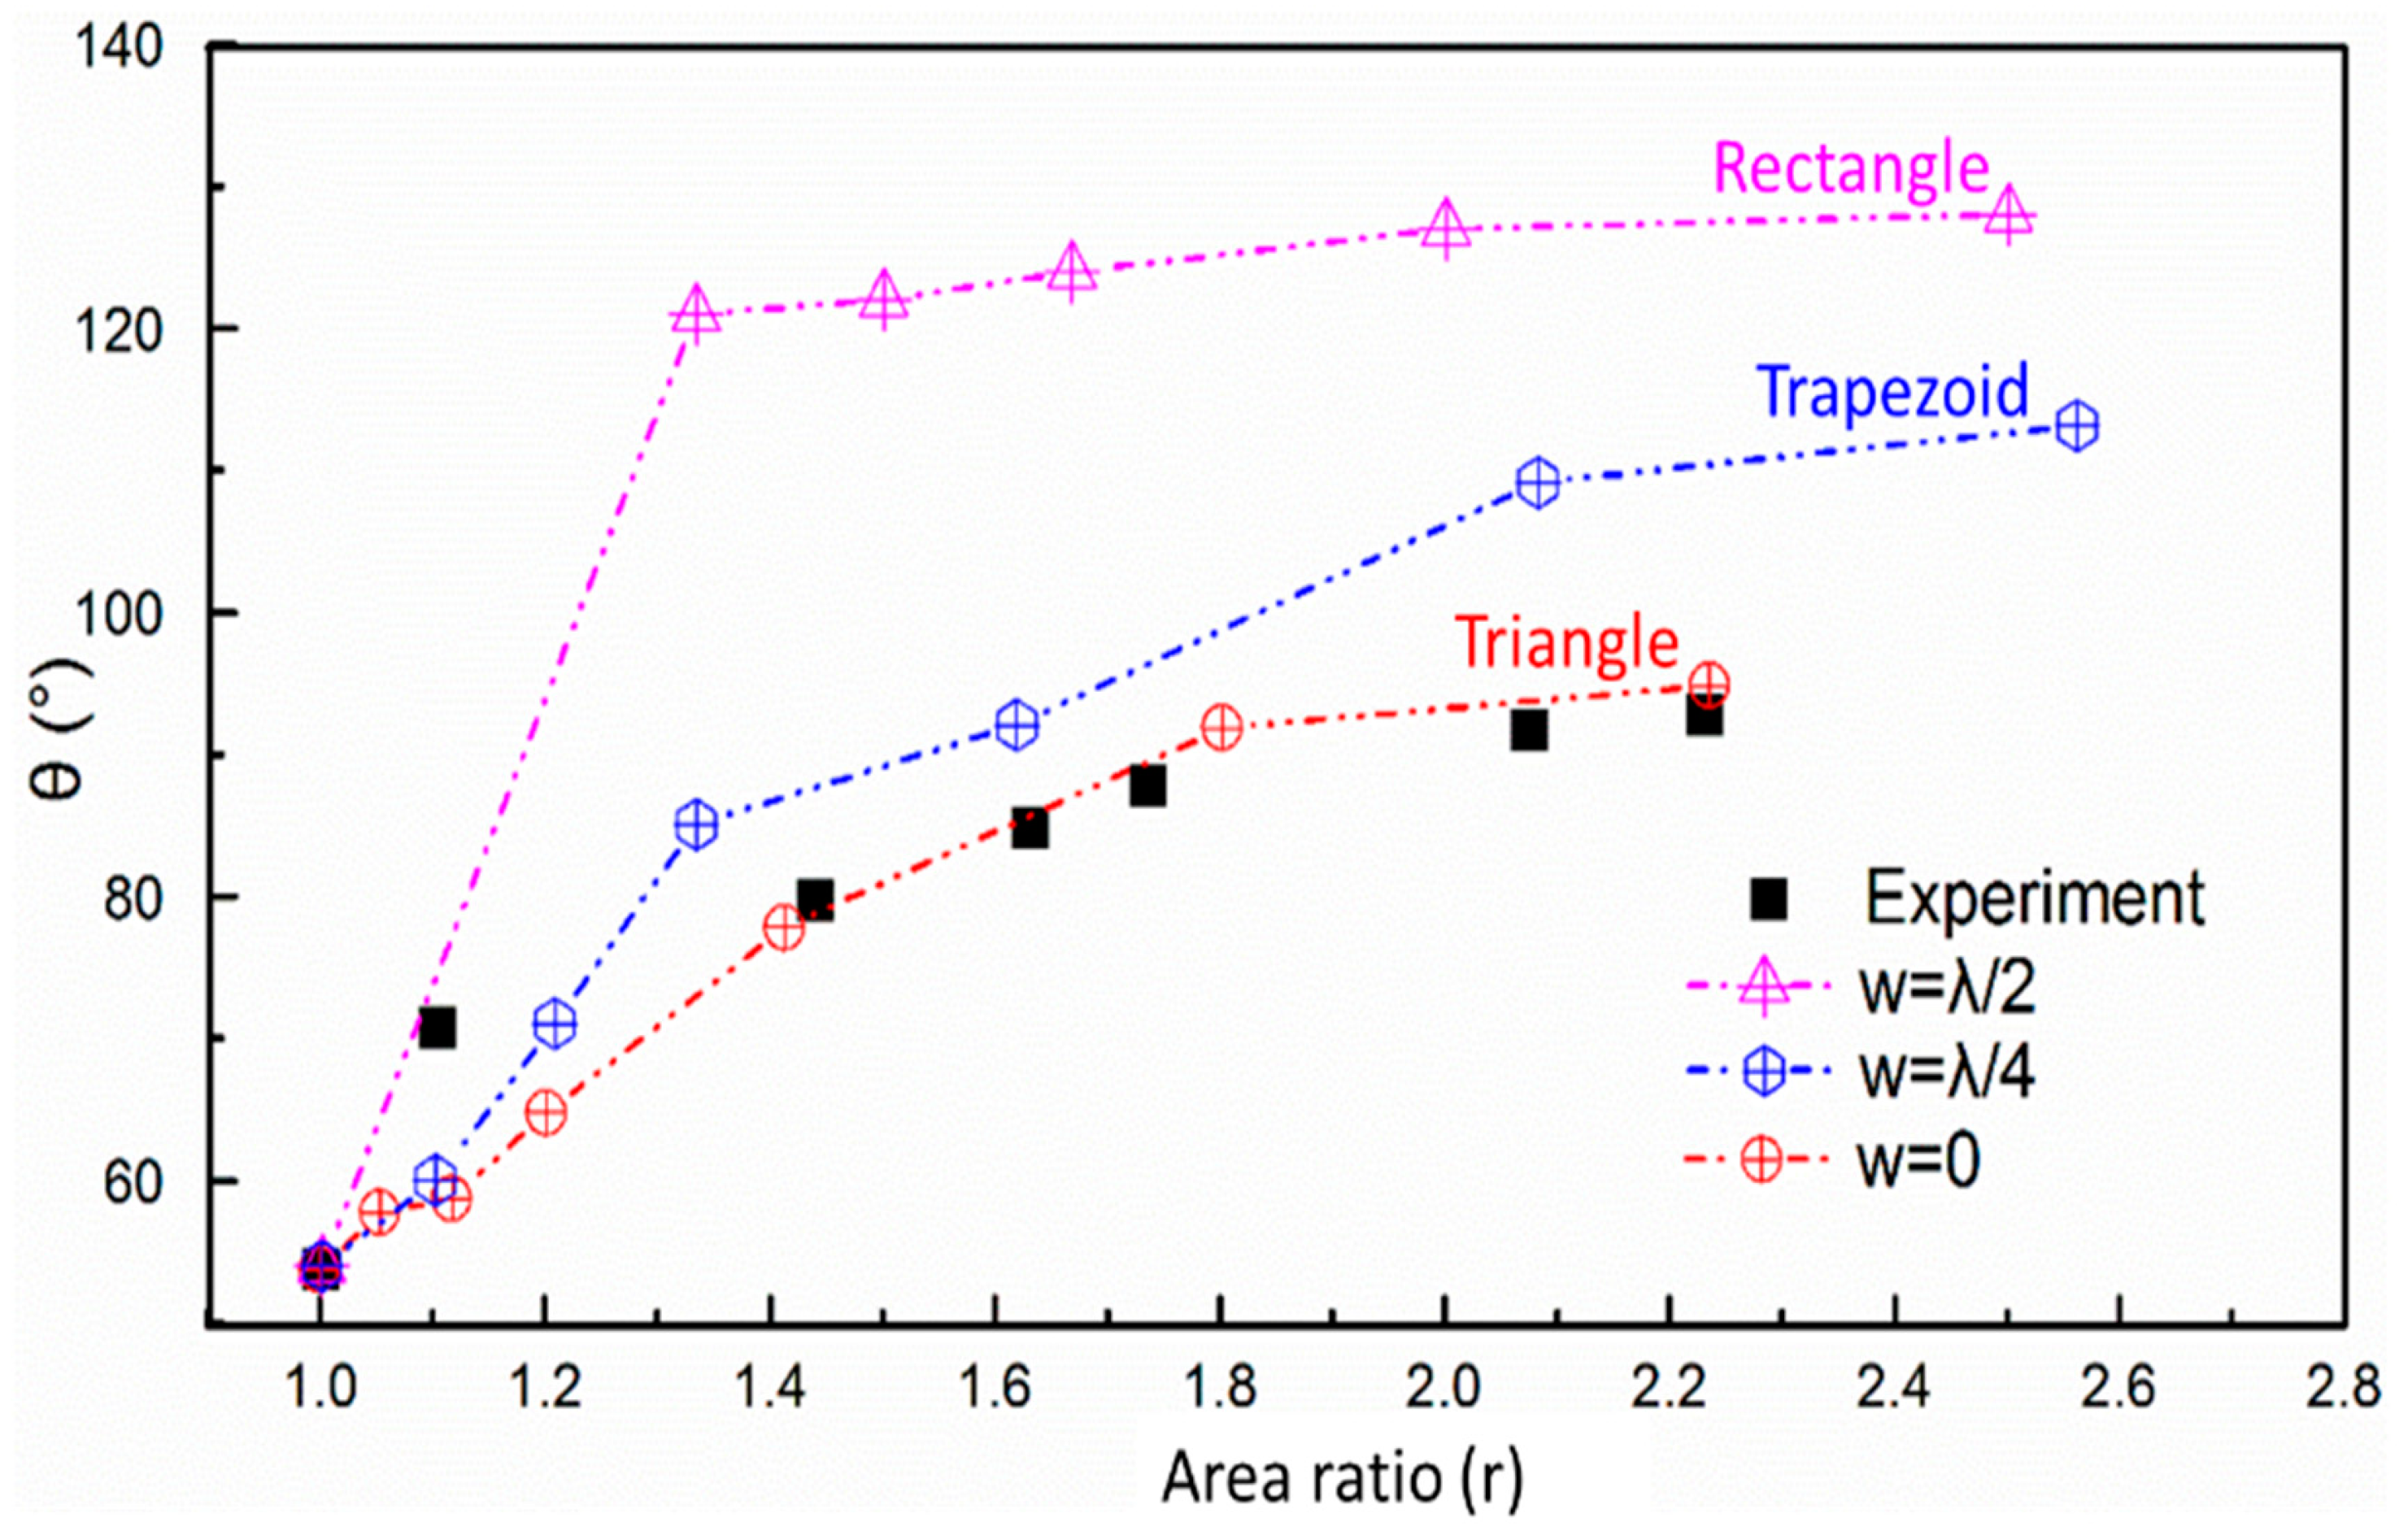
4.3. The Simplified Waveform of the Microstructural Surface

Figure 14 presents the relationship between the simulated contact angles of the three different waveforms with the area ratio, in which the black dots represent the experimental results. The simulated contact angles of the three kinds of wave surfaces are well in agreement with the contact angle of the experimental measurement, that is, the macroscopic contact angle increased following an increase of the area ratio. As shown in the experimental results, the sample surfaces were easily covered by SixOyFz, while the ratio of the gas mixture was one-to-one. At the same time, the chemical characteristics of the surface changed, which resulted in an augmented contact angle trend. When gas mixing ratio increased, corrosion dominated and the surface of the samples were covered by SixOyFz. Consequently, the size of the contact angle was dependent on the morphology of the samples. In this work, local surfaces in the simulation were regarded as the initial surface and the effects to the local contact angle were neglected. Therefore, the experimental results of sample 2 were not considered in the preparation of the numerical simulations.
The simulation results indicated that the variation of contact angle on the surface of the different waveforms varied greatly with the area ratio. In particular, the contact angle of the rectangle surface (w = λ/2) was the largest, followed by the contact angle of the trapezium surface (w = λ/4), and lastly by the contact angle of the triangle surface (w = 0). The experimental contact angle was in good agreement with the surface morphology of w = 0, because the triangular waveform was closer to the actual surface topography of the sample as compared to the other two kinds of morphology and can best represent the characteristics of the real sample surface.

5. Conclusions

In this paper, the influence of the gas mixing ratio of the PIII preparation process on the surface morphology and wetting characteristics was systematically examined. The results of the wetting characteristics of microstructure surfaces were studied by theoretical, experimental, and numerical simulation methods. The main conclusions are as follows:
1. The sample with the concave/convex structure can be prepared on the surface of the polished monocrystalline by the PIII technology. An increasing mixing ratio (SF6/O2) first resulted in an increase and then a slight decrease in the height of the bulged structure, whereas the area ratio of the surface increased continuously.
2. The apparent contact angle of the microstructural surface was influenced by the surface roughness and the area ratio, which increased following an increase in the mixture ratio of the gases. In addition, the contact angle increased quickly when the ratio (SF6/O2) was small, but the increase in the rate of the contact angle slowed down when the ratio was large.
3. The VOF model can well simulate the macroscopic contact-angle characteristics on the surface of the complex structure. The simulation results indicated that the presence of the microstructure hindered the spreading of the droplets and changed the wetting characteristics of the droplets on the inner surface of the microstructures, thereby resulting in more static contact angles.
4. For the 3-D appearance of the “peak” surface microstructures, the 2-D axisymmetric CFD model established by the equivalent triangular waveform accurately predicted the contact angle of the microstructure surface, which was highly consistent with the experimental results.

Author Contributions

Methodology, L.Y.; software, S.H. and R.Y.; formal analysis, S.H. and R.Y.; resources, C.L. and L.Y.; data curation, S.H. and R.Y.; writing—original draft preparation, S.H. and R.Y.; writing—review and editing, S.H.

Funding

This research was funded by National Natural Science Foundation of China, grant number 51376022.

Acknowledgments

This work was supported by National Natural Science Foundation of China.

Conflicts of Interest

The authors declare no conflict of interest.

Nomenclature

rratio of the true surface area to the projected
fspercent of liquid–solid contact area
Rasurface roughness, μm
Ffluid volume fraction
hheight of the structure, μm
λwidth of the structure, μm
wwidth of the morphology, μm
Ssource term
Vscalar speed
ν vector speed
Aarea
σsurface-tension coefficient
Greek letters
θ Y contact angle depending on the liquid surface and vapor
γ s g surface tension at solid–vapor interface
γ s l surface tension at solid–liquid interface
γ l g surface tension at liquid–vapor interface
θ W * apparent contact angle
θ C * Wenzel’s liquid–solid contact angle
θ E Cassie–Baxter’s liquid–solid contact angle
Subscripts, superscripts, and acronyms
PIIIplasma immersion ion implantation
VOFvolume of fluid
SEMscanning electron microscopy
AFMatomic force microscopy
CCassie and Baxter state
WWenzel state
lliquid
ssolid
ggas
aair
wwater

References

  1. Attinger, D.; Frankiewicz, C.; Betz, A.R.; Schutzius, T.M.; Ganguly, R.; Das, A.; Kim, C.J.; Megaridis, C.M. Surface engineering for phase change heat transfer: A review. MRS Energy Sustain. 2014, 1. [Google Scholar] [CrossRef]
  2. Quan, Y.Y.; Zhang, L.Z.; Qi, R.H.; Cai, R.R. Self-cleaning of surfaces: The role of surface wettability and dust types. Sci. Rep. 2016, 6, 38239. [Google Scholar] [CrossRef] [PubMed]
  3. Zhao, A.; Yang, J.; Yang, E.H. Self-cleaning engineered cementitious composites. Cem. Concr. Compos. 2015, 64, 74–83. [Google Scholar] [CrossRef]
  4. Li, W.; Kang, Z. Fabrication of corrosion resistant superhydrophobic surface with self-cleaning property on magnesium alloy and its mechanical stability. Surf. Coat. Technol. 2014, 253, 205–213. [Google Scholar] [CrossRef]
  5. Zhao, L.; Liu, Q.; Gao, R.; Wang, J.; Yang, W.; Liu, L. One-step method for the fabrication of superhydrophobic surface on magnesium alloy and its corrosion protection, antifouling performance. Corros. Sci. 2014, 80, 177–183. [Google Scholar] [CrossRef]
  6. Lyu, S.; Dang, C.N.; Kim, D.; Hwang, W.; Yoon, B. Experimental drag reduction study of super-hydrophobic surface with dual-scale structures. Appl. Surf. Sci. 2013, 286, 206–211. [Google Scholar] [CrossRef]
  7. Kang, B.J.; Chang, K.L.; Oh, J.H. All-inkjet-printed electrical components and circuit fabrication on a plastic substrate. Microelectron. Eng. 2012, 97, 251–254. [Google Scholar] [CrossRef]
  8. Ogihara, H.; Xie, J.; Saji, T. Factors determining wettability of superhydrophobic paper prepared by spraying nanoparticle suspensions. Colloids Surf. A Physicochem. Eng. Asp. 2013, 434, 35–41. [Google Scholar] [CrossRef]
  9. Barthlott, W.; Neinhuis, C. Purity of the sacred lotus, or escape from contamination in biological surfaces. Planta 1997, 202, 1–8. [Google Scholar] [CrossRef]
  10. Qu, M.; Feng, J.; He, J.; Yao, Y.; Liu, S. Facile fabrication of superhydrophobic fabric with mechanical durable property. Nanosci. Nanotechnol. Lett. 2017, 9, 592–595. [Google Scholar] [CrossRef]
  11. Wang, Z.; Elimelech, M.; Lin, S. Environmental applications of interfacial materials with special wettability. Environ. Sci. Technol. 2016, 50, 2132. [Google Scholar] [CrossRef] [PubMed]
  12. Betz, A.R.; Jenkins, J.; Kim, C.J.; Attinger, D. Boiling heat transfer on superhydrophilic, superhydrophobic, and;superbiphilic surfaces. Int. J. Heat Mass Transf. 2013, 57, 733–741. [Google Scholar] [CrossRef]
  13. Qi, B.; Wei, J.; Li, Z.; Xu, H. A fractal dropwise condensation heat transfer model including the effects of contact angle and drop size distribution. Int. J. Heat Mass Transf. 2015, 83, 259–272. [Google Scholar] [CrossRef]
  14. Chau, T.T.; Bruckard, W.J.; Koh, P.T.L.; Nguyen, A.V. A review of factors that affect contact angle and implications for flotation practice. Adv Colloid Interface Sci 2009, 150, 106–115. [Google Scholar] [CrossRef] [PubMed]
  15. Akyildiz, H.I.; Padbury, R.P.; Parsons, G.N.; Jur, J.S. Temperature and exposure dependence of hybrid organic-inorganic layer formation by sequential vapor infiltration into polymer fibers. Langmuir 2012, 28, 15697–15704. [Google Scholar] [CrossRef] [PubMed]
  16. Shen, P.S.; Chiang, Y.H.; Li, M.H.; Guo, T.F.; Chen, P. Research update: Hybrid organic-inorganic perovskite (hoip) thin films and solar cells by vapor phase reaction. APL Mater. 2016, 4, 1035. [Google Scholar] [CrossRef]
  17. Chen, B.; Zheng, X.; Bai, Y.; Padture, N.P.; Huang, J. Progress in tandem solar cells based on hybrid organic-inorganic perovskites. Adv. Energy Mater. 2017, 7, 1602400. [Google Scholar] [CrossRef]
  18. Wang, Y.; Liu, X.; Zhang, H.; Zhou, Z. Superhydrophobic surfaces created by a one-step solution-immersion process and their drag-reduction effect on water. RSC Adv. 2015, 5, 18909–18914. [Google Scholar] [CrossRef]
  19. Feng, L.; Zhang, H.; Wang, Z.; Liu, Y. Superhydrophobic aluminum alloy surface: Fabrication, structure, and corrosion resistance. Colloids Surf. A Physicochem. Eng. Asp. 2014, 441, 319–325. [Google Scholar] [CrossRef]
  20. Wu, Y.; Zhang, C. Analysis of anti-condensation mechanism on superhydrophobic anodic aluminum oxide surface. Appl. Therm. Eng. 2013, 58, 664–669. [Google Scholar] [CrossRef]
  21. Emelyanenko, A.M.; Shagieva, F.M.; Domantovsky, A.G.; Boinovich, L.B. Nanosecond laser micro- and nanotexturing for the design of a superhydrophobic coating robust against long-term contact with water, cavitation, and abrasion. Appl. Surf. Sci. 2015, 332, 513–517. [Google Scholar] [CrossRef]
  22. Xin, B.; Hao, J. Reversibly switchable wettability. Chem. Soc. Rev. 2010, 39, 769–782. [Google Scholar] [CrossRef] [PubMed]
  23. Hao, P.; Lv, C.; Zhang, X. Freezing of sessile water droplets on surfaces with various roughness and wettability. Appl. Phys. Lett. 2014, 104, 117. [Google Scholar] [CrossRef]
  24. Song, D.; Song, B.; Hu, H.; Du, X.; Ma, Z. Contact angle and impinging process of droplets on partially grooved hydrophobic surfaces. Appl. Therm. Eng. 2015, 85, 356–364. [Google Scholar] [CrossRef]
  25. Das, S.; Kumar, D.S.; Bhaumik, S. Experimental study of nucleate pool boiling heat transfer of water on silicon oxide nanoparticle coated copper heating surface. Appl. Therm. Eng. 2016, 96, 555–567. [Google Scholar] [CrossRef]
  26. Yang, L.X.; Chao, Y.M.; Jia, L.; Li, C.B. Wettability and boiling heat transfer study of black silicon surface produced using the plasma immersion ion implantation method. Appl. Therm. Eng. 2016, 99, 253–261. [Google Scholar] [CrossRef]
  27. Bell, M.S.; Azar, S.; Fichthorn, K.A.; Ali, B. Effects of hierarchical surface roughness on droplet contact angle. Langmuir 2015, 31, 6752–6762. [Google Scholar] [CrossRef]
  28. Hashim, J.; Looney, L.; Hashmi, M.S.J. The wettability of sic particles by molten aluminium alloy. J. Mater. Process. Tech. 2001, 119, 324–328. [Google Scholar] [CrossRef]
  29. Liu, J. The Research of Plasma Immersion Ion Implantation System and Its Application; Lanzhou University: Lanzhou, China, 2012. [Google Scholar]
  30. Xia, Y.; Liu, B.; Liu, J.; Shen, Z.; Li, C. A novel method to produce black silicon for solar cells. Sol. Energy 2011, 85, 1574–1578. [Google Scholar] [CrossRef]
  31. Rahman, M.A.; Jacobi, A.M. Experimental investigation of wetting anisotropy on microgrooved brass surfaces. Procedia Eng. 2014, 90, 611–617. [Google Scholar] [CrossRef]
  32. Rahman, M.A.; Jacobi, A.M. Experimental study on frosting/defrosting characteristics of microgrooved metal surfaces. Int. J. Refrig. 2015, 50, 44–56. [Google Scholar] [CrossRef]
Figure 1. Wetting models of (a) Yang’s theory, (b) Wenzel theory, and (c) Cassie–Baxter theory.
Applsci 09 00566 g001
Figure 2. Schematic diagram and preparation schematic of plasma immersion ion implantation (PIII)—(a) PIII device and (b) process of implantation.
Applsci 09 00566 g002
Figure 3. SEM image of the sample surfaces—untreated surface (a), gas-treated surface with a mixing ratio of 1:1 (b) 2:1 (c), 3:1 (d), 4:1 (e), 5:1 (f), and 6:1 (g).
Applsci 09 00566 g003
Figure 4. AFM image of the sample surface—untreated surface (a), gas-treated surface with a mixing ratio of 1:1 (b), 2:1 (c), 3:1 (d), 4:1 (e), 5:1 (f), and 6:1 (g).
Applsci 09 00566 g004
Figure 5. Variation of the area ratio and surface roughness with the mixing ratio of the gases.
Applsci 09 00566 g005
Figure 6. Variation of the contact angle with the mixing ratio of the gases.
Applsci 09 00566 g006
Figure 7. Comparison between the experimental and theoretical contact angles.
Applsci 09 00566 g007
Figure 8. 2-D parameterization microstructure surfaces (a) and typical surface morphology: (b) triangular wave (w = 0); (c) trapezoid wave (w = λ/4); (d) rectangular wave (w = λ/2).
Applsci 09 00566 g008
Figure 9. Geometric model and boundary condition.
Applsci 09 00566 g009
Figure 10. Mesh sensitivity analysis with grid numbers (a) 59,333; (b) 93,323; (c) 115,213; and (d) 138,133.
Applsci 09 00566 g010
Figure 11. Model verification results—(a) numerical and (b) experimental.
Applsci 09 00566 g011
Figure 12. Change process of the droplets on a smooth surface.
Applsci 09 00566 g012
Figure 13. Change process of the droplets on the microstructural surface.
Applsci 09 00566 g013
Figure 14. Relationship of the contact-angle change with the area ratio.
Applsci 09 00566 g014
Table 1. Relationship between the sample number and mixture ratio of the gas.
Number1234567
Mixing ratio of the gases (SF6/O2) Untreated1:12:13:14:15:16:1
Table 2. Theoretical contact angle.
Mixing Ratio of the Gases (SF6/O2)01:12:13:14:15:16:1
r 11.1041.4401.6321.7362.0762.232
θ W * 54493216
f S 10.9030.6040.5360.4700.4170.393
θ C * 54649299105110112
Table 3. The value of the fluid volume fraction.
F = 0 Only air in the control unit
0 < F < 1 Water and air in the control unit
F = 1 Only water in the control unit
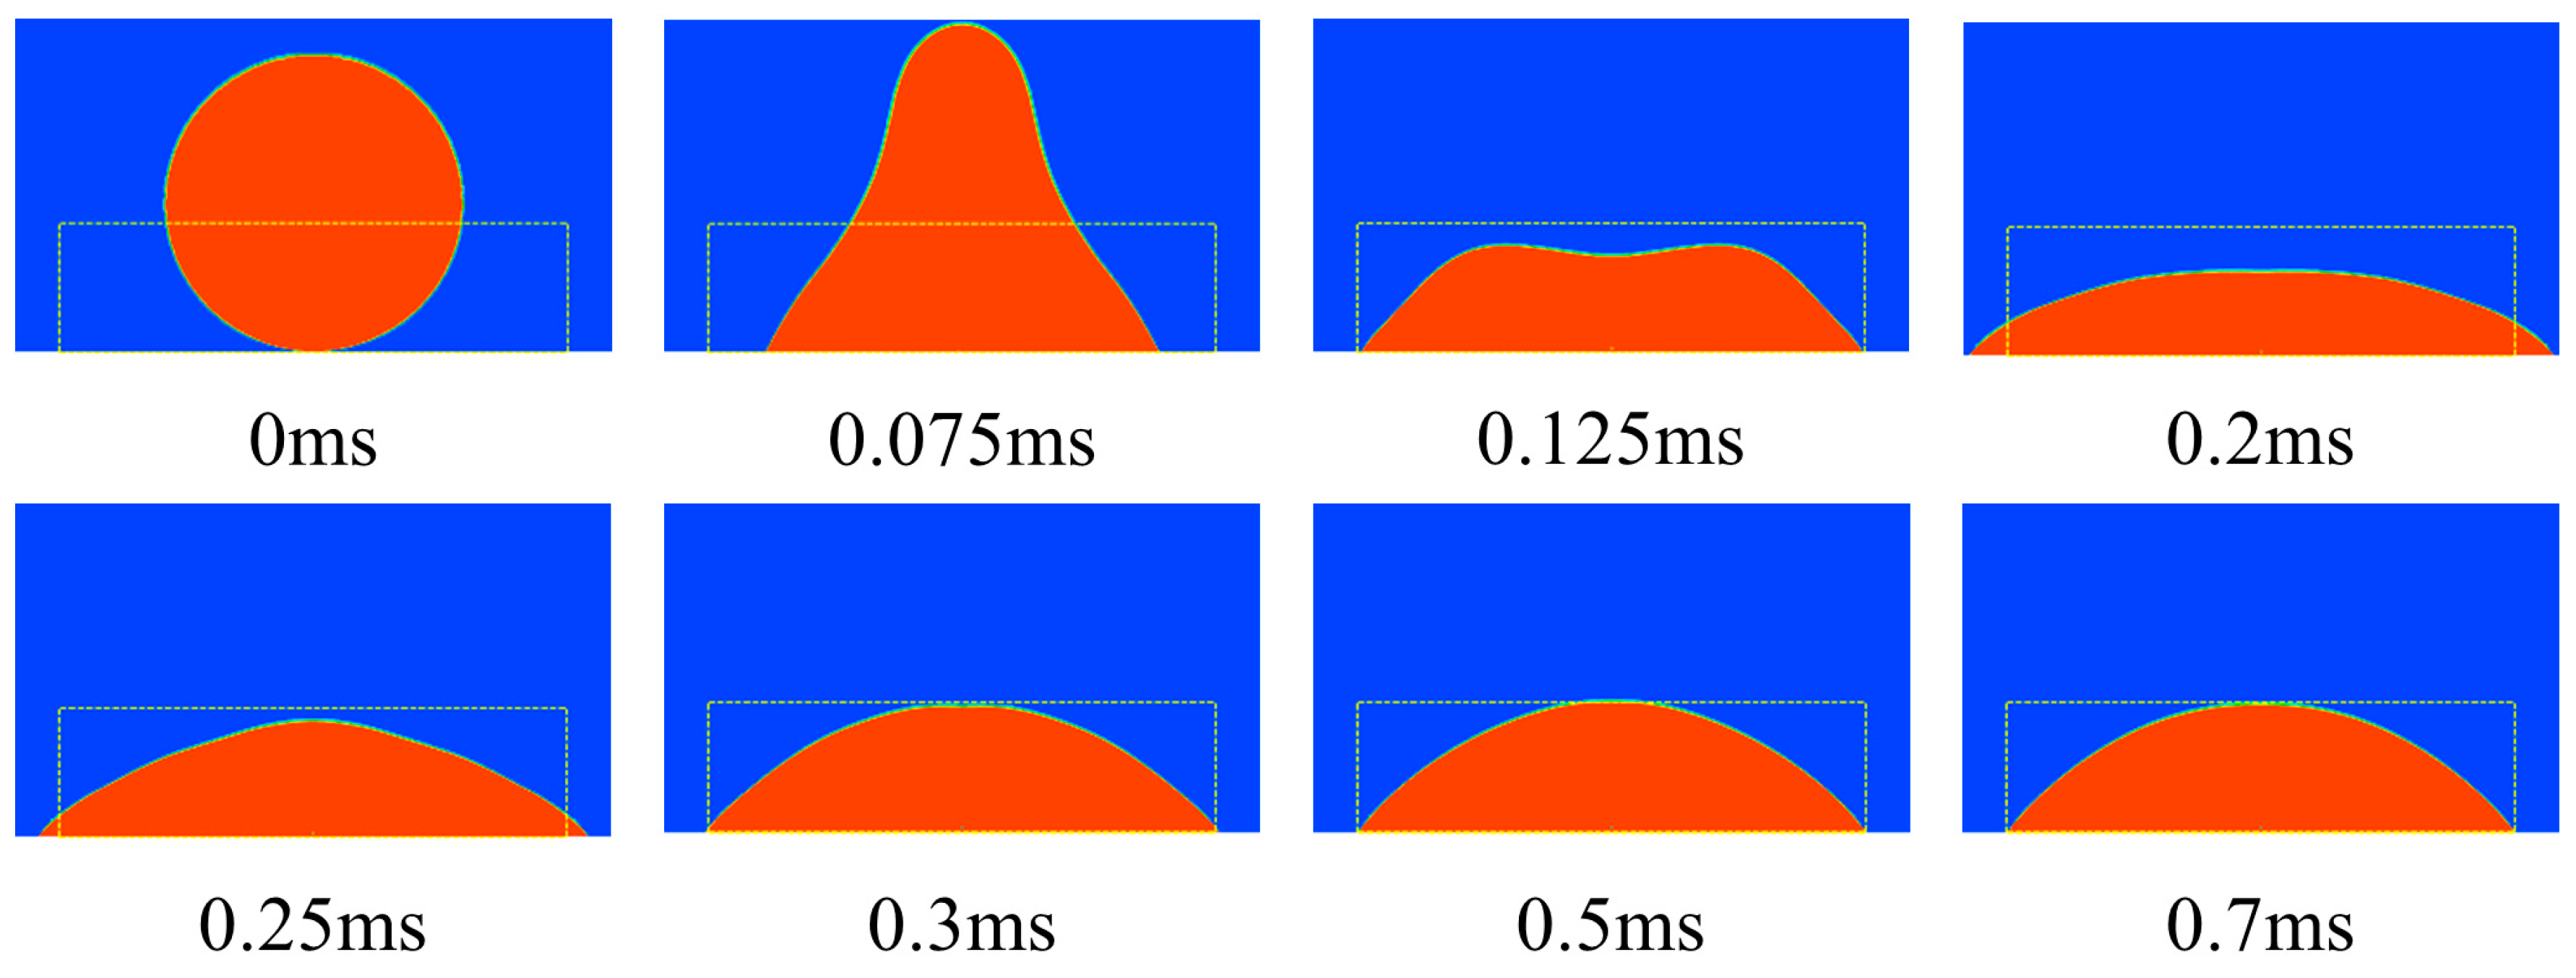
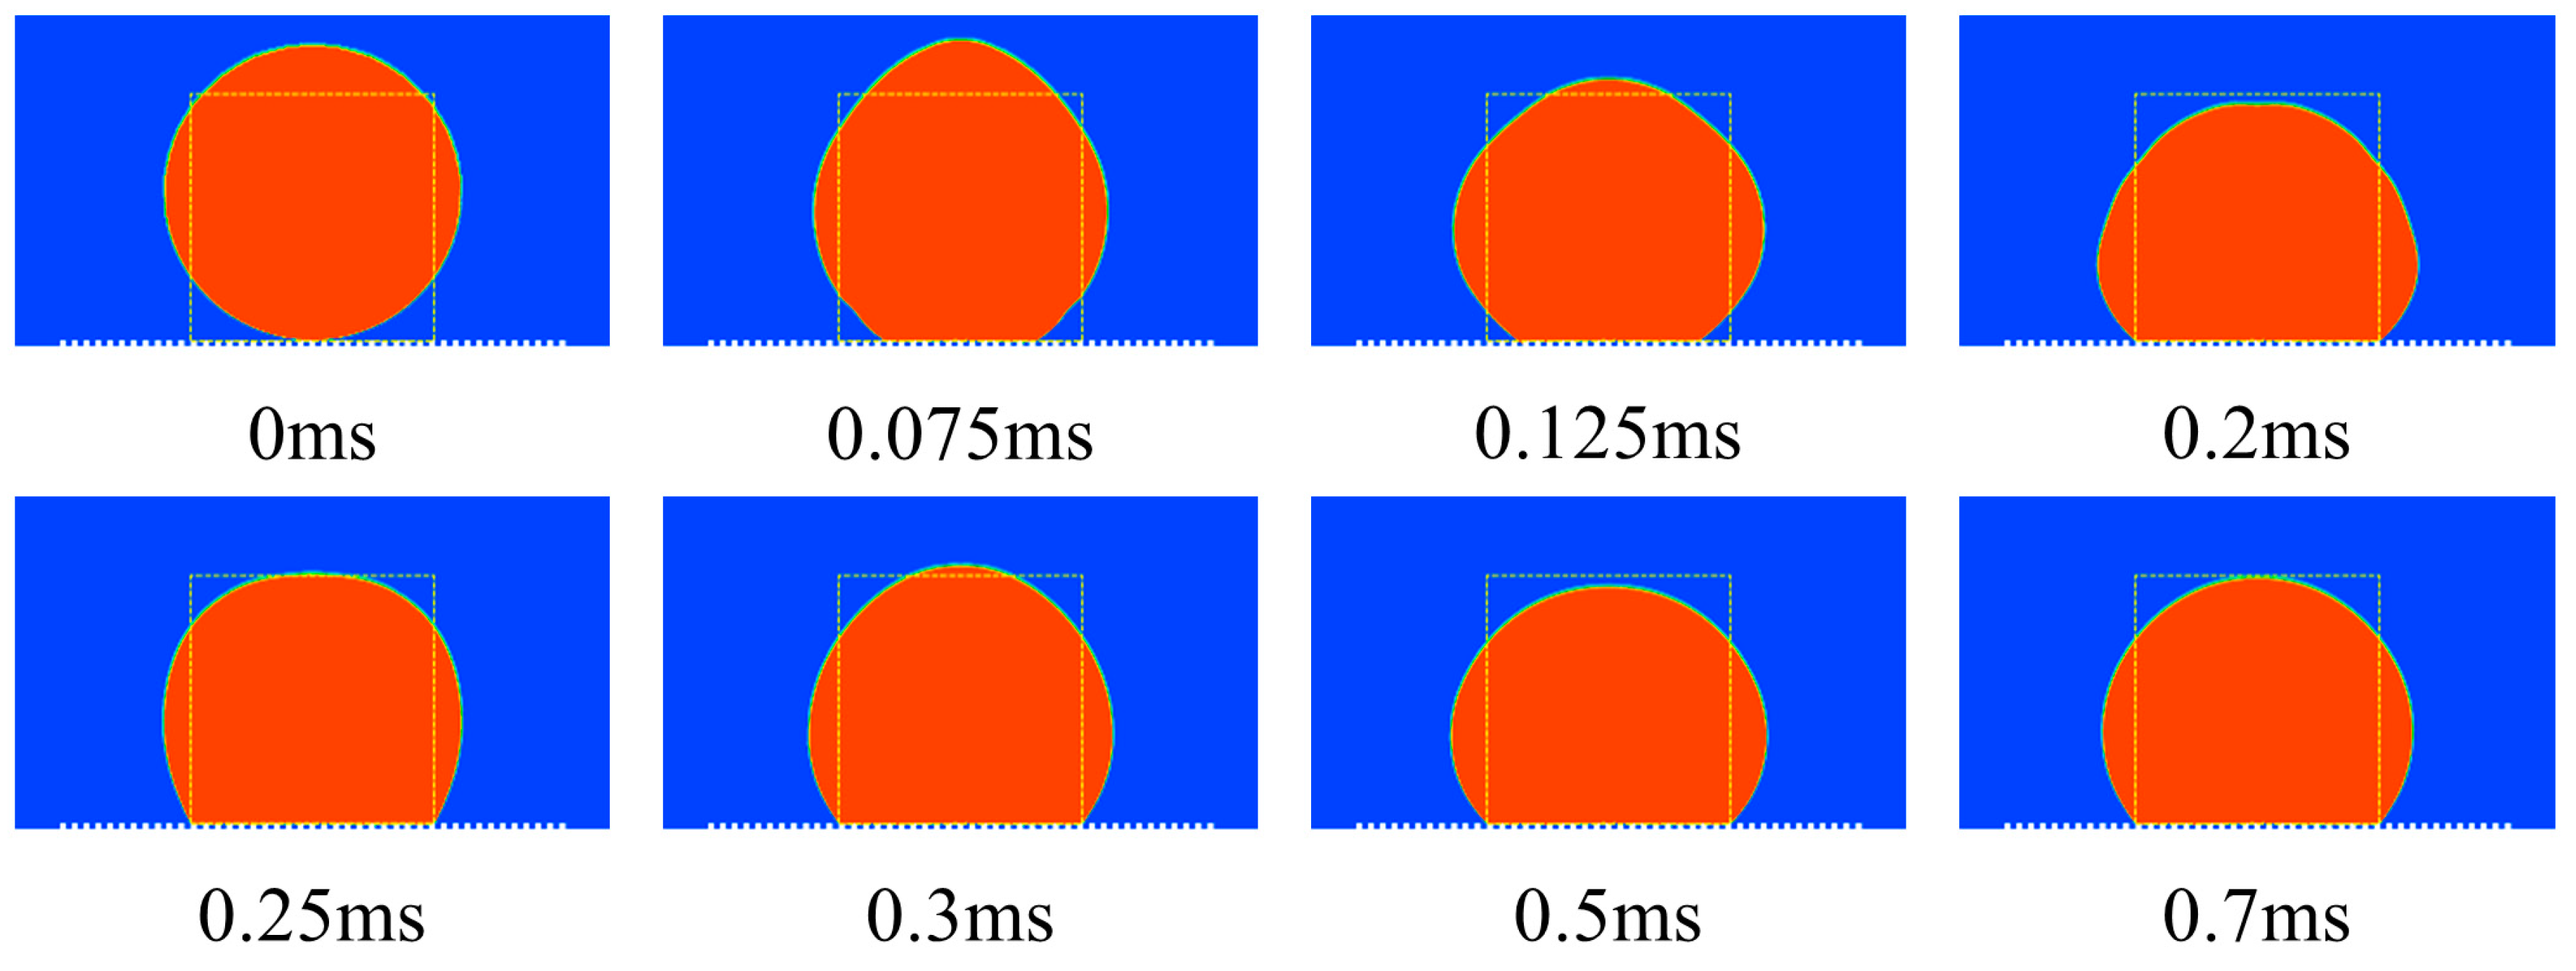
Table 4. The state changes of the droplet.
0 msThe initial state
0–0.075 msThe droplet rose to its maximum height
0.075–0.2 msThe droplet spread to maximum diameter
0.2–0.3 msThe droplet shrank to stable state
0.3–0.7 msThe stable state
Table 5. The state changes of the droplet.
0 msThe initial state
0–0.075 msThe droplet rose to its maximum height
0.075–0.5 msThe oscillating state
0.5–0.7 msThe stable state

