Article

Effect of Height Ratio and Mass Ratio on Structure—Soil—Structure Interaction of Two Structures Using Centrifugal Experiment

1
Department of Civil and Environmental Engineering, Chonnam National University, Yeosu 550-749, Korea
2
Department of Marine and Civil Engineering, Chonnam National University, Yeosu 550-749, Korea
3
Cenits Corporation, R#1107 233 Gasandigital 1Ro Geumcheon Gu, Seoul 08501, Korea
*
Author to whom correspondence should be addressed.
Appl. Sci. 2019, 9(3), 526; https://doi.org/10.3390/app9030526
Submission received: 9 January 2019 / Revised: 24 January 2019 / Accepted: 30 January 2019 / Published: 4 February 2019
(This article belongs to the Section Mechanical Engineering)

Abstract

:
In a megacity, structure response during an earthquake could be increased or decreased due to effects from neighboring structures, through structure-soil-structure interaction (SSSI). In the present study, a series of dynamic geotechnical centrifuge tests are carried out to investigate SSSI effects on responses of structure with various characteristics of mass, height, and natural frequency. Experimental observations are focused on the effects of the distance between two structures, type, and peak acceleration of input excitation. A period lengthening is observed in the soil-foundation-structure interaction (SFSI) effects of all structures. It is monitored that an increment in response of smaller structure and a decrement in response of larger structure, compared to isolated structure, due to SSSI effects. Unfavorable distance reveals that the most significant increment in response of S2 structure occurred at approximately one-fourth of wavelength transmitted from the vibrating adjacent structure. More severe SSSI effects are found under a lower input earthquake acceleration. It is found that both height and mass ratios, between two adjacent structures, are particular parameters on SSSI, resulting in increment or reduction of structure response.

1. Introduction

The soil-structure interaction (SSI) is well-known as a dynamic coupling phenomenon between soil and structure under seismic loading [1,2]. In engineering practice, a free-field (FF) motion, recorded in soil at a distance far away from the structure, could be preliminarily regarded as a foundation input motion (FIM) for structure analysis [3]. However, an earthquake acceleration recorded in the free-field generally differs from the FIM. Thus, soil-foundation-structure interaction (SFSI) has been recently considered to estimate seismic response of a structure [4,5,6]. Ahmadi and Eskandari [7], and Eskandari et al. [8], have proposed mathematical solutions for the vibration of foundations, either embedded or buried with an inclined load. SFSI is attributed to two distinct mechanisms: (1) Kinematic interaction (KI) of soil-foundation, and (2) inertial motion (II) of structure that re-affects response of the foundation [2,4,5,9,10,11,12,13].
Due to the global explosion in demography and the development of megacities, many structures constructed are surrounded by various sized buildings with different dynamic characteristics. Previous investigations have reported that significant changes of the near-field motion, due to the dynamic response of structures [14]. Such changes also affect the response of structures located nearby, this is called the structure-soil-structure interaction (SSSI) phenomenon [4,15,16,17,18,19]. Therefore, it is essential in engineering practices to explore SSSI effects to avoid unexpected damage in structure when another structure is placed nearby, as SSSI effects are not considered in modern seismic design codes [20,21,22].
Lee and Wesley [19], in their pioneering work, have analytically investigated SSSI effects for a group of two and three buildings in a 3D scheme, using a simple model composed of masses and springs connection. Other works of Luco and Contesse [23], Murakami and Luco [24], and Wong and Trifunac [25] have been performed to study two-dimensional seismic problems of two or more infinite shear walls with a scenario of vertically incident harmonic SH-waves propagation. They have observed some detrimental effects on structure response during an earthquake when a target wall is located adjacent to a larger and heavier one. More recently, Nakagawa et al. [26] and Kitada et al. [27] performed a large-scale force vibration test for a cluster of NPP and found that the appearance of Control Building can result in a decrease in Reactor Building response in the vicinity of the structures’ resonant frequency. Xu et al. [28] and Broc [29] have conducted back-analysis for the above large-scale force vibration tests, using SASSI program and couple boundary element method and finite element method. Their results suggest that: (1) SSSI effects occur near the peak response; and (2) SSSI could be associated with structural properties.
Some numerical or experimental studies have also been performed to find key factors controlling SSSI effects in a configuration group of two structures, including the distance between two foundations and the characteristics of an adjacent structure, such as relative mass, height, and natural frequency. Chen et al. [17]; Ogut [30]; and Naserkhaki and Pourmohammad [18] have numerically demonstrated that a massive structure can have detrimental SSSI effects on a lighter structure. On the other hand, Alexander et al. [16], Aldaikh et al. [31], and Aldaikh et al. [32] have used a discrete model and demonstrated that SSSI effects between two and three single-degree-of-freedom (SDOF) structures could be controlled by height or fixed-base frequency ratios between structures. They found that the response of short structure increased when taller structures with lower in fixed-base frequency were located in close proximity. Mason et al. [4] and Trombetta et al. [33] have successfully conducted centrifuge tests to investigate the SSSI effects between a higher structure and a non-linear frame structure, using multi-earthquakes as input motions. Alexander et al. [16] and Aldaikh et al. [31] have reported that SSSI effects between two structures could appear at a distance twice the foundation width (B). Padrón et al. [34] have studied the site-city interaction and suggested that an “unfavorable distance” between the center of foundations with approximately one half or one-fourth of the wavelength (λ), being produced by structure vibrations for propagations of SV-, and R-wave, respectively, could induce the most extreme SSSI effects.
Throughout these historical analyses, it is clear that the SSSI phenomena is still un-revealing. In the present study, nine centrifugal tests were performed to investigate the SSSI effects of two structures with various ratios of mass, height, fixed-base frequency, and distance between structures. Three SDOF structures (named S1, S2, and S3, respectively) were designed with different inertia characteristics (i.e., height and mass) and fixed-base frequency. The SSSI effects on S1 structure were explored in both time and frequency domains when S2 or S3 structures were located at various distances between two structures. Finally, the effects of distance between structures, height ratio, and mass ratio on the variation of structure response with the appearance of neighbor structure compared with that of isolated structure were discussed.

2. Model Preparation and Testing Procedure

2.1. Centrifuge and In-Flight Earthquake Simulator

Modeling in the geotechnical centrifuge is one of the most convenient approaches to investigate the dynamic soil-structure interaction, especially with frequency-controlled earthquake motions. Tests in this study were performed at the Geotechnical Centrifuge Testing Center, located in the Korea Advanced Institute of Science and Technology (KAIST). The maximum pay-load capacity of the centrifuge machine is 2400 kg for 100 g with a rotational radius of 5.0 m. The earthquake simulator used in this study is an electro-hydraulic-servo type. It can generate a maximum ground acceleration of 40 g [35]. An equivalent shear beam (ESB) model container, with an inner dimension of 490 × 490 mm inner dimension and a height of 630 mm, was used to reduce the boundary effect on the dynamic behavior of soil [36]. To choose an appropriate centrifugal scale, both frequency content of the input motion generated by an earthquake simulator and the model scale were considered. A centrifugal acceleration (N) of 45 g was implemented for all tests in this study.

2.2. Experimental Program

2.2.1. Structure and Soil Modeling

Three model buildings named S1, S2, and S3 with different masses and heights were designed to simulate the SSSI effects between various structures in a megacity environment. Structure models were made as SDOF building composed of two thin plates and a lumped mass at the top. Aluminum was used because it was challenging to construct model structures with concrete. Table 1 shows dimensions of prototype structures with considering scaling laws. Foundation dimensions with equivalent radius (rf = B L / π , where B = width and L = length of the foundation) were selected considering the size of each model, the size of the ESB container, and centrifugal acceleration. Height (h, from bottom to center of lumped mass) of the structure was 9.4 m for S1, 8.25 m for S2, and 2.97 m for S3.
Mass ratio (ψ = massadjacent/massreference) and height ratio (χ = hadjacent/hreference) between adjacent and reference buildings are influential factors controlling SSSI phenomena [16,17,18,30,32]. In this study, to explore the effects of mass between adjacent buildings on SSSI phenomena, the mass of S1, the most massive structure, was pre-designed to be approximately 1.5 times larger than the mass of S2 and 15.3 times larger than that of S3. The mass ratio (ψ1-2 = mS1/mS2) between S1 and S2 was 1.5, while the mass ratio (ψ1-3 = mS1/mS3) between S1 and S3 was 15.3. Also, to investigate the effect of height ratio between adjacent structures, height ratios were pre-defined to be χ1-2 = hS1/hS2 = 1.14 for S1 and S2 structures and 3.16 for S1 and S3 (i.e., χ1-3 = 3.16). Therefore, in a tested case composed of S1 and S2 structures, the mass ratio ψ2-1 and height ratio χ2-1 for S1 structure were 0.67, and 0.88 respectively, while these values were inversely calculated for S2 structure as ψ1-2 = 1.5 and χ1-2 = 1.14. Similarly, for a series of tests with a configuration of S1 and S3 structures, the mass ratio ψ3-1 was 0.07 and the height ratio χ3-1 was 0.32 for the S1 structure. For the S3 structure, ψ1-3 was 15.3 and χ1-3 was 3.16.
Fixed-base natural frequencies of small-scale structure models (fn,model) were measured by the impact hammer test on fixed-based small-scale models and calculated by the fast Fourier transform (FFT) analysis from measured results. With reference to the scaling law [37], fixed-base natural frequencies (fn) of the prototype structures were calculated to be 2.19 Hz for S1, 1.82 Hz for S2, and 7.05 Hz for S3. Alexander et al. [16] have reported beneficial SSSI effects on structural response when the adjacent structure is shorter or has a higher fixed-base frequency. Since the S1 building was taller, but has higher stiffness and fixed-base frequency compared to the S2 structure, the influence of height ratio or fixed-base frequency ratio on SSSI could be differentiated between the S1 and S2 structures. In addition, Both S2 and S3 structures were shorter and smaller than the S1 structure. However, the S3 structure had a higher fixed-base frequency while the S2 structure had a lower fixed-base frequency than the S1 building. Therefore, whether height ratio or fixed-base frequency ratio could control SSSI was also determined by comparing the response of S1 structure when it was located adjacent to the S2 or S3 structures.
A poorly-graded clean silica sand (Gs = 2.65 and D50 = 0.51 mm) was used in this study, with its index properties are presented in Table 2. An air-pluviation method was adopted to prepare a model ground with targeted relative density (Dr) of 80 %. The ground model (thickness of 27 m at the prototype scale) was prepared with an instrument having an array of eight pairs of in-flight bender elements as shown in Figure 1. Figure 2 shows shear wave velocities (Vs) of the soil measured by in-flight bender element array under centrifuge acceleration. Measured Vs well-matched with VS estimated by the laboratory test results such as oedometer equipped with bender elements and resonant column (RC) tests performed on the soil at the same relative density.
FSv, the vertical factor of safety, was defined with Terzaghi’s equation [38] to determine bearing capacity of the soil-foundation system. The internal friction angle of the sand was evaluated to be 36.6° by performing triaxial tests at the same relative density of the soil. Calculated FSv value was 19.6 for S1, 22.5 for S2, and 23.1 for S3, which indicates very high values for all structures.
To monitor motions of the soil and foundation/structure simultaneously, a total of 23 accelerometers (PCB353B17, PCB Piezotronics) were installed at the ESB box, in the soil, at the soil surface, or at the structure model as shown in Figure 1. A vertical array of horizontal accelerometers (A2 to A6) in the ground was used to explore ground response in the soil. An accelerometer A23 was located on the ESB box to measure bed-rock input motion accurately. Vertical and horizontal accelerometers (i.e., A7 and A8) were installed to measure the free-field motion (FFM), due to input motion. Note that the locations for these free-field accelerometers were chosen to be far away from the structures and boundary of the ESB box as much as possible, to reduce the structure’s motion and boundary effects. Additional accelerometers were attached at foundations, on walls, and at roofs of all structures to monitor foundation input motion (FIM), wall motion (WM), and roof motion (RM), respectively. Six laser sensors (KEYENCE IL-300) were installed at a rigid frame to measure permanent settlement of soil surface (L1) during spinning of the centrifuge and record final settlement and rocking angle of foundations of each structure.

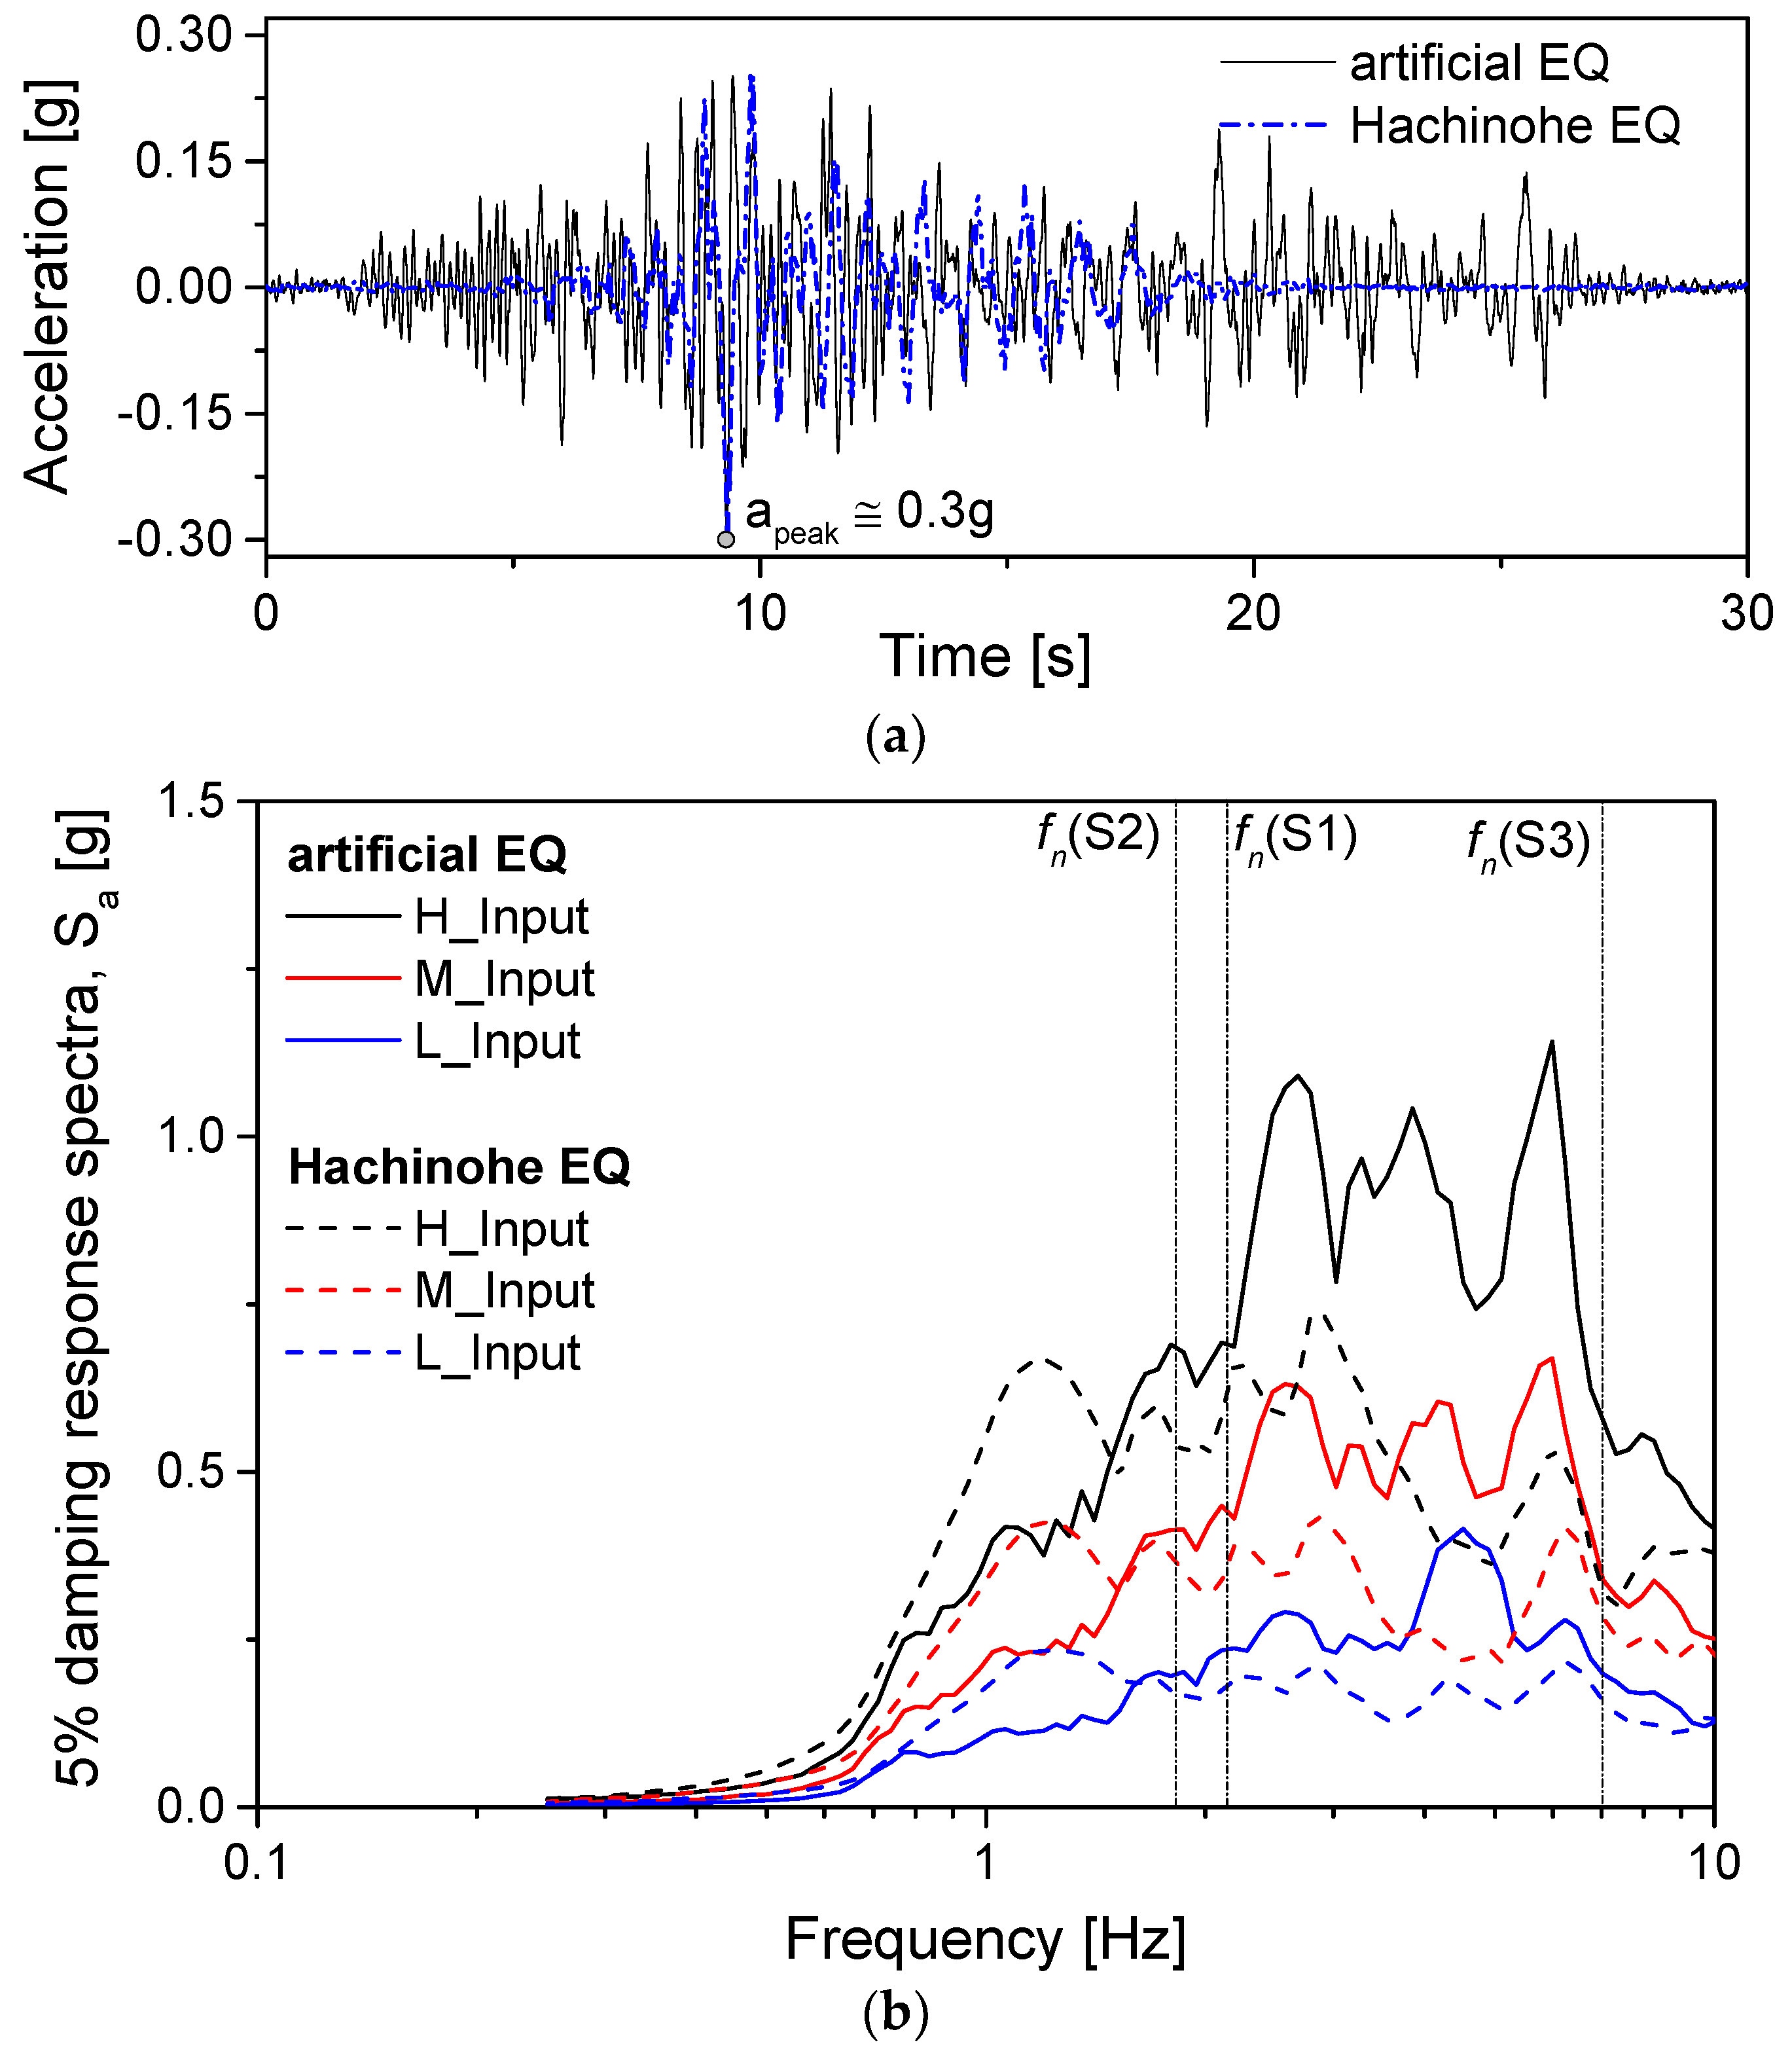
2.2.2. Input Motions

Two input motions (an artificial earthquake with a high intensity and wide bandwidth frequency excitation, and a historical earthquake called as Hachinohe earthquake with a long period and short duration (recorded at Tokachi Oki, Japan in 1968), as shown in Figure 3) were applied as input excitations in each test. Frequency components of these two input motions ranging from 1 to 6 Hz are covered fixed-base frequency (fn) of S1 and S2 structure, which is approximately 2 Hz. The fn of the S3 structure is higher than the frequency range of both input motions. Input motions were filtered with allowable frequency range (40 Hz to 300 Hz at model scale) of the earthquake simulator. By normalizing input time series to a scale factor to obtain target peak acceleration (apeak), three different levels of input motions were applied as base excitation. Note that the suffix of H (apeak = ~0.3 g), M (apeak = ~0.2 g), and L (apeak = ~0.1 g) in the name of each case indicated high, medium, and low intensity of the input motion, respectively.

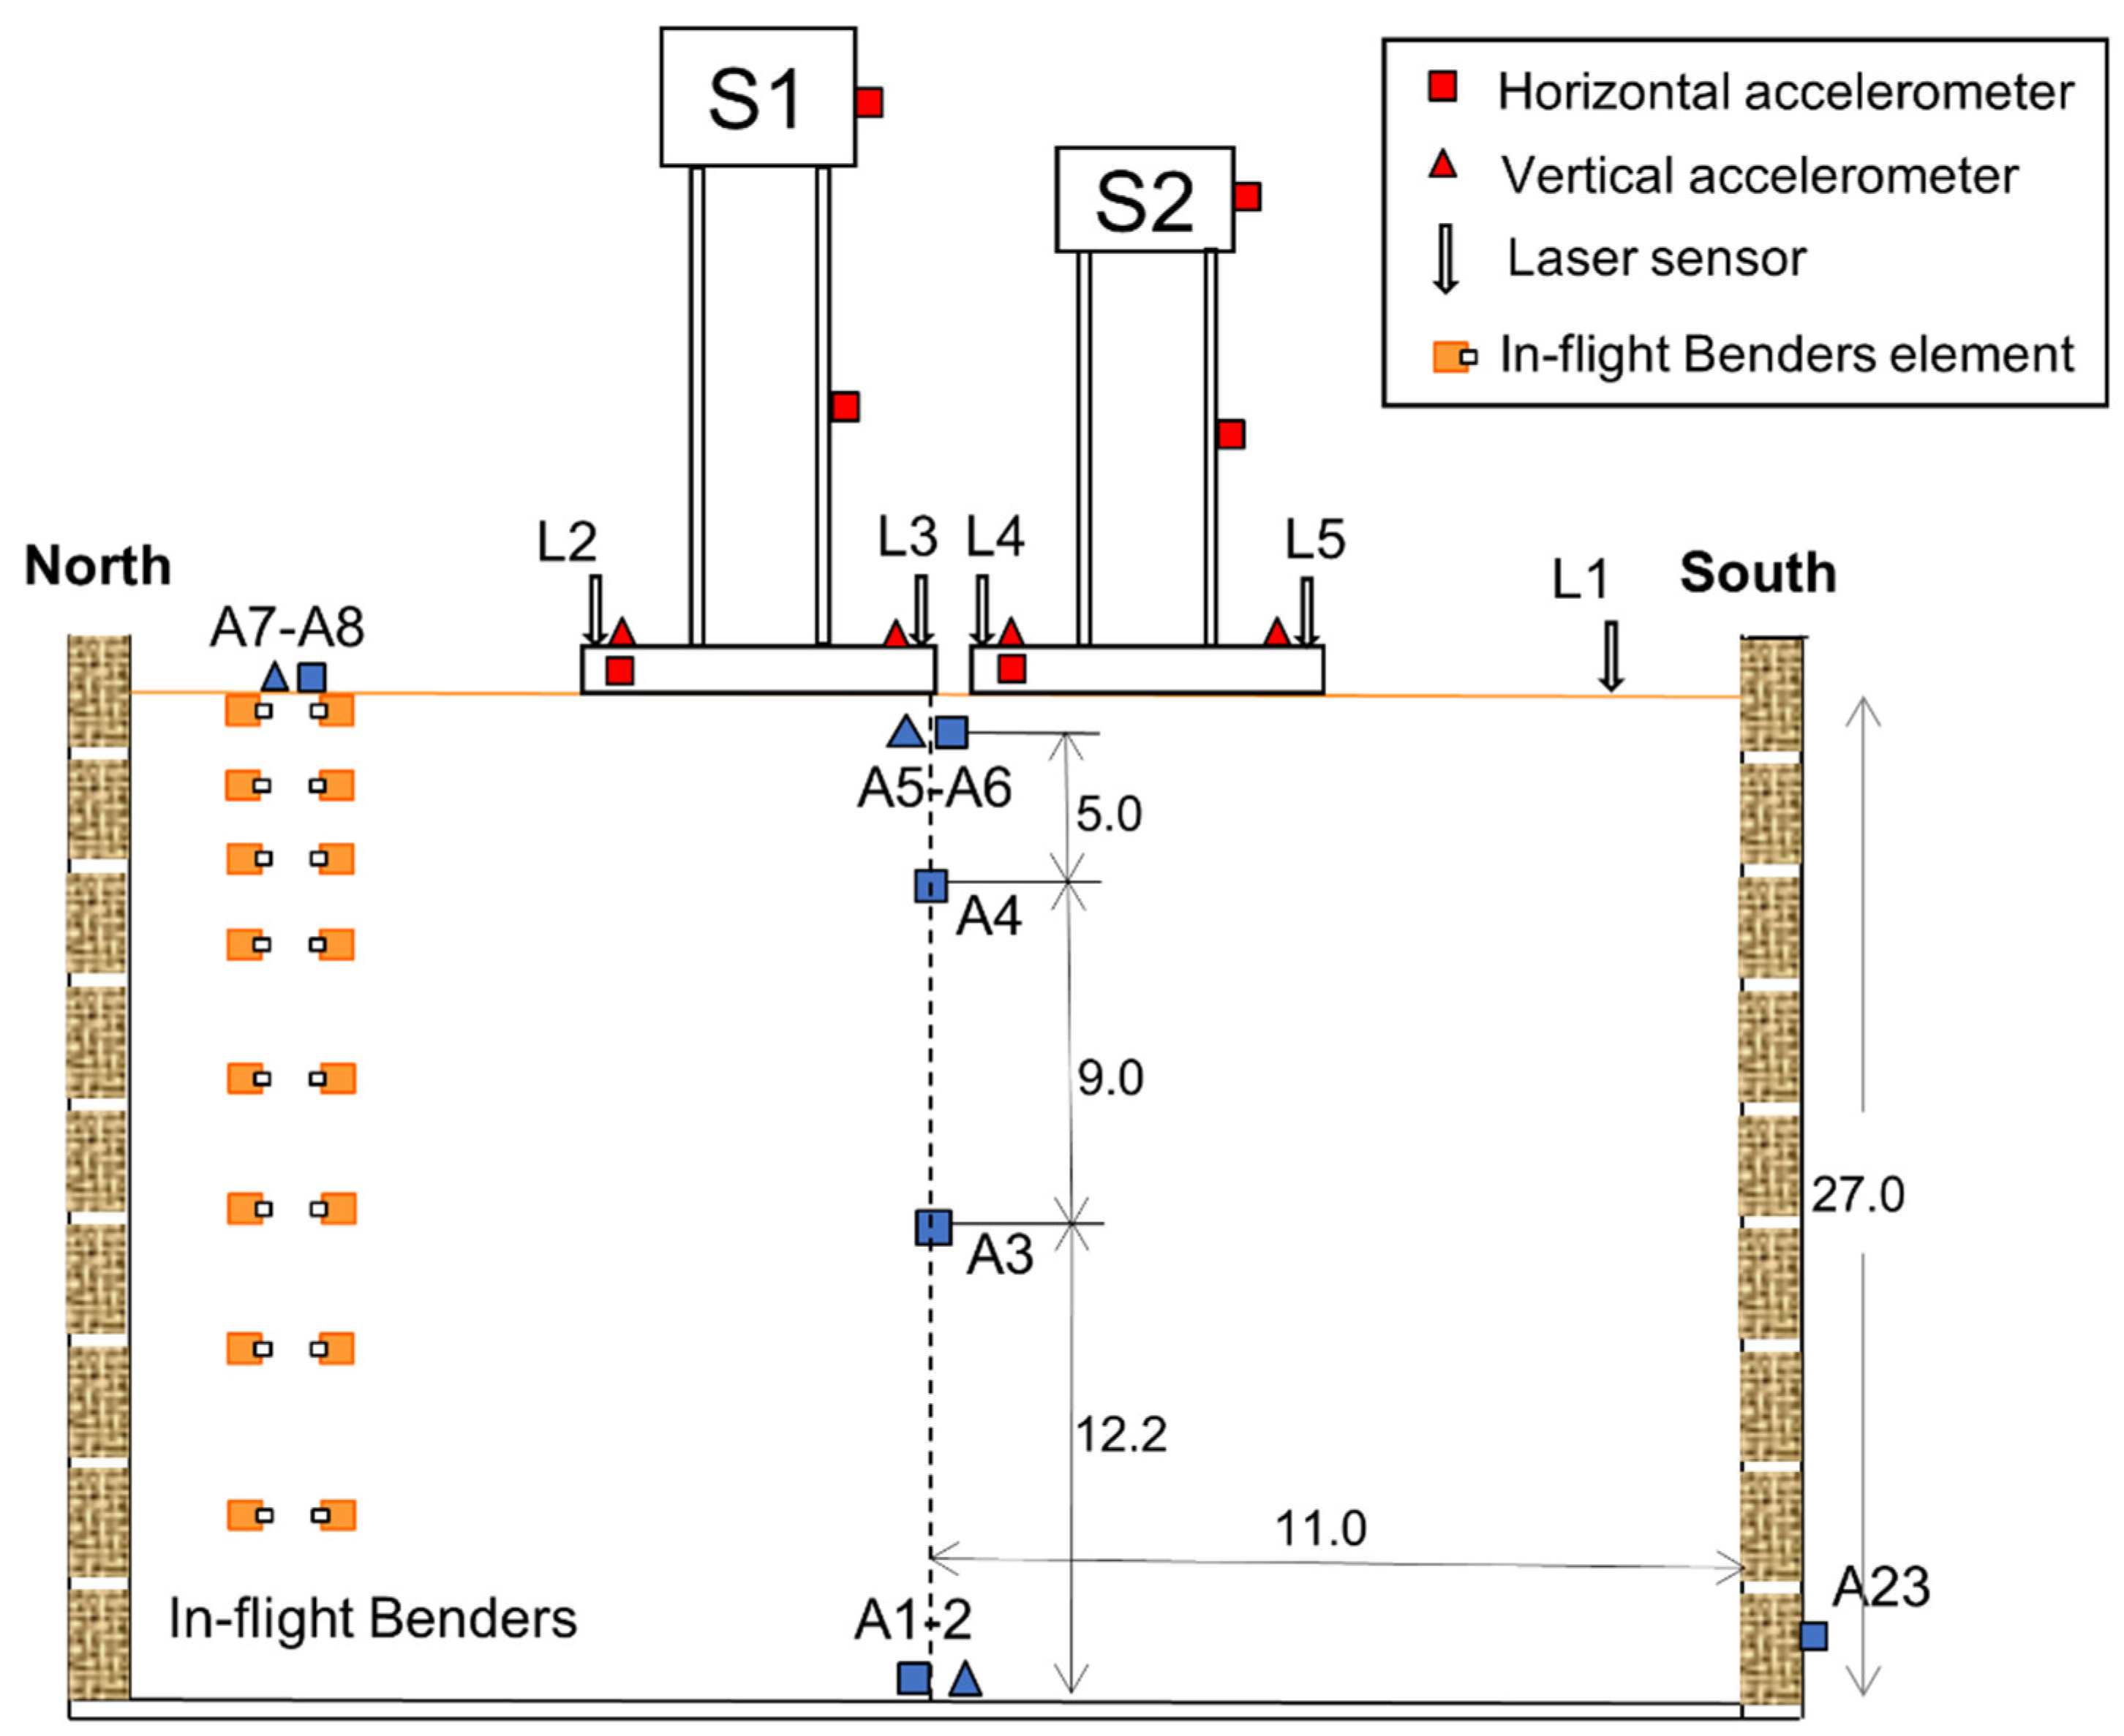
2.2.3. Experimental Layouts

Table 3 presents the experimental layout in this study. Three reference tests were performed to obtain reference responses of isolated S1, S2, and S3 structures. A series of experiments were carried out with two buildings (i.e., S1 and S2 structures in case S1-S2, and S1 and S3 structures in case S1-S3) having different distances. Since Alexander et al. [16] have reported that (1) SSSI effects were obtained at the distance up to twice the foundation width (B); (2) when the distance decreases, SSSI effects become more extreme, especially when the distance is smaller than the width of the foundation. Three different distances between two structures were chosen as B, 0.5B, and 0.03B, considering the size of the ESB box, where B was the width of the S1 structure. Figure 1 shows a typical experimental setup for the test with S1 and S2 structures (named S1-S2 test) with a distance of 0.03B.

2.3. Soil Ground Settlement under Repeated Tests

Ten centrifuge tests were performed consequently with different structure layouts. Since the input motion was applied during each test, the soil was slightly densified. However, permanent settlements of the ground surface and foundation measured by laser sensors indicated approximately 1.7 mm. The increment in Dr between the initial and final conditions due to the settlement was calculated to be approximately 1%. Therefore, it was presumed that the change in Dr of the soil model was minor due to a very dense soil model condition.

3. Experimental Results

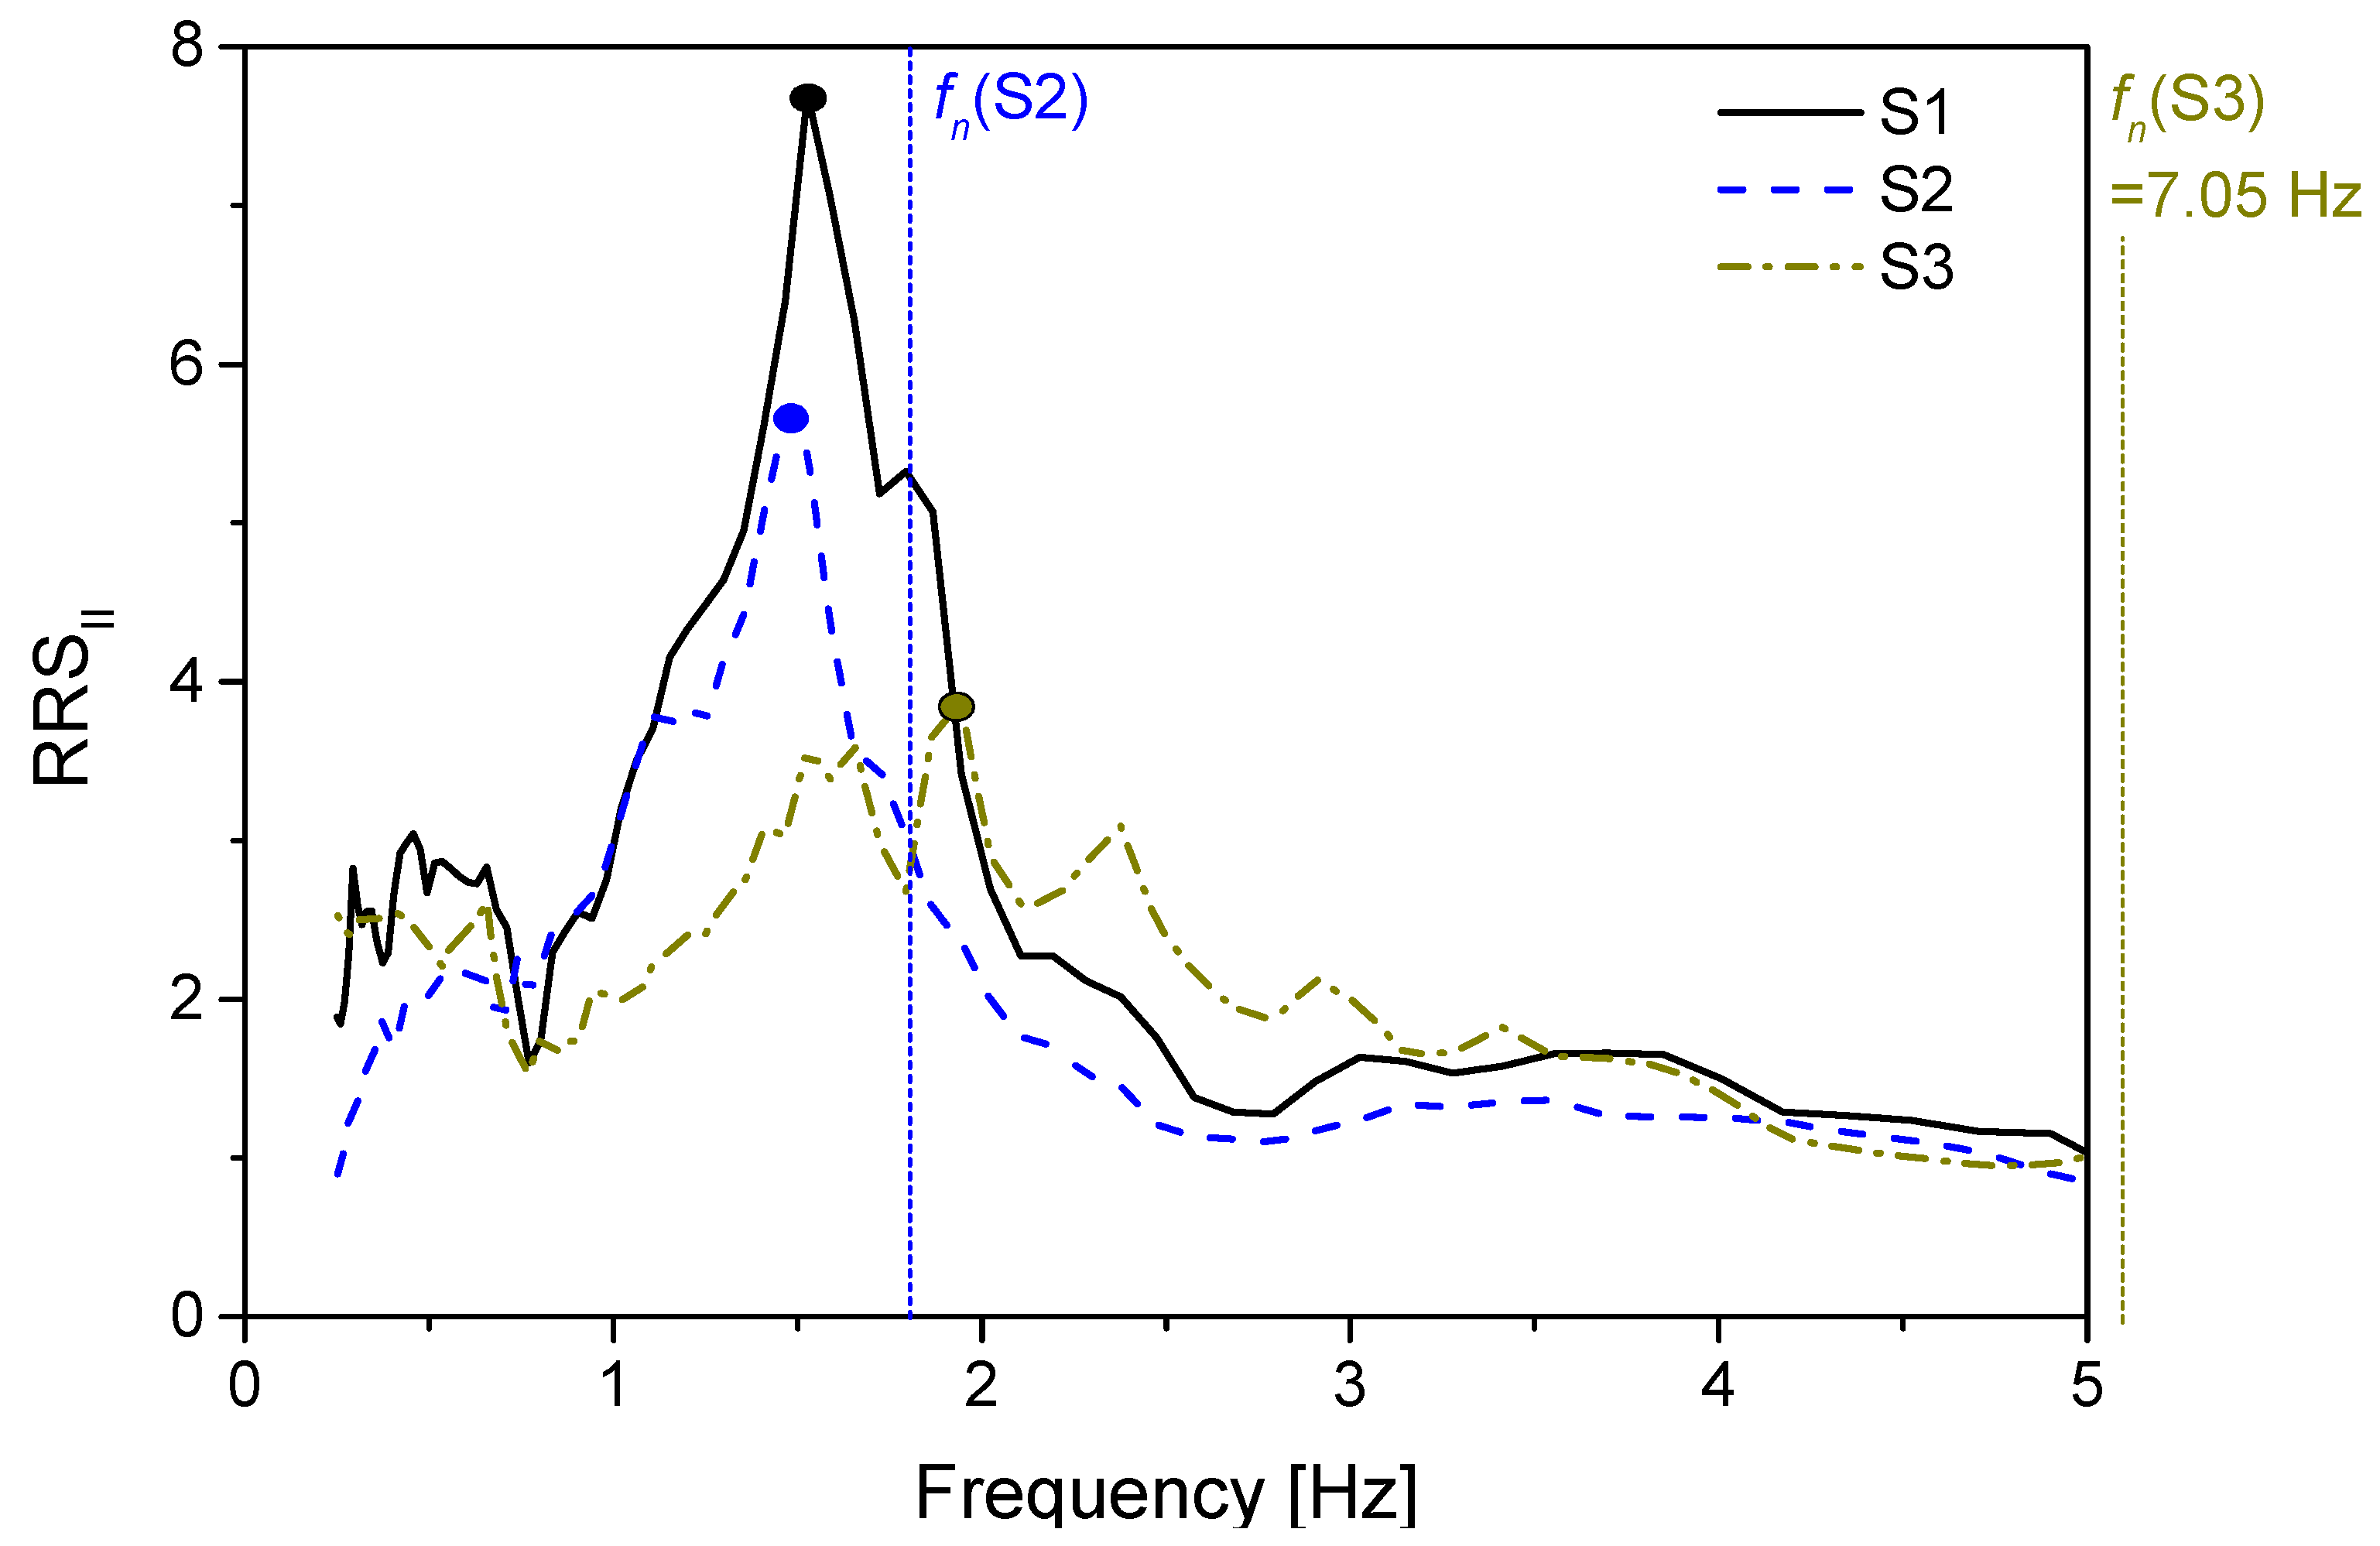
3.1. Seismic Soil-Foundation-Structure Interaction (SFSI)

In the dynamic structural analyses, although free-field (FF) motion is considered as input motion [3,4], acceleration recorded at the foundation called foundation input motion (FIM) usually differs from FF due to kinematic interaction of SFSI. Furthermore, inertial interaction due to inertial vibration of structure mass can cause difference between earthquake motion recorded at structure and FIM when it propagates from the foundation [13]. To eliminate effects of FF amplification, 5% response spectra of the foundation motion were normalized to those of FF as the ratio of response spectra (RRSFIM) [39] while the inertial interaction was assessed by ratio of response spectra (RRSII) of roof motion (RM) to that of FIM [40].
Figure 4 shows RRSFIM and RRSII of S1 structure with artificial earthquake at three different input intensities. It could be seen that foundation response was amplified at around 7 Hz (Figure 4a) which was close to the foundation sliding frequency. Moreover, FIM was slightly amplified at around 1 Hz as a result of inertial response from the lumped-mass. Base-slap averaging effects of kinematic interaction on foundation response were indicated by the below unity of RRSFIM values at the high-frequency range over the foundation sliding frequency [13] as shown in Figure 4a. In Figure 4b, RM was amplified at dominant peak frequency (i.e., flexible-base frequency, fflex) which was 1.6 Hz at L_Input, 1.3 Hz at M_Input, and 1.0 Hz at H_Input. These values were slightly lower than the fixed-base natural frequency (fn = 2.19 Hz) of S1 structure indicating period lengthening or frequency shortening of SFSI [2,13]. With increasing seismic loading, the maximum RRS of RM, the peak of response spectra ratio indicated by solid circles in Figure 4b, and fflex decreased due to degradation in stiffness of soil beneath structures with an increase in earthquake motion or strain level [13,40,41]. RRSII of S2 and S3 structures were also defined and plotted in Figure 5 with artificial input at L_Input which indicated period lengthening effect in SFSI of the two structures. Moreover, the higher and more massive structure (i.e., S1 structure) exhibited higher Max.RRSII because it had higher inertial characteristics (i.e., height and mass).
Figure 6 shows variations of observed flexible-base frequencies (fflex) of S1, S2, and S3 structures with three different levels of input excitation. Markers of connected lines indicate the average fflex values with error bars showing a difference in results between two input motions at each level. For all structures, a similar trend was observed: fflex of all structures decreased with increasing intensity of input excitation. In addition, a structure with higher fn had a higher fflex regardless of the input intensity. However, with increasing input intensity, the difference in fflex of three structures reduced and converged at the highest observed input levels, due to difference in aspect ratio value A (A = h/rf, where h was height and rf was foundation equivalent radius as shown in Table 1). Aspect ratio values for S1, S2, and S3 structure were 3.2, 3.17, and 3.62, respectively. Previous studies [13,41] have reported that a structure with a higher aspect ratio value has a larger increment in period lengthening when soil stiffness decreases. Therefore, S3 structure with the highest aspect ratio value exhibited the largest decrement in fflex, when the input intensity increased or when the soil stiffness decreased. Relatively lower reductions in fflex were observed for S1 and S2 structures because of lower aspect ratio.

3.2. Dynamic SSSI Effects on S1 Structure

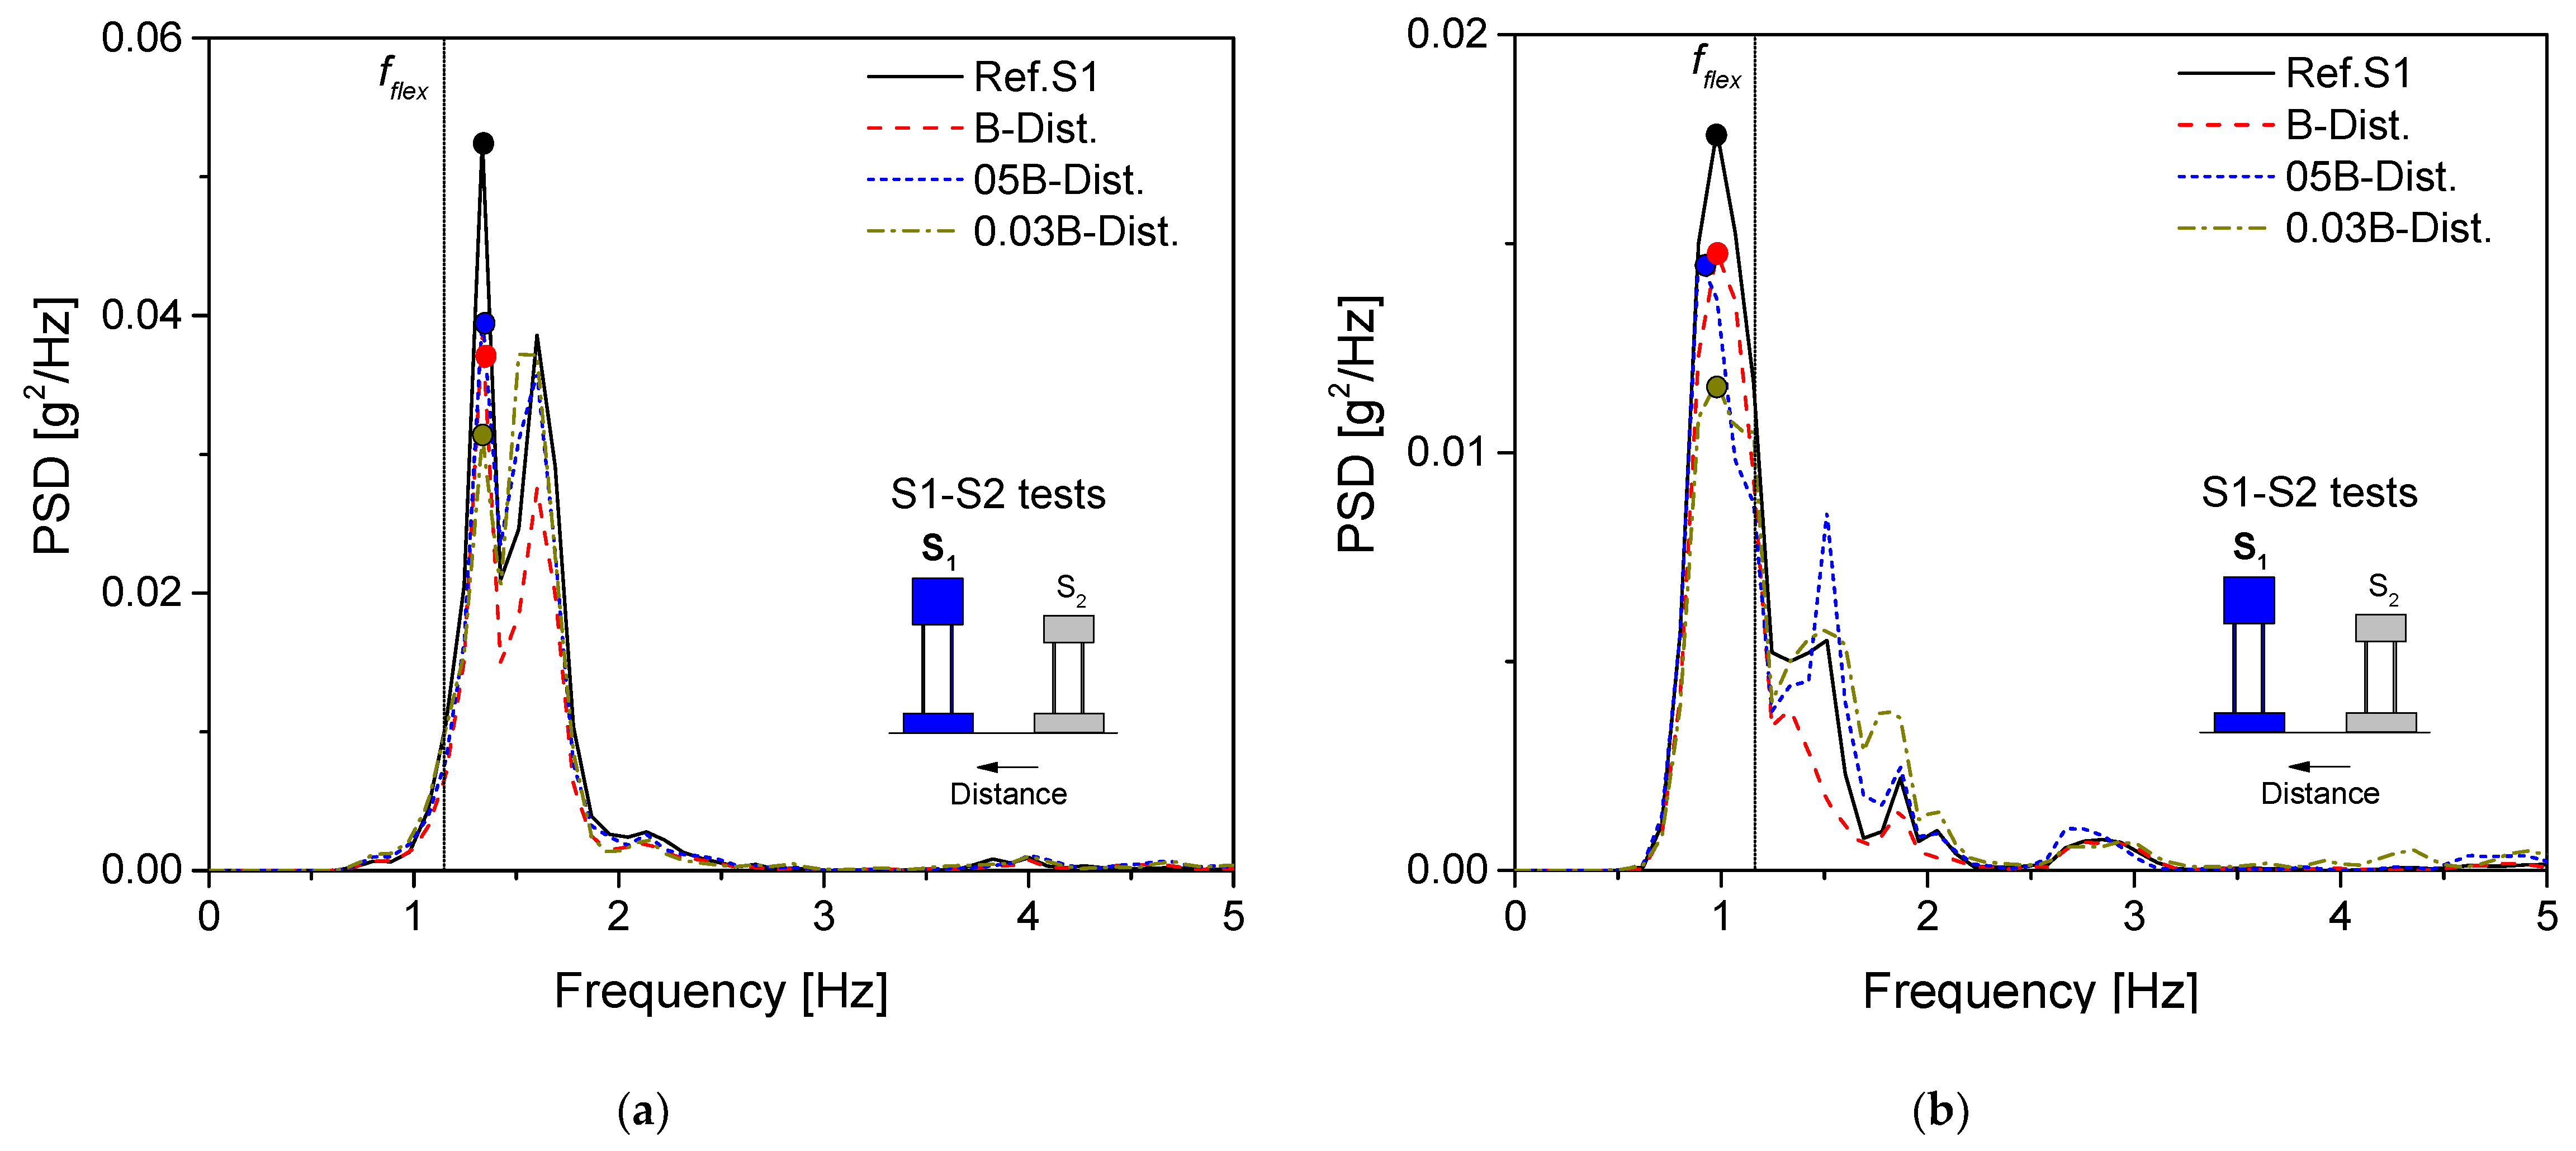
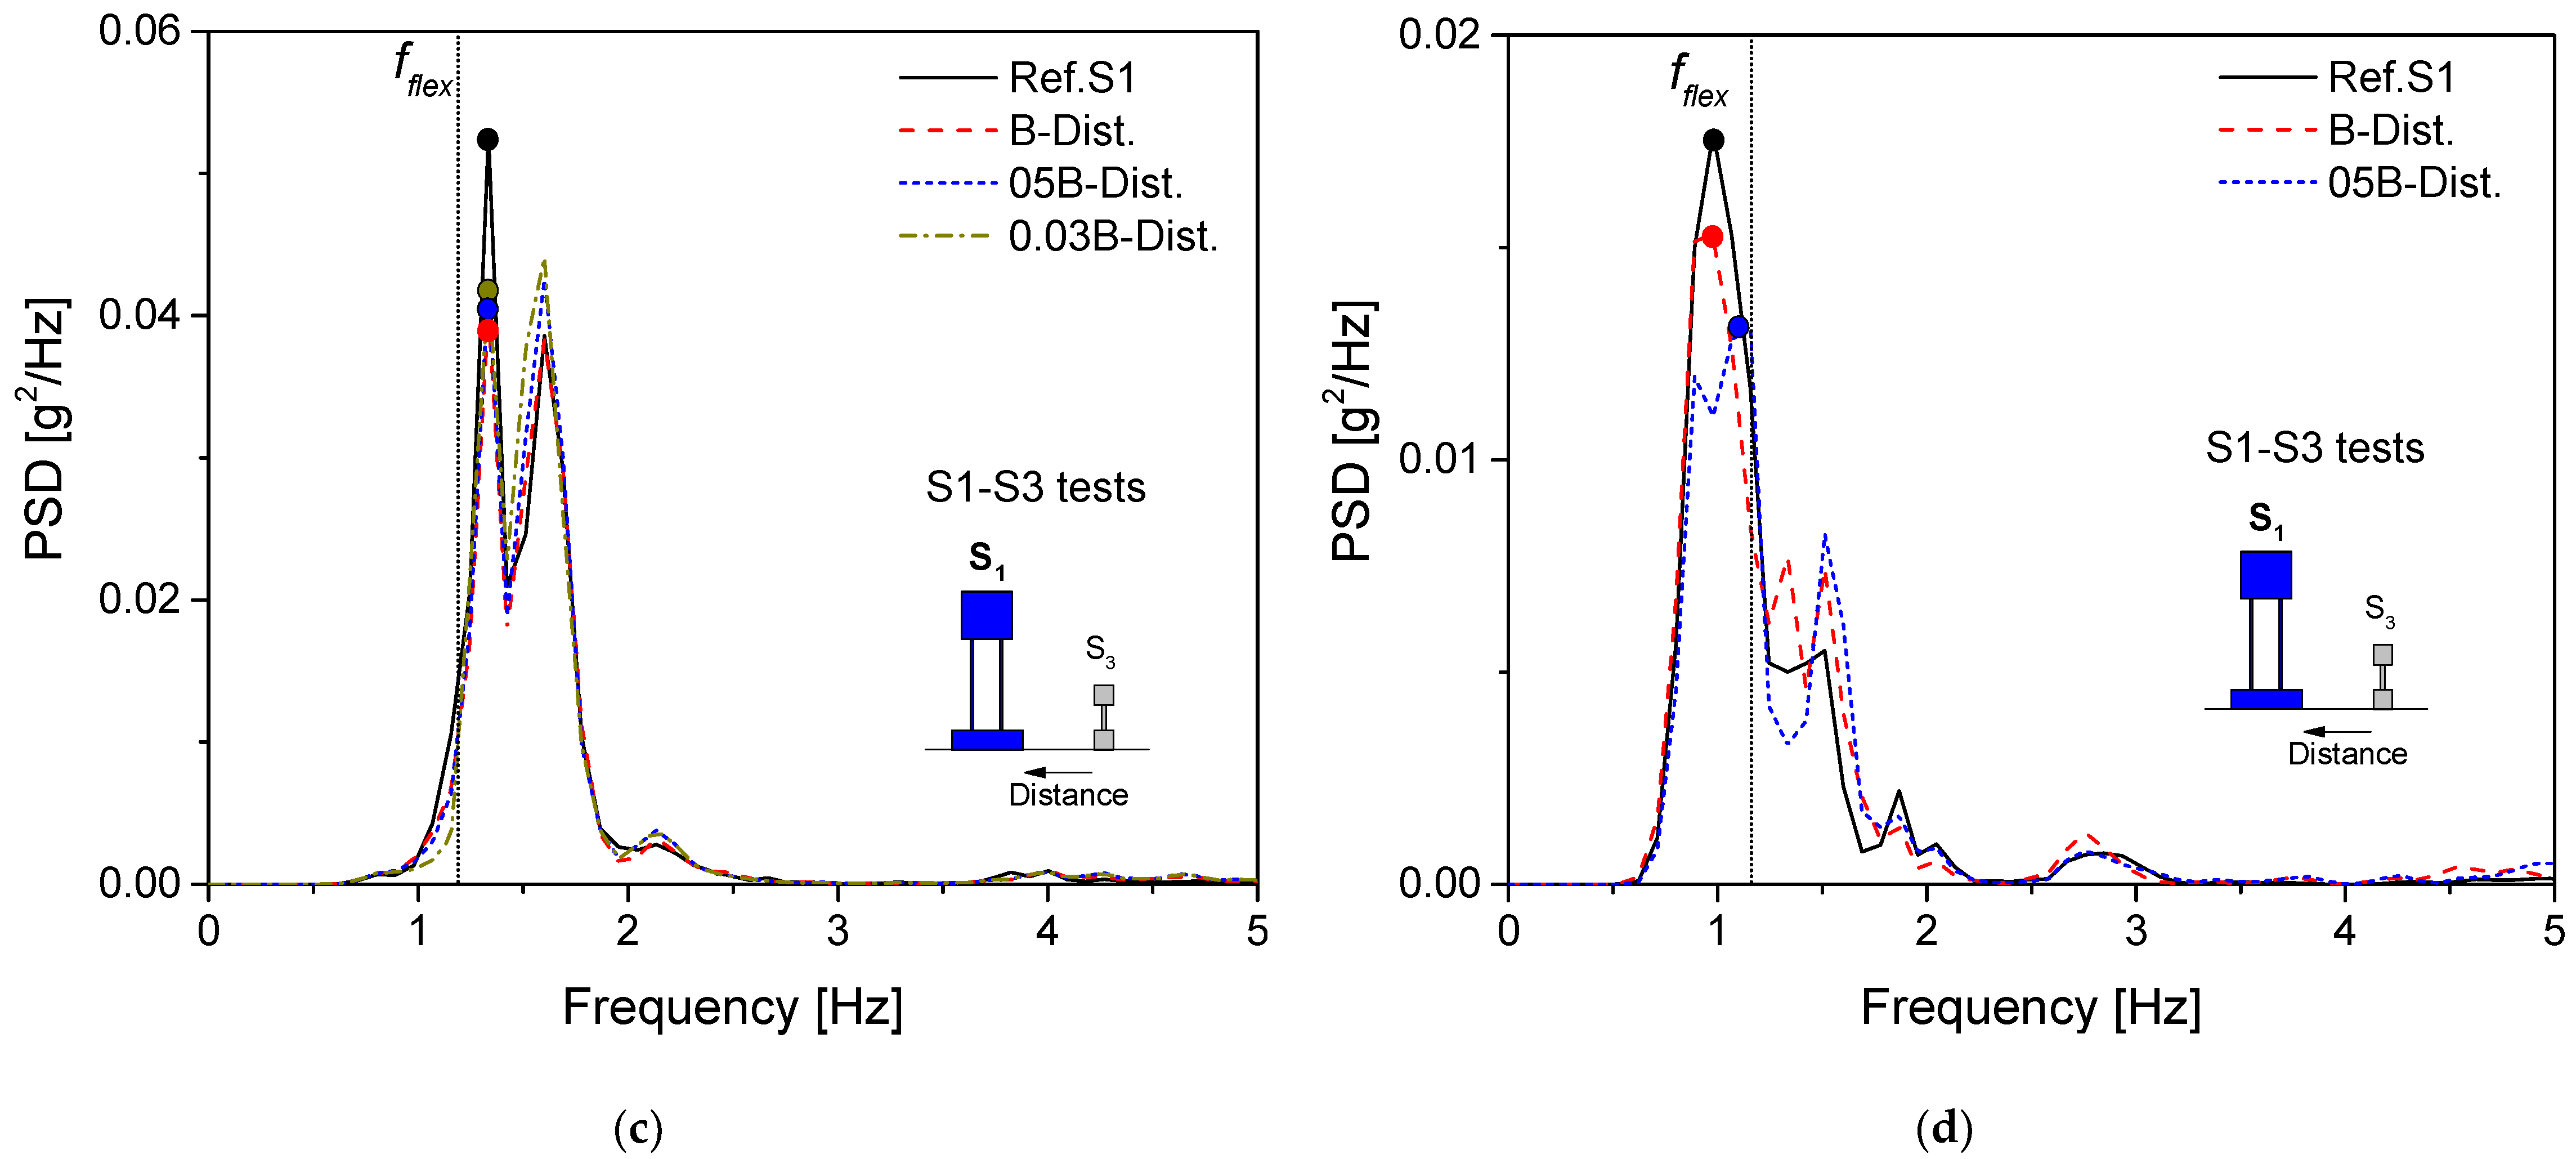
3.2.1. SSSI Effects on Responses of S1 Structure in Frequency Domain

In frequency domain analysis of SSSI phenomena, a number of previous studies have reported changes in natural frequency (i.e., flexible-base frequency of the structure, fflex) and seismic response of structure by plotting response spectra or transfer function [42,43,44]. In the present study, with an assumption of stability in ground amplification due to non-compacted ground and consistently applying input excitations, SSSI effects on the response of S1 structure were explored by comparing RM recorded for each SSSI test to that of the reference test which was response of single structure.
Power Spectral Density (PSD) showing the distribution of power of a signal in frequency domain was calculated for S1 structure with a 1024-point hamming window for smoothing [33]. PSD values at a defined frequency (PSDf) could be obtained using Welch’s method [45]:
PSD f = 1 K k = 1 K P m ( f )
where K is the number of segments, k is the order of segment, and Pm(f) is modified periodogram value. Pm(f) can be defined from discrete Fourier transform of each segment as:
P m ( f ) = 1 m = 0 M ω 2 ( m ) | X k ( f ) | 2
where M is the number of points in each segment, Xk(f) is windowed discrete Fourier transform, and ω(m) is window function. Figure 7 shows typical results of PSD of RM for S1 structure installed with S2 or S3 structures in various distances (i.e., B, 0.5B, and 0.03B) at medium earthquake input intensity. Solid lines indicate reference distribution of PSD for S1 structure (i.e., the single response for S1 structure). Compared to the reference response, SSSI effects caused a reduction in peak PSD of RM for S1 presented by solid points in Figure 7 when other structures such as S2 or S3 were located beside at all tested distances.
For a more robust observation of change in response, the total of power spectral density (ΣPSD) indicating total energy of roof motion in the frequency domain was estimated for PSD of S1 structure. SSSI effects on S1 structure were evaluated using variation in ΣPSD of S1 structure in SSSI tests (ΣPSD(SSSI)) with that of reference test (ΣPSD(Ref)) as follows:
Δ PSD   [ % ] = Σ PSD ( SSSI ) Σ PSD ( Ref ) Σ PSD ( Ref ) × 100
Table 4 presents ΔPSD of S1 with a combination of S2 and S3 structures at different distances. ΣPSD of S1 building reduced when S2 or S3 structure was placed at all tested distances regardless of the type and intensity of input motions. ΣPSD of S1 structure reduced more in tests with S2 structure compared to that in experiments involving S3 structure because S2 building had higher inertial characteristics (i.e., height and mass) than S3 [16,17]. More decrement in ΣPSD was observed in tests at low input intensity compared to that at high input level. The most substantial decrement in ΣPSD of S1 was found to be approximately 30% in case of S2 structure located beside with distance B at L_Input. This observation could be attributed to decrement in inertial interaction of SFSI with increased input excitation level as observed in Figure 4. Experimental results with S1 and S3 structures at a distance of 0.03B, H_Input level of the artificial EQ, and all input levels of Hachinohe EQ could not be recorded because S3 structure collapsed during the test. Note that the negative value of ΔPSD in Table 4 denotes a decrement in ΣPSD of S1 structure response.
As shown in Figure 7, the effect of SSSI phenomena on fflex of S1 structure could be negligible because almost no change was observed in frequency when compared with the reference case. Similar results were also observed in frequency shifting at other input earthquake excitation levels (i.e., L_Input and H_Input of both artificial and Hachinohe earthquakes), thus illustrating similar trends of SSSI effects in frequency shifting.

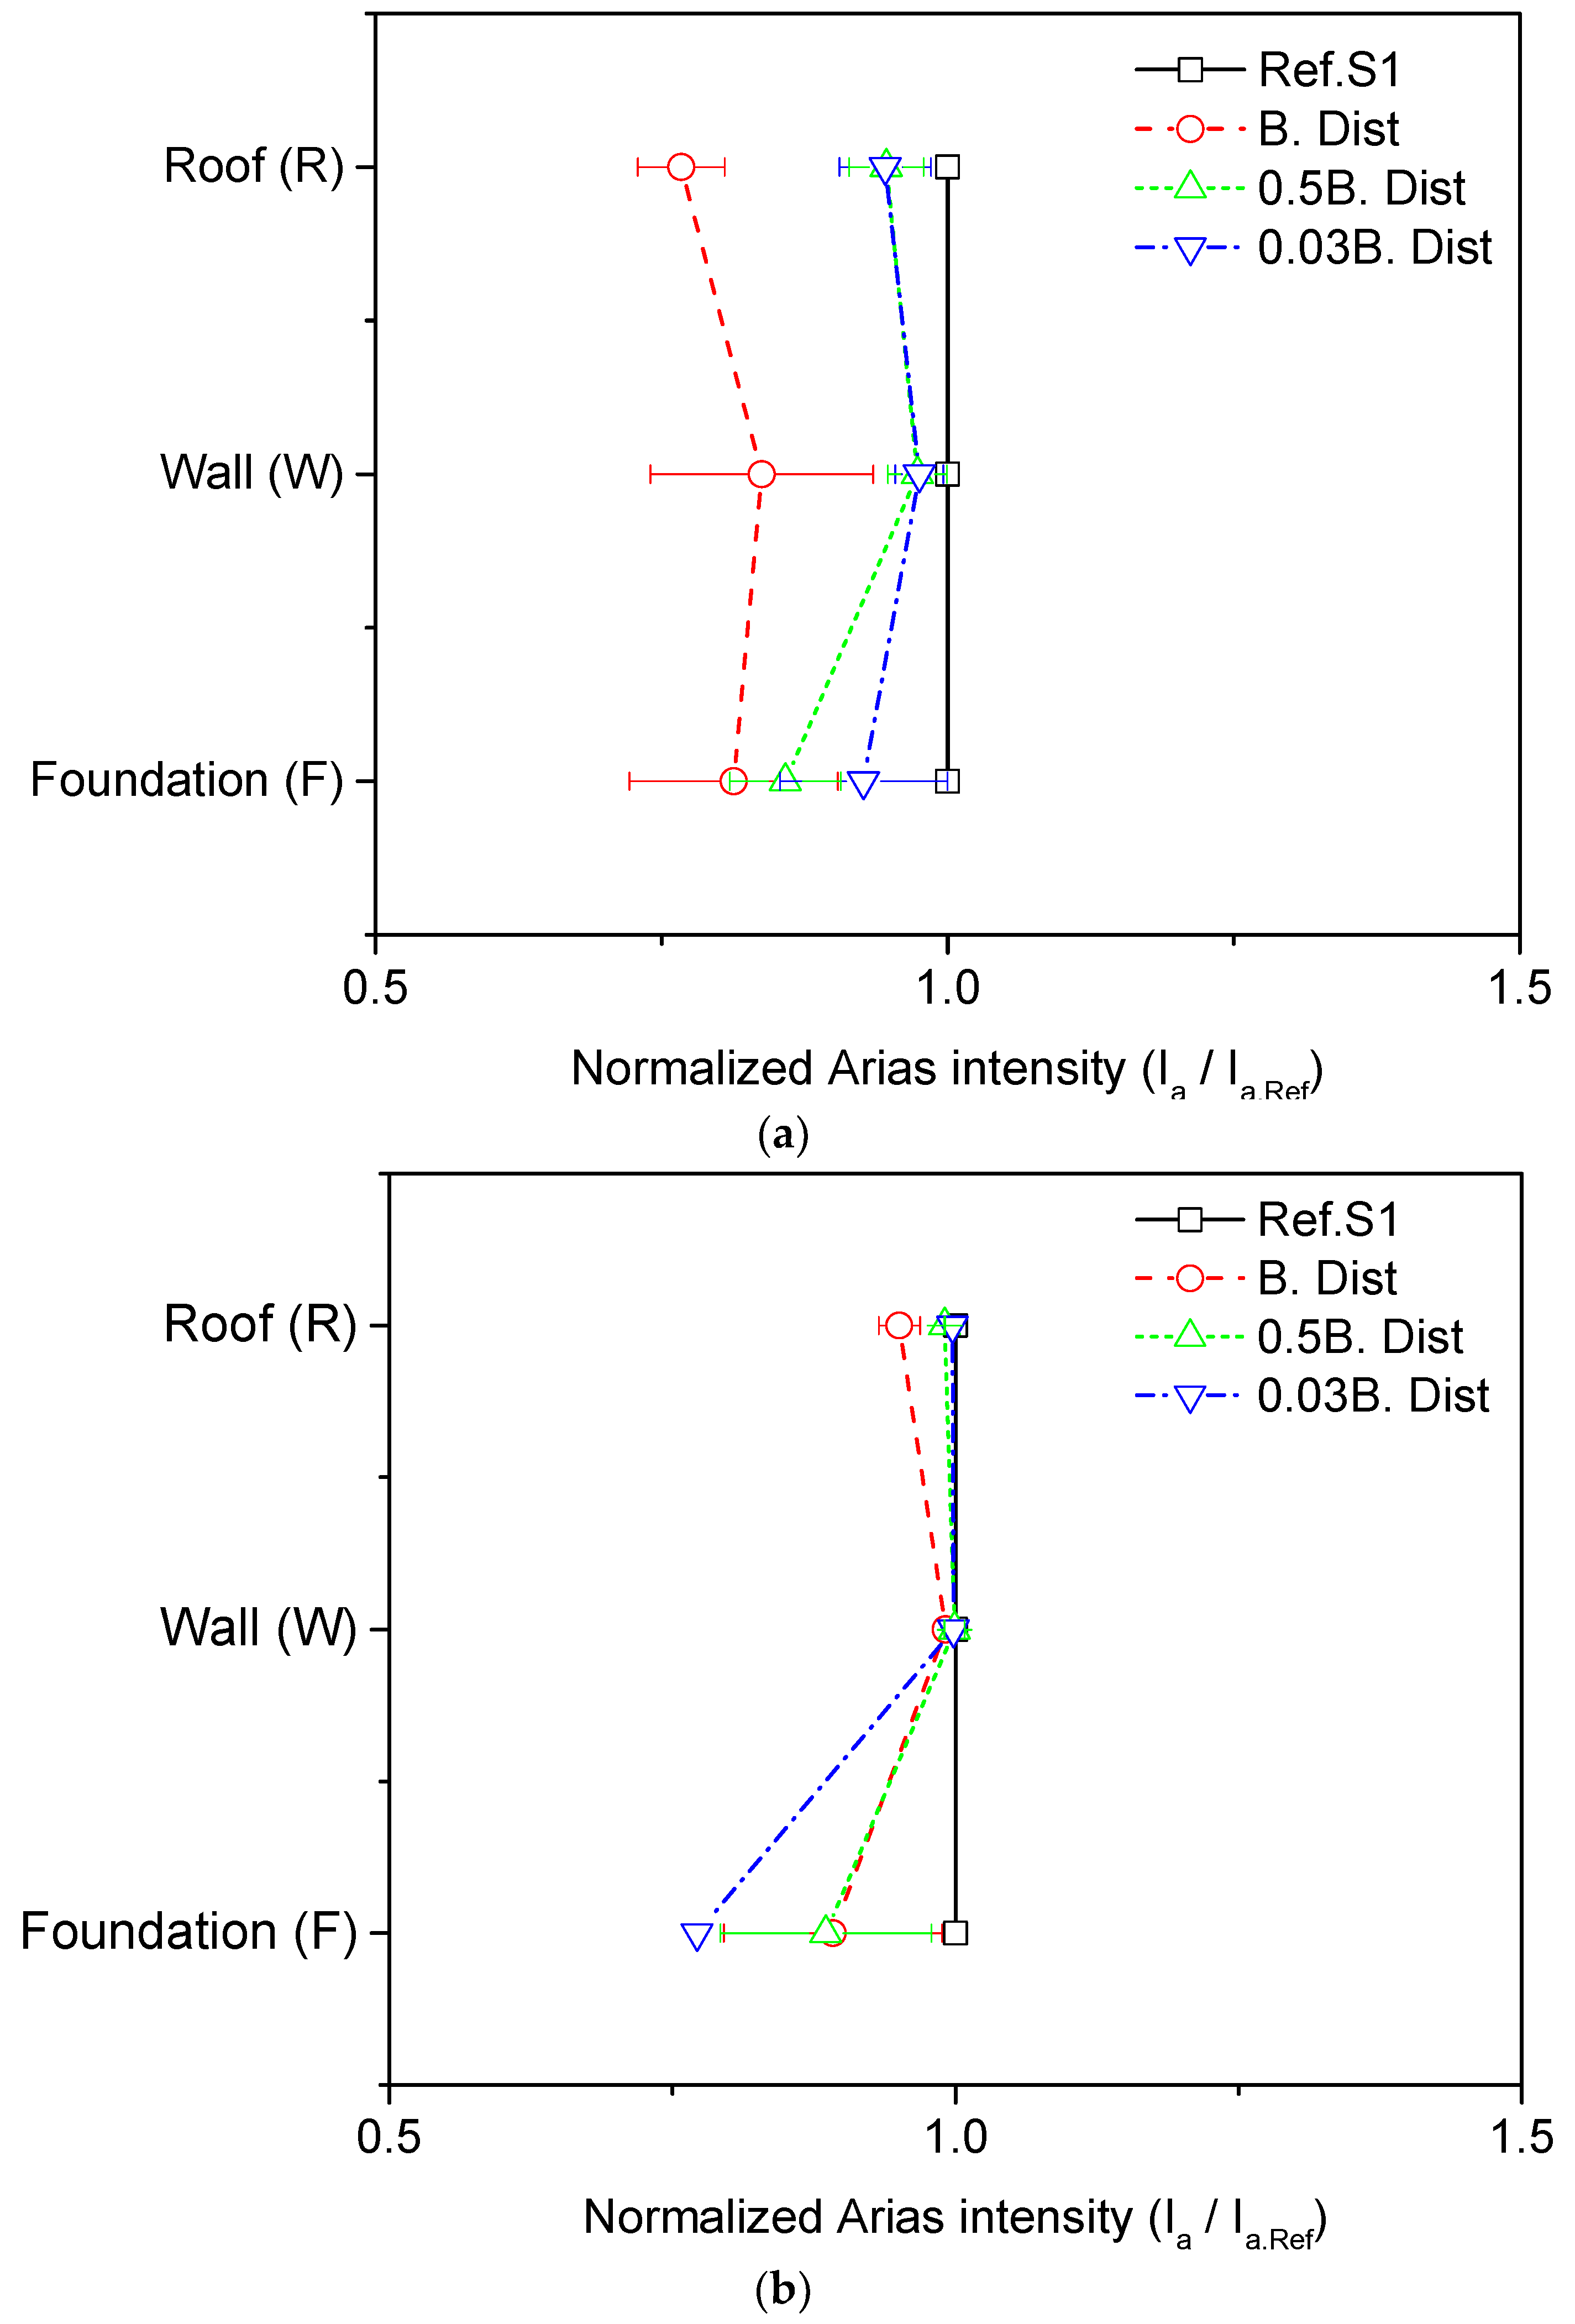
3.2.2. SSSI Effects on Responses of S1 in the Time Domain

There are several parameters to evaluate structural response in the time-domain. Although peak acceleration (PA) is considered as a simplified parameter to indicate earthquake intensity, arias intensity (Ia) is reconized as more vigorous because it shows total energy of excitation with all recorded data points in the time domain [31,46]. Arias intensity can be calculated based on the acceleration-time history (at), time period (dt), and acceleration of gravity (g) using following equation:
I a = π 2 g 0 a t 2   d t
Figure 8 illustrates normalized Ia in SSSI testing cases to the reference case (i.e., Ia/Ia.Ref) in M_Input level for S1-S2 and S1-S3. the average results, measured by two input motions, were plotted with error bars reflecting variations of two input motions. As shown in Figure 8, a reduction in total response of S1 structure was observed, not only at the foundation, but also at both wall and roof motions, due to appearance of S2 or S3 structure. The most substantial decrement in S1 structure response was experienced in the test of B distance between the two structures, which had normalized arias intensity (Ia/Ia.Ref) of roof motion of approximately 0.78 and 0.89 for tests with S1-S2, and S1-S3 structures, respectively. When the distance between the two structures decreased, less reduction in Ia of S1 structure was observed compared to the case of B distance. Furthermore, there was less reduction in Ia of S1 structure in cases adjacent to S3 structure (Figure 8b) compared to that in cases of adjacent to S2 structure (Figure 8a). This illustrates the same result when considering SSSI effects on PSD of S1 structure discussed earlier. Similar trends for normalized Ia of S1 structure were also observed at all input excitations tested.

4. Discussion

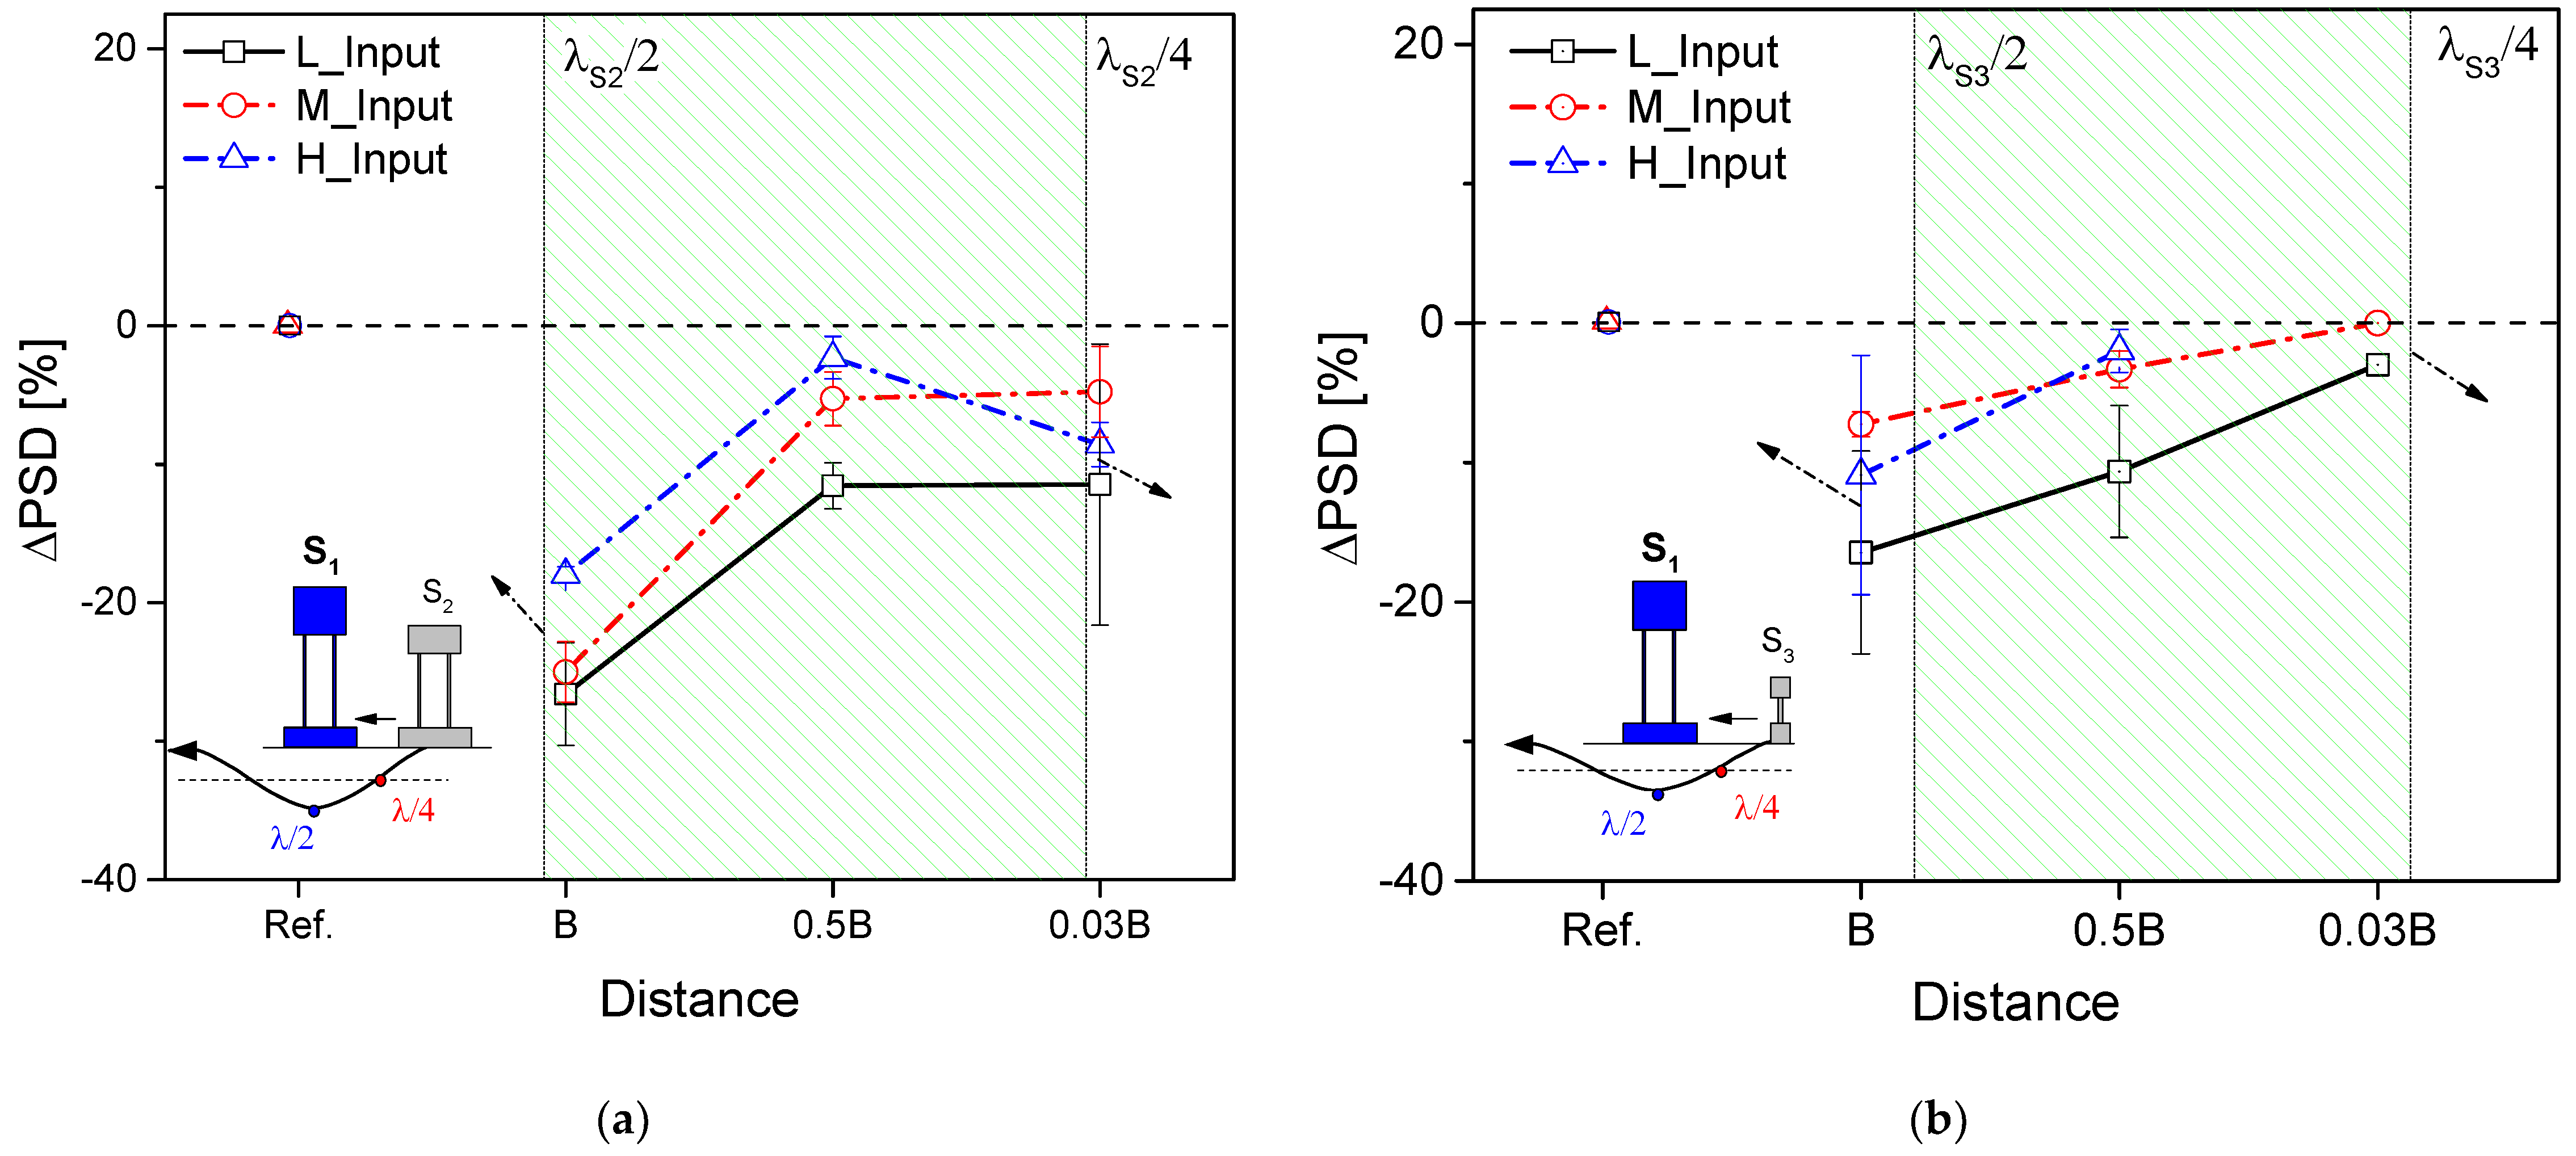
4.1. Effects of Distance Between Structures

Figure 9a,b show averaged trends of ΔPSD for S1 structure installed with S2 structure, and S3 structure at various distances, respectively. Average trends of ΔPSD for S2, and S3 structures with S1 are plotted in Figure 9c,d, respectively. Error bars show a variation in results of the two input motions that indicates the similar trends, were observed for two input motions. The dashed line at zero ΔPSD implies unchanged total power spectral density of structure due to SSSI effects. A negative value of ΔPSD indicates that SSSI phenomena decrease the structure response. The “unfavorable distance,” ranging from λ/4 to λ/2 proposed by Padrón et al. [34], was also marked in Figure 8, where λ was soil wavelength induced by adjacent structure vibration during an earthquake. For example, when considering SSSI effects on S1 structure with S2 structure (Figure 9a), λS2 was plotted. The λ value (=vs. FF׍) is related to the free-field shear wave velocity (Vs·FF) and the fundamental period of soil-foundation-structure systems (Ť), which can be defined from fflex in Figure 6. Furthermore, Trombetta et al. [33] have reported that versus FF is approximately 0.4 times of shear wave velocity measured at ground surface by in-flight bender elements array because shear modulus of soil will decrease with increasing shear strain. Note that the center-to-center distance between foundations defined in Table 3 was taken into comparison with the “unfavorable distance” range [34].
As shown in Figure 9, SSSI effects appeared at all tested distances between two structures regardless of input intensity. The response of S1 structure was reduced compared to reference motion because of interaction with S2 or S3 structures (Figure 9a,b respectively). The most significant reduction in response of S1 structure (i.e., the most considerable SSSI effect on S1 structure) was observed at B distance, which was approximately one-half of the wavelength (λ/2) or the lowest peak of the wave radiated from the adjacent structures (i.e., S2 or S3). When the distance decreased to λ/4 or to the middle point of the radiation wave amplitude expected to have the lowest influence of radiation wave, the ΔPSD value of S1 structure increased and approached zero value indicating SSSI effects on S1 structure decrease. In contrast to S1 structure behavior, SSSI effects increased the total power spectral density of S2 and S3 structures as illustrated in Figure 9c,d. Also, S2 and S3 structures experienced the lowest increment in response, at a distance of λS1/2, with interacting S1 structure, while ΔPSD of S2 and S3 structures surged when the distance between structures decreased. The reduction of S3 response at λ/4 distance in case of S1-S3 (Figure 9d) could be attributed to two reasons: (1) AN increase in soil stiffness below S3 structure, due to closeness to a much heavier structure (i.e., S1), and (2) SSSI effects diminished with increasing height ratio between structures [32]. However, observed results for S1 and S2 structures in the S1-S2 case at H_Input level, with both input motions (i.e., dash-dot blue lines in Figure 9a,c still followed the above trend, although the most significant structure response was obtained at a distance of 0.5B. Due to the reduction in fflex of these structures at H_Input level (Figure 6), compared to that at lower input intensities, adjacent structure vibrated with longer wavelength, causing peak response of S1 or S2 structure at a distance of 0.5B. Therefore, it is reasonable to expect that ΔPSD of structure will decrease from the highest value when the surrounded structure is located at a distance smaller than λ/4, or it will increase from the lowest value when neighboring building moves out of the range of λ/2 (arrow lines shown in Figure 9).

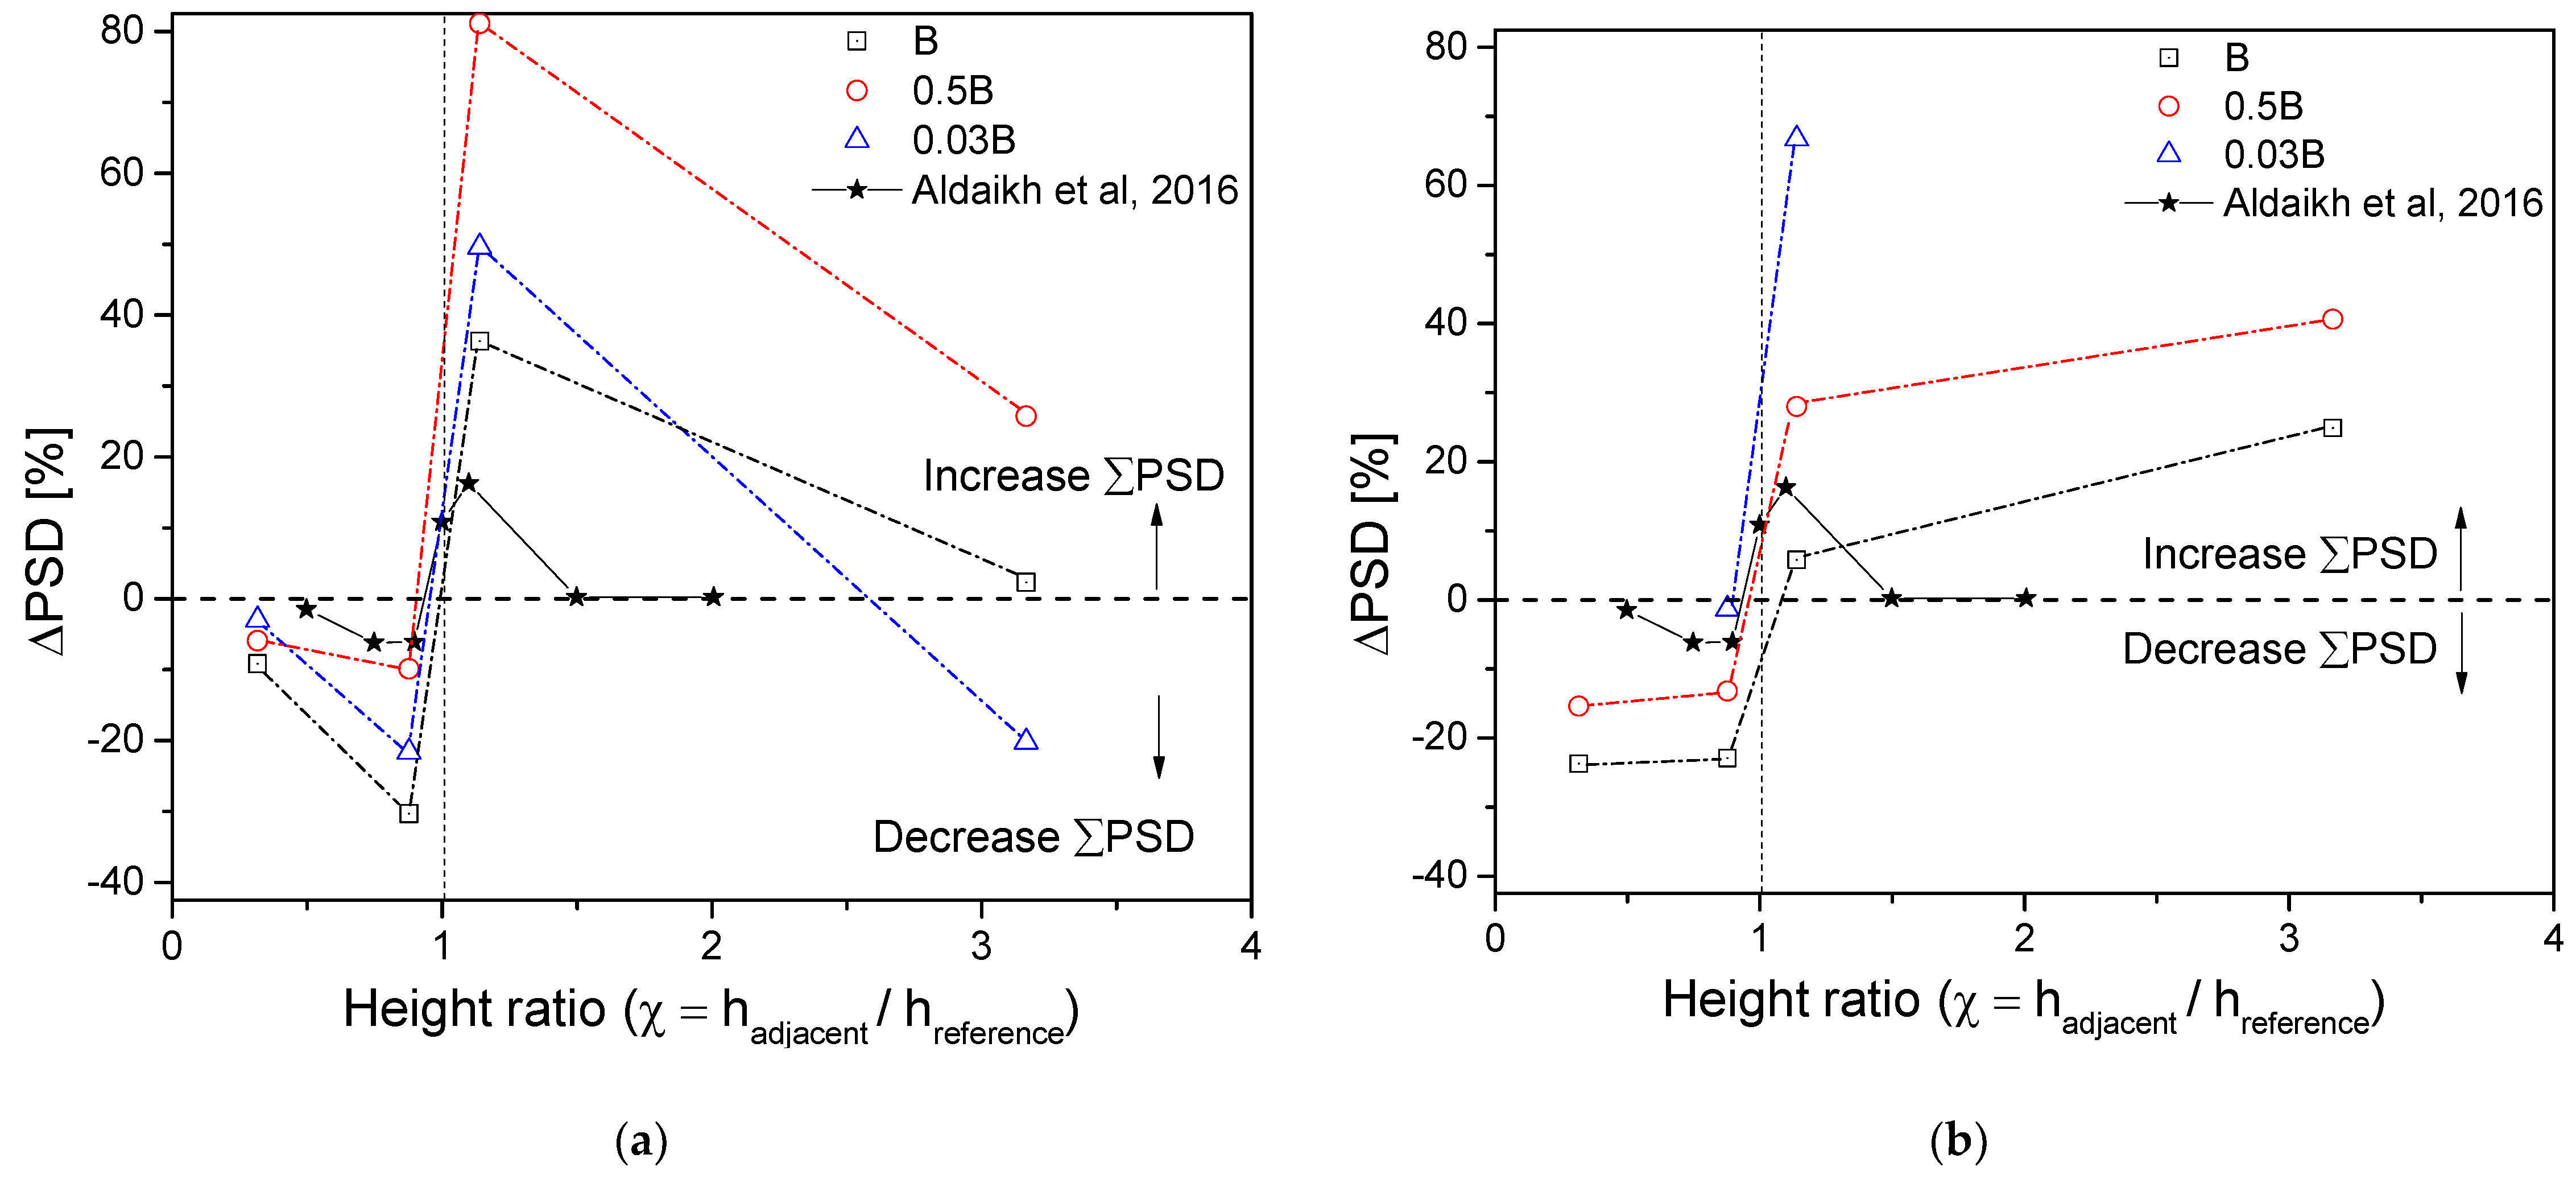
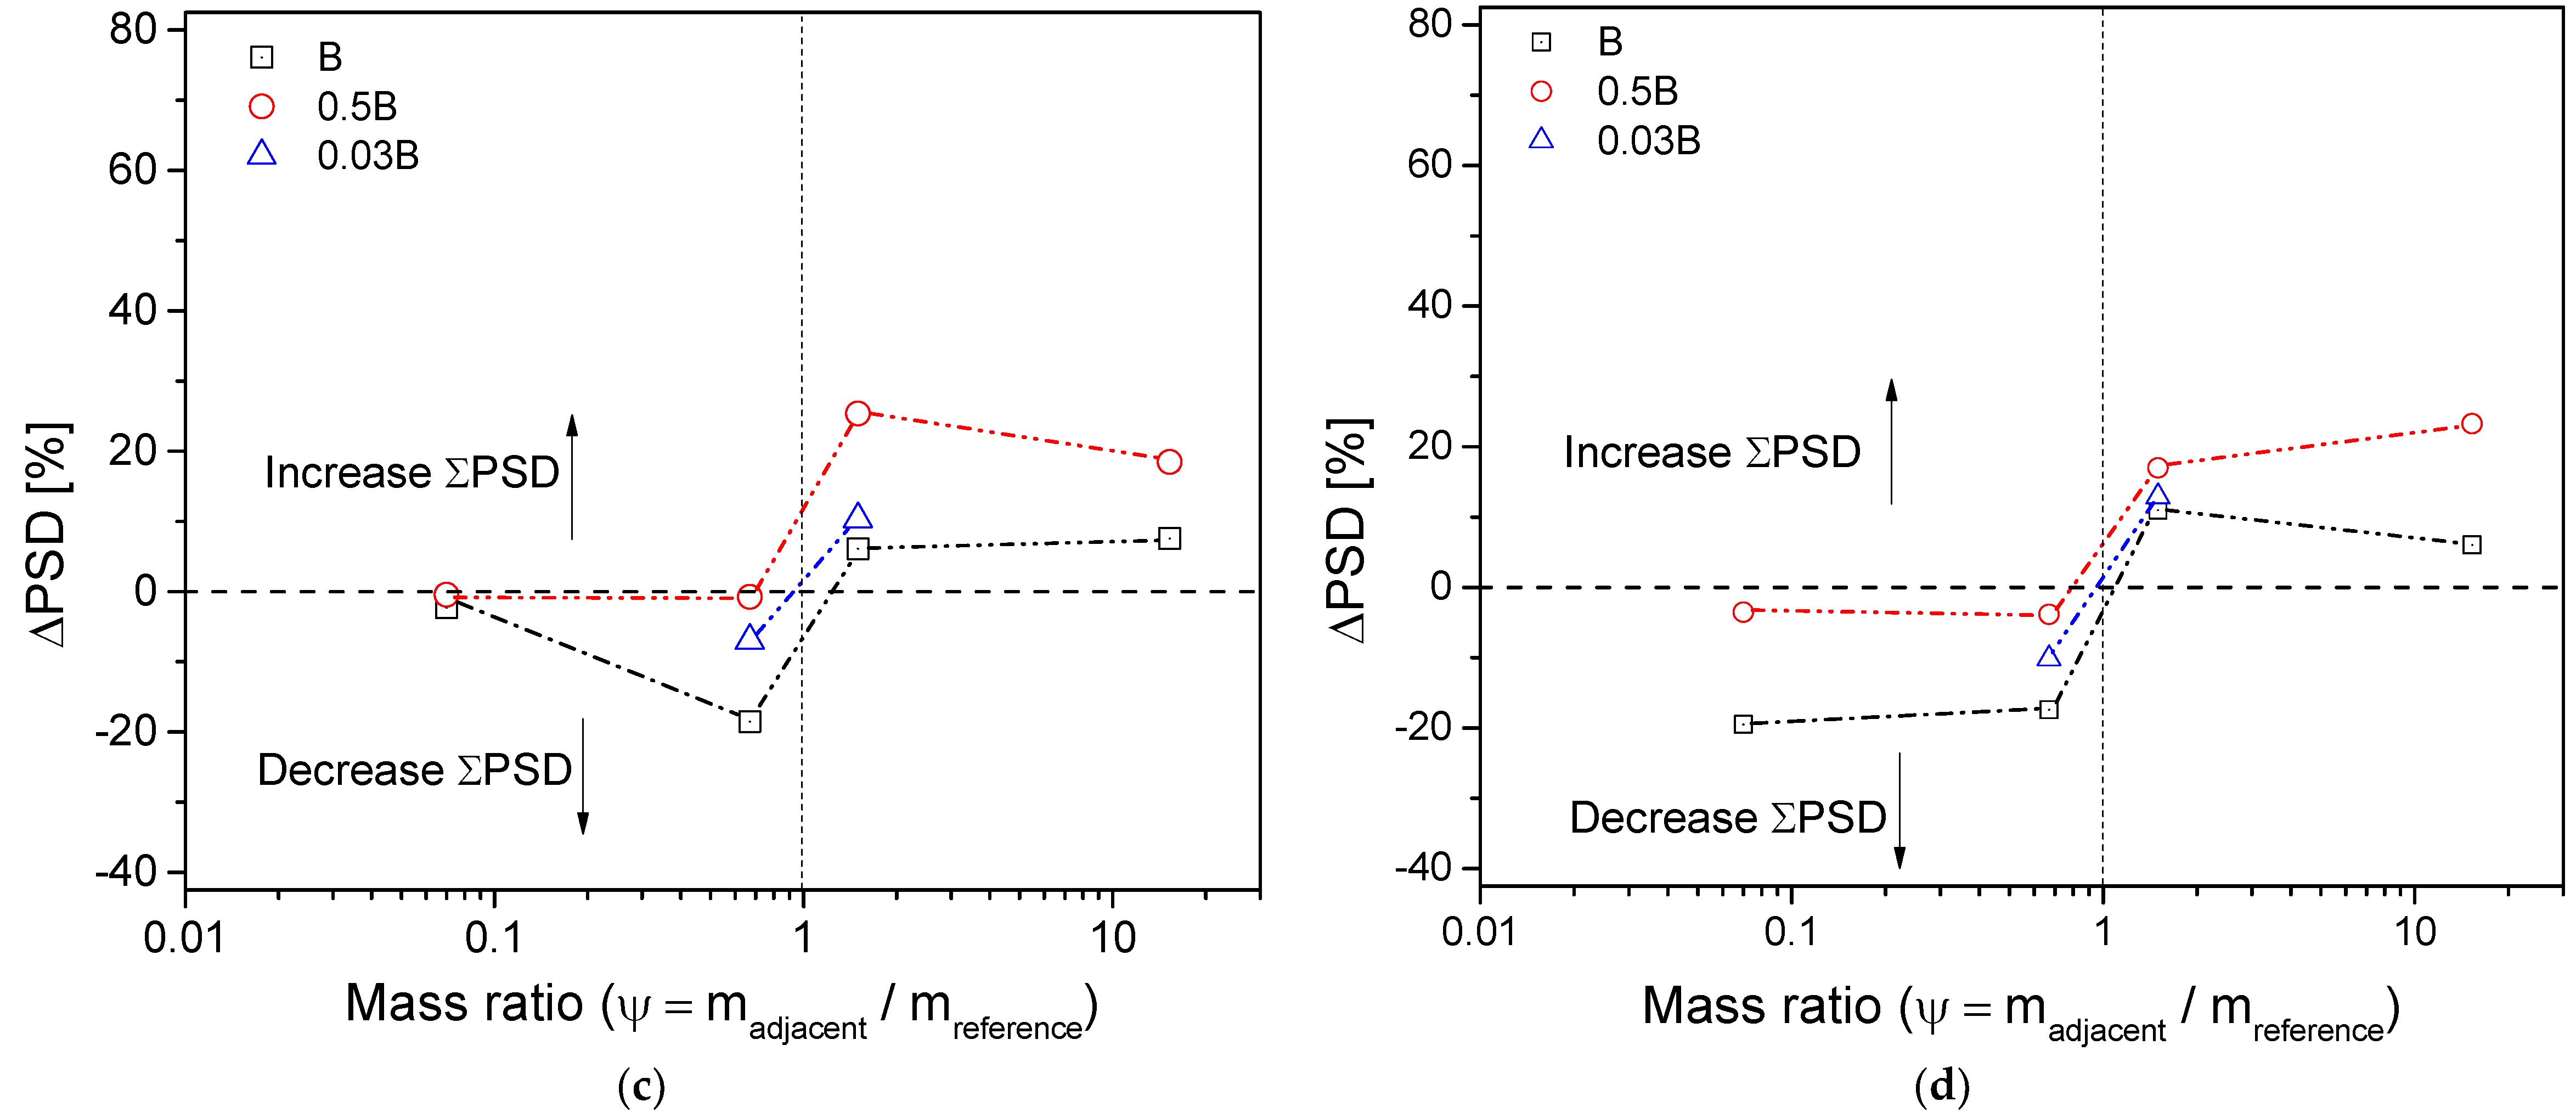
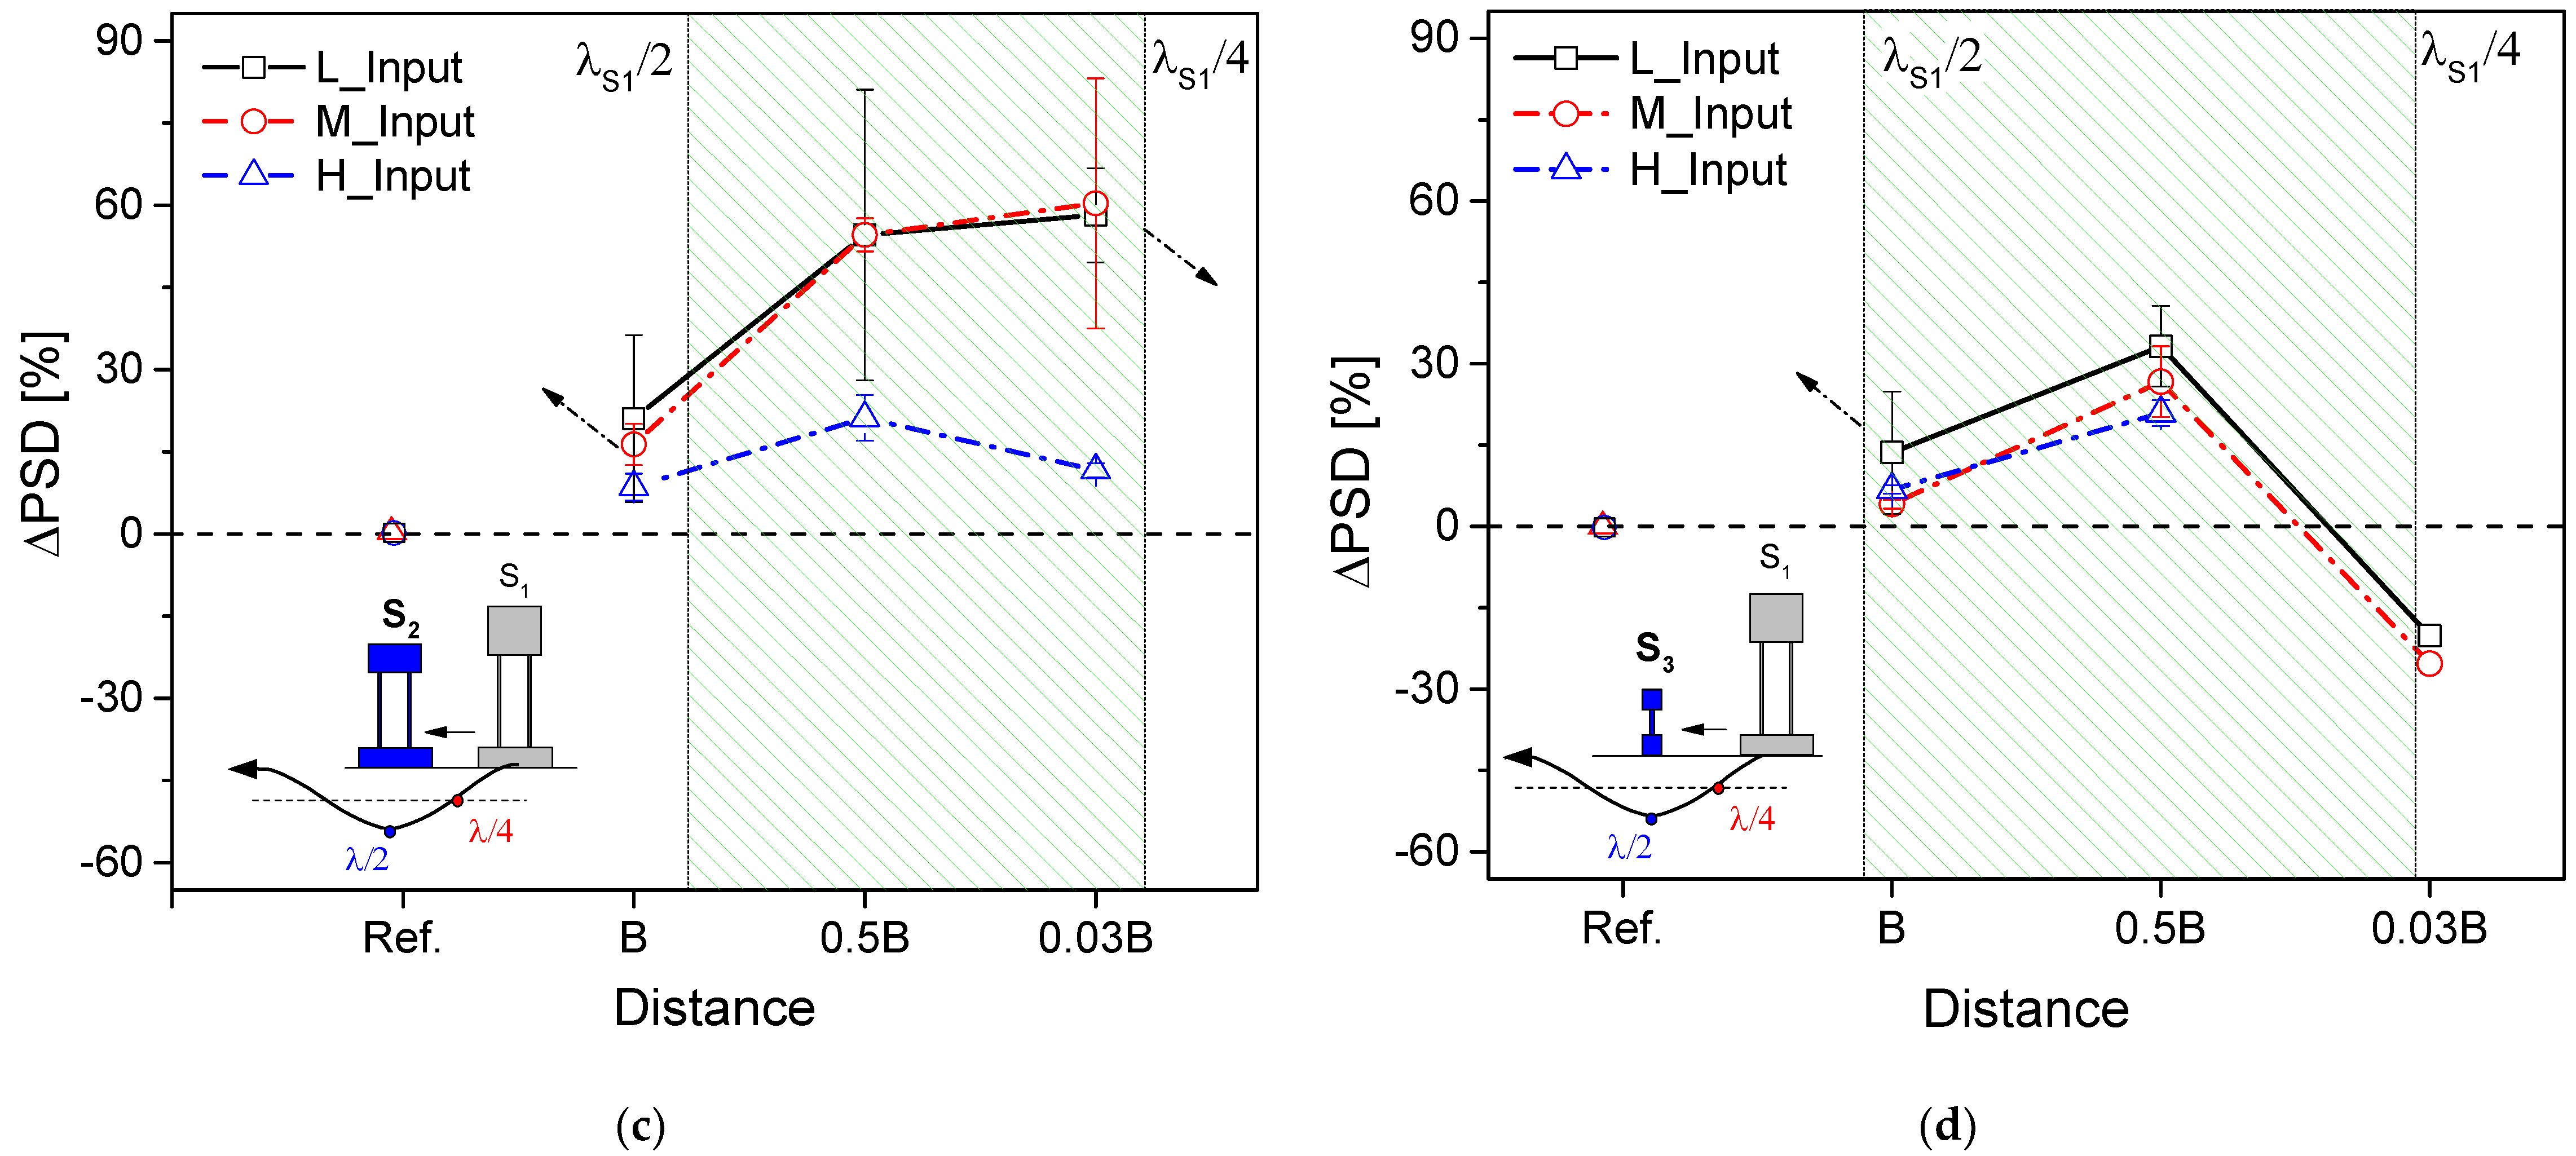
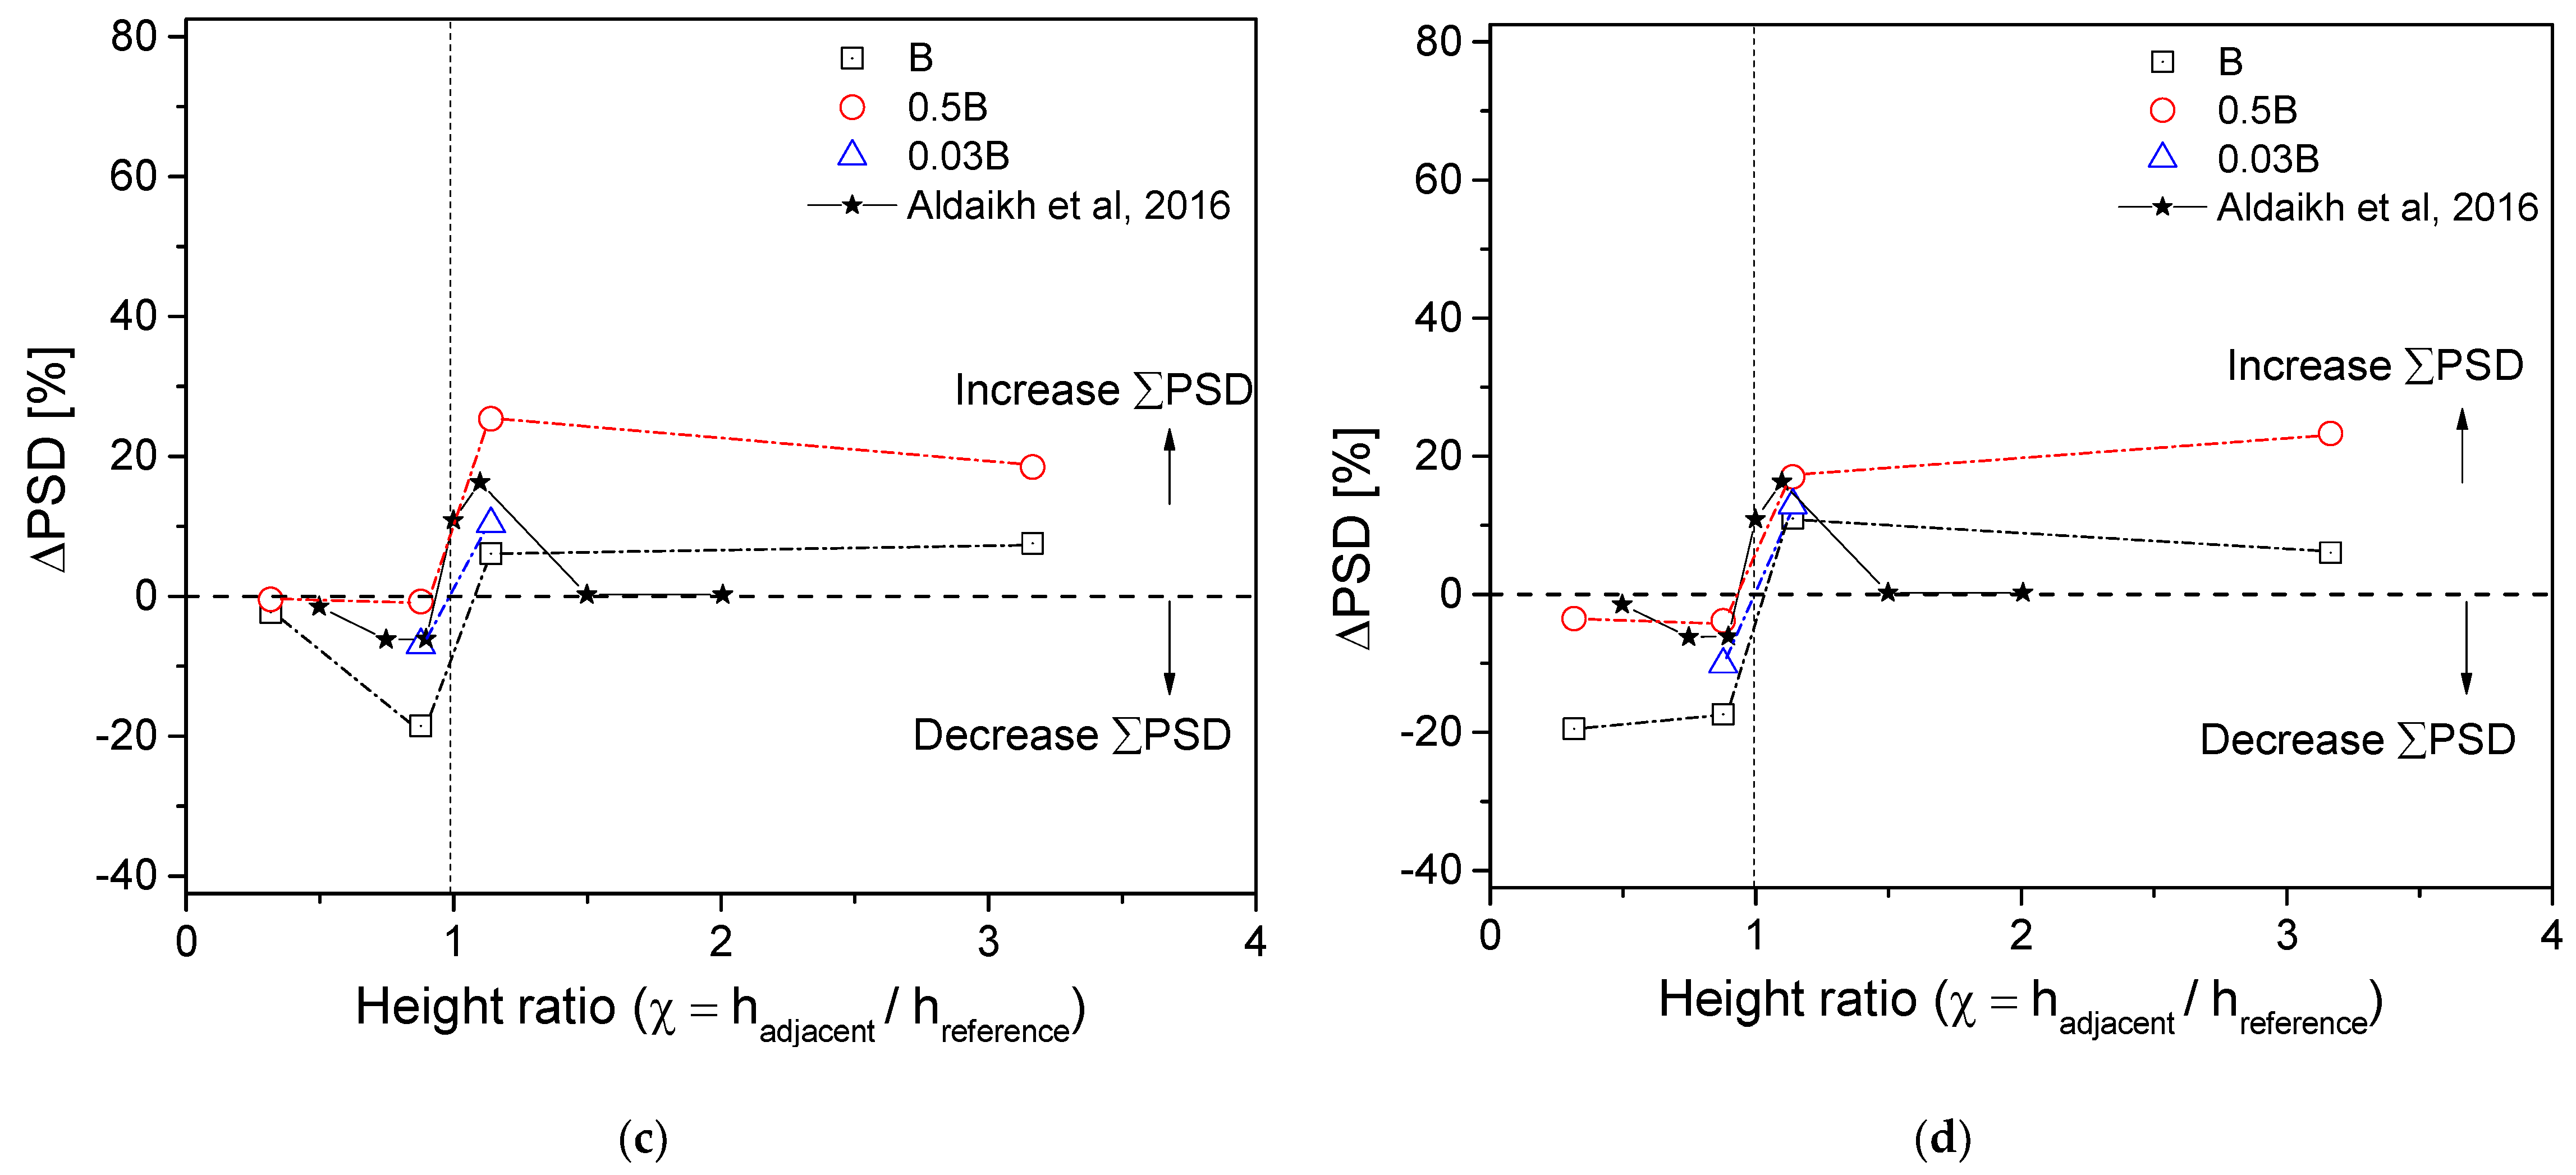
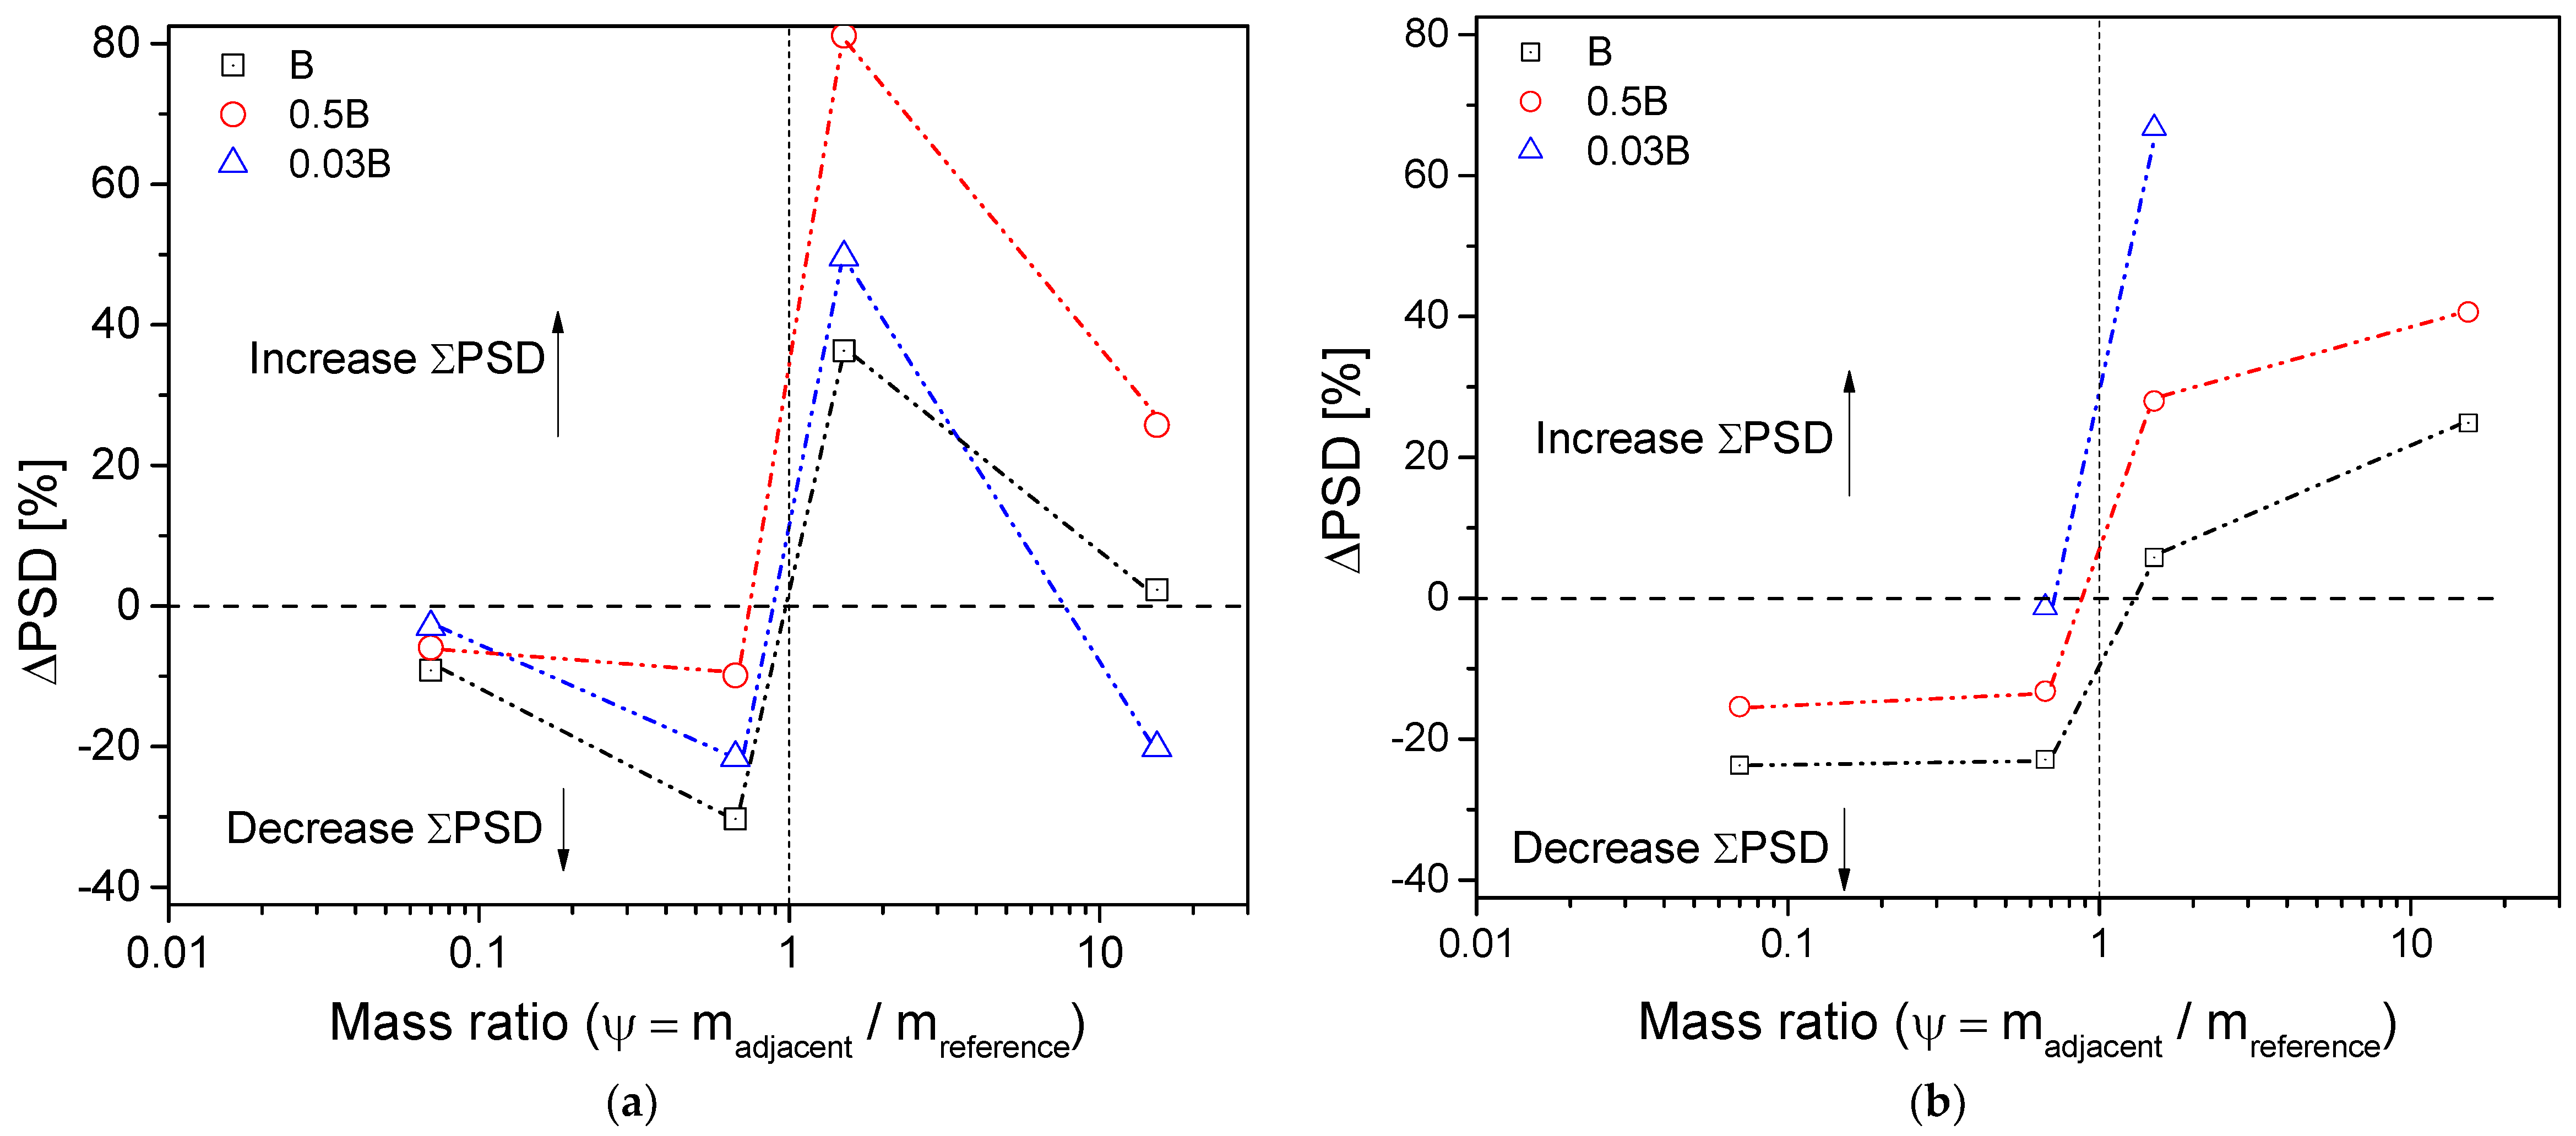
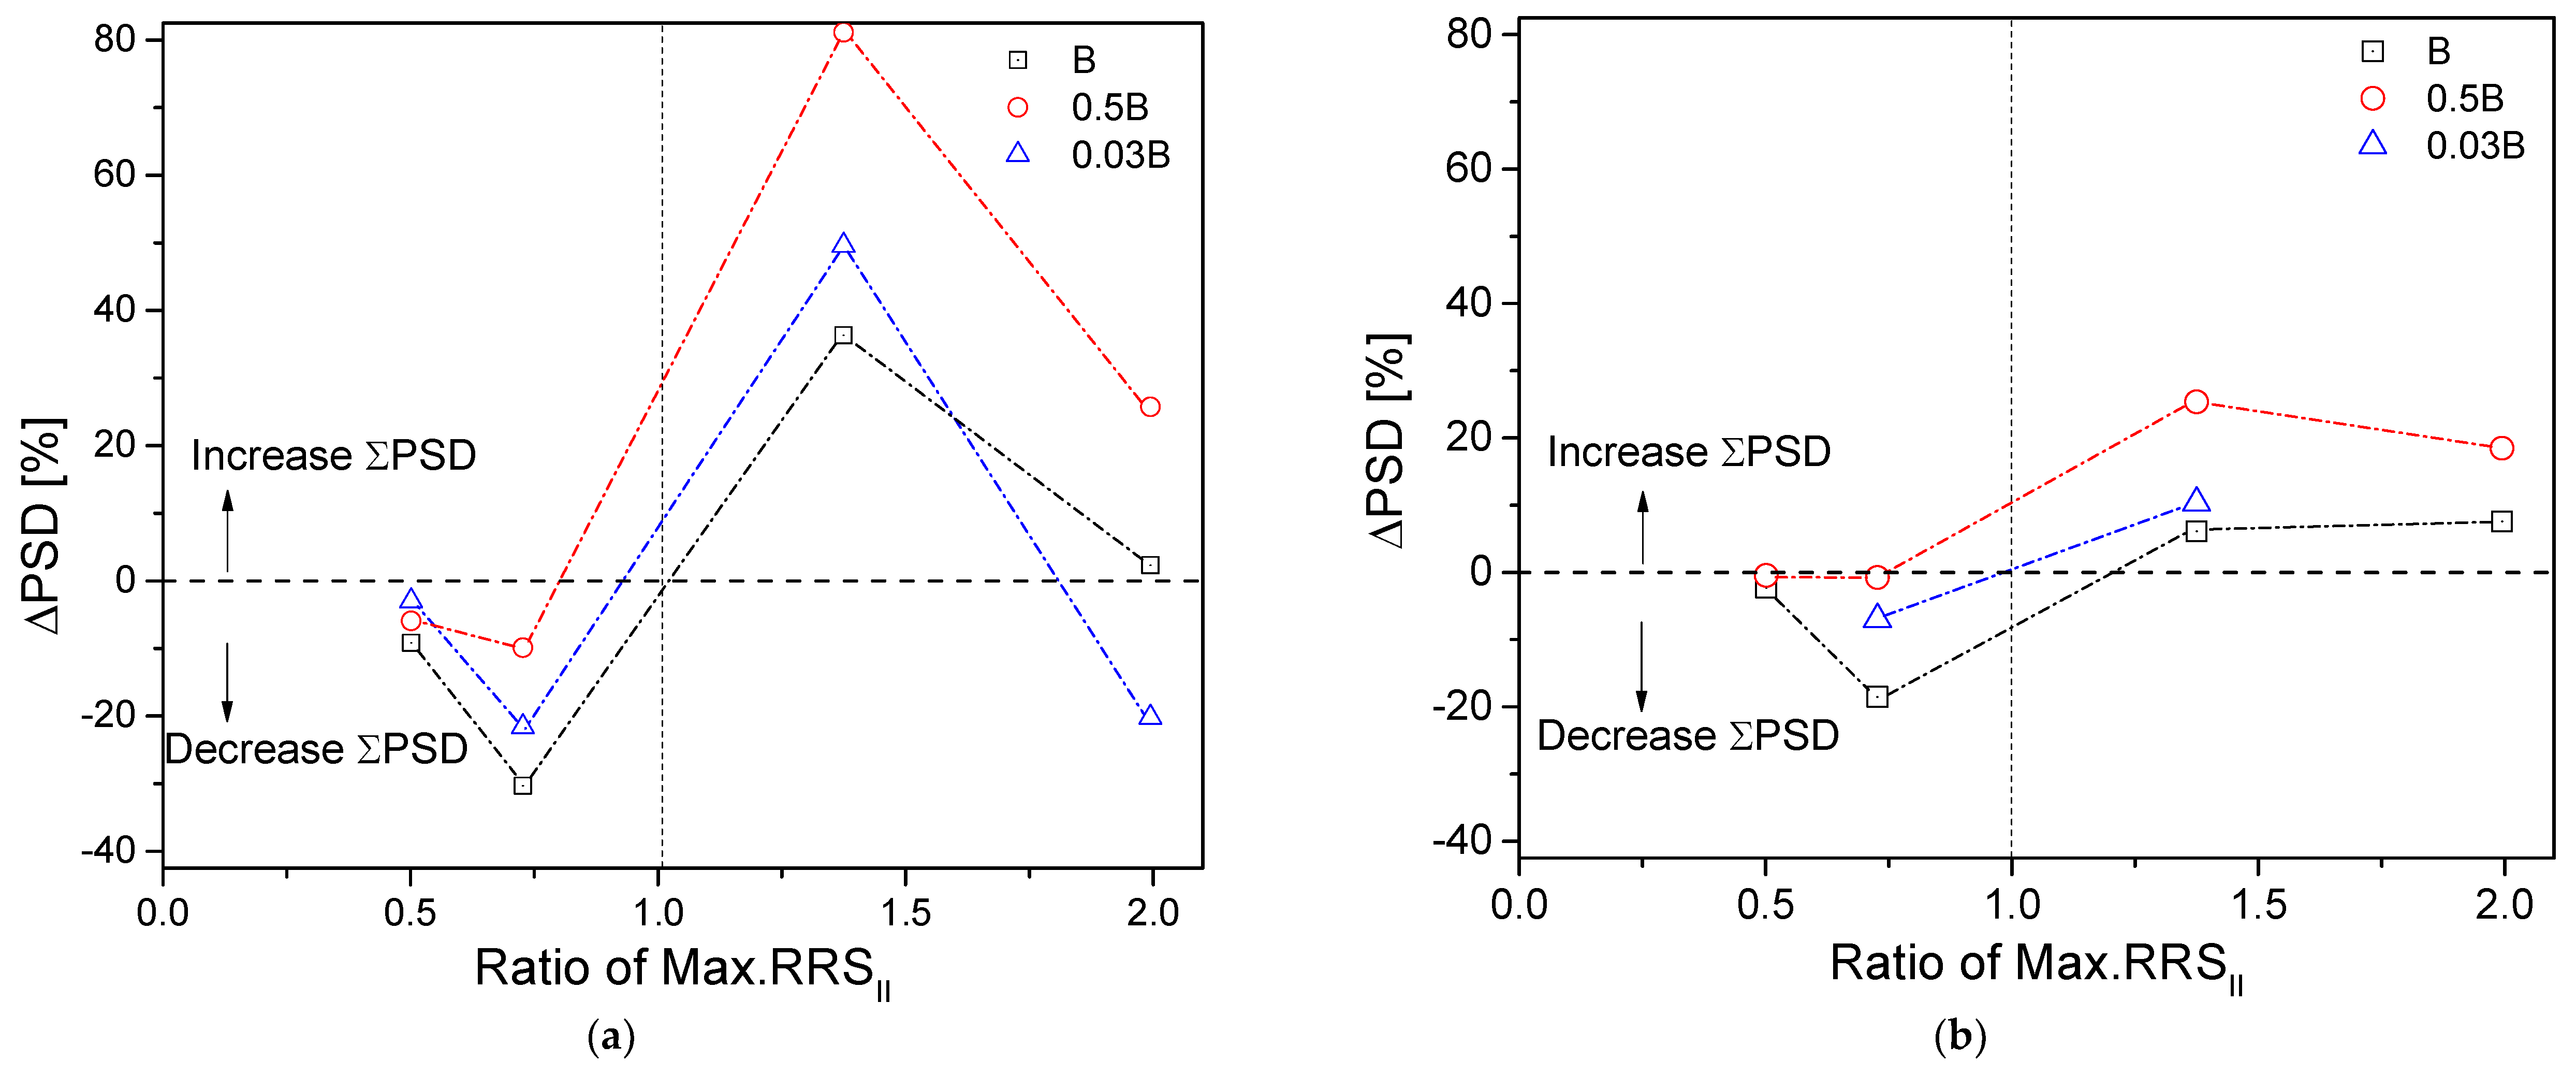
4.2. Effects of Height Ratio, Mass Ratio, and Inertial Interaction

Several previous researches have reported an increment in structure response because of the appearance of a neighboring structure which is taller and more massive or has a lower fixed-base frequency [16,17,18,30,31,32]. However, in the present study, the influence of fixed-base frequency on SSSI phenomena could be neglected because a reduction in response of S1 structure was observed when located near S2 or S3 building, although S2 building had a lower fixed-base frequency, while S3 structure had a higher fixed-base frequency compared to S1 structure (Table 1). Furthermore, an increment in S2 structure response was obtained when higher fixed-base frequency S1 structure was placed nearby regardless of the distance between two structures, type, or level of input motions.
Figure 10 illustrates the relationship between height ratio (χ) and ΔPSD at low and high input intensities of two input motions. The results of Aldaikh et al. [32] were also included for comparison indicating a similar observation: There was a decrease in response of higher structure (where χ was smaller than unity) and an increase in lower structure regardless of types or levels of input excitation. Transferred seismic vibration of higher structure might have increased the response of a shorter structure during an earthquake excitation and vice versa [30]. Moreover, maximum and minimum values of ΔPSD were found at height ratio of 0.88, and 1.14, respectively. Less significant change in ΣPSD was observed at lower height ratio (i.e., χ = 0.31) or at greater height ratio (i.e., χ = 3.16), with “S” shaped trend of relationship between height ratio and ΔPSD similar to results of Aldaikh et al. [32]. An approximate unity of height ratio could be considered as a threshold value to separate, whether SSSI effect increased or reduced structure motion during an excitation based on experimental results of this study.
However, the increment and the decrement in estimated ∆PSD in this study were excessive compared to previous research, especially at L_Input excitation, as shown in Figure 10a,b. Estimated ∆PSD values were around 80% and minus 30% at χ = 1.14, and χ = 0.88, respectively. These values are much higher, and lower than those suggested by Aldaikh et al. [32], respectively. Note that in their study, mass ratio between structures was approximately unity, and the maximum acceleration level of input motions was around 0.1 g, which was approximately the same as the L_Input excitation used in the present study. Therefore, such over-estimation of SSSI effects could be attributed to significant difference in mass between structures.
Figure 11 shows the relation of ΔPSD and mass ratio (ψ) with the same input motions (i.e., artificial and Hachinohe earthquakes) and input intensities (i.e., L_Input and H_Input) used in Figure 10 for comparison. A reduction in total power spectral density of more massive structure and an increment in that of the lighter structure in SSSI phenomena were observed, consistent with previous studies [17,30]. Trends influenced by the mass ratio on the variation of ΔPSD are similar to those of the height ratio shown in Figure 10, indicating that height and mass ratio had the same effect of on ΔPSD. In addition, a higher and more massive structure exhibited higher inertial interaction in SFSI as indicated by Max.RRSII value (solid circle points) in Figure 5. Therefore, relative Max.RRSII values between structures, which implicitly contain both mass and height ratios could be a key factor in controlling SSSI phenomena. Consequently, a variation of ΔPSD with ratio of Max.RRSII (i.e., ratio of Max.RRSII of adjacent structure to that of reference structure, with Max.RRSII values at L_Input intensity, was taken for each structure to reduce the non-linear behavior of soil) was plotted in Figure 12. There was a reduction in response of structure with higher inertial interaction or greater Max.RRSII value and an increment in response of structure with lower inertial interaction, in agreement with previous observations [16,17,18,30,31,32]. In SSSI phenomena between the two structures, the vibration of a larger structure with a higher response or greater Max.RRSII value can transfer and increase the response of smaller structure nearby by rocking interaction stiffness between structures through the soil [16,47]. The effects of input level on SSSI could be explained. SSSI effects are more significant at low input intensity (i.e., in Figure 12a,b) because the inertial interaction is more remarkable as shown in Figure 4b. When input intensity increases, the inertial interaction of soil-foundation-structure systems will decrease, thus resulting in less variation of ΔPSD.

5. Conclusions

The problem of SSSI with two structures was investigated by a series of geotechnical centrifuge experiments. Dense sand ground was prepared with several instruments. Three structures were made of aluminum with different mass, height, and fixed-base frequency. Different configurations of two structures located on the ground surface were tested under two earthquake input motions at various input intensities. Major observations are as follows:
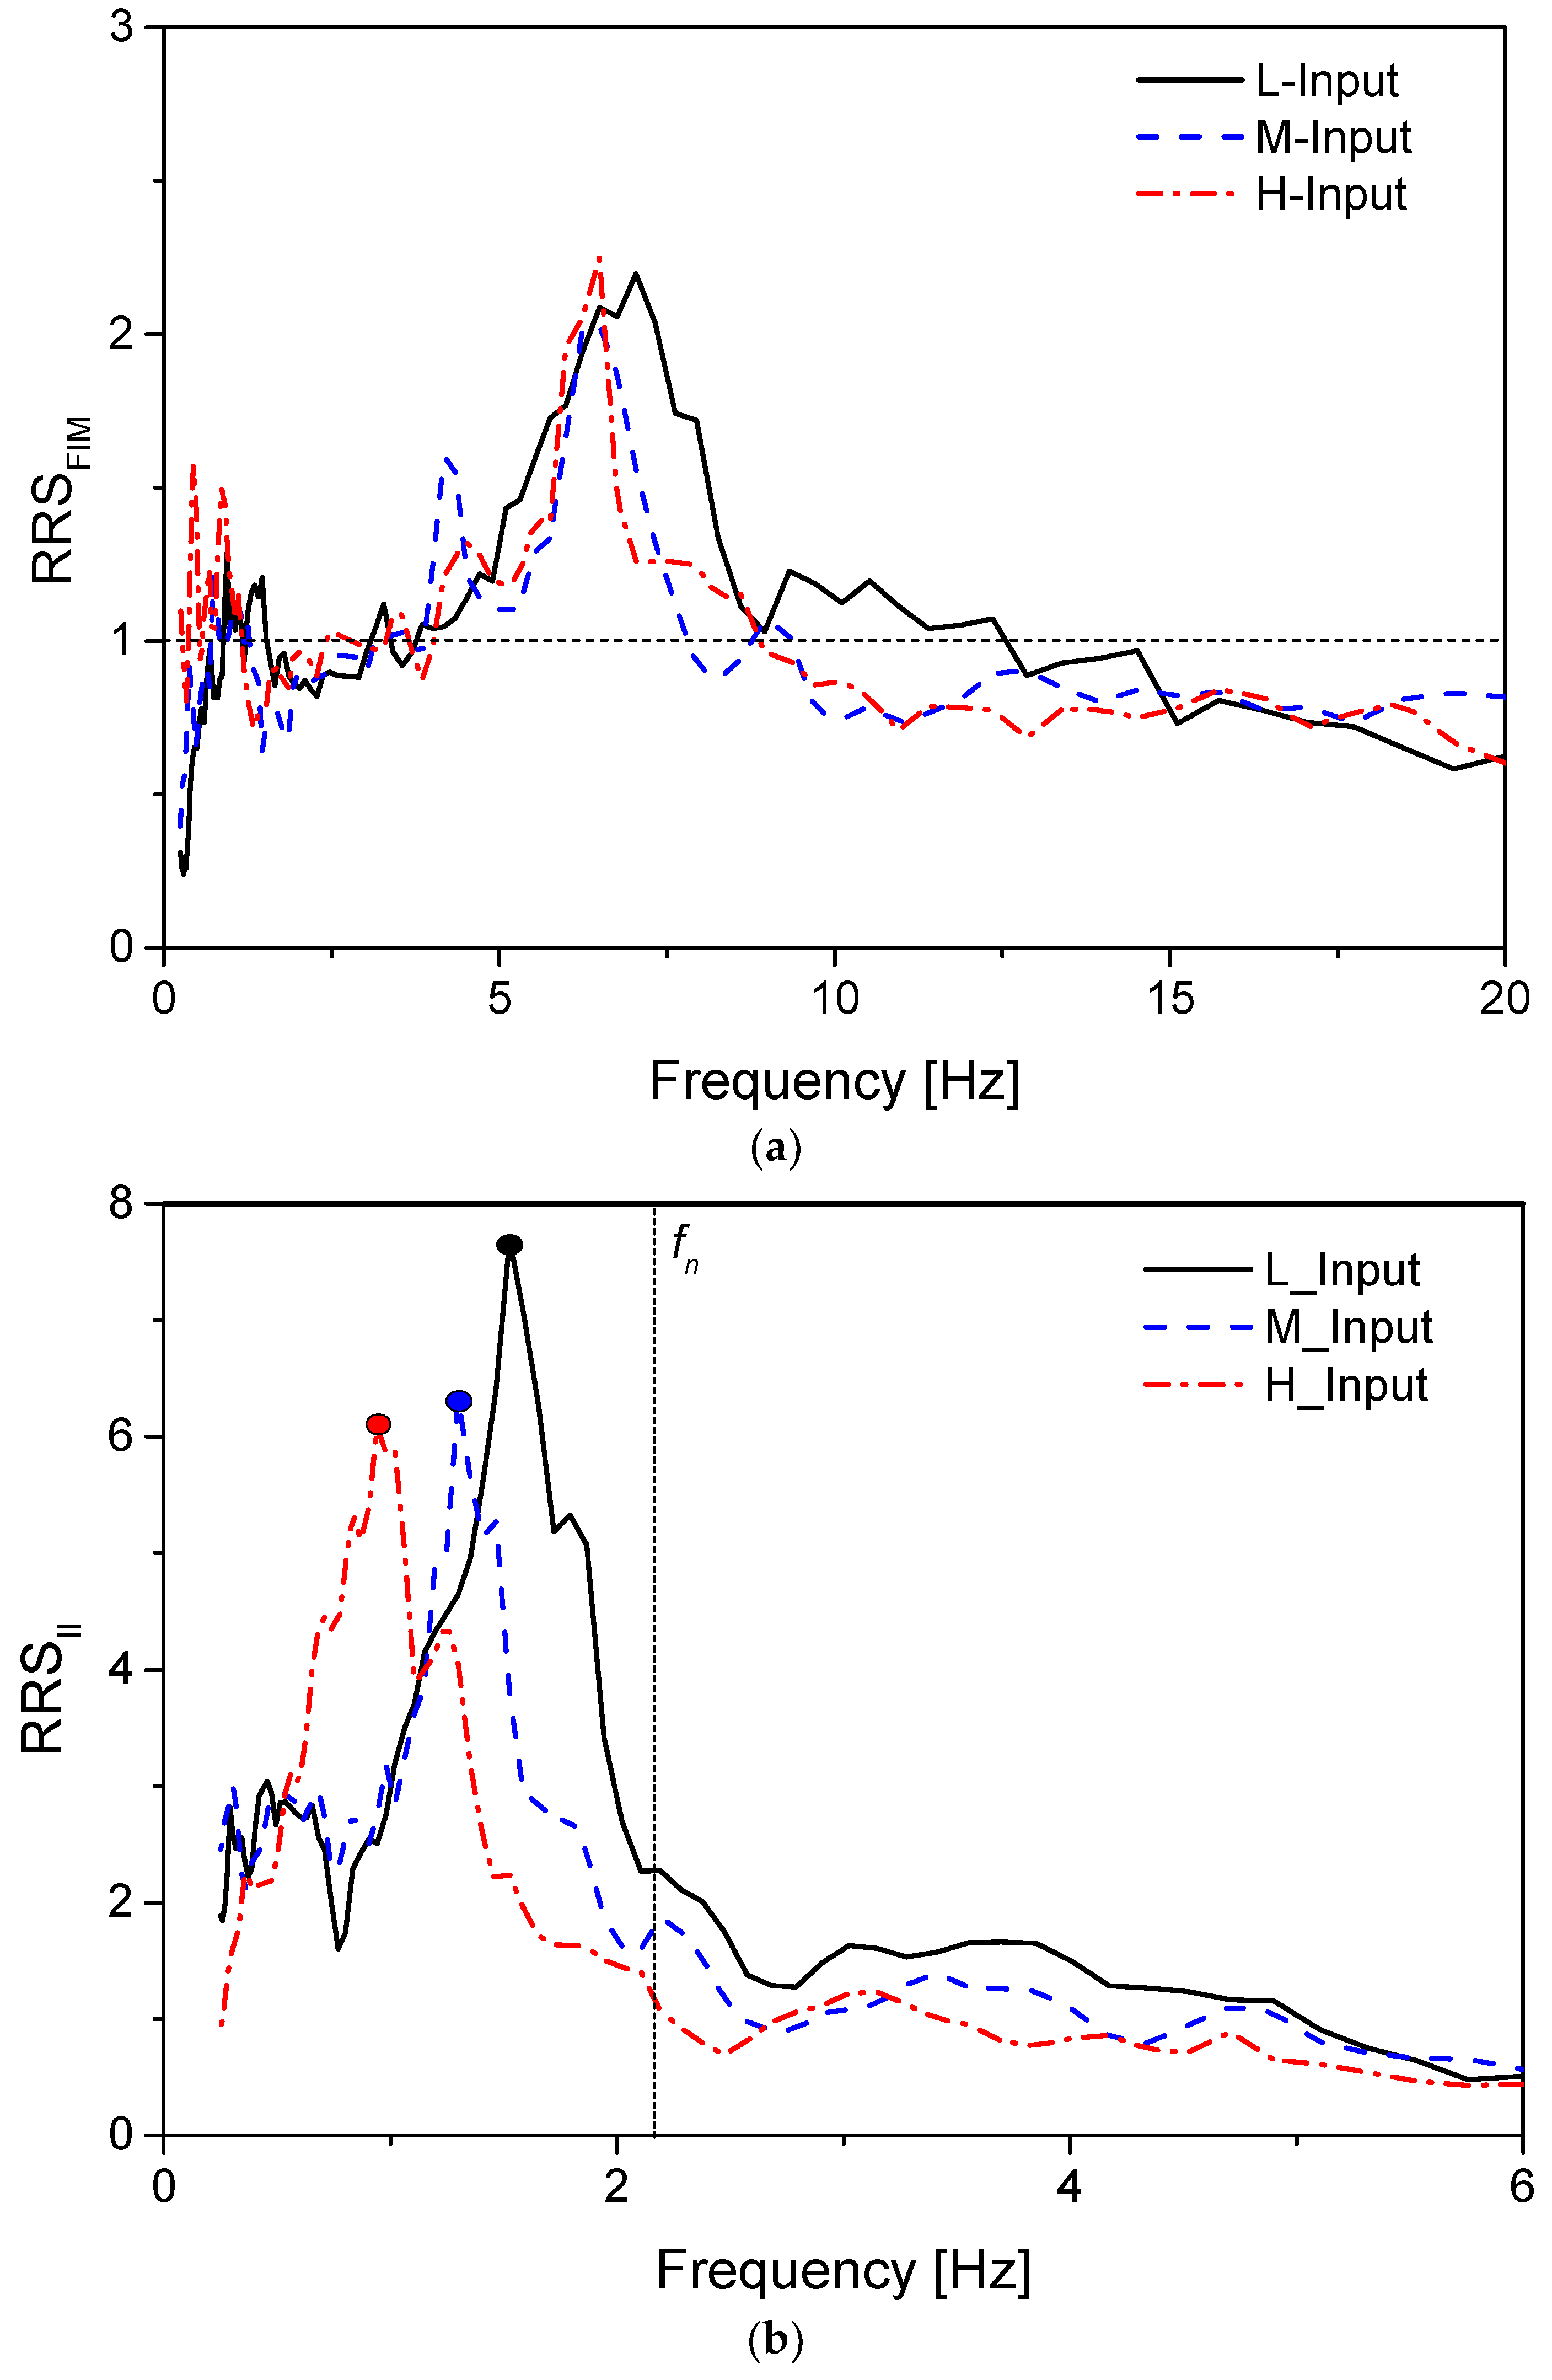
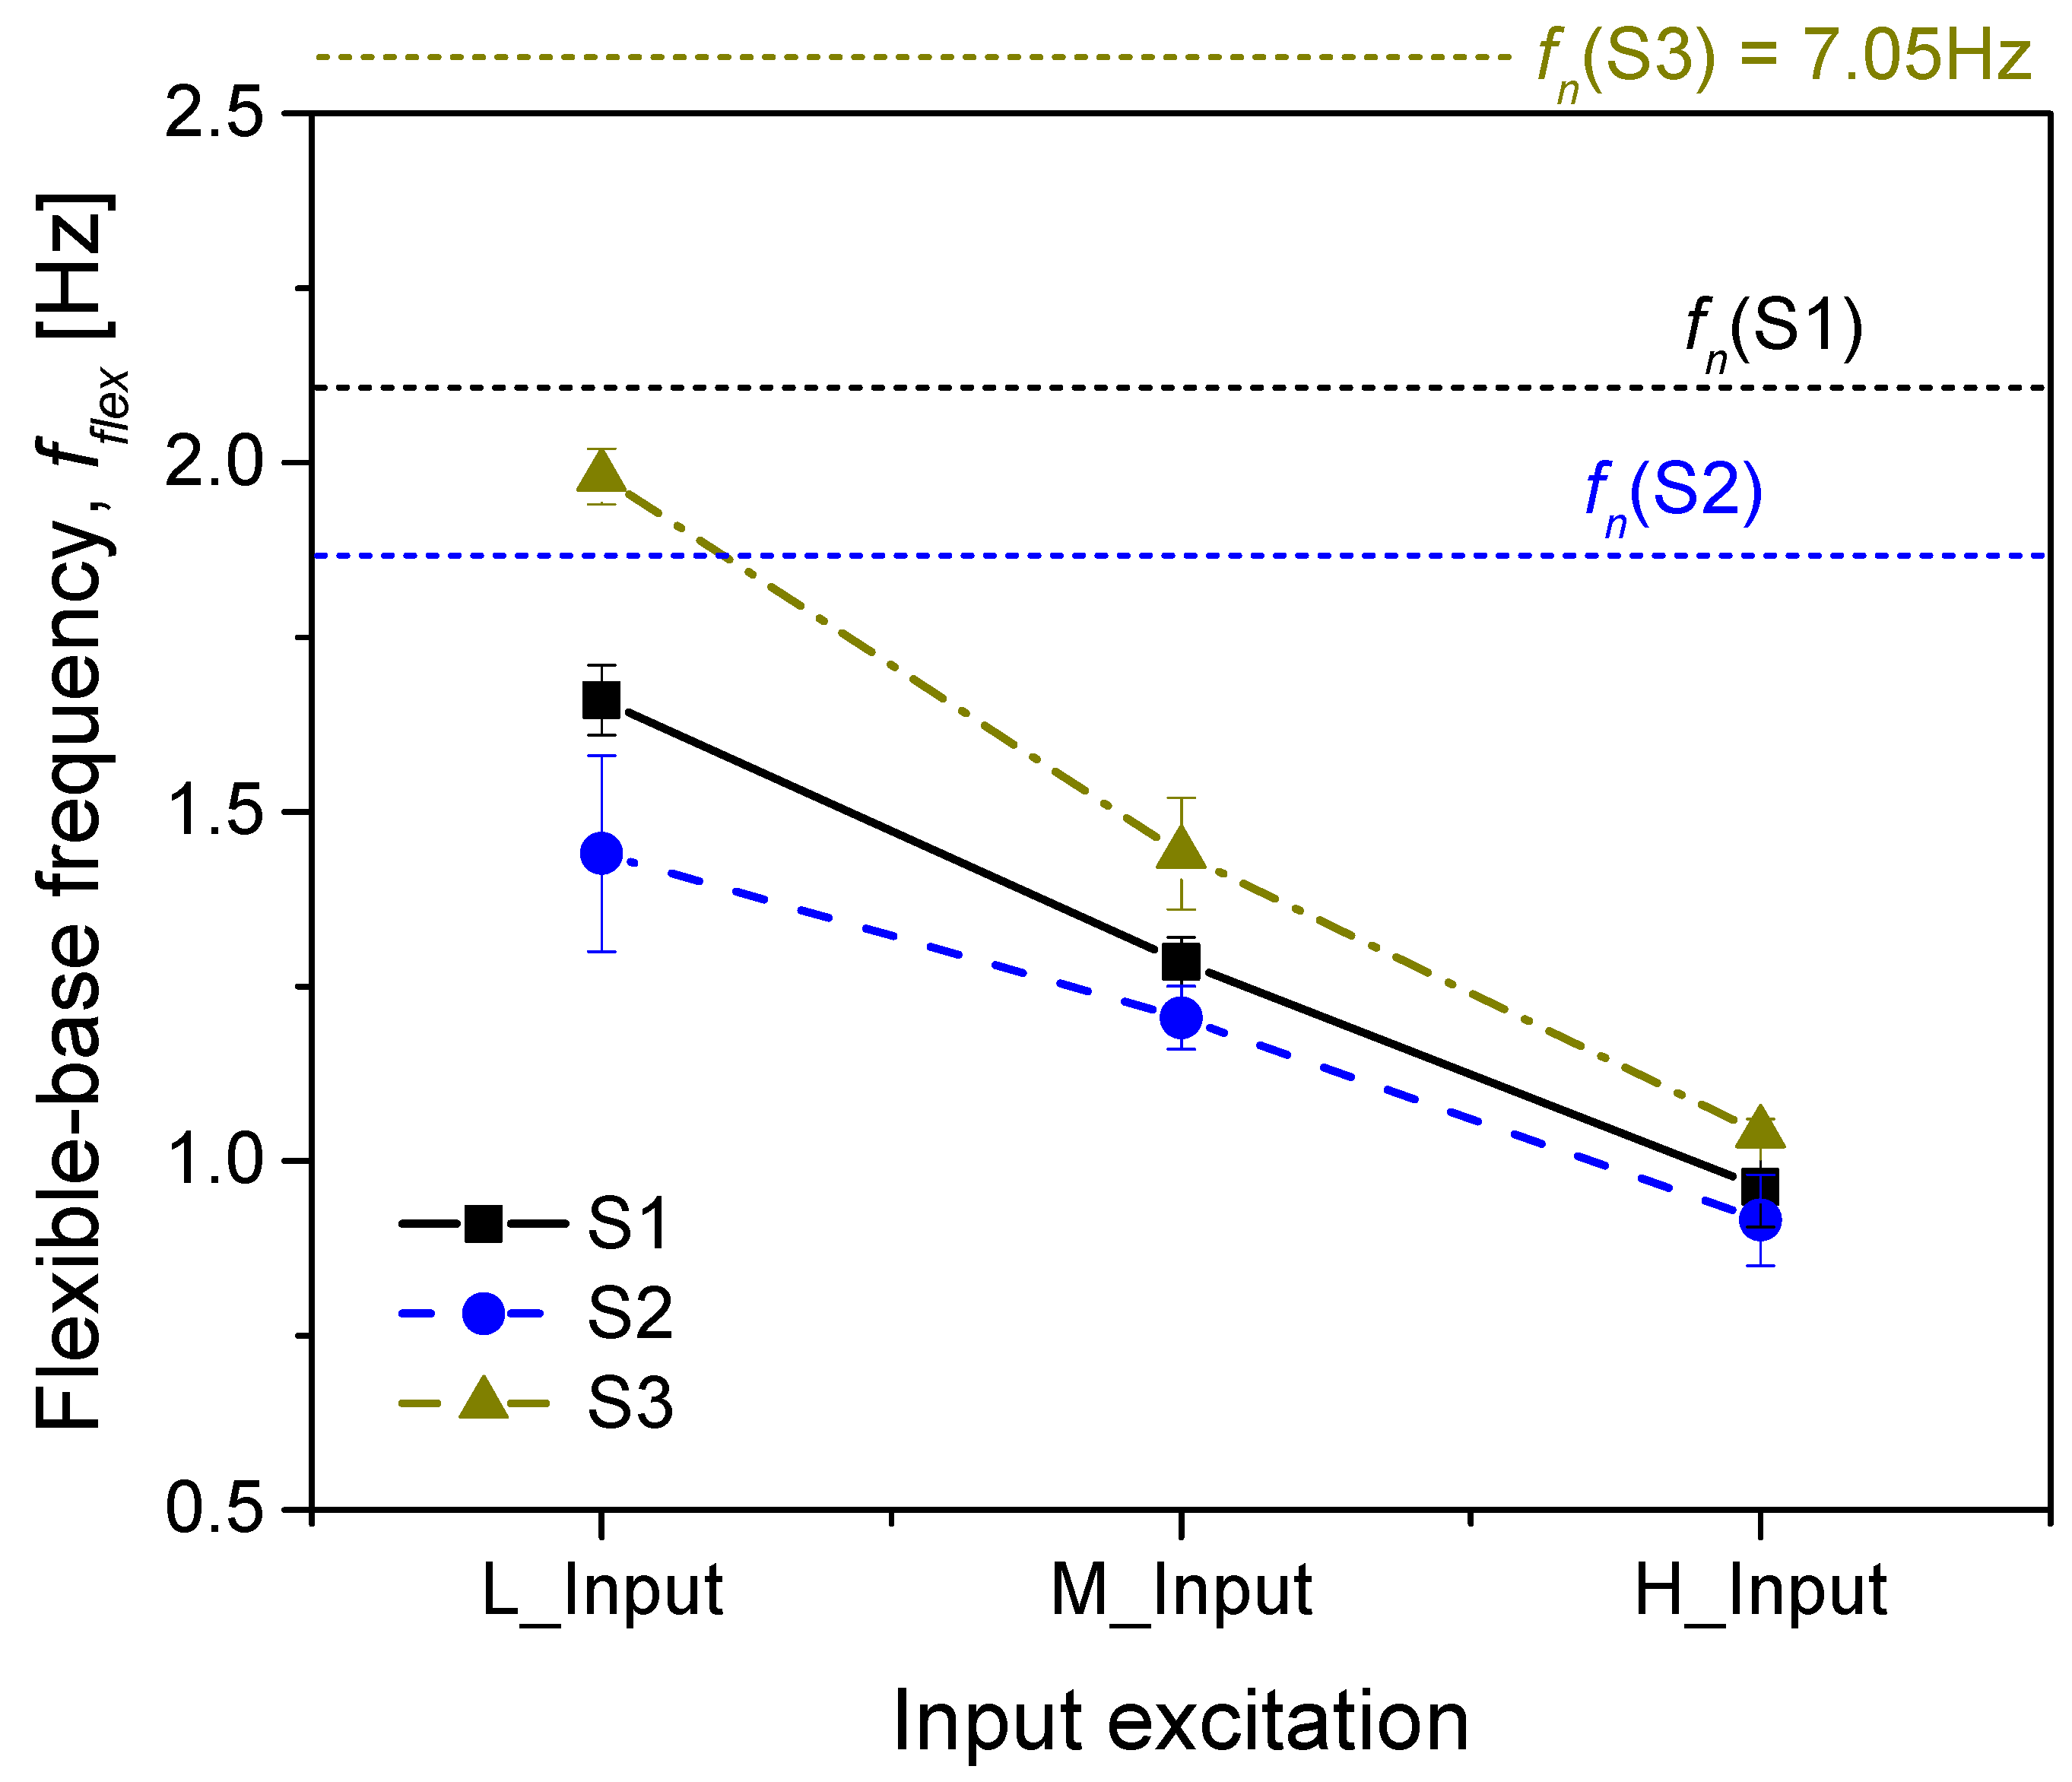
  • Roof motion amplified at a lower frequency compared to fixed-base natural frequency indicating a period lengthening of the soil-structure system. FIM was de-amplified at high frequency due to base-slab averaging of kinematic interaction effects. Flexible-base frequencies of all structures decreased at larger input intensity.
  • SSSI affected structure response in both time and frequency domains indicated by reduction in both ΣPSD and Ia of S1 structure when it was located adjacent to S2 or S3 structures representing both lighter and lower structures. However, SSSI phenomena almost had no influence on the resonant frequency of a more massive structure during an earthquake. More reduction in response of S1 structure was observed at L_Input excitation compared to that at higher input intensities.
  • Severe SSSI effects were observed in distance smaller than the width of the foundation. Center-to-center unfavorable distance could be λ/4 (λ is the wavelength emitted from an adjacent structure) where the most significant increment in structure response of smaller structure was observed.
  • Fixed-base frequency ratio between structures had an insignificant influence on SSSI phenomena. Height ratio (χ) and mass ratio (ψ) reflecting relative inertial interaction behavior between structures controlled SSSI effects between two structures in this study. Depending on whether χ and ψ values were smaller or larger than 1, SSSI effects could reduce or increase structure motions, respectively. SSSI effects were found to be more severe at a low-intensity earthquake because of significant inertial interaction mechanism of the structure. With increasing input intensity, less significant SSSI effects were observed.

Author Contributions

Conceptualization, C.L.; Data Curation, V.-L.N.; Formal Analysis, C.L. and V.-L.N.; Funding Acquisition, J.-M.K.; Methodology, C.L.; Project Administration, J.-M.K.; Supervision, C.L. and J.-M.K.; Validation, S.-H.C.; Experimental Program, C.L. and V.-L.N.; Resources, C.L. and J.-M.K.; Writing—Original Draft Preparation, V.-L.N.; Writing—Review & Editing, C.L. and S.-H.C.

Funding

This research was funded by the Korea Institute of Energy Technology Evaluation and Planning (KETEP) and the Ministry of Trade, Industry & Energy (MOTIE) of the Republic of Korea (No. 20161520101130).

Acknowledgments

This work was a part of project titled “Earthquake Response Analysis of Nuclear Structure Considering Structure-Soil-Structure Interaction”, supported by the Korea Institute of Energy Technology Evaluation and Planning (KETEP) and the Ministry of Trade, Industry & Energy (MOTIE) of the Republic of Korea (No. 20161520101130).

Conflicts of Interest

The authors declare no conflict of interest.

References

  1. Avilés, J.; Pérez-Rocha, L.E. Evaluation of interaction effects on the system period and the system damping due to foundation embedment and layer depth. Soil Dyn. Earthq. Eng. 1996, 15, 11–27. [Google Scholar] [CrossRef]
  2. Stewart Jonathan, P.; Fenves Gregory, L.; Seed Raymond, B. Seismic Soil-Structure Interaction in Buildings. I: Analytical Methods. J. Geotech. Geoenviron. Eng. 1999, 125, 26–37. [Google Scholar] [CrossRef]
  3. Avilés, J.; Pérez-Rocha, L.E. Site effects and soil-structure interaction in the valley of Mexico. Soil Dyn. Earthq. Eng. 1998, 17, 29–39. [Google Scholar] [CrossRef]
  4. Mason, H.B.; Trombetta, N.W.; Chen, Z.; Bray, J.D.; Hutchinson, T.C.; Kutter, B.L. Seismic soil–foundation–structure interaction observed in geotechnical centrifuge experiments. Soil Dyn. Earthq. Eng. 2013, 48, 162–174. [Google Scholar] [CrossRef]
  5. Rayhani, M.T.; El Naggar, M.H. Physical and Numerical Modeling of Seismic Soil-Structure Interaction in Layered Soils. Geotech. Geol. Eng. 2012, 30, 331–342. [Google Scholar] [CrossRef]
  6. Mylonakis, G.; Nikolaou, S.; Gazetas, G. Footings under seismic loading: Analysis and design issues with emphasis on bridge foundations. Soil Dyn. Earthq. Eng. 2006, 26, 824–853. [Google Scholar] [CrossRef]
  7. Ahmadi, S.F.; Eskandari, M. Vibration Analysis of a Rigid Circular Disk Embedded in a Transversely Isotropic Solid. J. Eng. Mech. 2014, 140, 04014048. [Google Scholar] [CrossRef]
  8. Eskandari, M.; Ahmadi, S.F.; Khazaeli, S. Dynamic analysis of a rigid circular foundation on a transversely isotropic half-space under a buried inclined time-harmonic load. Soil Dyn. Earthq. Eng. 2014, 63, 184–192. [Google Scholar] [CrossRef]
  9. Morris, D.V. Dynamic soil–structure interaction modelled experimentally on a geotechnical centrifuge. Can. Geotech. J. 1981, 18, 40–51. [Google Scholar] [CrossRef]
  10. Veletsos, A.S.; Prasad, A.M. Seismic Interaction of Structures and Soils: Stochastic Approach. J. Struct. Eng. 1989, 115, 935–956. [Google Scholar] [CrossRef]
  11. Veletsos, A.S.; Verbič, B. Vibration of viscoelastic foundations. Earthq. Eng. Struct. Dyn. 1973, 2, 87–102. [Google Scholar] [CrossRef]
  12. Torabi, H.; Rayhani, M.T. Three dimensional Finite Element modeling of seismic soil–structure interaction in soft soil. Comput. Geotech. 2014, 60, 9–19. [Google Scholar] [CrossRef]
  13. Kim, S.; Stewart, J.P. Kinematic Soil-Structure Interaction from Strong Motion Recordings. J. Geotech. Geoenviron. Eng. 2003, 129, 323–335. [Google Scholar] [CrossRef]
  14. Roy, C.; Bolourchi, S.; Eggers, D. Significance of structure–soil–structure interaction for closely spaced structures. Nucl. Eng. Design 2015, 295, 680–687. [Google Scholar] [CrossRef]
  15. Lou, M.; Wang, H.; Chen, X.; Zhai, Y. Structure–soil–structure interaction: Literature review. Soil Dyn. Earthq. Eng. 2011, 31, 1724–1731. [Google Scholar] [CrossRef]
  16. Alexander, N.A.; Ibraim, E.; Aldaikh, H. A simple discrete model for interaction of adjacent buildings during earthquakes. Comput. Struct. 2013, 124, 1–10. [Google Scholar] [CrossRef]
  17. Chen, J.C.; Masienikov, O.R.; Johnson, J.J. Seismic response of a nuclear power generation complex including structure-to-structure interaction effects. In Proceedings of the American Society of Mechanical Engineers (ASME) Pressure Vessel and Piping Conference, Orlando, FL, USA, 27–31 July 1997. [Google Scholar]
  18. Naserkhaki, S.; Pourmohammad, H. SSI and SSSI effects in seismic analysis of twin buildings: Discrete model concept. J. Civil Eng. Manag. 2012, 18, 890–898. [Google Scholar] [CrossRef]
  19. Lee, T.H.; Wesley, D.A. Soil-structure interaction of nuclear reactor structures considering through-soil coupling between adjacent structures. Nucl. Eng. Design 1973, 24, 374–387. [Google Scholar] [CrossRef]
  20. ASCE. Seismic Analysis of Safety-Related Nuclear Structures (4–16); American Society of Civil Engineers: Reston, VA, USA, 2017; Volumes 4–16, p. 304. [Google Scholar]
  21. FEMA. Improvement of Nonlinear Static Seismic Analysis Procedures; FEMA 440, prepared by Applied Technology Council (ATC-55 Project); Department of Homeland Security Federal Emergency Management Agency: Washington, DC, USA, 2005.
  22. NEHRP. Nehrp Recommended Provisions for Seismic Regulations for New Buildings and Other Structures (FEMA 450), Part 1: Provisions; FEMA: Washington, DC, USA, 2003; Volume 302.
  23. Luco, J.E.; Contesse, L. Dynamic structure-soil-structure interaction. Bull. Seismol. Soc. Am. 1973, 63, 1289–1303. [Google Scholar]
  24. Murakami, H.; Luco, J.E. Seismic Response of a Periodic Array of Structures. J. Eng. Mech. Div. 1977, 103, 965–977. [Google Scholar]
  25. Wong, H.L.; Trifunac, M.D. Two-dimensional, antiplane, building-soil-building interaction for two or more buildings and for incident planet SH waves. Bull. Seismol. Soc. Am. 1975, 65, 1863–1885. [Google Scholar]
  26. Nakagawa, S.; Kuno, M.; Naito, Y.; Nozawa, T.; Momma, T.; Mizuno, J.; Tsukamoto, T.; Motohashi, S.; Niwa, M. Forced vibration tests and simulation analyses of a nuclear reactor building. Nucl. Eng. Design 1998, 179, 145–156. [Google Scholar] [CrossRef]
  27. Kitada, Y.; Hirotani, T.; Iguchi, M. Models test on dynamic structure–structure interaction of nuclear power plant buildings. Nucl. Eng. Design 1999, 192, 205–216. [Google Scholar] [CrossRef]
  28. Xu, J.; Costantino, C.; Hofmayer, C.; Ali, S. Seismic Response Prediction of NUPEC’s Field Model Tests of NPP Structures With Adjacent Building Effect. In Proceedings of the ASME/JSME 2004 Pressure Vessels and Piping Conference, San Diego, CA, USA, 25–29 July 2004; pp. 1–11. [Google Scholar] [CrossRef]
  29. Broc, D. Soil-Structure Interaction: Theoretical and Experimental Results. In Proceedings of the ASME 2006 Pressure Vessels and Piping/ICPVT-11 Conference, Vancouver, BC, Canada, 23–27 July 2006; pp. 81–86. [Google Scholar] [CrossRef]
  30. Ogut, O.C. Soil-Structure Interaction Effect of Embedded Foundation and Adjacent Buildings on Response Characteristics of Superstructures. Ph.D. Thesis, Nagoya University, Nagoya, Japan, 2017. [Google Scholar]
  31. Aldaikh, H.; Alexander, N.A.; Ibraim, E.; Oddbjornsson, O. Two dimensional numerical and experimental models for the study of structure–soil–structure interaction involving three buildings. Comput. Struct. 2015, 150, 79–91. [Google Scholar] [CrossRef]
  32. Aldaikh, H.; Alexander, N.A.; Ibraim, E.; Knappett, J. Shake table testing of the dynamic interaction between two and three adjacent buildings (SSSI). Soil Dyn. Earthq. Eng. 2016, 89, 219–232. [Google Scholar] [CrossRef]
  33. Trombetta, N.W.; Mason, H.B.; Hutchinson Tara, C.; Zupan Joshua, D.; Bray Jonathan, D.; Kutter Bruce, L. Nonlinear Soil–Foundation–Structure and Structure–Soil–Structure Interaction: Centrifuge Test Observations. J. Geotech. Geoenviron. Eng. 2014, 140, 04013057. [Google Scholar] [CrossRef]
  34. Padrón, L.A.; Aznárez, J.J.; Maeso, O. Dynamic structure–soil–structure interaction between nearby piled buildings under seismic excitation by BEM–FEM model. Soil Dyn. Earthq. Eng. 2009, 29, 1084–1096. [Google Scholar] [CrossRef]
  35. Kim, D.-S.; Kim, N.-R.; Choo, Y.W.; Cho, G.-C. A newly developed state-of-the-art geotechnical centrifuge in Korea. KSCE J. Civ. Eng. 2013, 17, 77–84. [Google Scholar] [CrossRef]
  36. Lee, S.-H.; Choo, Y.-W.; Kim, D.-S. Performance of an equivalent shear beam (ESB) model container for dynamic geotechnical centrifuge tests. Soil Dyn. Earthq. Eng. 2013, 44, 102–114. [Google Scholar] [CrossRef]
  37. Schofield, A.N. Cambridge geotechnical centrifuge operations. Geotechnique 1980, 30, 227–268. [Google Scholar] [CrossRef]
  38. Das, B.M. Advanced Soil Mechanics; CRC Press: Boca Raton, FL, USA, 2013. [Google Scholar]
  39. Park, H.-J.; Ha, J.-G.; Kwon, S.-Y.; Lee, M.-G.; Kim, D.-S. Investigation of the dynamic behaviour of a storage tank with different foundation types focusing on the soil-foundation-structure interactions using centrifuge model tests. Earthq. Eng. Struct. Dyn. 2017, 46, 2301–2316. [Google Scholar] [CrossRef]
  40. Ghayoomi, M.; Dashti, S. Effect of Ground Motion Characteristics on Seismic Soil-Foundation-Structure Interaction. Earthq. Spectra 2015, 31, 1789–1812. [Google Scholar] [CrossRef]
  41. Veletsos, A.S.; Meek, J.W. Dynamic behaviour of building-foundation systems. Earthq. Eng. Struct. Dyn. 1974, 3, 121–138. [Google Scholar] [CrossRef]
  42. Kham, M.; Semblat, J.-F.; Bard, P.-Y.; Dangla, P. Seismic Site–City Interaction: Main Governing Phenomena through Simplified Numerical Models. Bull. Seismol. Soc. Am. 2006, 96, 1934–1951. [Google Scholar] [CrossRef]
  43. Huang, C.-F.D. Dynamic Soil-Foundation and Foundation-Soil-Foundation Interaction in 3-D. Ph.D. Thesis, University of South Carolina, South Carolina, SC, USA, 1993. [Google Scholar]
  44. Behnamfar, F.; Sugimura, Y. Dynamic response of adjacent structures under spatially variable seismic waves. Probabilistic Eng. Mech. 1999, 14, 33–44. [Google Scholar] [CrossRef]
  45. Welch, P. The use of fast Fourier transform for the estimation of power spectra: A method based on time averaging over short, modified periodograms. IEEE Trans. Audio Electroacoust. 1967, 15, 70–73. [Google Scholar] [CrossRef]
  46. Travasarou, T.; Bray, J.D.; Abrahamson, N.A. Empirical attenuation relationship for Arias Intensity. Earthq. Eng. Struct. Dyn. 2003, 32, 1133–1155. [Google Scholar] [CrossRef]
  47. Aldaikh, H.; Alexander Nicholas, A.; Ibraim, E.; Knappett Jonathan, A. Evaluation of Rocking and Coupling Rotational Linear Stiffness Coefficients of Adjacent Foundations. Int. J. Geomech. 2018, 18, 04017131. [Google Scholar] [CrossRef]
Figure 1. Schematic drawing of typical centrifuge models for S1-S2 structures in case of 0.03B distance with installation of in-flight bender elements, accelerometers, and laser sensors. Accelerometers installed in soil are marked in blue while those bonded at structure are indicated as red.
Applsci 09 00526 g001
Figure 2. Shear-wave velocity profile of prototype soil in comparison with results from Oedometer and RC (Resonant Column) tests.
Applsci 09 00526 g002
Figure 3. Input motions in time domain (a) and 5 % damping response spectra (b). fn denotes fixed-base frequency of each building.
Applsci 09 00526 g003
Figure 4. Ratio of response spectra (RRS) of S1 structure considering foundation input motion (RRSFIM) (a) and inertia interaction (RRSII) with artificial input motion (b). fn is fixed-base frequency of S1 structure. Solid circles indicate peak RRS of each case.
Applsci 09 00526 g004
Figure 5. RRSII of S1, S2, and S3 structures with artificial input motion at L_Input intensity. fn and solid circles indicate are fixed-base frequency and peak RRS of each structure, respectively.
Applsci 09 00526 g005
Figure 6. Variation of flexible-base frequency (fflex) of S1, S2, and S3 structure with level of input excitation. fn indicates fixed-base frequency of each structure. Average value from two input motions was plotted. Error bars indicate variations of two motions.
Applsci 09 00526 g006
Figure 7. Power Spectra Density (PSD) of S1 structure (a) S1-S2 tests with artificial EQ; (b) S1-S2 tests with Hachinohe EQ; (c) S1-S3 tests with artificial EQ; (d) S1-S3 tests with Hachinohe EQ at M_Input intensity. Solid circles indicate peak PSD at resonant frequency. fflex indicates flexible-base frequency of S1 structure.
Applsci 09 00526 g007aApplsci 09 00526 g007b
Figure 8. Normalized Ia of S1 foundation (F), wall (W), and roof (R) in case of interaction with (a) S2 structure and (b) S3 structure to Ia of S1 structure in the reference case. Average value from two input motions was plotted. Error bars indicate variations of two motions.
Applsci 09 00526 g008
Figure 9. Variation of ΔPSD with distance between foundations (a) for S1 structure in adjacent to S2 structure in S1-S2 case; (b) for S1 structure adjacent to S3 structure in S1-S3 case; (c) for S2 structure in S1-S2 case; (d) for S3 structure in S1-S3 case. λ is wavelength emitted from adjacent structure.
Applsci 09 00526 g009aApplsci 09 00526 g009b
Figure 10. Variation of ΔPSD with height ratio suffered from (a) artificial EQ at L_Input; (b) Hachinohe EQ at L_Input; (c) artificial EQ at H_Input; and (d) Hachinohe EQ at H_Input.
Applsci 09 00526 g010aApplsci 09 00526 g010b
Figure 11. Variation of ΔPSD with mass ratio suffered from (a) L_Input of artificial EQ; (b) L_Input of Hachinohe EQ; (c) H_Input of artificial EQ; and (d) H_Input of Hachinohe EQ.
Applsci 09 00526 g011aApplsci 09 00526 g011b
Figure 12. Variation of ΔPSD with ratio of Max.RRSII suffered from artificial earthquake at (a) L_Input and (b) H_Input.
Applsci 09 00526 g012
Table 1. Dimensions and characteristics of structural models.
StructuresS1S2S3
Dimensions at prototype scale (m)
(Dimensions at 1 g) (mm)
Applsci 09 00526 i001 Applsci 09 00526 i002 Applsci 09 00526 i003
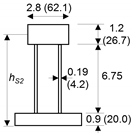
Foundation dimensions: Width (B) × Length (L) × Thickness (T) (m)5.2 × 5.2 × 0.94.1 × 5.2 × 0.91.2 × 2.0 × 0.9
Foundation equivalent radius, rf (m)2.95 2.61 0.82
Height, h (m)9.48.252.97
Mass at 1 g, m (kg) 1.891.250.13
fn,model at 1 g, (Hz) (hammer test)98.682.04317.4
fn at 45 g, (Hz) 2.191.827.05
Mass ratio, ψ = mS1/m 1.01.515.3
Height ratio, χ = hS1/h1.01.143.16
Factor of safety, FSv19.622.523.1
Note: rf = B L / π ; fn = structural fixed-base frequency; Tn = structural fixed-based period.
Table 2. Fundamental characteristics of soil modeling in centrifuge test.
PropertiesValue
Specific gravity, Gs2.65
Fine contents passing #200 (%)0.9
Maximum void ratio, emax1.137
Minimum void ratio, emin0.616
Uniformity coefficient, Cu1.6
Soil classification, USCSSP
Relative density, Dr (%)80
Dry density (t/m3)1.54
Friction angle, φ (deg.)36.6
Table 3. Experimental layouts.
CaseDistanceRemark
B0.5B0.03B
Ref. S1, S2, S3Three reference tests for S1, S2, S3
S1-S2S1 + S2 structures
D (m)10.47.85.4
S1-S3S1 + S3 structures
D (m)8.86.33.8
Note: (√) = performed tests; (−) = ignored tests; D = Center-to-center distance between foundations.
Table 4. Percentage change of total power spectra density (ΔPSD) of S1 structure for a series of tests with S2 and S3 structures placed beside.
ΔPSDS1 (%)Artificial EQHachinohe EQ
L_InputM_InputH_InputL_InputM_InputH_Input
S1-S2 case
B-Dist−30.30−27.18−18.54−22.90−22.81−17.40
0.5B-Dist−9.88−7.20−0.77−13.21−3.31−3.83
0.03B-Dist−21.61−8.05−6.97−1.31−1.48−10.16
S1-S3 case
B-Dist−9.17−6.35−2.31−23.72−8.15−19.48
0.5B-Dist−5.91−2.01−0.45−15.37−4.61−3.54
0.03B-Dist−2.99−0.01

