Abstract
The slope of a reservoir area is unstable and can be destroyed by natural disasters, such as strong earthquakes and rainstorms. Landslide bodies that enter the water and generate landslide surges pose serious safety risks to terminals, ships, and hydraulic structures in a reservoir area. After analyzing landslide data in a reservoir area, a series of comparative tests was carried out to investigate the propagation characteristics of landslide-induced tsunamis in channel reservoirs, and the changes in water level values at various monitoring points in the river channel after the landslides entered the water were explored. The effects of landslide width and thickness on the characteristics of landslide-induced tsunamis were analyzed. The main target was a fixed-velocity ship in landslide-swelling water. The complex nonlinear motion characteristics of the ship on the water were studied to determine the safe navigation range.
1. Introduction
Tsunamis are water waves generated by impulsive disturbances such as river erosion, rainfall, groundwater erosion, water level fluctuation, earthquakes, human activities, and other external environmental conditions. Unfavorable geological phenomena, such as bank collapses and slipping, also occur frequently and can cause tsunamis [1,2]. During these events, a large amount of energy flows into the water at a high speed and creates a large landslide-induced tsunami, which can cause serious disasters around landslide-related areas. Generally, landslide-generated tsunamis take place on both a larger temporal and smaller spatial scale, if compared with those generated by earthquakes [3]. Landslide-induced tsunamis are superimposed in the propagation process, and structures within a certain range are strongly affected [4,5]. Landslide-induced tsunamis adversely affect the movement of ships during navigation, and can even cause ships to overturn [6]. Therefore, the propagation characteristics of landslide-induced tsunamis in different working conditions must be studied to protect the normal navigation of ships. The motion responses of different types of landslides to sailing ships should also be examined.
Recent research efforts into landslide-induced tsunamis have been productive. The formation, propagation, and run-up of landslide-induced impulse waves have been studied through physical experiments [7,8,9], scale model physical experiments [10], and numerical simulation [11]. Based on these studies, there are new physical model experiments to research on the run-up and formation of landslide-induced tsunamis [12,13], to be carried out in a large wave tank by varying the initial acceleration [14] in order to improve the knowledge on the involved phenomena and optimize the detection algorithm [15]. However, while a lot of scaled model experiments have been designed in water, there is little research on the interaction between landslide-induced tsunamis and hydraulic structures.
In recent years, extensive efforts have been made to investigate the motion of ships. A series of methods have been proposed to predict the rolling parametric by nonlinear trip theory [16], to obtain passive and stable state-space [17], to predict the motion of barge ships in regular waves [18], and to calculate the motion sickness dose value [19]. Based on these studies, a partial-body nonlinear time-domain code was modified to achieve higher accuracy [20,21]. As far as the tsunamis are concerned, more and more methods are being utilized to research ship motion in the region of tsunamis [22,23,24]. Many experiments on tsunamis are being explored to investigate the run-up [25], the dynamic response of the sand bed [26], and the hydrodynamic pressure of a bore [27]. Although these laboratory experiments have been performed in a sufficiently large experimental facility, there is little research on the interaction between landslide-induced tsunamis and sailing ships.
The present paper investigates the propagation law of landslide-induced tsunamis in complex curved river channels, strengthens the early warning and prevention of geological disasters in reservoir areas, and explores the nonlinear effects of landslide-induced tsunamis on the primary degree-of-freedom motion response of a ship based on a series of landslide-induced tsunami tests.
2. Landslide-Induced Tsunami Test Design for Rock Mass
2.1. Model Scale Ratio
Three similar conditions—geometric similarity, similarity in motion, and similar dynamics—must be met to obtain a similar physical phenomenon between a prototype and model. A landslide is dominated by gravity. Therefore, the model must be designed according to the gravity similarity criterion, and the following requirements should be met.
where , , , , and denote geometric, speed, time, force, mass, and gravitational acceleration scales, respectively, and , , , , , and . The scale ratio of the model is determined to be 1:70 according to the actual test conditions and test accuracy.
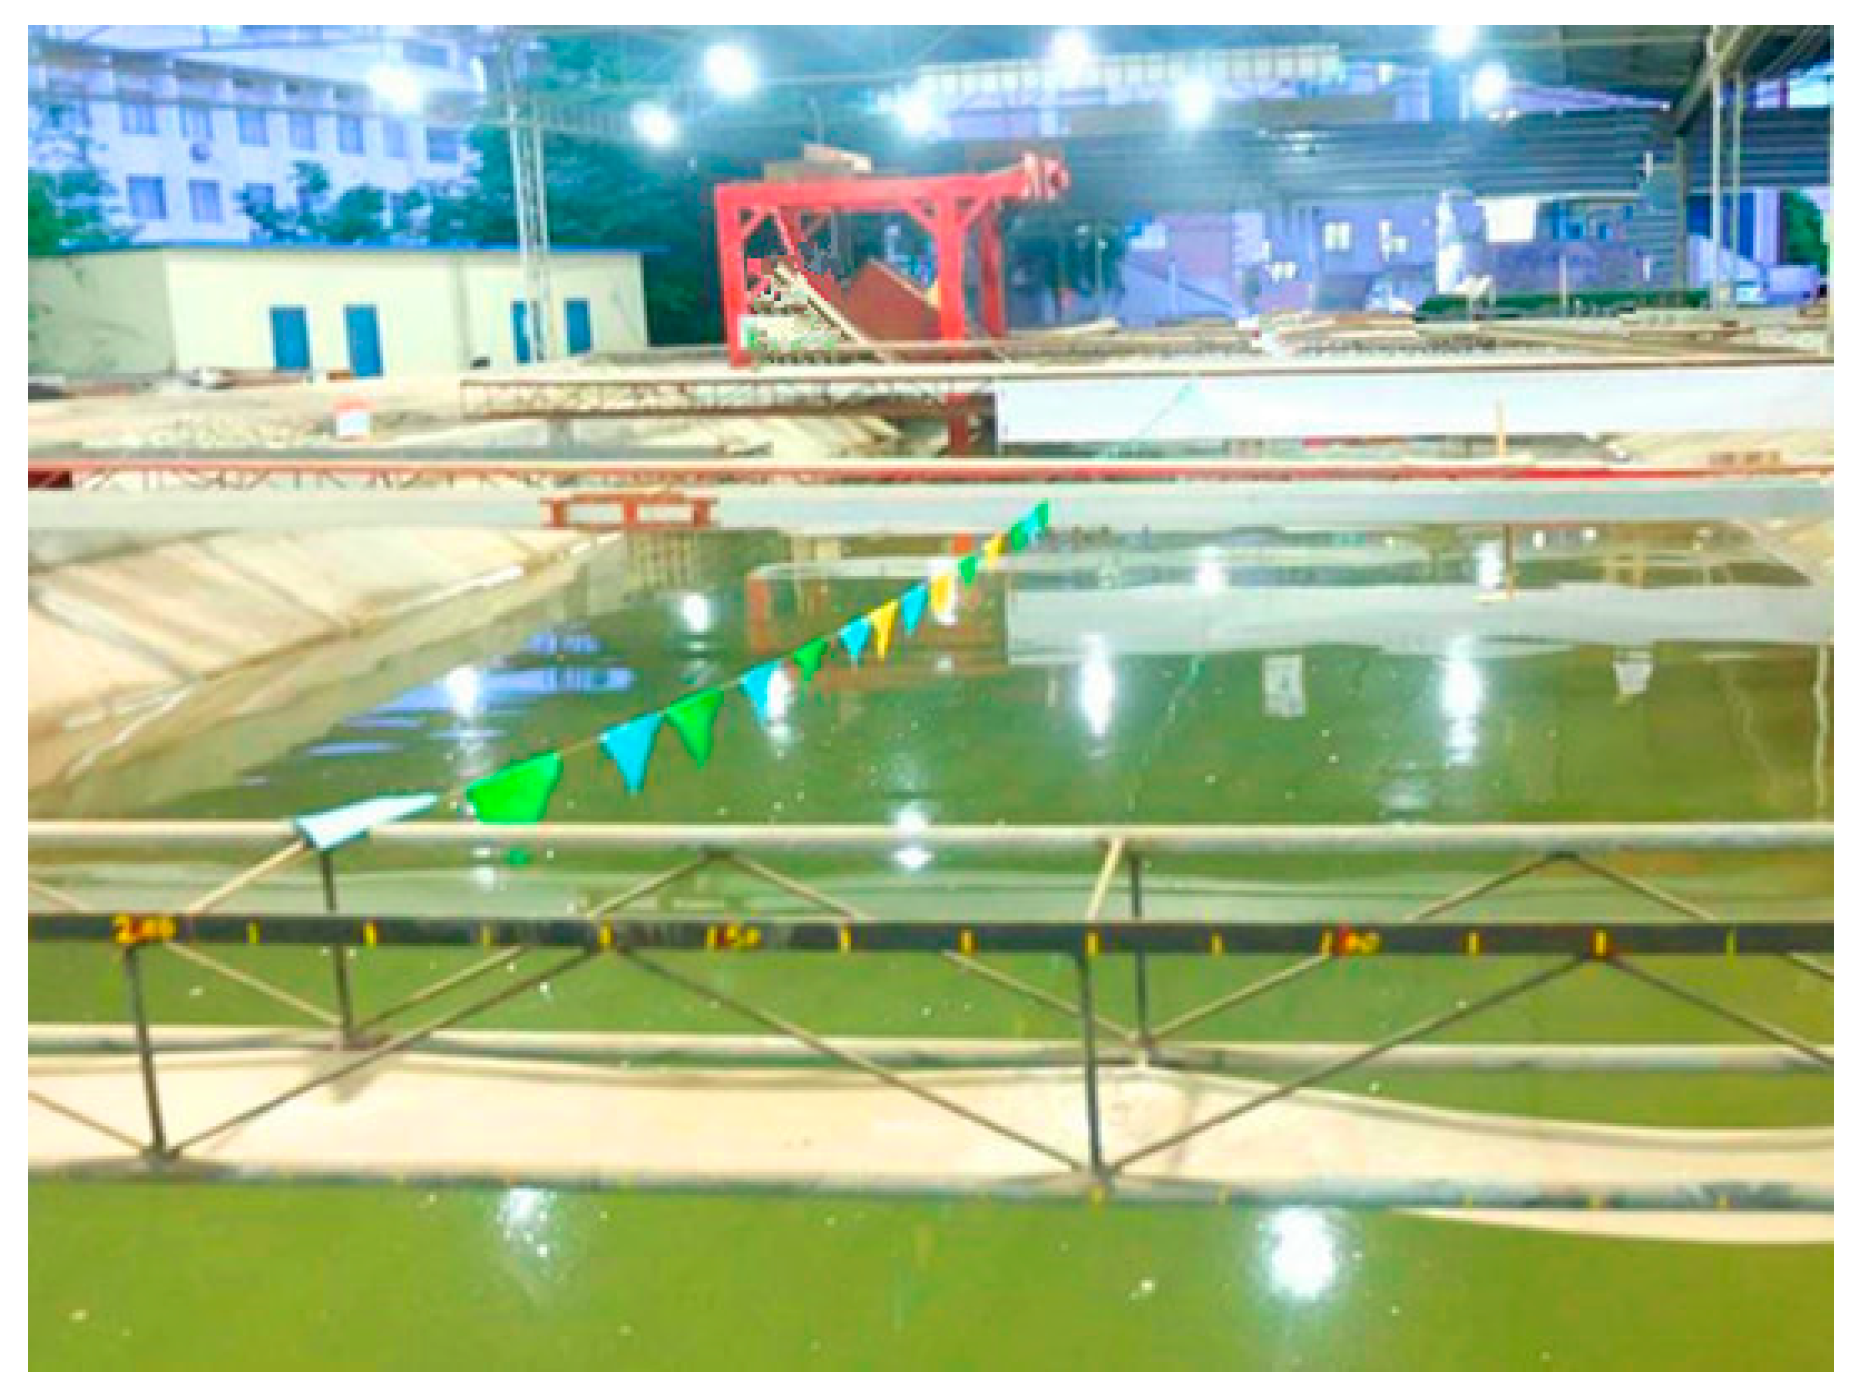
2.2. General Design of the River Model
Simulation of the reach of the river section indicates that the mileage of the navigation channel is 336 km, and the channel length is 330 km. The model is produced using the section method and generalized to the bottom terrain. As shown in Figure 1, the model was built according to the drawing before the test. The specific size and the designated spots are shown in Figure 2.
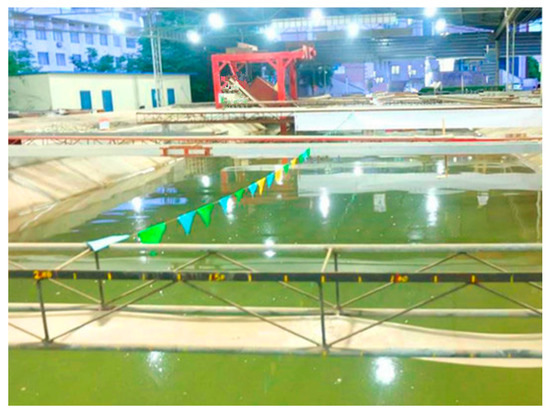
Figure 1.
Model of the river section.
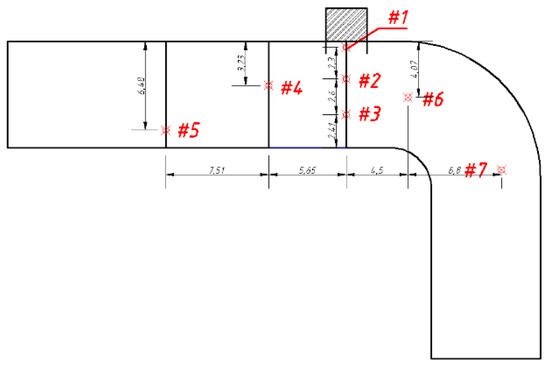
Figure 2.
Model of the generalized plan.
2.3. Landslide Body, Chute, and Carriage Model Design
2.3.1. Landslide Body
The landslide body is a slider, and cement, sand, and stones are used as raw materials. Blocks are also utilized in accordance with statistics. The blocks that have been created are stacked and integrated according to the parameter table of each scheme block to simulate the crack development, dispersion degree, and block composition of the sliding body. The sliding blocks are used according to the actual situation of the landslide, and are composed of different sizes, as shown in Figure 3.
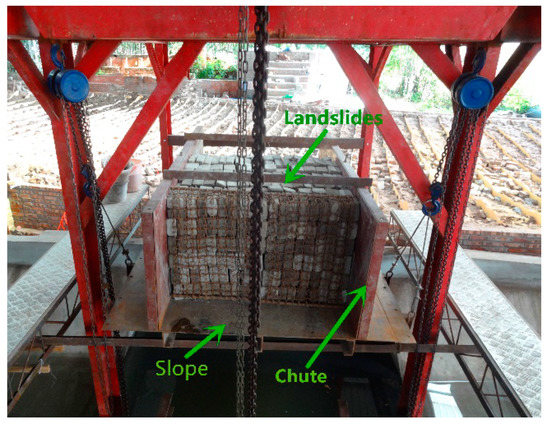
Figure 3.
Arrangement of sliding blocks.
2.3.2. Chute
A ferrous material is used to make the chute, and the bottom iron plate simulates the sliding surface. The chute length is 2 m. Both sides have variable widths. The variable range is 0.5 m to 1.5 m.
2.3.3. Carriage
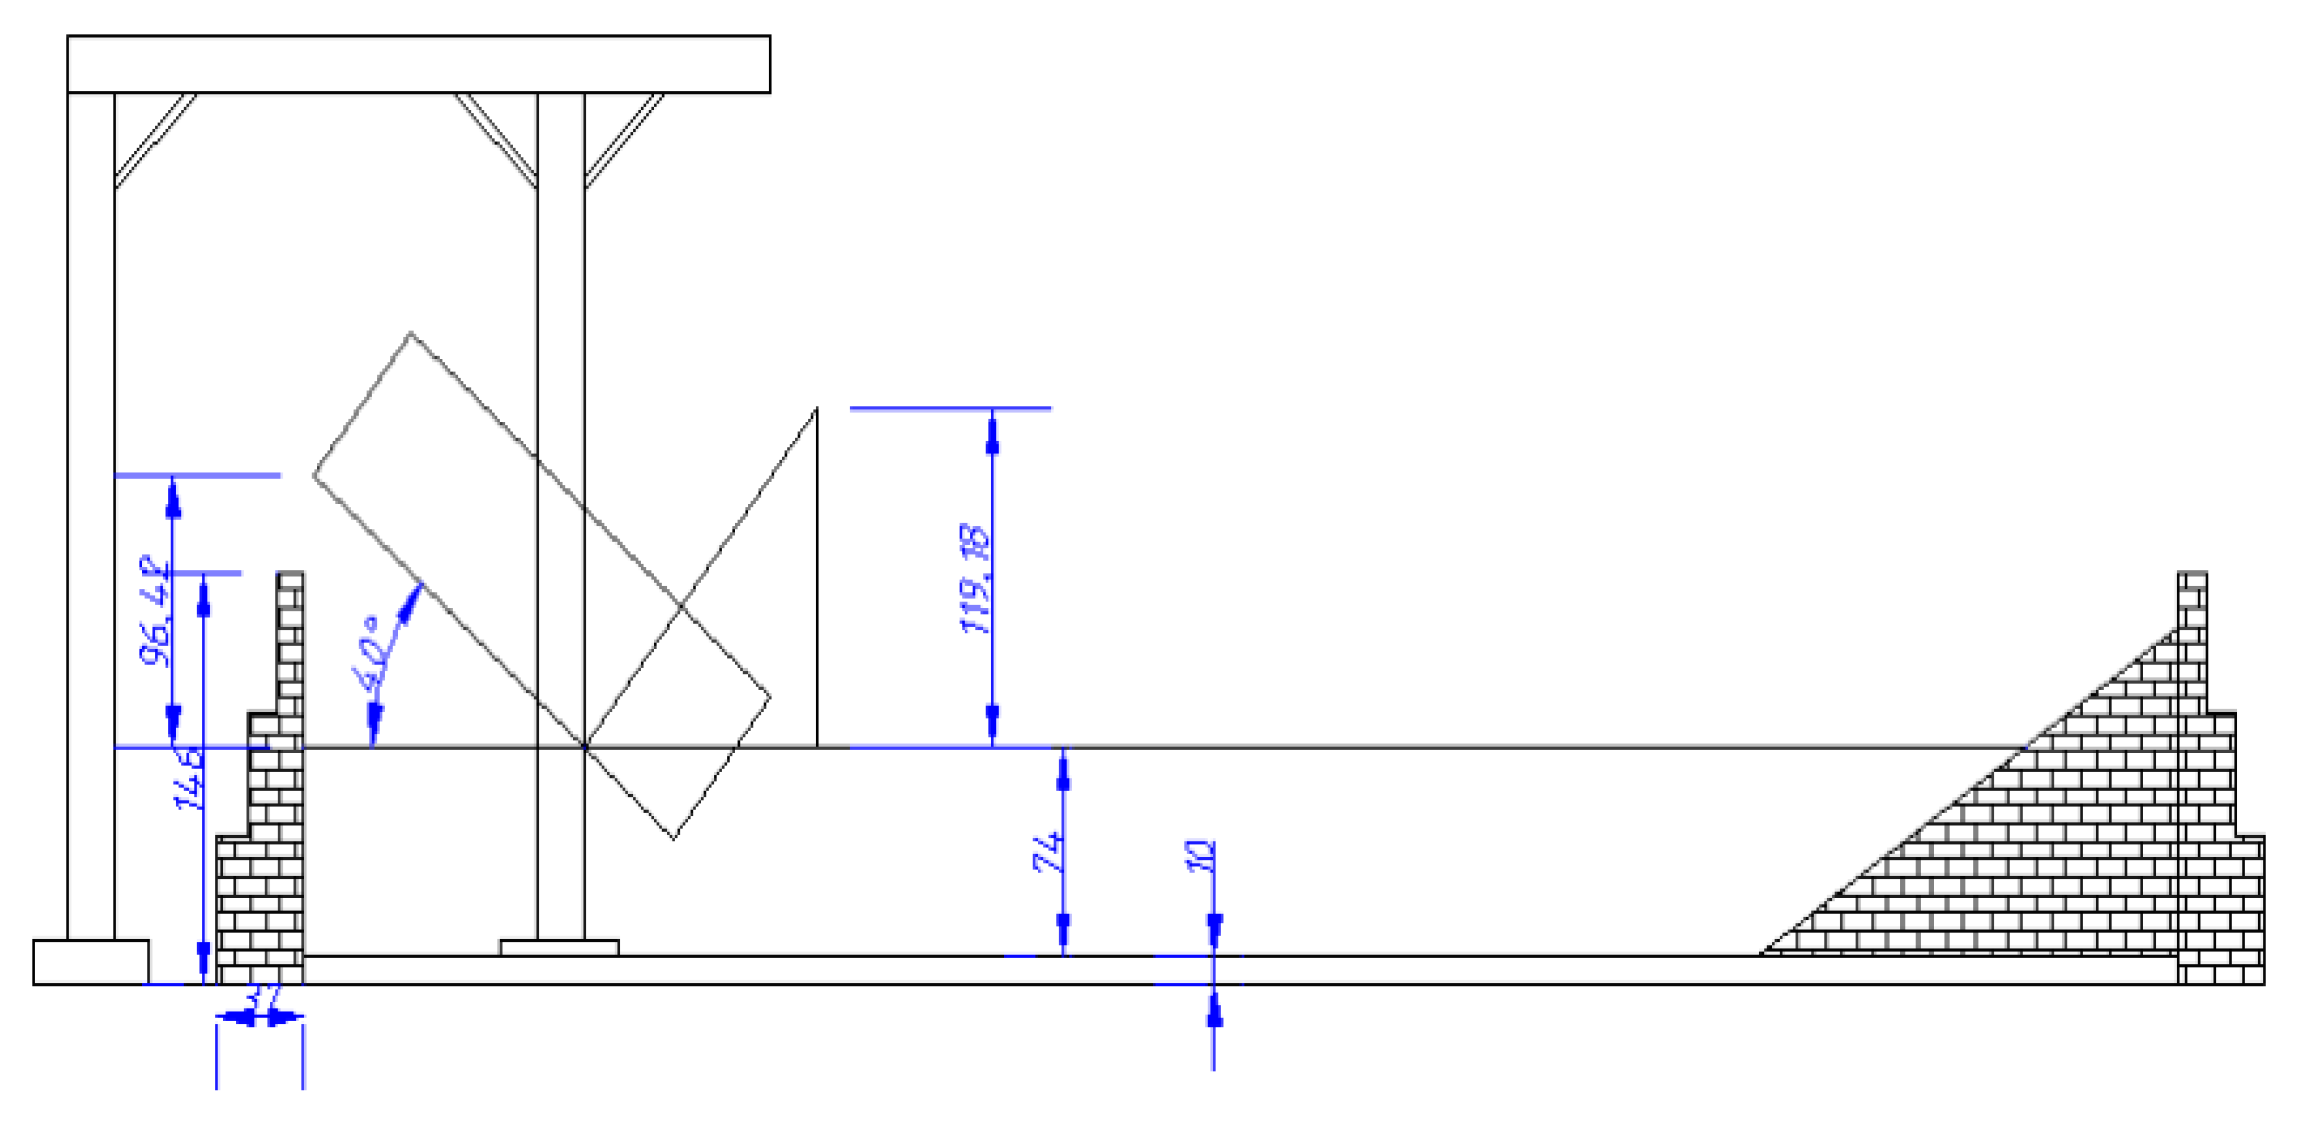
The volume and weight of the landslide body in the test are small, but the landslide body has a high center of gravity. The landslide slope and slope variation are relatively large. Observations, photographing, and other functions are also performed on the carriage for safety. High requirements are set for operation convenience. Model 20 channel steel is used to construct the shelves. The carriage is 2 m high, 2 m wide, and 3 m long. The layout of the sliding frame is shown in Figure 4.
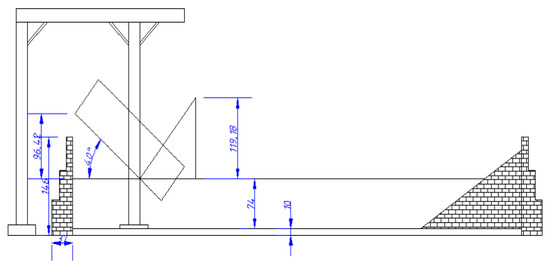
Figure 4.
Layout of the sliding frame.
2.3.4. Measuring Instrument
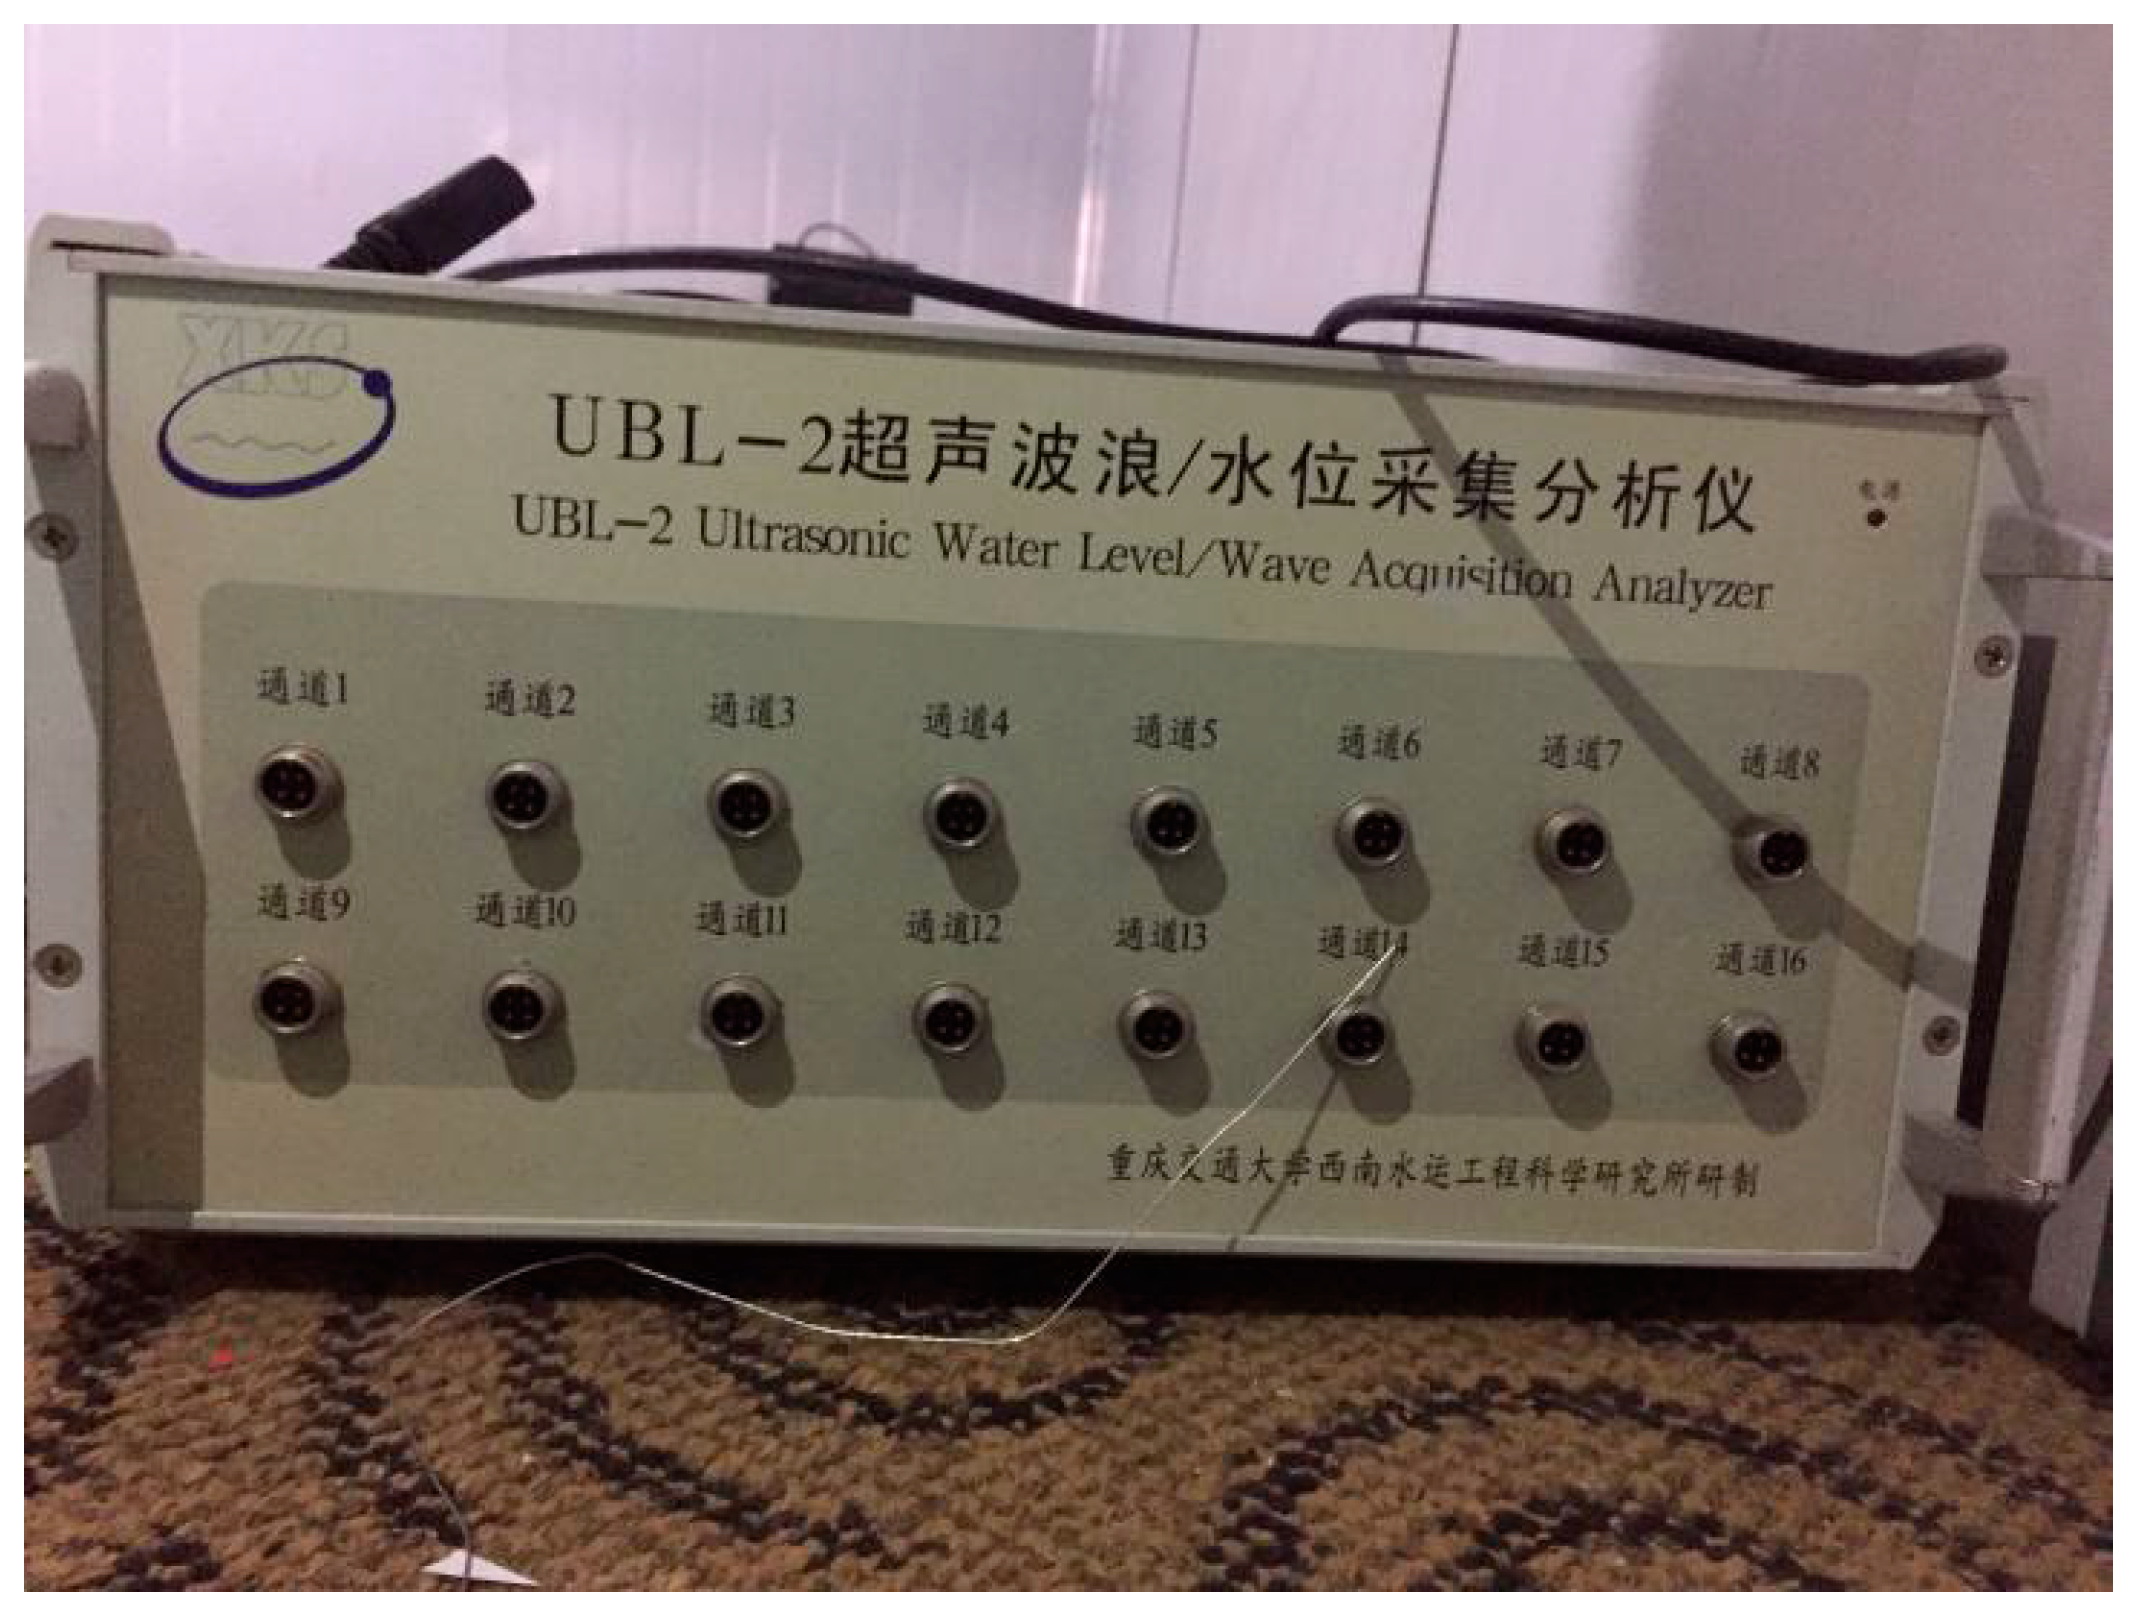
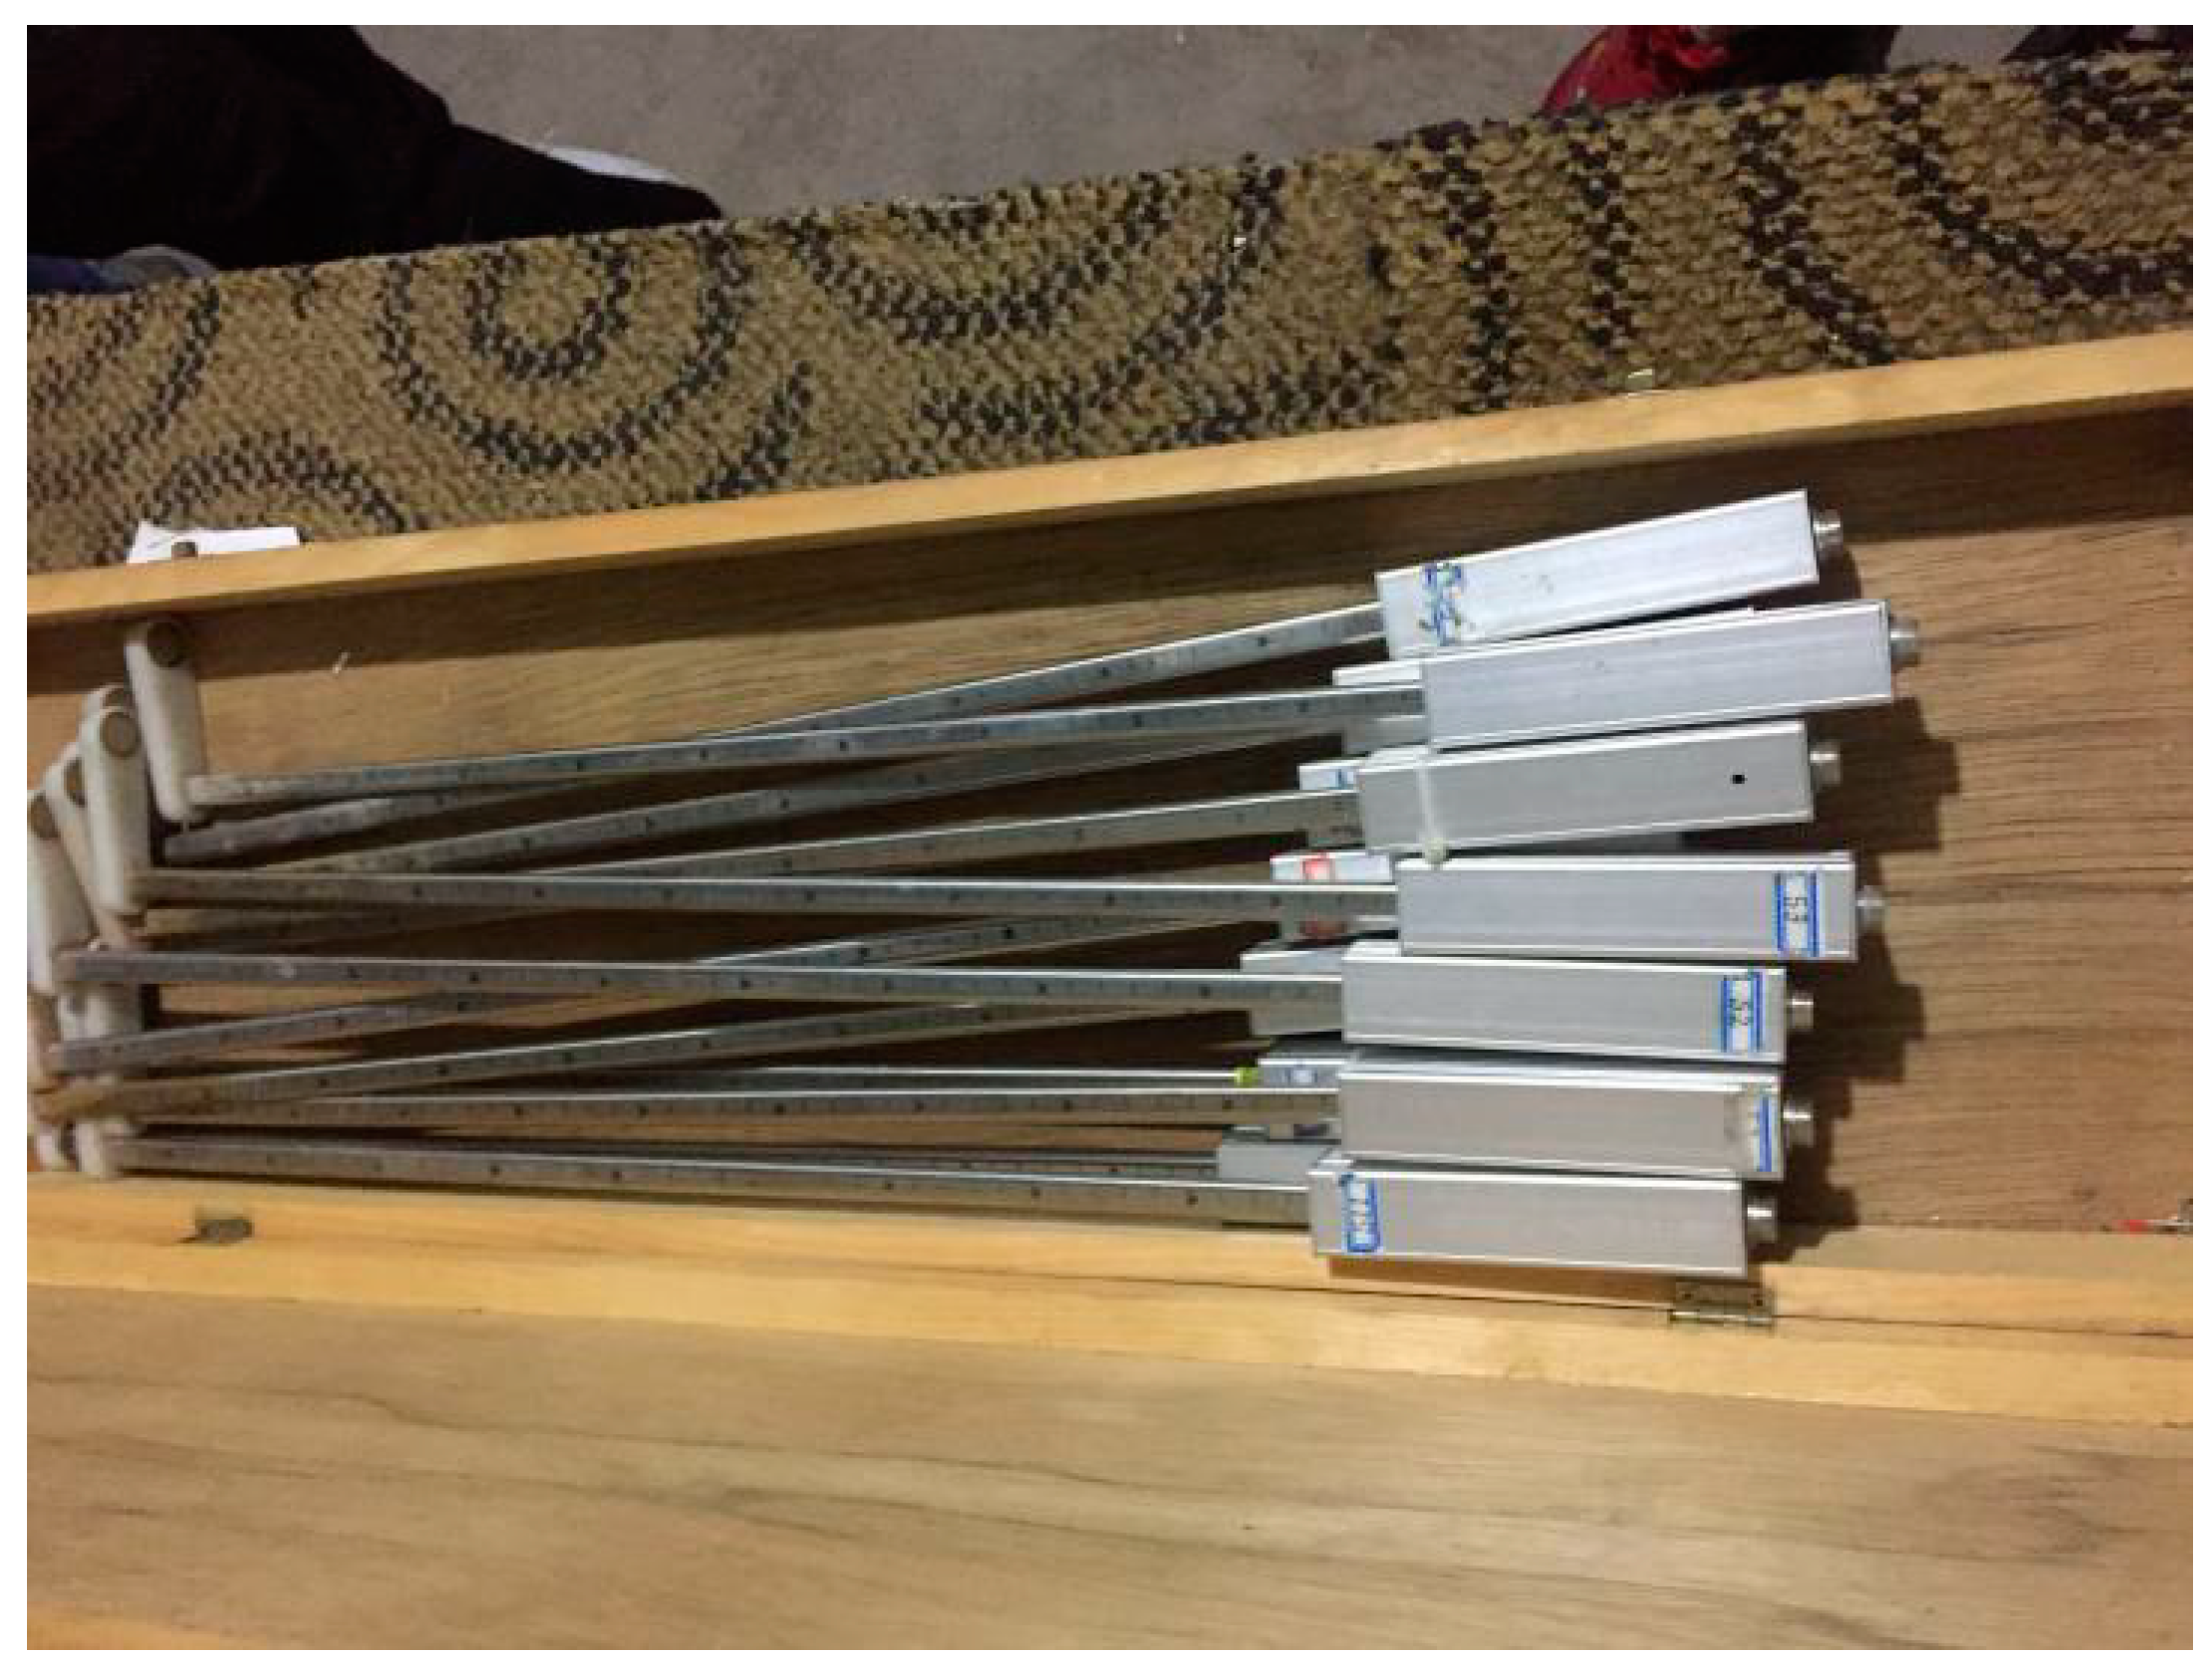
Figure 5 and Figure 6 show the wave acquisition analyzer and a water level collector. The role of the water level collectors is to detect changes of the water level in the channel river. All the water level collectors are placed at the designated spots.

Figure 5.
Wave acquisition analyzer.

Figure 6.
Water level collector.
2.3.5. Hull Model Building
The different load conditions of the ship utilize iron ballast weights and instrument tests so that the ship model can meet draft, weight, gravity center position, mass moment of inertia, natural vibration cycle, and prototype similarity conditions. The main dimensions and related parameters of the actual ship and the ship model are shown in Table 1. This test assumes that the degree of ship loading is full load. The ship model uses the MG996R steering gear to maintain constant ship speed. The rudder is active: we set it to be fixed during the model tests and keep the ship straight during navigation. We focused on researching the transient interaction between the ship and the landside-induced tsunami. The specific parameters of the rudder are shown in Table 1. The rudder geometry is shown in Figure 7. Figure 7 also shows the photograph of the ship model, propeller geometry, rudder geometry, and the details of the self-propulsion system.

Table 1.
Primary parameters of the ship.
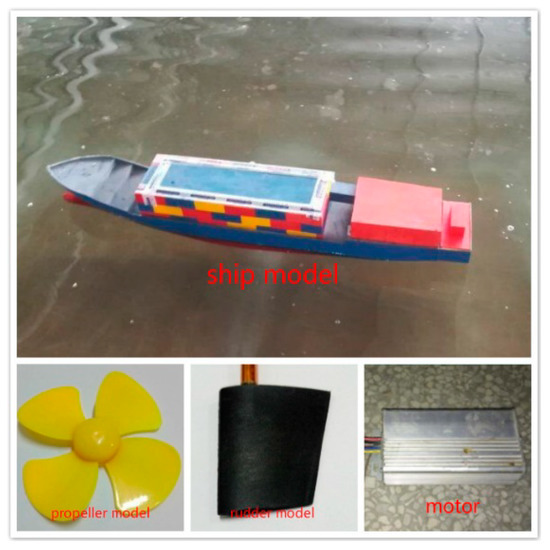
Figure 7.
Ship model.
3. Experimental Verification
A good dynamics model is essential for the successful design of the navigation and control systems of a ship. However, it is difficult to determine the relevant hydrodynamic forces, especially the added mass and the drag coefficients. At the same time, from the viewpoint of marine safety, it is of importance to evaluate the ship’s maneuvering performance at the initial design stage.
In the present study, the main object is a sailing ship, and the turning test is used as part of checking the maneuvering performance by evaluating the ability of the model ship to maintain or alter the direction of course in accordance with the operator’s intention. The characteristics of the rotary performance are acquired by the turning test, and subsequently, the steering, U-turn, and inward and outward abilities are studied in-depth.
3.1. The Turning Test
The maneuvering performance of the ship, in general, will be estimated in the fully loaded condition. The International Maritime Organization (IMO) has been discussing the establishment of ship maneuvering performance standards, and the recent preliminary results of this discussion have pointed out that these should consider the fully loaded condition as the first step [28]. The maneuvering characteristics are influenced considerably by effects of the loading condition, depending on ship type. For example, the turning circle when considered as the turning ability in the fully loaded condition is much larger than that in the ballast condition in some cases. Likewise, the turning circle in trim by the stern condition is larger than in the even keel condition.
To verify the validity of the model test, the maneuverability of the ship is decided by its steering, turning, collision avoidance, and other behaviors, which are closely related to the ship’s rotary performance. Therefore, the rotary performance of the ship is the only standard available to measure the maneuverability of the ship. The rotary test was performed in the laboratory of Chongqing Jiaotong University. The experimental tank is 50 m long and 30 m wide. The rotary program was written using Visual Basic language, and a Differential Global Positioning System (DGPS) was equipped within the ship to capture its position information during navigation.
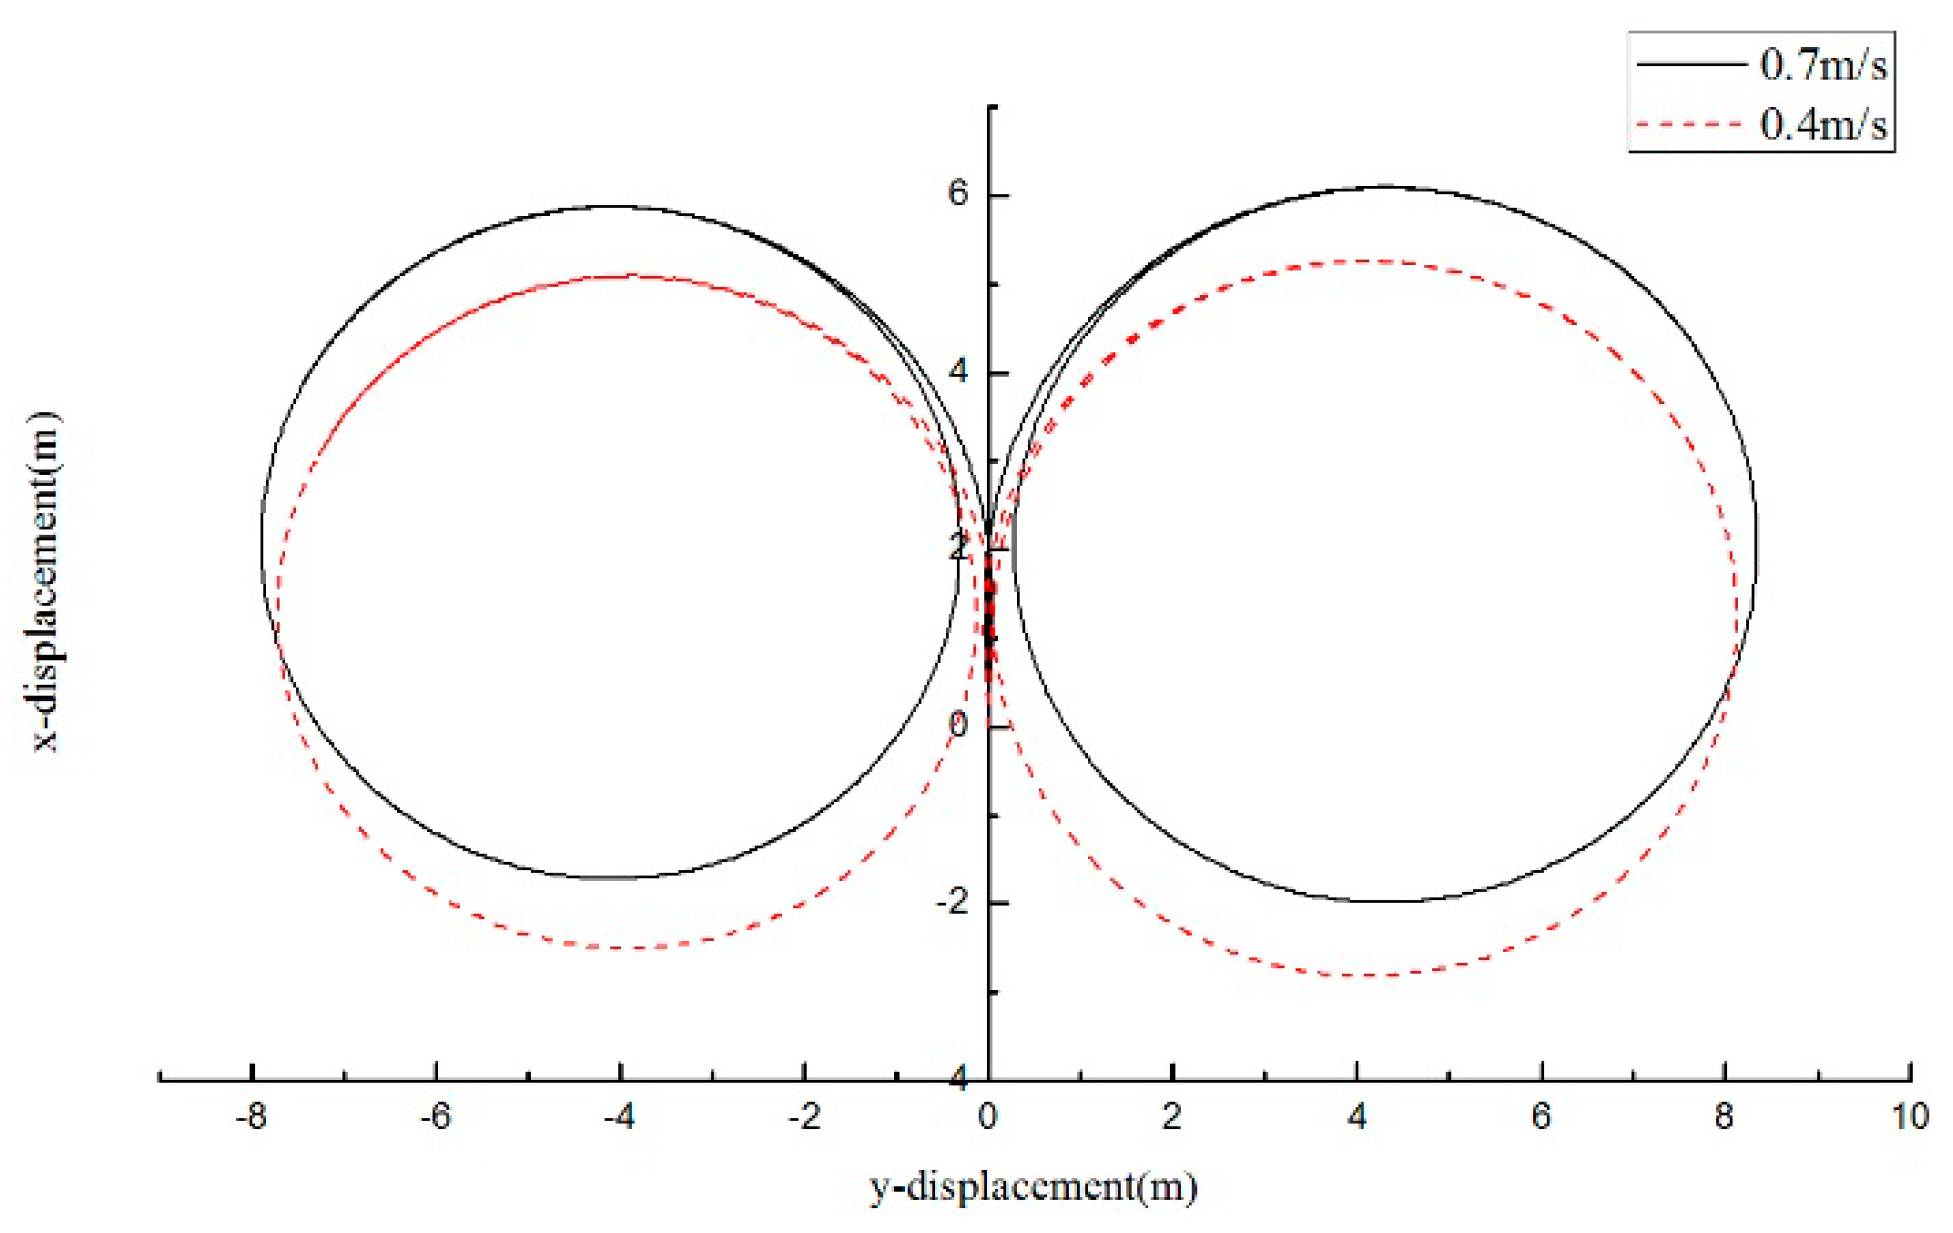
At the beginning of the model test, the angle of the rudder was controlled at zero, the ship was maintained in a straight line, and a signal was sent to change the rudder angle. Next, the ship model started to enter rotational motion, and the position information was recorded by DGPS during the model test. When the ship entered a stable state of rotation, the diameter of rotation was recorded. The data of the turning test in the state of 35°, at speeds of 0.4 m/s and 0.7 m/s, is shown in Figure 8. The ship model enters the steady state for a moment, at which time the trajectories of the left and right are symmetrical. The difference from the different navigable speeds is apparent.
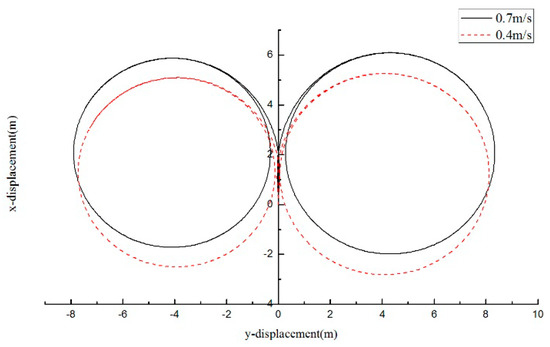
Figure 8.
Trajectory in the turning test recorded by Differential Global Positioning System (DGPS).
The turning test results from different rudder angles are shown in Table 2. It can be seen from the trajectory that indices such as the forward speed, the rudder angle, vertical intercept, horizontal intercept, and turning radius, which represent the turning characteristics of the model ship, should be analyzed on the basis of the turning trajectory measured [29].
Table 2.
Turning test data.
3.2. Free Attenuation Test
Roll decay tests in calm water were undertaken; they were mainly useful for the verification of the ship loading conditions. A common method of assessing the damping present in ship rolling motion is to perform a free decay experiment in which, in the absence of waves, the ship is given an initial roll amplitude and then released. By processing the resulting decaying oscillatory trace it is possible to estimate quantitatively the degree of damping, even when this is nonlinear. The freedom degree of the ship in the vertical plane exhibits the recovery characteristic. The ship model deviates from the position of equilibrium under an external loading. When the external force disappears, the ship will return to the original position, which depends on its own recovery characteristic. In a free roll decay test, the model is heeled in calm water to an initial heel angle and released; the model starts to perform free decaying oscillations with a frequency depending on the amplitude. Subsequently, the accuracy of the model test can be verified. The decay curve of the roll motion is shown in Figure 9. It can be seen from the test results that the decay of the ship meets the requirements of the loading condition, and the experimental data were used to tune the ship hydrodynamic inertia properties, the natural roll period, the roll damping, and the inertia.
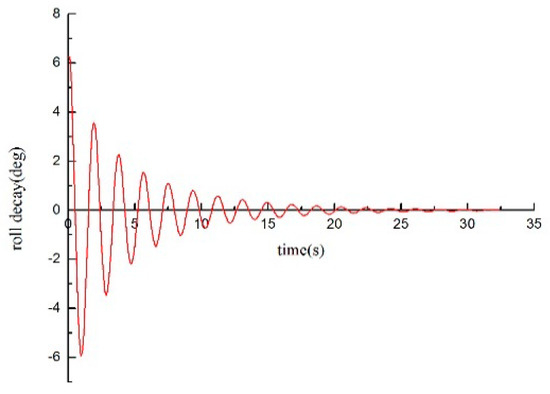
Figure 9.
Decay curve of the roll motion.
4. Study of the Characteristics of Landslide Surges in Rock Mass
The landslide-induced tsunami is divided into the initial wave and the wave, according to the particularity of the wave characteristics of the landslide-induced tsunami in the propagation process. The initial wave is the wave at the point when the landslide enters, and the wave is generated by the landslide directly in the process of energy exchange with the water body. The landslide-induced tsunamis along the way are waves that arrive at different locations on the river channel after the landslide has spread. These waves inherit the characteristics of the initial wave, but their wave characteristics differ from those of the initial wave for many reasons, such as propagation distance, topography of the river channel, and the bent shape of the river.
4.1. Rock Landslide Surge Test Conditions
An innovative system, based on a lifting device, has been employed for controlling the motion of the landslide model and, consequently, for generating impulsive waves. The experiments have been carried out in a parametric way by varying the volume of the landslide. In combination with the design considerations of landslide model design, the experiment is designed using a single-factor test scheme. Seven cases are considered, and their specific conditions are shown in Table 3. Figure 10 shows the dimension of the landslide rock.
Table 3.
Schedule of the model test.
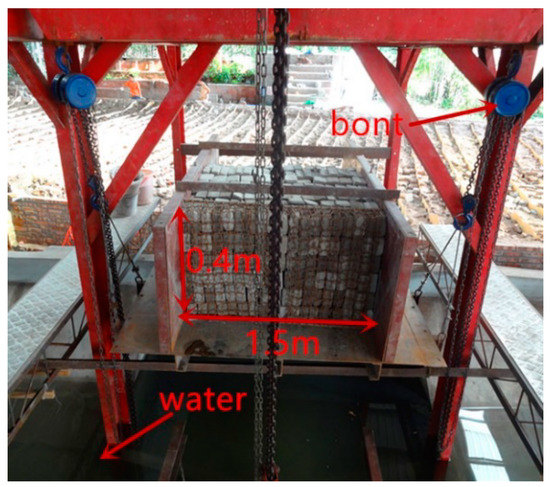
Figure 10.
Dimension of the landslide body.
4.2. The Formation and Propagation of Landslide-Induced Impulse Waves
The high-speed rockslide impact initiates an extremely unsteady energy conversion process. The complex phenomena that occur on macro-scale during this extremely unsteady process with high-speed rockslide impact, air cavity formation, impulse wave generation, and propagation are shown in the photo sequence of Figure 11.
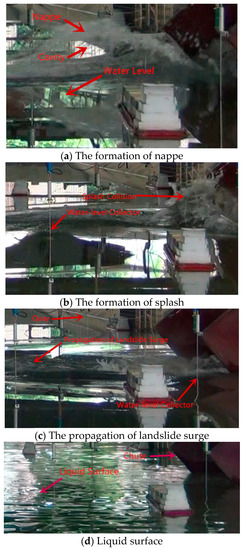
Figure 11.
The formation and propagation of a landslide surge.
The whole process of a sliding impact may be subdivided into several main stages—rock impact, impact crater formation and wave generation, and impact crater collapse with rockslide run-out. The impact stages overlap and their transition from wave generation to propagation and run-up is fluent. The landslide body is sliding into the water, and the water surface is impacted at the channel bottom. Flow separation on the rockslide shoulder due to fast slide penetration into the water body creates a large air cavity on the back of the granular slide. During this separation stage three phases with sharp borderlines may be distinguished: water, granular material, and air (Figure 11a). In large scale events the splash would break up and is expected to reach less high (Figure 11b). The subsequent impact crater collapse during slide run-out along the channel bottom causes a massive displacement of air and water (Figure 11c). As the large nonlinear wave propagates outwards, the splash hits the wave crest. Simultaneously, the backward flow runs up the slide ramp. Thereafter the run-down generates a second outward travelling wave and the energy of the landslide-induced wave decreases gradually in the process of propagation. Eventually, the water surface returns to calm (Figure 11d).
4.3. Study of Landslide-Induced Tsunami Characteristics at Different Locations
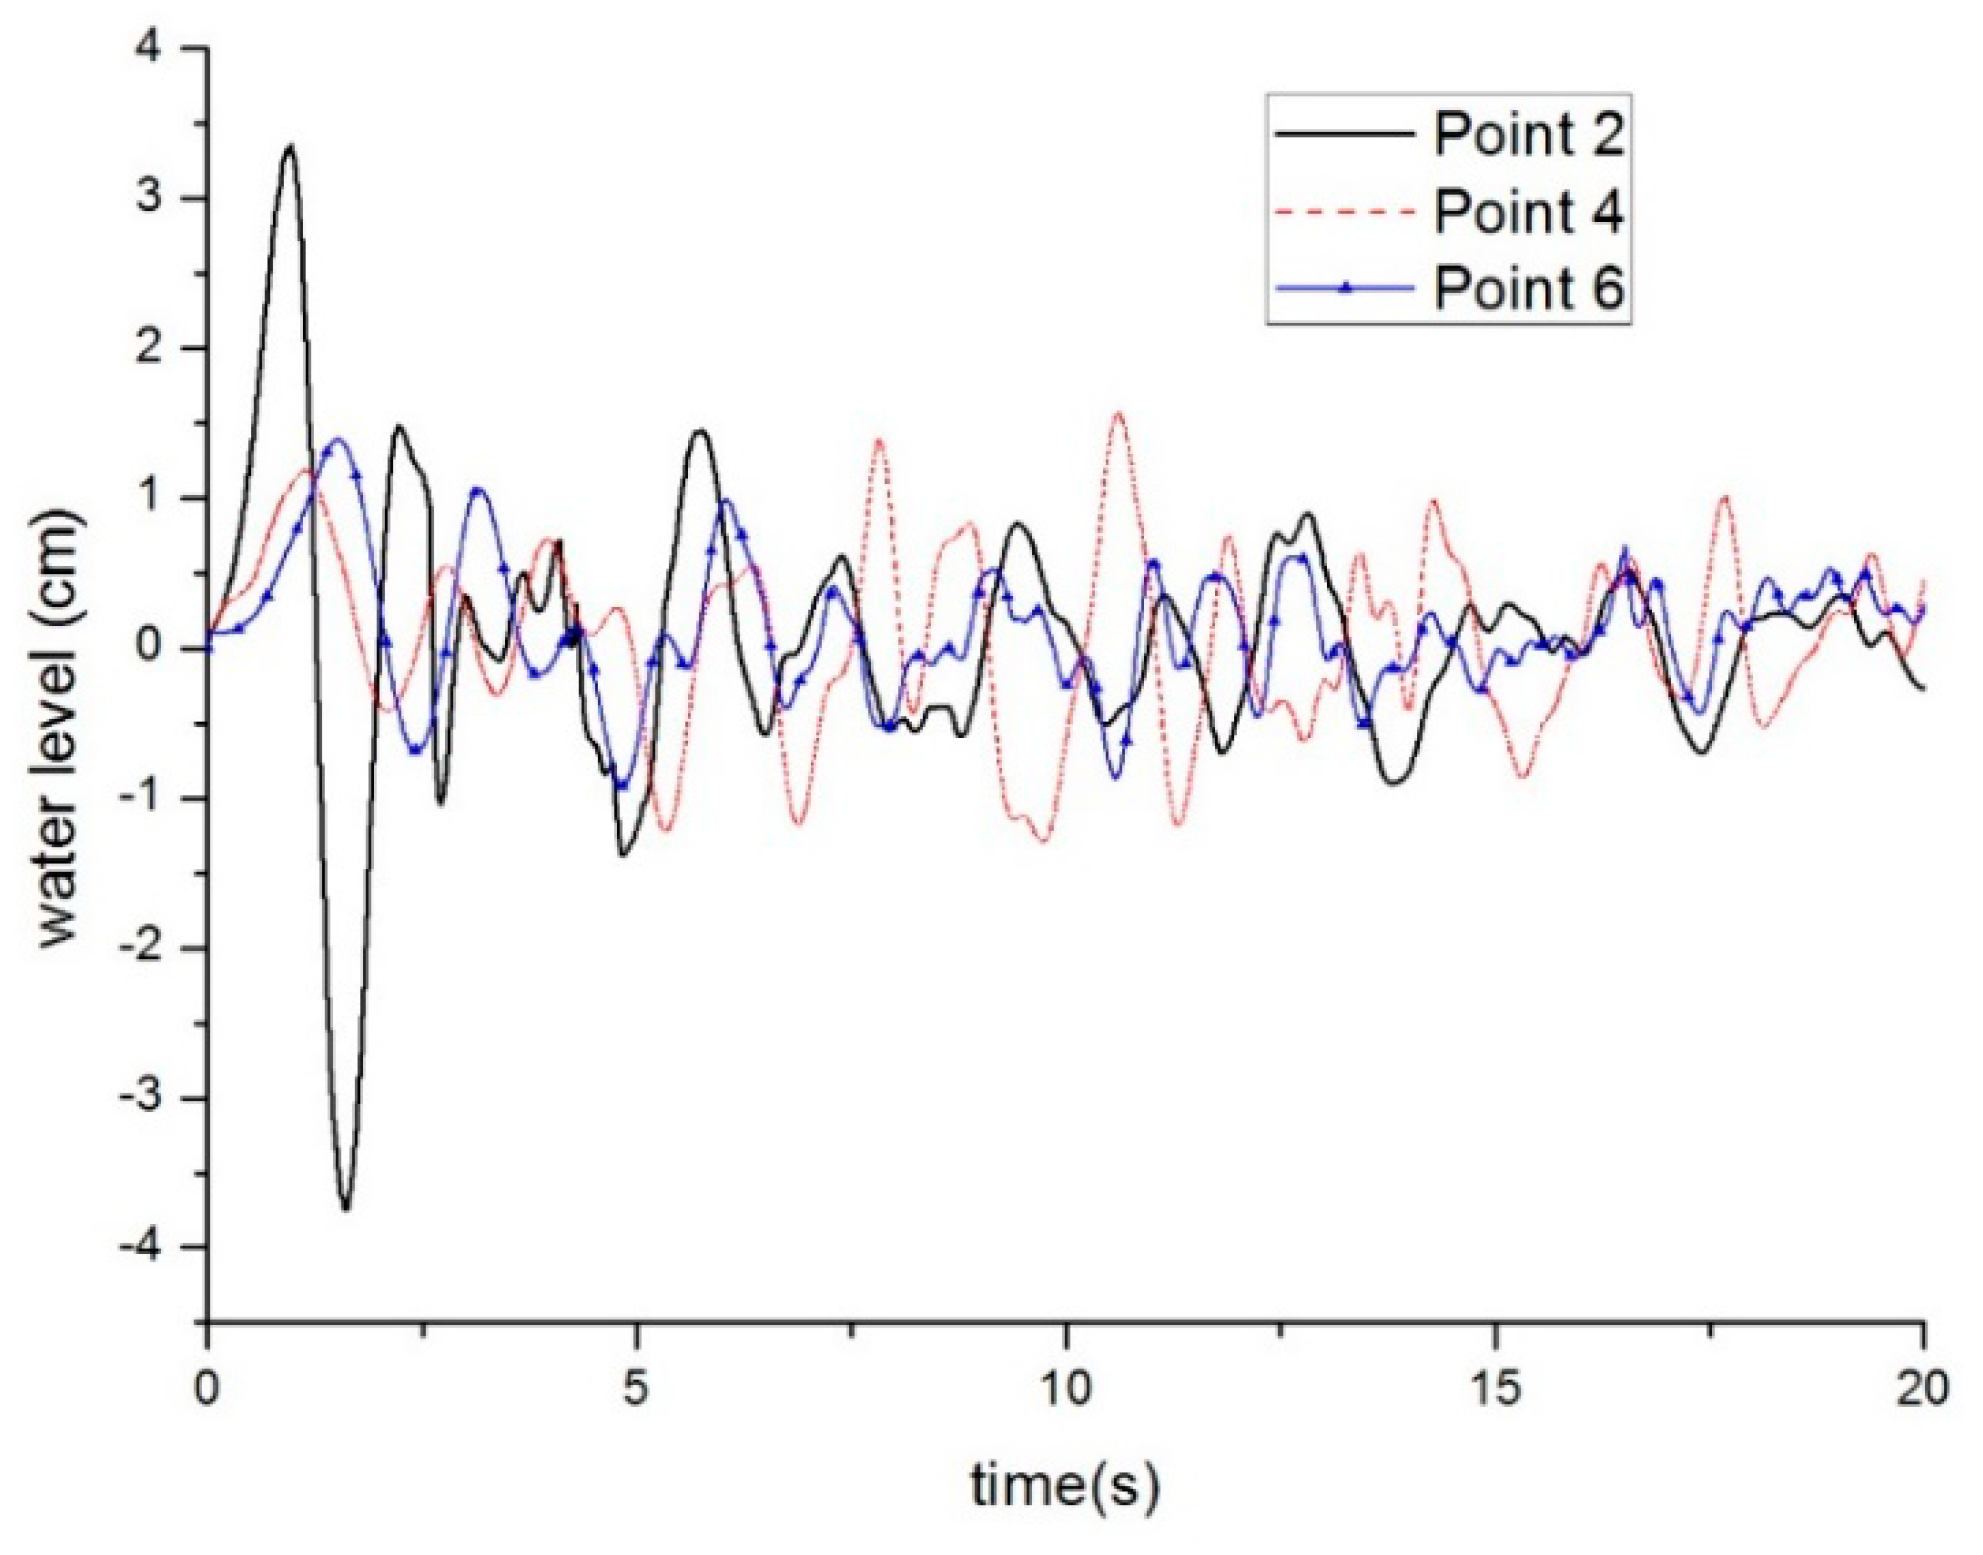
According to the layout of the measuring points during the test, the No. 2, No. 4, and No. 6 measuring points are 2.8 m away from the landslide point, and the propagation characteristics of the landslide-induced tsunami at the same distance and at different positions are studied.
Figure 12 shows the sequence of images collected during the experiments. The No. 2 monitoring site is located on the landslide section, the No. 4 monitoring site is located on the area of the straight river, and the No. 6 monitoring site is located on the area of the river bend. Figure 12 illustrates that, after the landslide body enters the water, it interacts with the water body to generate a landslide-induced tsunami, and the waves scatter and propagate in all directions. The landslide-induced tsunami reaches the No. 2 monitoring point, and the No. 2 measuring point surge rapidly reaches its peak at t = 1.51 s. The first generated wave always has a first crest followed by a though. The main reason for this phenomenon is that the landslide body enters the water along the cross section of the river, rapidly moves the water body, and causes a change in the water level. Consequently, the landslide-induced tsunami travels at different speeds in different locations within the channel reservoir. The peak value of No. 2 monitoring point is greater than those of No. 4 and No. 6 monitoring points. The landslide-induced tsunami gradually attenuates in the propagation process, the peak value gradually decreases, and the impact on buildings in the channel reservoir gradually decreases.
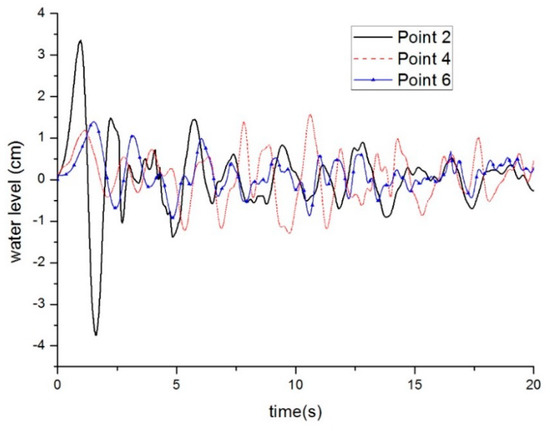
Figure 12.
Variation curve of the case 7 water level in different positions.
4.4. Study of the Landslide-Induced Tsunami Characteristics of a Landslide Body with Different Thickness Values
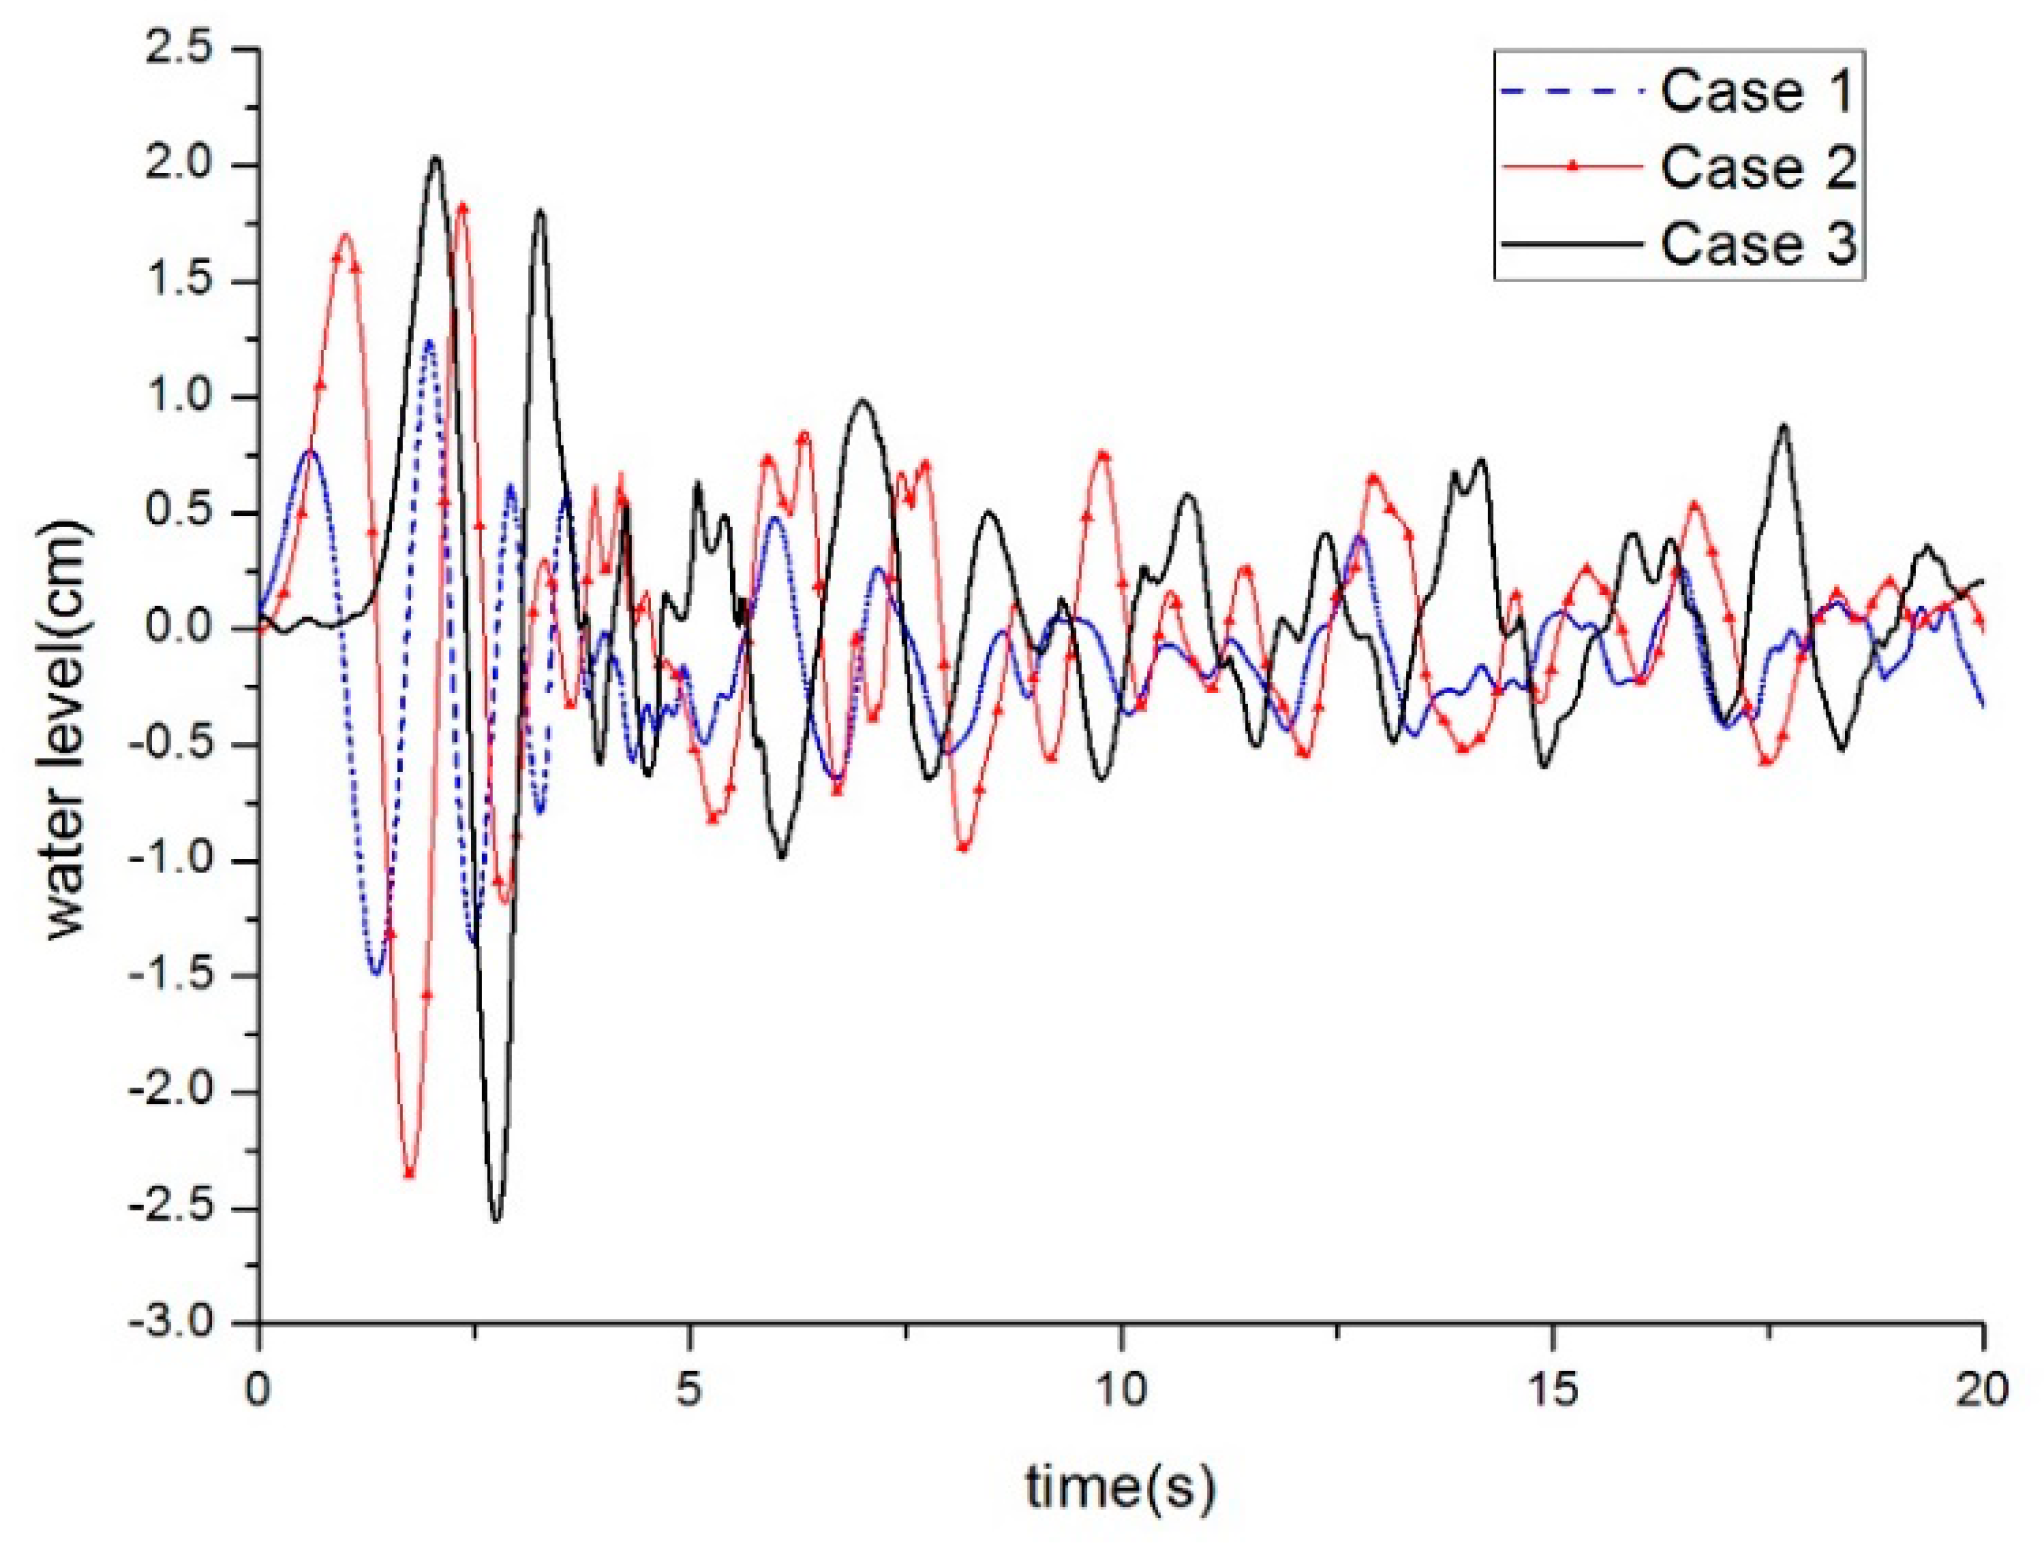
The landslide-induced tsunami characteristics generated by landslides with the same lengths and widths but different thickness values are studied. The changes in water level at monitoring point 2 with landslide thickness values of 0.2, 0.4, and 0.6 m are compared.
As shown in Figure 13, the wave heights generated by the landslides with different thickness values are different. The maximum water level and the minimum water level at each case are reported. The landslide-induced tsunami height increases as the thickness of the landslide body increases. Large thickness of the rock slope equates to large rock slope volume, high initial energy of the rock slope into water, high energy transferred to water during the exchange process, and highly intense movement of the water level. The landslide-induced tsunami generated by the landslide body entering water under any working condition also has a large initial wave height at t = 2.02 s. The energy during the propagation process decreases gradually and stabilizes in a stable state.
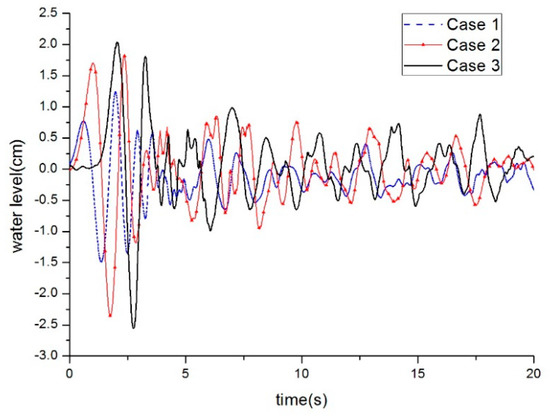
Figure 13.
Variation curve of the water level at point 2 with different thickness values.
The variation curve of case 2 and case 3 are similar, whereas case 1 is slightly different. The main reason for this is that the volume of the landslide body is small, and there is more loss of energy in the process of formation and propagation. At the same time, tsunamis generated by deformable granular landslides are physically modeled in a three-dimensional tsunami wave basin based on the generalized Froude similarity. The first wave amplitude is formed with the sliding of a partial landslide. Case 1 also shows the larger peak in the initial stage, and the water level gradually decreases with the increase of time.
4.5. Study of the Landslide-Induced Tsunami Characteristics of Landslides with Different Widths
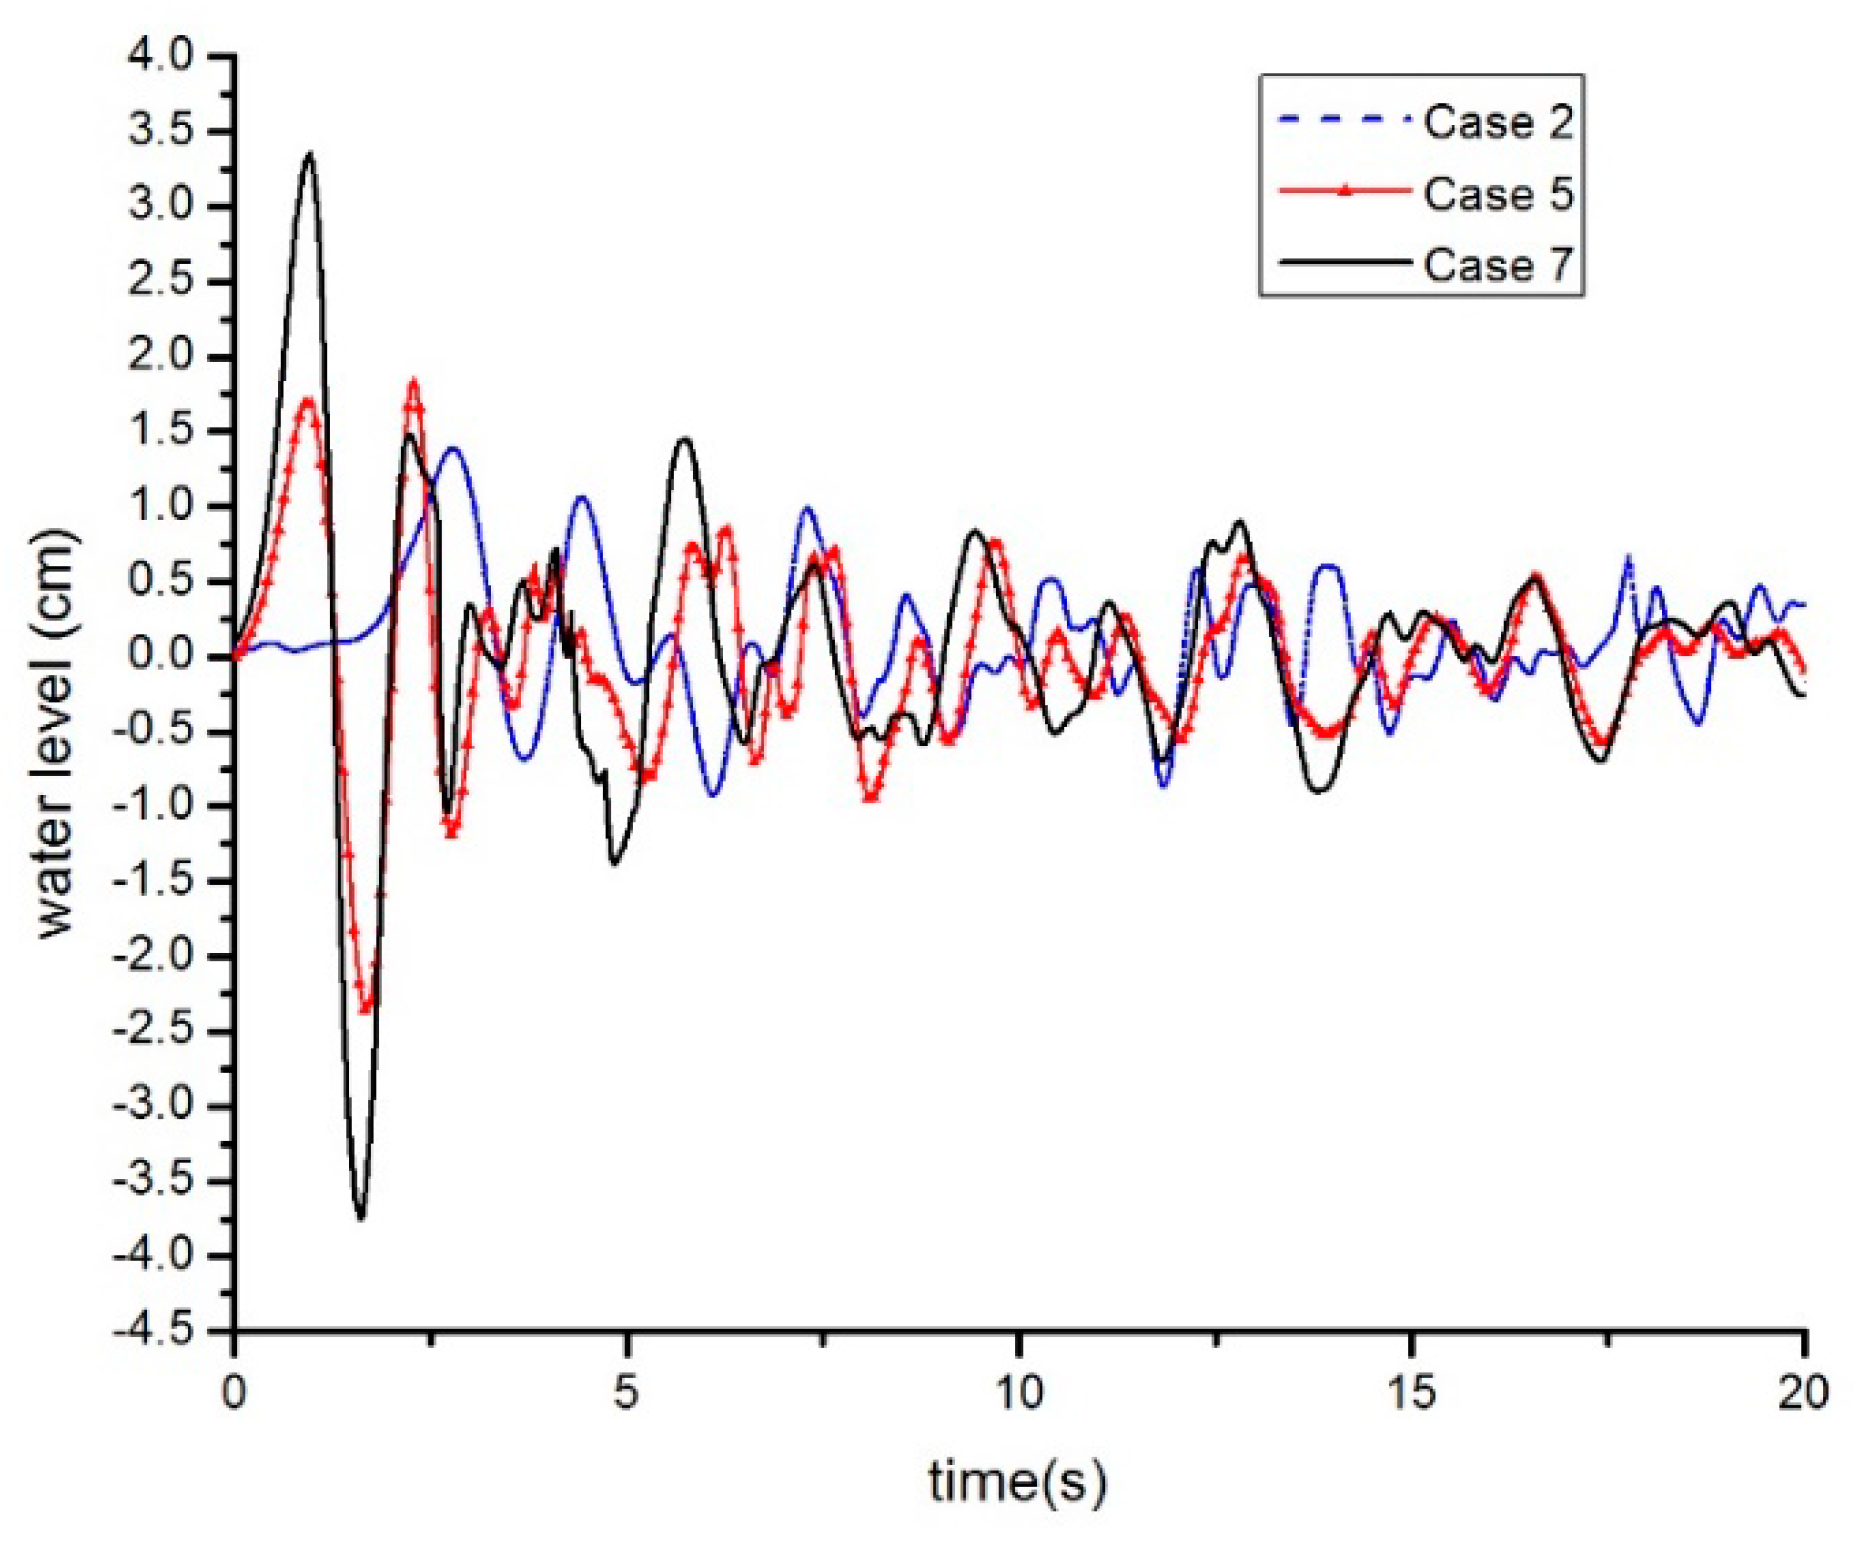
The landslide-induced tsunami characteristics generated by landslides with the same length and thickness but different widths are studied. The changes in the water level of the monitoring sites at rock masses with landslide widths of 0.5, 1, and 1.5 m are compared, as shown in Figure 14.

Figure 14.
Water level at point 2.
This shows that the maximum wave height and the sliding body width increase linearly with the same water depth and the same bank slope angle. With the increase in the width of the landslide body, a large volume results in high initial energy of the landslide body into the water. The energy exchange process between the landslide body and the water body is also sufficient. During the exchange, the energy transmitted to the water increases. The greater the intensity of the water spot movement, the greater the effective solid–liquid interface and the overall kinetic energy during the energy exchange process are, the higher the energy exchange rate is, and the greater the maximum wave height is. The instantaneous maximum water level reached 3.98 cm, and the prototype data is 2.79 m.
Figure 14 shows case 5 has a very large peak after a few seconds, whereas case 7 does not present a similar behavior. The main reasons for this are as follows.
The first reason is that case 5 is an example that illustrates the impulse waves generated by three-dimensional deformable granular landslides into shallow waters. The deformable granular landslide moved rapidly after it was released, and a water jet flow was formed when the front edge of the landslide collided with the water body, followed by the formation of the leading wave.
The second reason is that the deformable granular landslide interacts with the water for a very short time because the water body is shallow, which allowed only a short duration of energy exchange between the water body and the deformable granular landslide. Two bigger wave peaks may be formed before the deformable granular landslide stops: one occurs when the front edge of the deformable granular landslide hits the surface of the water body, and the second occurs when the deformable granular landslide is completely submerged. As shown by data from the wave gauges, the first two wave peaks in the wave train are relatively large, which is in line with the results of referenced experiments [30].
The third reason is that uncertainty analysis has been carried out for the experiments: three experiments were performed for this group, and the water level of the initial wave was acquired. Subsequently, the average values of those data were calculated as the experimental values of the results for this group.
The fourth reason is that the local area of the deformable granular landslide occurs in the second collapse.
4.6. A Comparative Discussion of the Model Results for Different Configurations
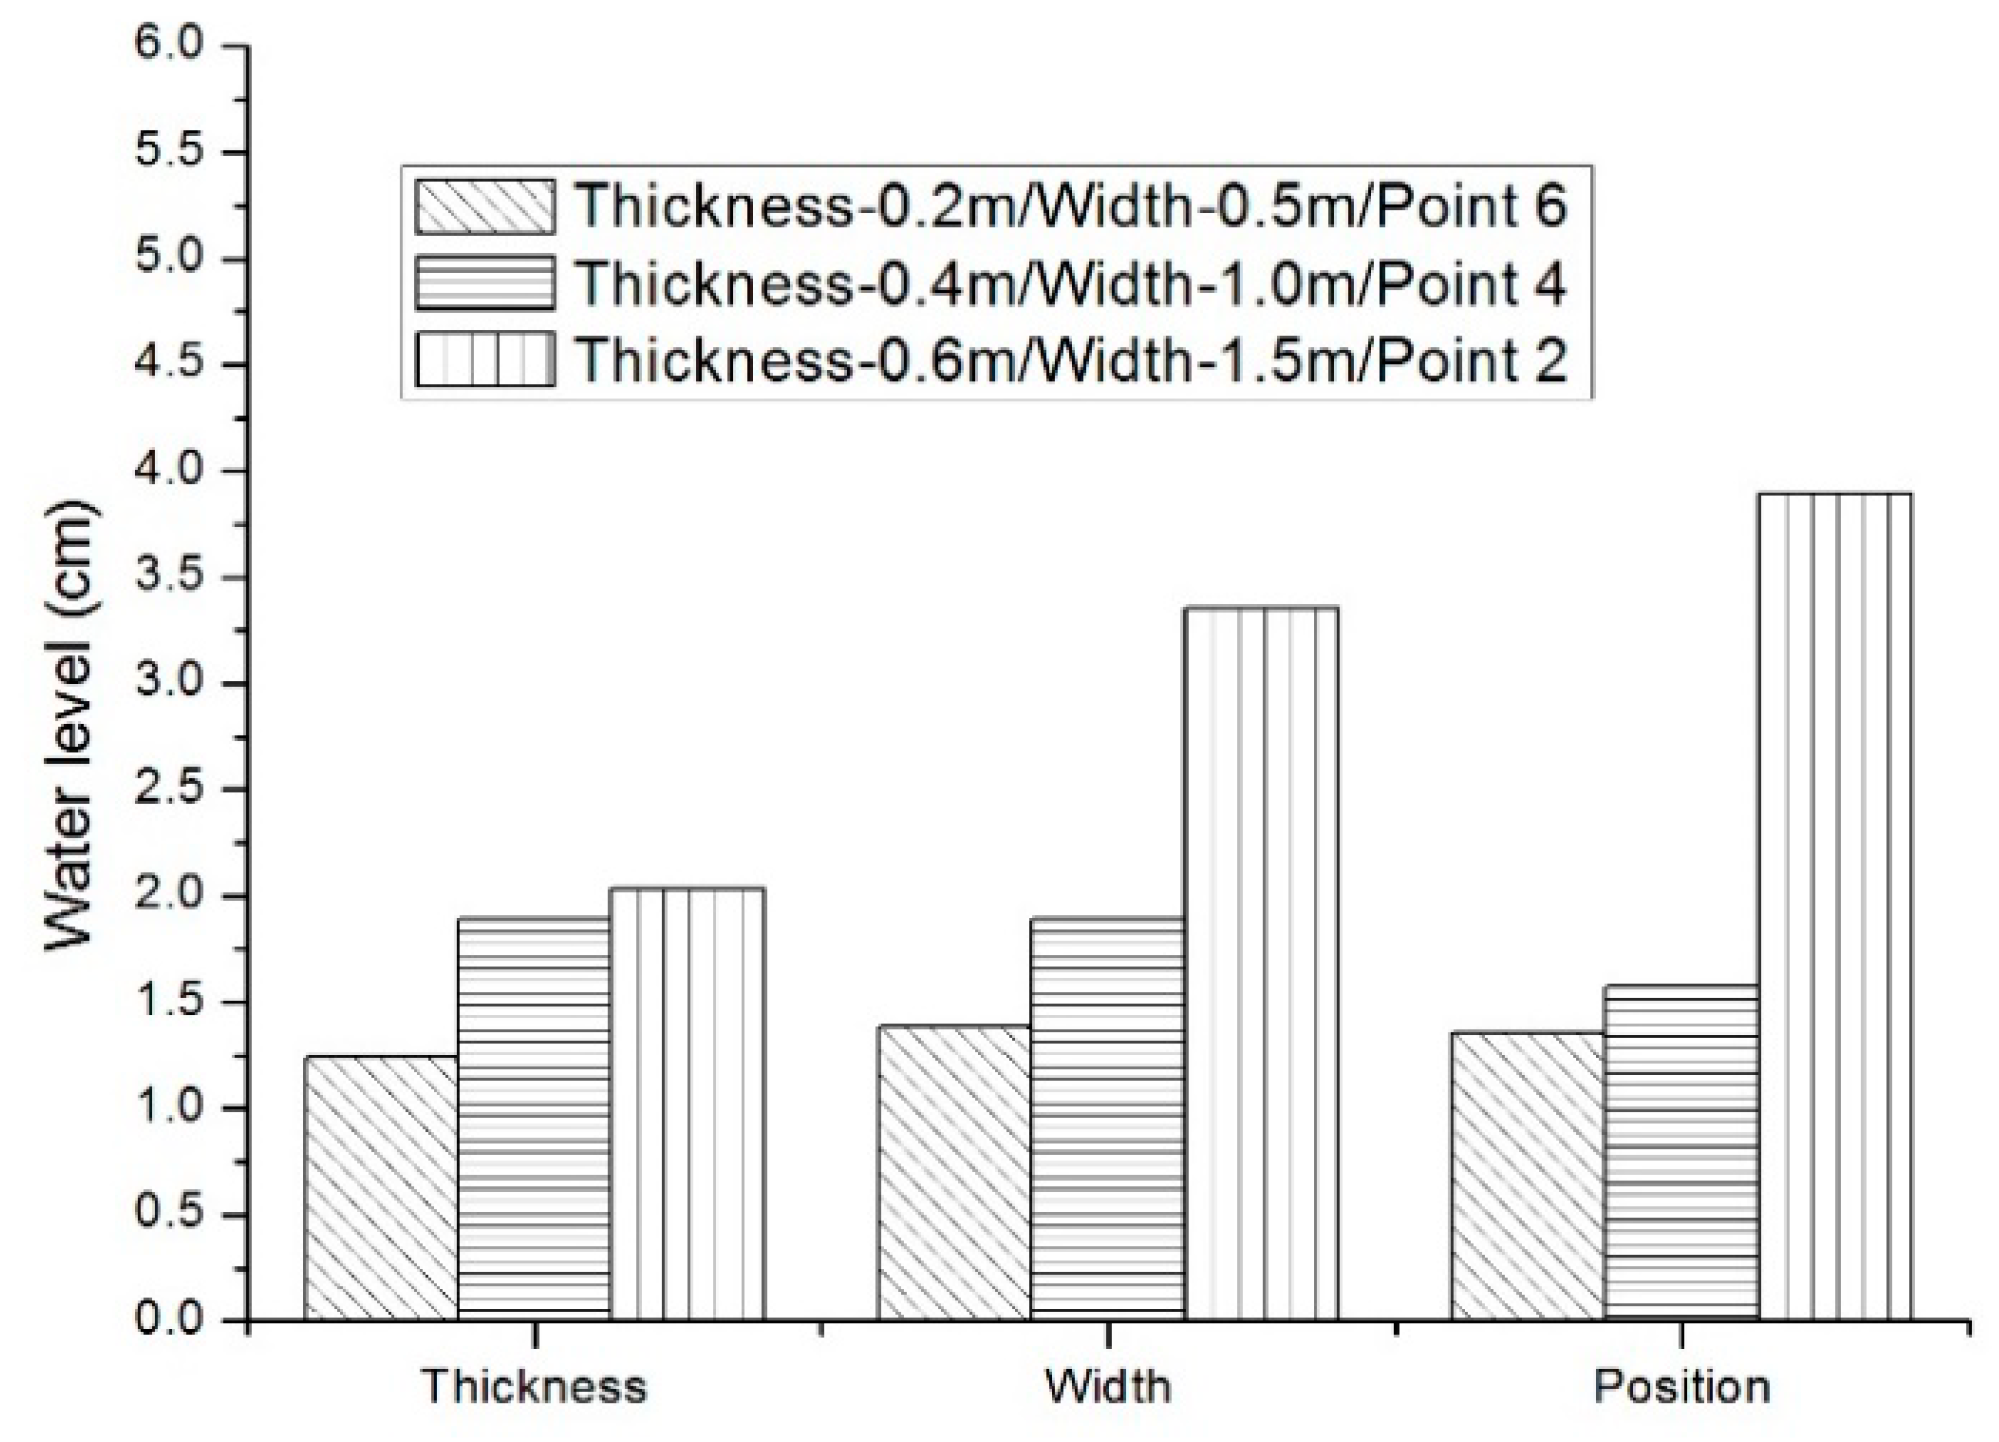
In this section, the comparative discussion of the model results for different configurations is presented. We focus on the influence of the thickness, the width, and the location.
All the results obtained for the seven cases and by using different values of volume, for a total of 21 experiments, have been plotted together in order to check for the maximum. Figure 15 shows the water level of the different configurations used during the experiments. The water level of the landslide-induced tsunami increases gradually with the increase of the thickness and width of the landslide body. On the contrary, it decreases with the decrease of distance between the entry point and the monitoring point.
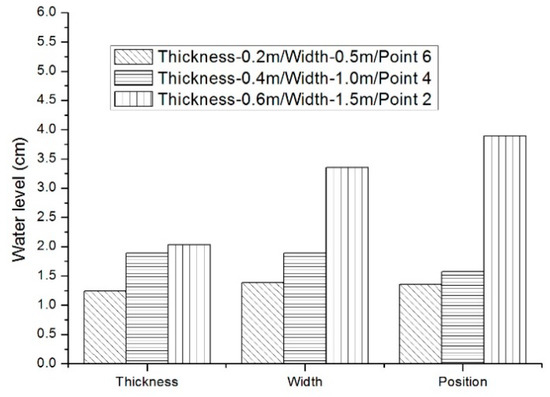
Figure 15.
Comparative results for different configurations.
5. Impact of Landslide-Induced Tsunamis on the Motion Characteristics of a Sailing Ship
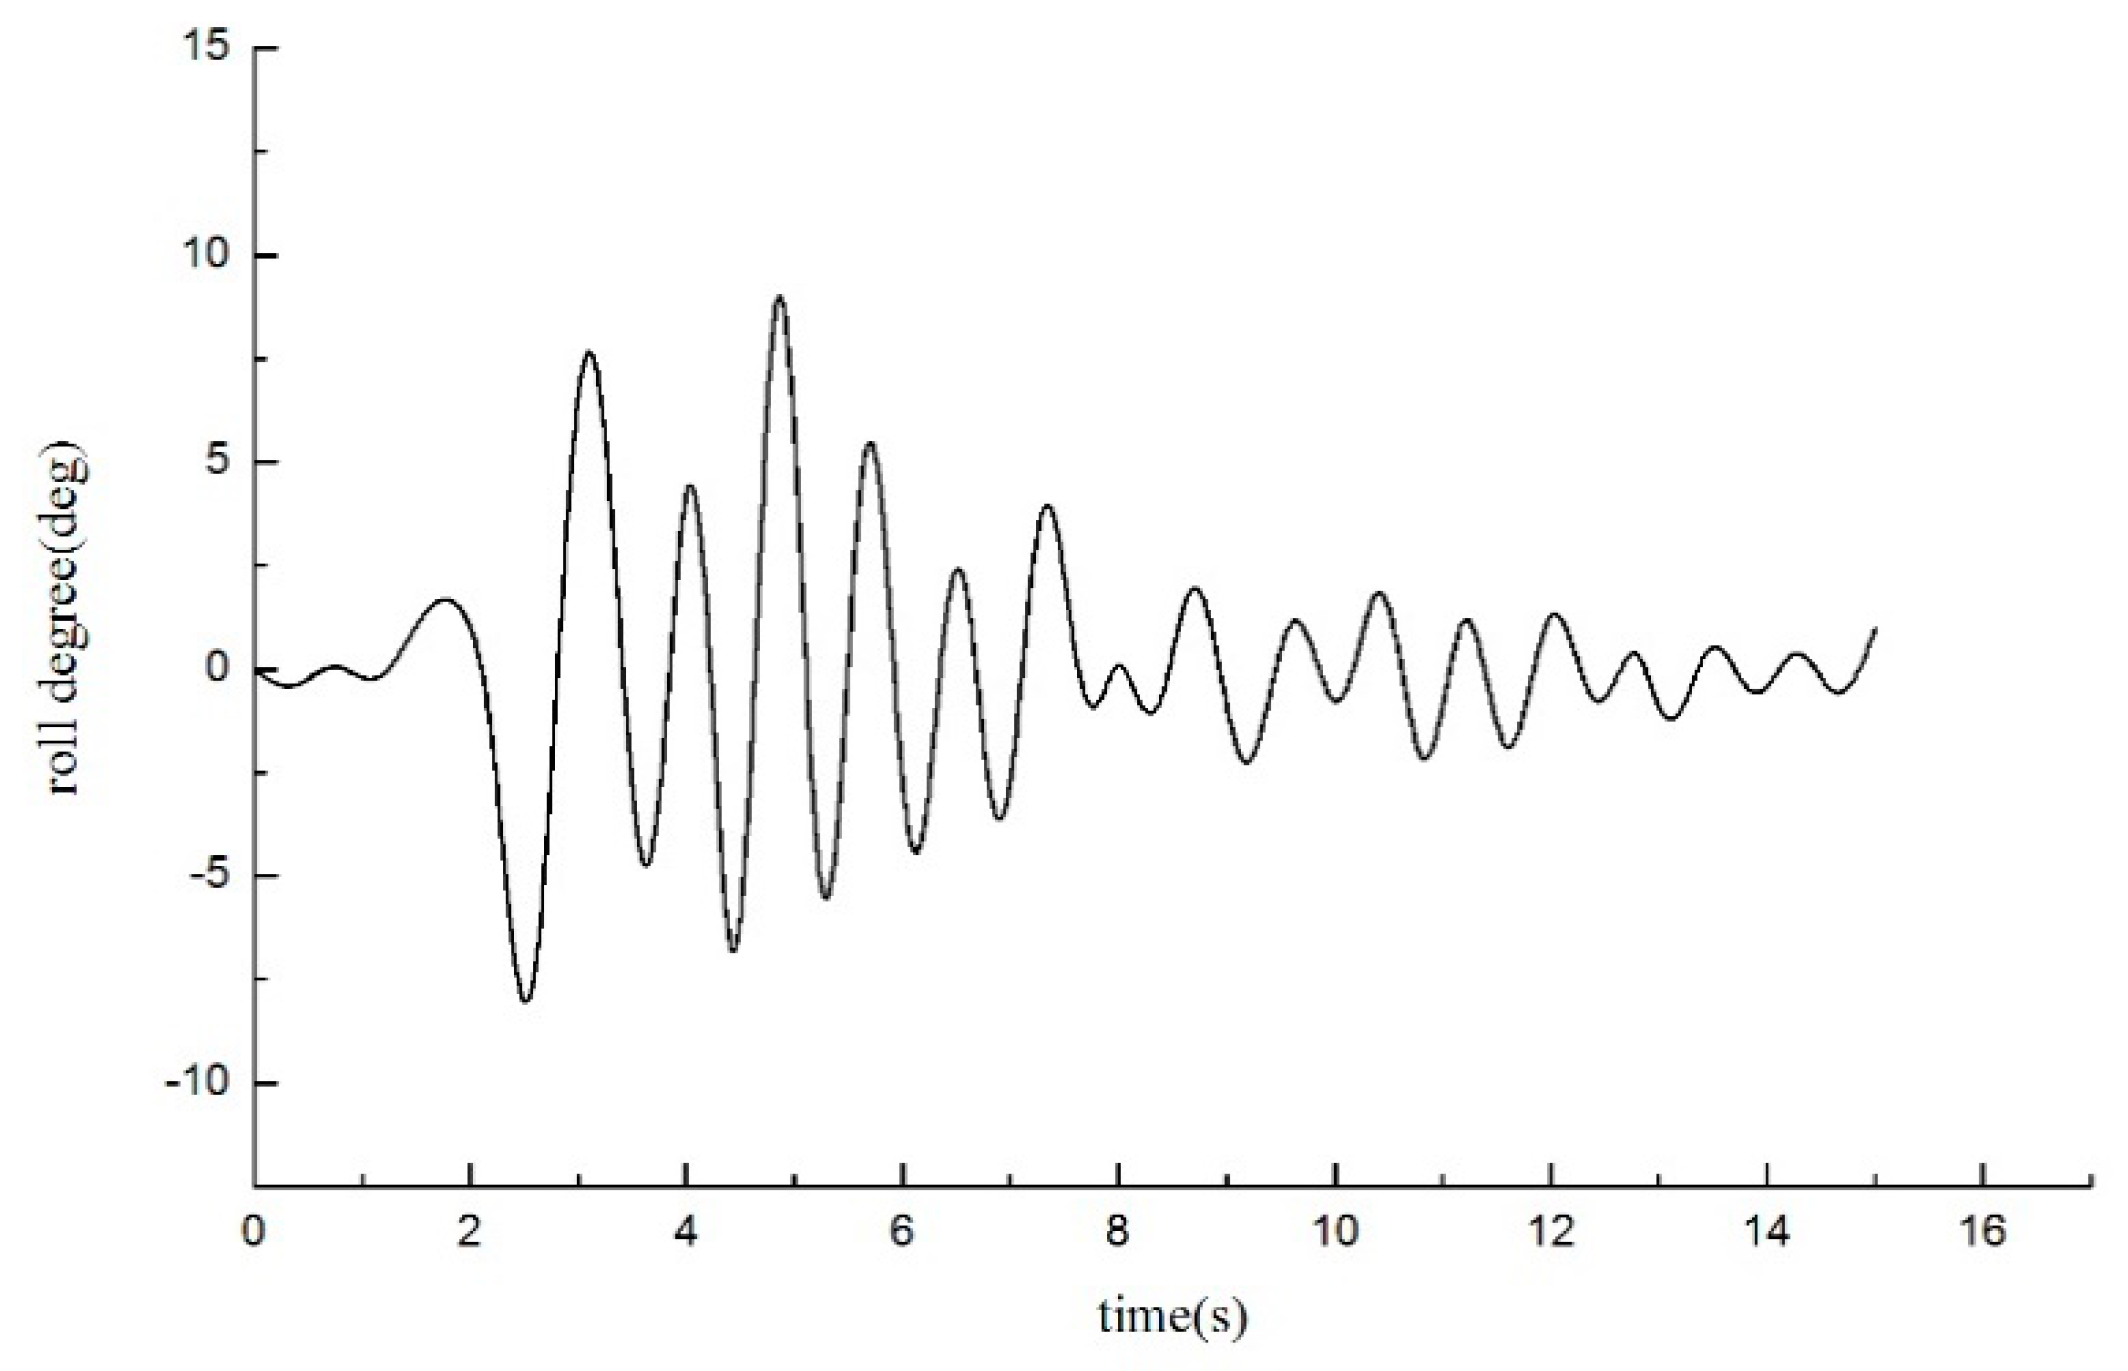
A ship’s movement changes after the ship experiences a landslide-induced tsunami. The wave generated by a landslide differs from a general wave, and the occurrence of a landslide-induced tsunami involves a certain degree of abruptness. This study considers the characteristics of a ship’s navigation speed in the region. The constant speed of the ship model is set to 0.4 m/s according to the scale ratio of the test model. The ship’s characteristics in terms of roll and pitch are studied according to the rules for the construction and technical regulation for the statutory survey of a river vessel.
Roll is, in fact, a lightly damped and lightly restored motion, and the roll natural period of a conventional ship is very close to the richest region in the wave energy spectrum. A very large amplitude of the roll motion can then occur, even in a moderate sea state, if the wave frequency spectrum is narrow and tuned with the ship’s roll natural period. As shown in Figure 16, the ship’s constant speed navigation route designed in this study is located at the bottom of the landslide point. That is, the most dangerous situation is that the same landslide volume produces a landslide-induced tsunami. Figure 16 demonstrates that at the initial moment, the landslide body begins to slide into the water at a high speed and the landslide body interacts with water. As the action time course continues, the sliding body enters the water to generate a landslide-induced tsunami, and the scattering propagation interacts with the ship. The effect eventually causes the ship’s movement response amplitude to change. One second before the ship steadily sails in still water, the roll angle of the ship gradually increases after encountering a surge, and the roll angle reaches the maximum at 5 s. The ship’s roll angle gradually decreases due to the effect of the restoring moment. During the entire voyage of the ship, the roll amplitudes increased dramatically due to the resonance effects when the incident wave period coincided with the free decay roll period of the ship. The maximum roll angle of the ship does not exceed 14°, which is within a safe and reasonable range. During the ship’s navigation, the ship is subjected to the impact of surge waves, which is superimposed on the other side of the ship after the reflection of the surge on the opposite shore. Therefore, when the amplitude of the roll motion of the ship changes, it is straightened by the reverse wave force: the angle then decreases.

Figure 16.
Roll curve of the ship in case 7.
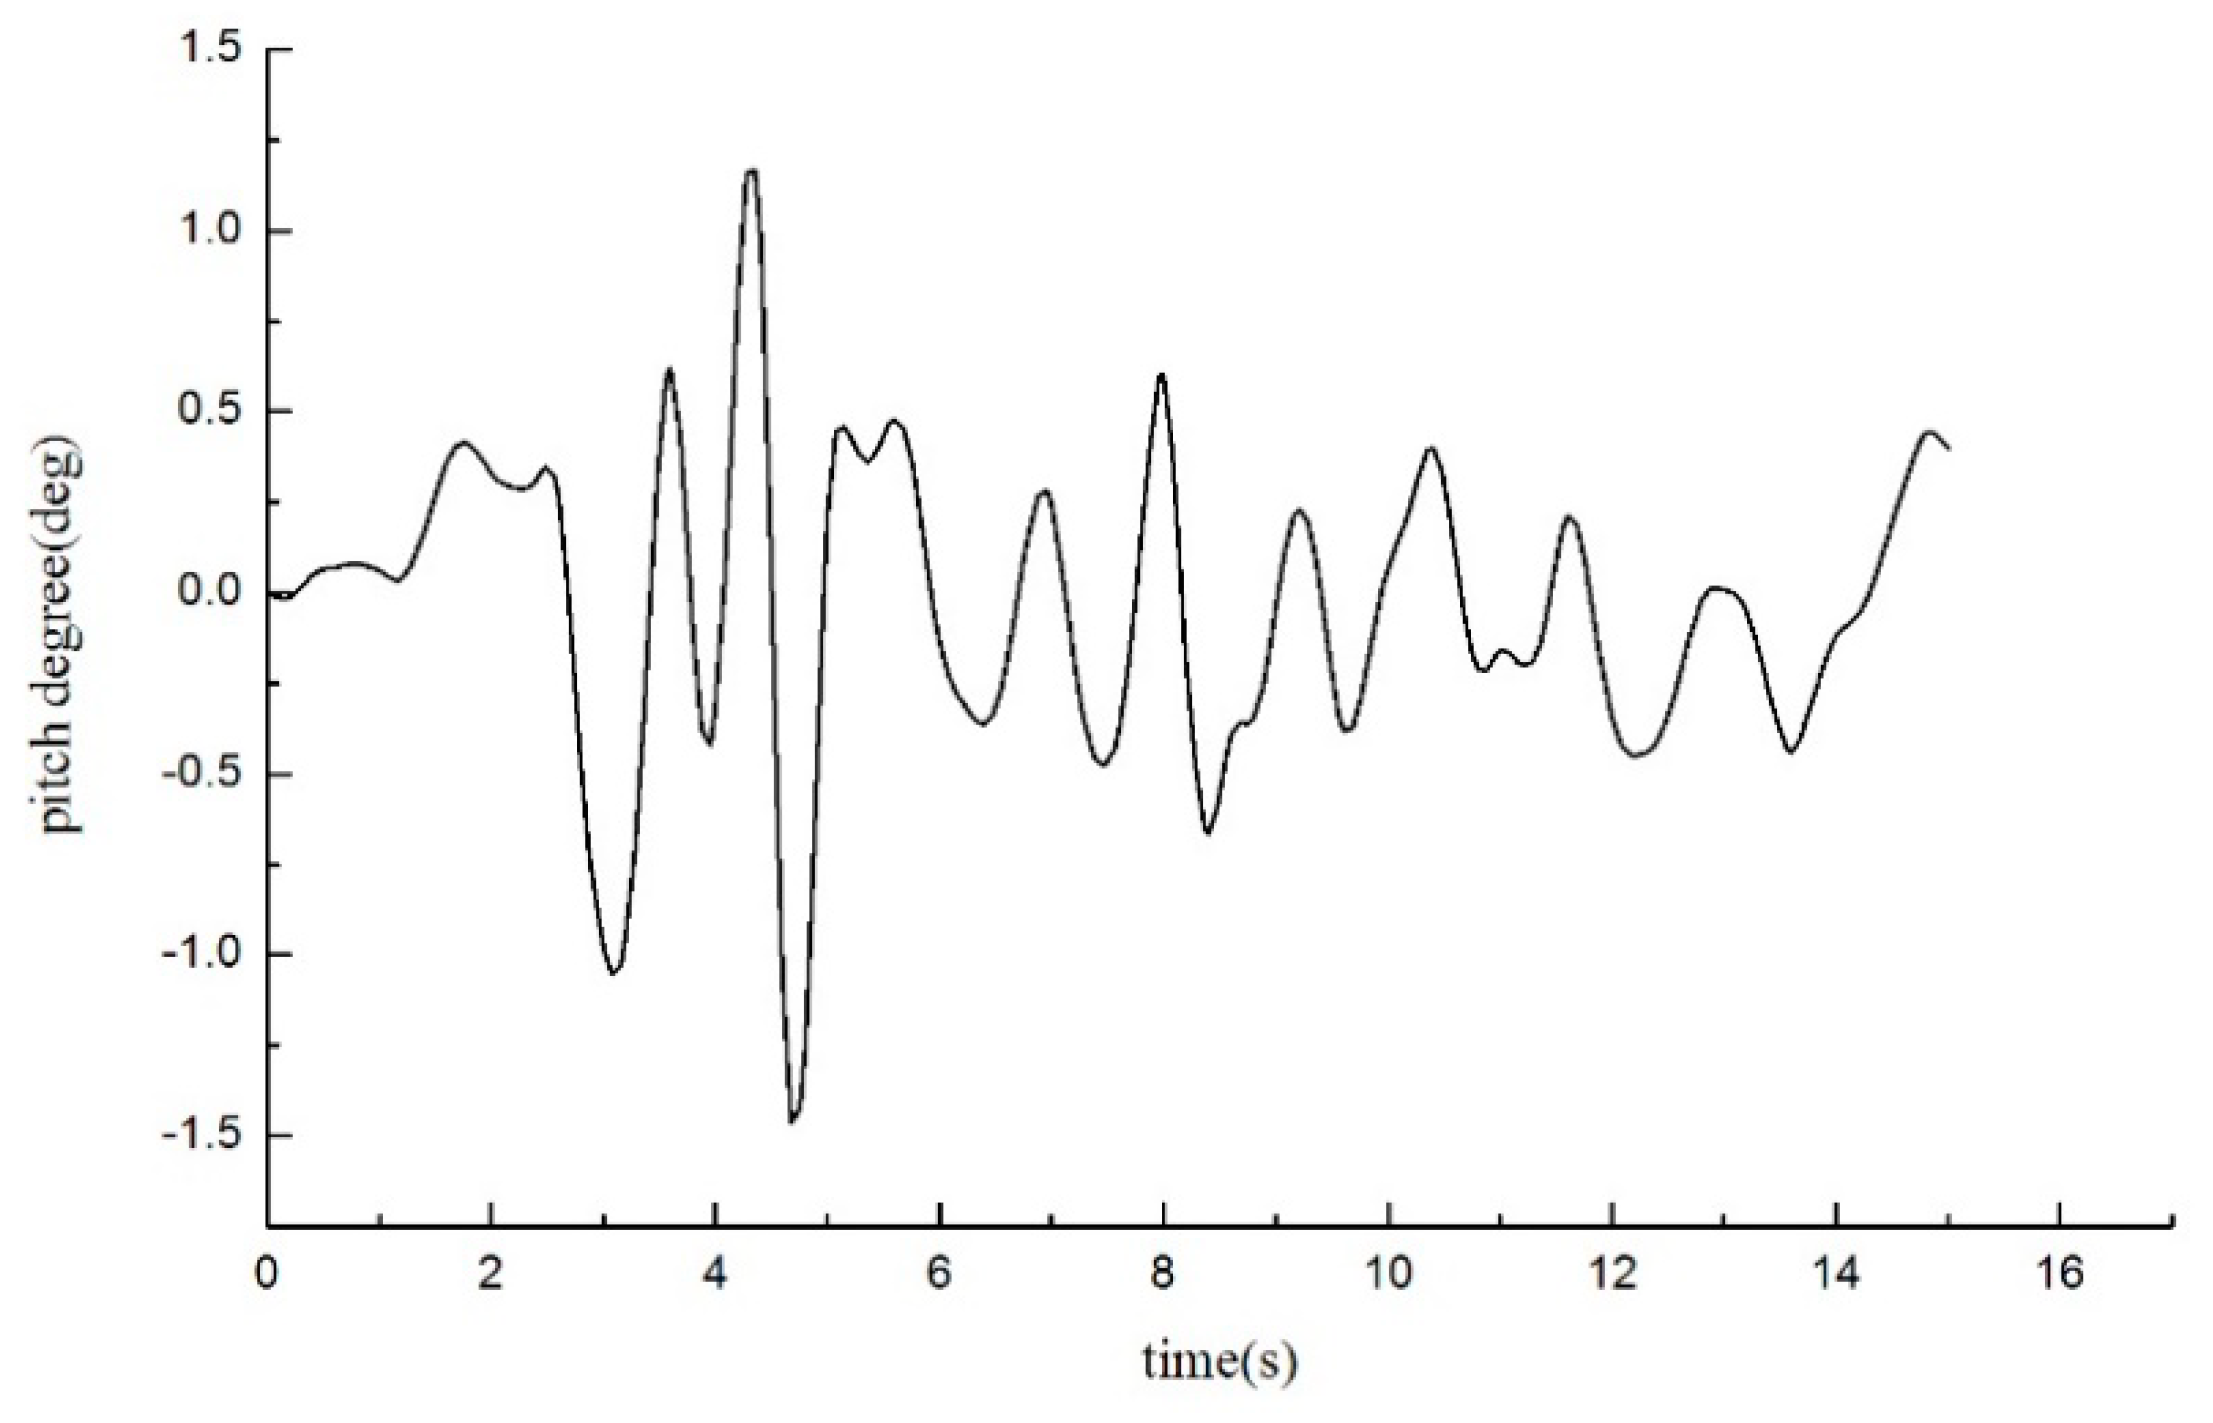
The response of the ship’s roll motion is similar to the pitch motion response. It is interesting to note that the pitch amplitude begins to decline when the incident wave period is further increased. The amplitude of ship motion changes 1 s after the landslide, and the time of the pitch motion response reaches the maximum at 4.5 s. The pitch amplitudes increased sharply when the incident wave period was close to the free decay pitch period of the ship. The maximum amplitude of the pitch response of the ship does not exceed 2°, which is within a safe and reasonable range, as shown in Figure 17.
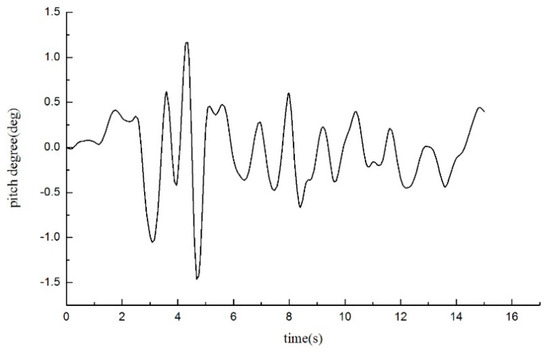
Figure 17.
Pitch curve of the ship in case 7.
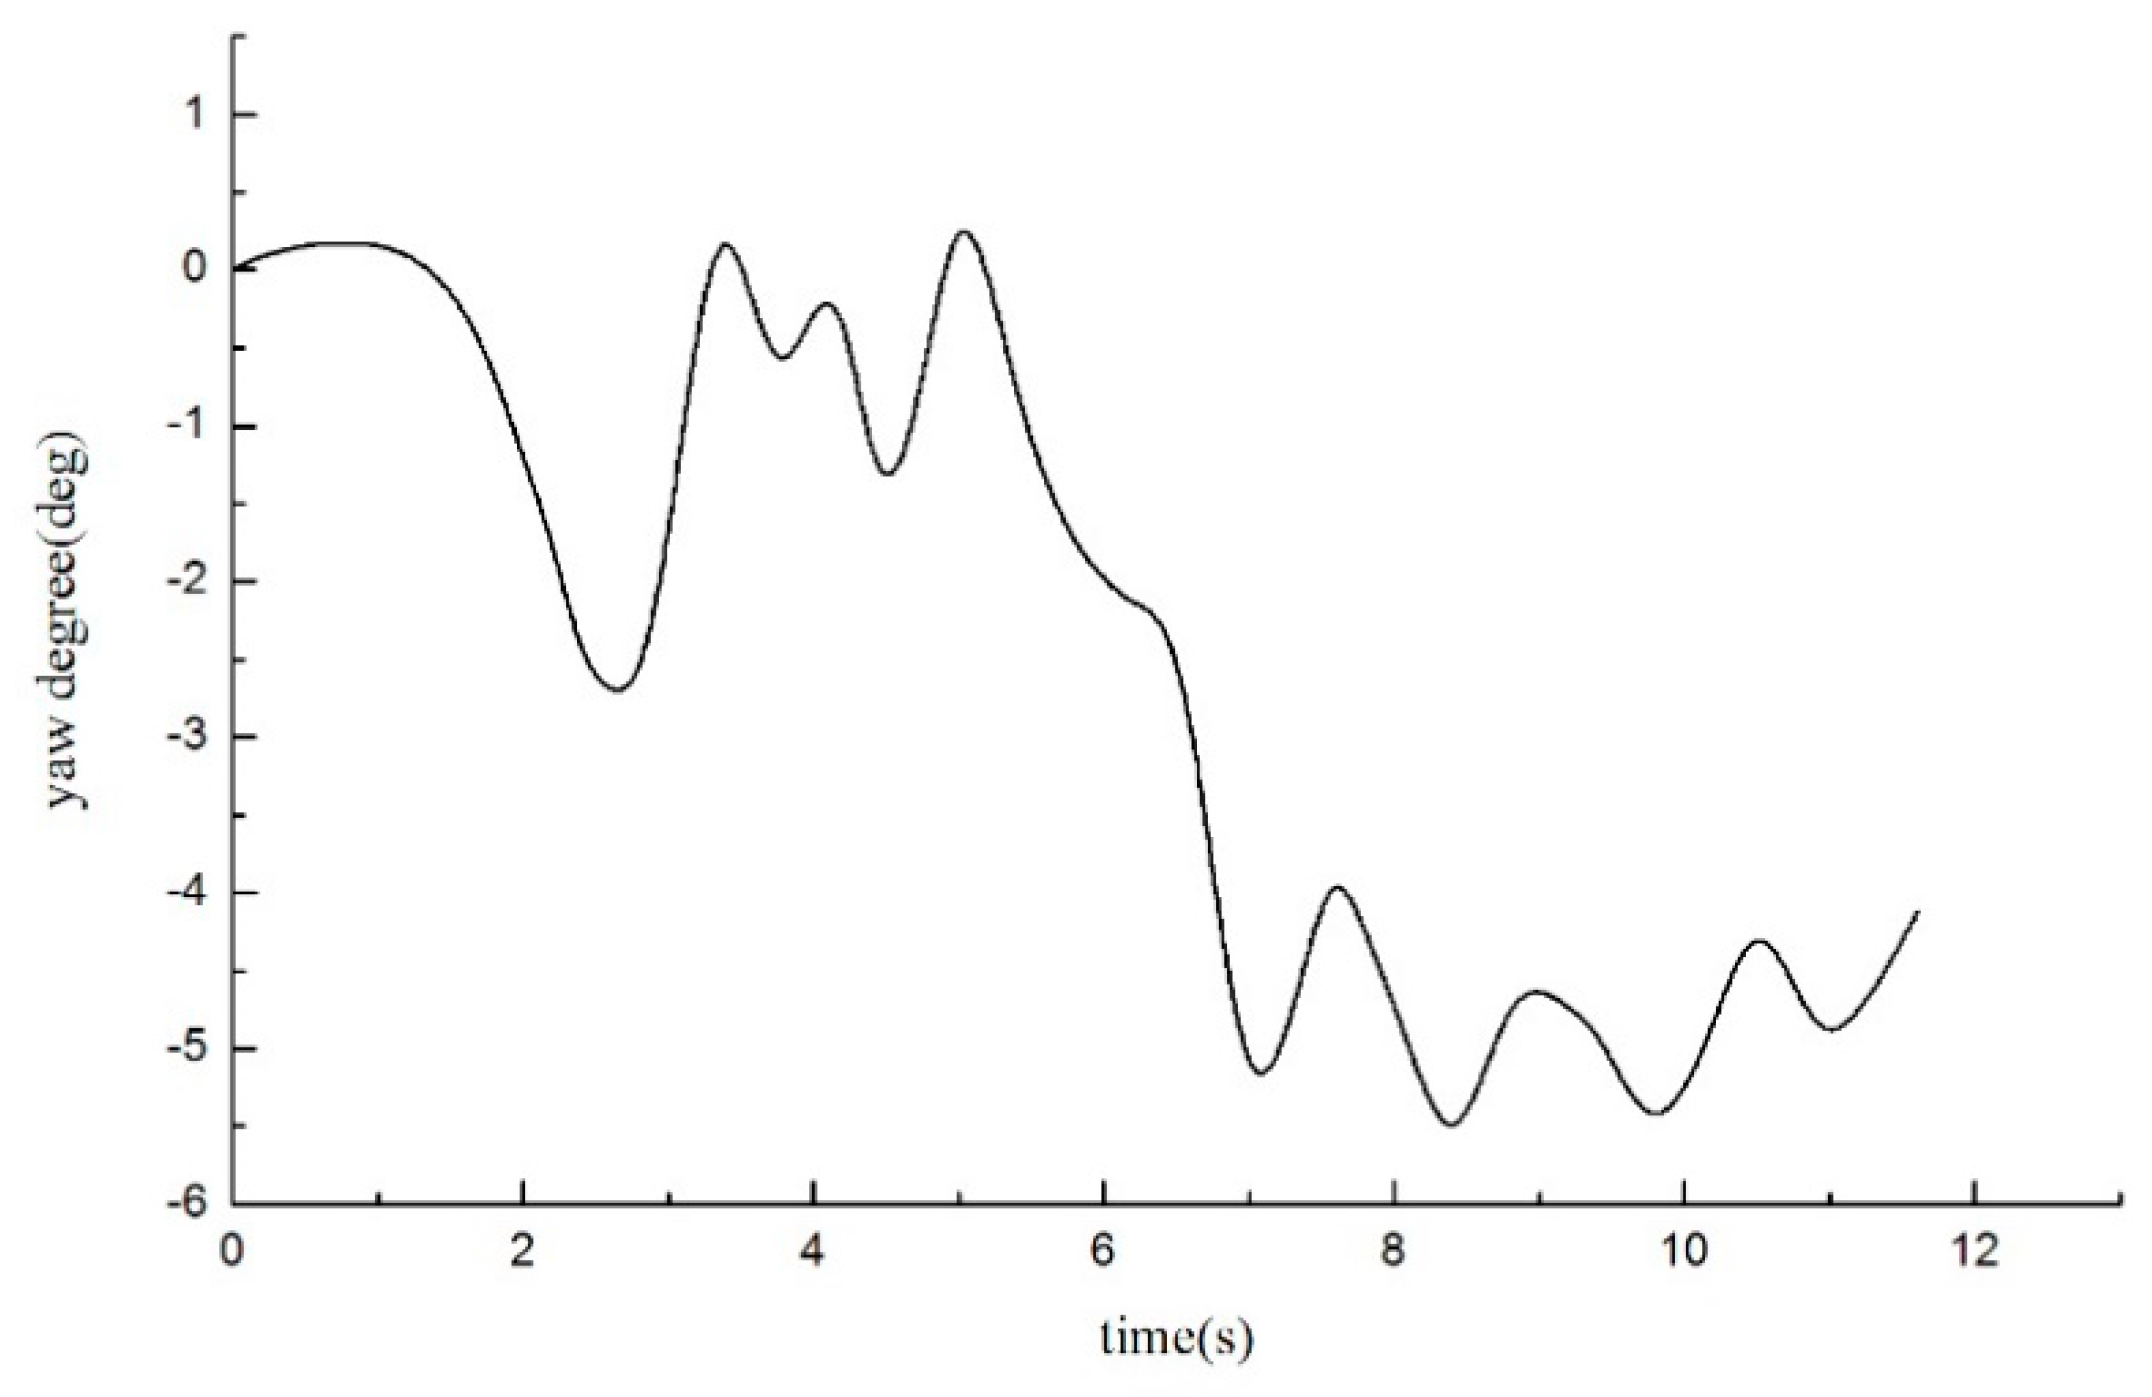
In order to provide a better understanding of the yaw response to the incident waves, it is desirable to plot the maximal yaw angle. As shown in Figure 18, after the ship model enters the test region of the landslide water, the ship model goes into a state of unmanned steering. The direction of the ship’s bow rapidly changes after encountering the effects of the landslide surge, and the direction of the ship’s navigation is changed. Figure 18 shows that the ship is in a landslide. Two seconds before the wave, the ship rotates clockwise. With the continuous action of the landslide surge, the reflected wave from the opposite side acts on the other side of the ship. The ship’s model is in a state of constant speed, and the port side of the ship is swelled. The stern begins to rotate counterclockwise as a result of the impact. The bowing angle continues to increase under the influence of the landslide and the inertia of the ship. In the testing of landslide-induced tsunami, the maximum angle of the sailing vessel is 5.5°, and the risk can be reasonably avoided by adjusting the rudder angle.
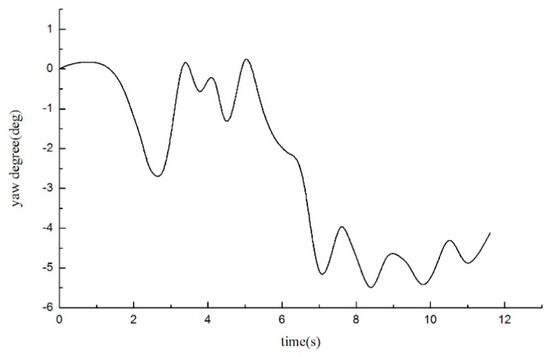
Figure 18.
Yaw curve of the ship in case 7.
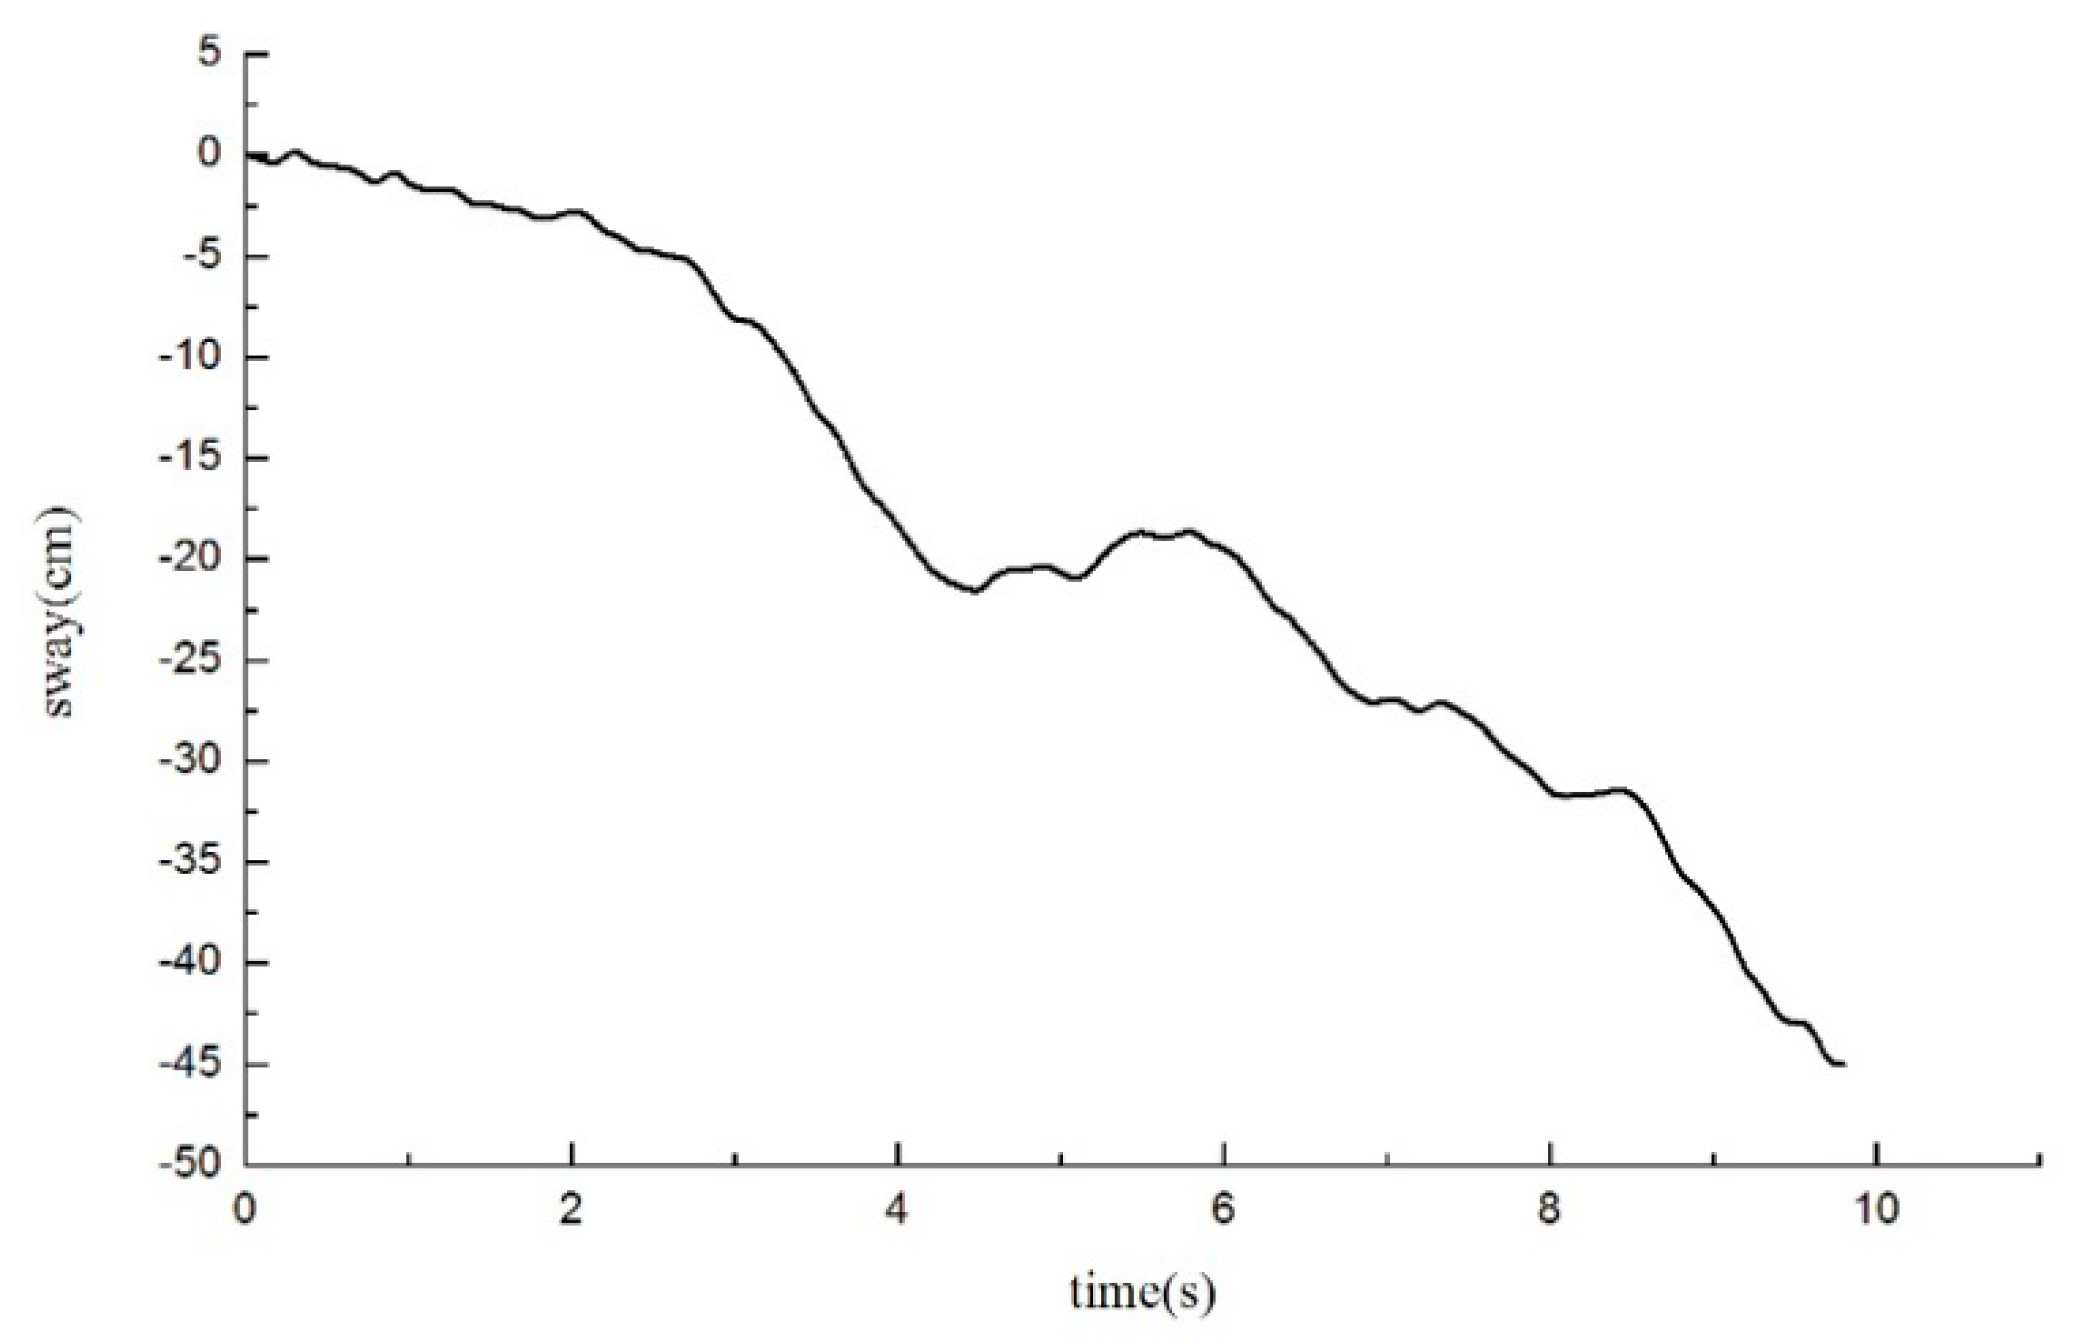
As shown in Figure 19, when the ship enters the experimental monitoring area and is in a state of unmanned steering, the ship’s direction changes after encountering a landslide-induced tsunami in the course of navigation. The ship yaws, and the original route position is left. At the same time, the landslide-induced tsunami interacts with the ship. The direct action leads to lateral deviation of the ship. The maximum distance grows gradually to 45 cm and the prototype data is 31.5 m. Under the superposition of the two cases, the amplitude of the sway movement of the ship gradually increases. Therefore, in the region of landslide-induced tsunami, ships facing each other should maintain lateral distances to prevent accidents. They can also be stopped in an emergency, and be kept in the moored state.
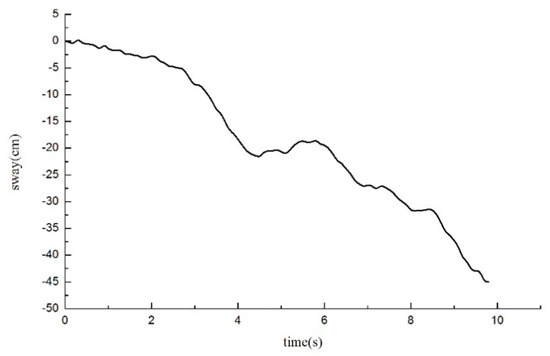
Figure 19.
Sway curve of the ship in case 7.
6. Discussion and Conclusions
The experimental investigation described herein aimed at modeling landslide-induced tsunamis. A three-dimensional research project was conducted on a river channel model to study the propagation characteristics of landslide-induced tsunamis and the characteristics of landslide-induced tsunamis around ships are further studied through experiments. The following conclusions have been drawn.
- (1)
- A landslide-induced tsunami is complicated. An oscillation wave coexists with the wave and the landslide enters the water to slide into the water points by scatter propagation. The propagation speeds of different directions vary and the maximum speed spreads in the cross section with the landslide maximum speed.
- (2)
- The water level of the first wave has a maximum, and then rapidly decreases. The energy of the landslide-induced tsunami by high-speed water in rock masses increases with the increase in landslide amount. Under the single-variable condition, landslide width exerts the greatest influence on the change in water level, followed by the thickness of the landslide body.
- (3)
- This analysis is useful to investigate how a ship undergoes resistance during tsunami propagation. The influence of the landslide-induced tsunami of the rock body on the major degrees of freedom of a sailing ship is simultaneous. The roll of the ship reaches its peak in 5 s after the landslide body enters the water. This is also dependent on the relative location of the ship and the entry point. The motion amplitude meets the rules for the construction and technical regulation for the statutory survey of a river vessel.
- (4)
- Landslide-induced tsunamis act on the middle of a fixed-speed navigation ship, which causes swaying amplitude of the ship, acts on the ship bow, and changes the ship’s swaying amplitude. The crest of the first wave and the second wave becomes more important, and for a certain distance it induces the largest degree of damage to the ship.
Author Contributions
Conceptualization, Y.Z.; Data Curation, P.Y. and Y.Z.; Formal Analysis, P.W. and P.Y.; Methodology, P.W.; Investigation, P.Y.; Writing—Original Draft, P.Y.
Funding
This paper is supported by the National Natural Science Foundation (51479015) and the Social Science and Technology Innovation Program for People’s Livelihood in Chongqing (CSTC 2018jscx-msybX0233, cstc2018jszx-zdyfxmX0013, cstc2017shms-zdyfX0026, cstc2018jszx-cyzdX0019).
Conflicts of Interest
The authors declare no conflicts of interest.
References
- Bromhead, E.N. The Miramar landslide at Herne Bay and the storm surge of 1953. Landslides Eng. Slopes 2016, 2, 531–536. [Google Scholar]
- Noda, E. Water waves generated by landslide. J. Water Harb. Coast. Eng. Div. 1970, 96, 835–855. [Google Scholar]
- Di Risio, M.; Sammarco, P. Analytical modeling of landslide-generated waves. J. Waterw. Port Coast. Ocean Eng. 2008, 134, 53–60. [Google Scholar] [CrossRef]
- Yin, K. Physical Model Experiments of Landslide-Induced Surge in Three Gorges Reservoir. Earth Sci. 2012, 37, 1067–1074. [Google Scholar]
- Yavari-Ramshe, S. A rigorous finite volume model to simulate subaerial and submarine landslide-generated waves. Landslides 2017, 14, 203–221. [Google Scholar] [CrossRef]
- Hatecke, H. The impulse response fitting and ship motions. Ship Technol. Res. 2015, 62, 97–106. [Google Scholar] [CrossRef]
- Huang, B. Impulse waves in reservoirs generated by landslides into shallow water. Coast. Eng. 2017, 123, 52–61. [Google Scholar] [CrossRef]
- Fritz, H.M.; Hager, W.H.; Minor, H.-E. Landslide generated impulse waves: Part 1: Instantaneous flow fields. Exp. Fluids 2003, 35, 505–519. [Google Scholar] [CrossRef]
- Fritz, H.M.; Hager, W.H.; Minor, H.-E. Landslide generated impulse waves: Part 2: Hydrodynamic impact craters. Exp. Fluids 2003, 35, 520–532. [Google Scholar] [CrossRef]
- Muller, D.; Schurter, M. Impulse waves generated by an artificially induced rockfall in a Swiss lake. In Proceedings of the 25th IAHR Congress 4, Tokyo, Japan, 30 August–9 September 1993; pp. 209–216. [Google Scholar]
- Biscarini, C. Computational fluid dynamics modeling of landslide generated water waves. Landslides 2010, 7, 117–124. [Google Scholar] [CrossRef]
- Di Risio, M.; De Girolamo, P.; Bellotti, G.; Panizzo, A.; Aristodemo, F.; Molfetta, M.G.; Petrillo, A.F. Landslide-generated tsunamis runup at the coast of a conical island: New physical model experiments. J. Geophys. Res. Ocean 2009. [Google Scholar] [CrossRef]
- Di-Risio, M.; Bellotti, G.; Panizzo, A.; Molfetta, M.-G.; Aristodemo, F.; De-Girolamo, P.; Pratola, L.; Petril lo, A.-F. Tsunamis generated by a landslide along the coast of a conical island: New three dimensional experiments. In Proceedings of the 31st International Conference on Coastal Engineering (ICCE), Hamburg, Germany, 31 August–5 September 2009; pp. 1396–1408. [Google Scholar]
- Romano, A.; Di Risio, M.; Molfetta, M.G.; Bellotti, G.; Pasquali, D.; Sammarco, P.; Damiani, L.; De Girolamo, P. 3D physical modeling of tsunamis generated by submerged landslides at a conical island: The role of initial acceleration. In Proceedings of the 35th International Conference on Coastal Engineering (ICCE), Antalya, Turkey, 17–20 November 2016. [Google Scholar]
- De Girolamo, P.; Di Risio, M.; Romano, A.; Molfetta, M.G. Landslide tsunami: Physical modeling for the implementation of tsunami early warning system in the Mediterranean Sea. Procedia Eng. 2014, 70, 429–438. [Google Scholar] [CrossRef]
- e Silva, S.R.; Soares, C.G. Prediction of parametric rolling in waves with a time domain non-linear strip theory model. Ocean Eng. 2013, 72, 453–469. [Google Scholar] [CrossRef]
- Degtyarev, A.B.; Reed, A.M.; Mareev, V. Modeling of incident waves near the ship’s hull. Contemp. Ideas Ship Stab. 2019, 119, 25–35. [Google Scholar]
- Lee, S.C.; Kim, Y.B.; Goo, J.S. Analysis of motion response of barge ships in regular waves. In Proceedings of the International Conference on Control, Automation and Systems, JeJu Island, Korea, 17–21 October 2012; pp. 1920–1922. [Google Scholar]
- Kim, J.H.; Kim, Y. Time-domain analysis of passenger comfort on cruise ships under motion response in waves. Proc. Inst. Mech. Eng. 2014, 228, 331–347. [Google Scholar] [CrossRef]
- Rajendran, S. Effect of surge motion on the vertical responses of ships in waves. Ocean Eng. 2014, 96, 125–138. [Google Scholar] [CrossRef]
- Sayed, M. Stability and response of a nonlinear coupled pitch-roll ship model under parametric and harmonic excitations. Nonlinear Dyn. 2011, 64, 207–220. [Google Scholar] [CrossRef]
- Cho, I. A study on dynamic analysis of moored ship motions by tsunami. J. Korean Navig. Port Res. 2005, 29, 661–666. [Google Scholar] [CrossRef]
- Pitana, T. Optimization of ship evacuation procedures as part of tsunami preparation. J. Simul. 2009, 3, 235–247. [Google Scholar] [CrossRef]
- Daoud, S.; Said, I.; Ennour, S.; Bouassida, M. Numerical analysis of cargo liquefaction mechanism under the swell motion. Mar. Struct. 2018, 57, 52–71. [Google Scholar] [CrossRef]
- Thuy, N.B.; Tanimoto, K.; Tanaka, N.; Harada, K.; Iimura, K. Effect of open gap in coastal forest on tsunami run-up investigations by experiment and numerical simulation. Ocean Eng. 2009, 36, 1258–1269. [Google Scholar] [CrossRef]
- Kato, F.; Sato, S.; Yeh, H. Large-scale experiment on dynamic response of sand bed around a cylinder due to tsunami. In Proceedings of the 27th International Conference on Coastal, Sydney, Australia, 16–21 July 2000. [Google Scholar]
- Hamzah, M.A.; Mase, H.; Takayama, T. Simulation and experiment of hydrodynamic pressure on a tsunami barrier. In Proceedings of the 27th International Conference on Coastal, Sydney, Australia, 16–21 July 2000. [Google Scholar]
- International Maritime Organization (IMO). Standards for Ship Maneuverability; Resolution MSC/IMO: London, UK, 2002; Volume 137. [Google Scholar]
- ITTC-recommended procedures and guidelines. Testing and Extrapolation Methods Maneuverability Free Running Model Tests. In Proceedings of the International Towing Tank Conference, FlIkuoka, Japan, 14–20 September 2008. [Google Scholar]
- Huang, B.; Yin, Y.-P.; Chen, X.; Liu, G.; Wang, S.; Jiang, Z. Experimental modeling of tsunamis generated by subaerial landslides: Two case studies of the Three Gorges Reservoir, China. Environ. Earth Sci. 2014, 71, 3813–3825. [Google Scholar]


© 2019 by the authors. Licensee MDPI, Basel, Switzerland. This article is an open access article distributed under the terms and conditions of the Creative Commons Attribution (CC BY) license (http://creativecommons.org/licenses/by/4.0/).