Article

An Energy-Based Approach for Fatigue Life Estimation of Welded Joints without Residual Stress through Thermal-Graphic Measurement

1
Department of Mechanical Engineering, Hunan University of Technology, Zhuzhou 412007, China
2
State Key Laboratory of Advanced Design and Manufacturing for Vehicle Body, Hunan University, Changsha 410082, China
3
Department of Mechanical and Industrial Engineering, Norwegian University of Science and Technology, 7491 Trondheim, Norway
*
Authors to whom correspondence should be addressed.
Appl. Sci. 2019, 9(3), 397; https://doi.org/10.3390/app9030397
Submission received: 27 December 2018 / Revised: 20 January 2019 / Accepted: 22 January 2019 / Published: 24 January 2019
(This article belongs to the Special Issue Fracture and Fatigue Assessments of Structural Components)

Abstract

:
The traditional methodologies for fatigue life assessment of welded joints strongly depend on geometries and surface characteristics, as well as time. In this paper, an energy-based approach, independent of structures though thermal-graphic measurement, was presented to predict life expectancy of welded joints, via limited number of tests. In order to eliminate the thermal elastic effect caused by the welding residual stress, annealing was first conducted on welded specimens. Both monotonic and cyclic tests for welded joints were implemented. Then, based on the thermal evolution of welded joints measured by the quantitative thermo-graphic method, an energy-based approach, taking the linear temperature evolution and the intrinsic dissipation into account, was employed on the fatigue life prediction of flat butt-welded joints. The estimated results showed good agreement with the experimental ones, and the energy tolerance to failure E c for different stress amplitudes was found to be constant.

1. Introduction

The welded joints of high strength steel are frequently used in bridges and buildings, in light of good mechanical properties and excellent weldability [1]. However, compared with its parental materials, the fatigue strength of welds generally declines due to the existence of possible welding porosity and impurity defects, and tensile residual stress caused by the inconsistent recrystallization process with temperature gradient. In order to ensure sufficient service life at design stage and avoid fatigue failures occurring in welded engineering structures at usage stage, it is necessary to clarify the lifetime estimation model and fatigue damage evolution mechanism [2,3].
The traditional fatigue life evaluation approaches mainly depend on the S N curves of welded joints to characterize mathematical relationship between different mechanical responses and lifespans [4]. In the normal stress method, the S N curves estimate fatigue life by means of the structural nominal stress range in the presence of possible cyclic loads [5]. Based on the S N curves obtained from fatigue tests on actual welded joints, the extrapolated maximum structural stress in consideration of local geometries was utilized to predict life expectancy in the hot-spot stress method [6,7,8]. In order to concern detailed geometrical features and stress concentration effects, the maximum notch stress at the weld toe and weld root is treated as lifetime assessment parameter, proposed by the notch stress approach [9,10]. Similarly, the so-called E N curves are expressed in terms of plastic and elastic strain energy density (SED) at the weld seam, and relevant number of cycles in the SED method to estimate fatigue life of welded joints [11,12]. However, the selection of S N curves from different fatigue classes could be subjective, since they depend on the geometry of welded joints and loading modes. The corresponding mechanical responses are not easy to precisely determine as well. Another fracture mechanics approach could make the determination of lifetime for cracked welded components based on the Paris law, according to the relationship between the crack growth rate and stress intensity factor range [13]. Nevertheless, it is sensitive to the initial crack size, and thus the known crack is needed.
The intrinsic energy dissipation method could rapidly confirm the fatigue limit and evaluate life expectancy, based on the thermal evolution on the surface of welded joints under cyclic loadings obtained from the thermo-graphic measurement [14,15,16]. This approach is independent of geometrical characteristics of welded joints, and does not require some given assumptions or prerequisites, compared with the notch stress approach, fracture mechanics method, and so on. This temperature variation is representative of the microstructure’s movement and evolution in some way, which could be deemed as the connection between different scales. In the meantime, the intrinsic dissipation method supported by the thermo-graphic technique has great advantages in saving time and specimens. It could rapidly confirm the high-cycle fatigue limit, and construct a fatigue life assessment model via a very limited number of tests without sacrificing the calculation precision, proposed by Risitano and Luong et al. [17,18]. Essentially, the dissipation of energy directly reflects a material’s fatigue failure mechanism, caused by the internal friction between the micro-structures. Meanwhile, the direction judgment falls into disuse when the dissipated energy is treated as damage parameter. Currently, a so-called Quantitative Thermo-graphic Methodology (QTM) has been widely used in studying the fatigue behavior of pure metal materials, notched specimens, and welded joints [19,20]. However, this approach is based on the assumption of a constant temperature increment during the stabilized stage [21,22], and the temperature is directly considered a fatigue damage parameter. In this paper, the linear increase of temperature increments in the stable stage II was measured on the surface of a flat butt welded joint, and was taken into account for constructing a fatigue life estimation model of welded joints. A well-suited energy form (instead of temperature) was treated as the fatigue indicator for characterizing the heat dissipation behavior.
First, in order to eliminate the thermal elastic effect caused by the welding residual stress, annealing was carried out. Its mechanical behavior was obtained through a monotonic test. The fatigue tests were conducted on the butt joint under fully reversed tension-compression loading. Then, based on the fatigue life estimations model, taking the linear temperature evolution and the intrinsic dissipation into account, the estimated life spans calculated from the energy-based approach were compared with experimental ones.

2. Experimental Work

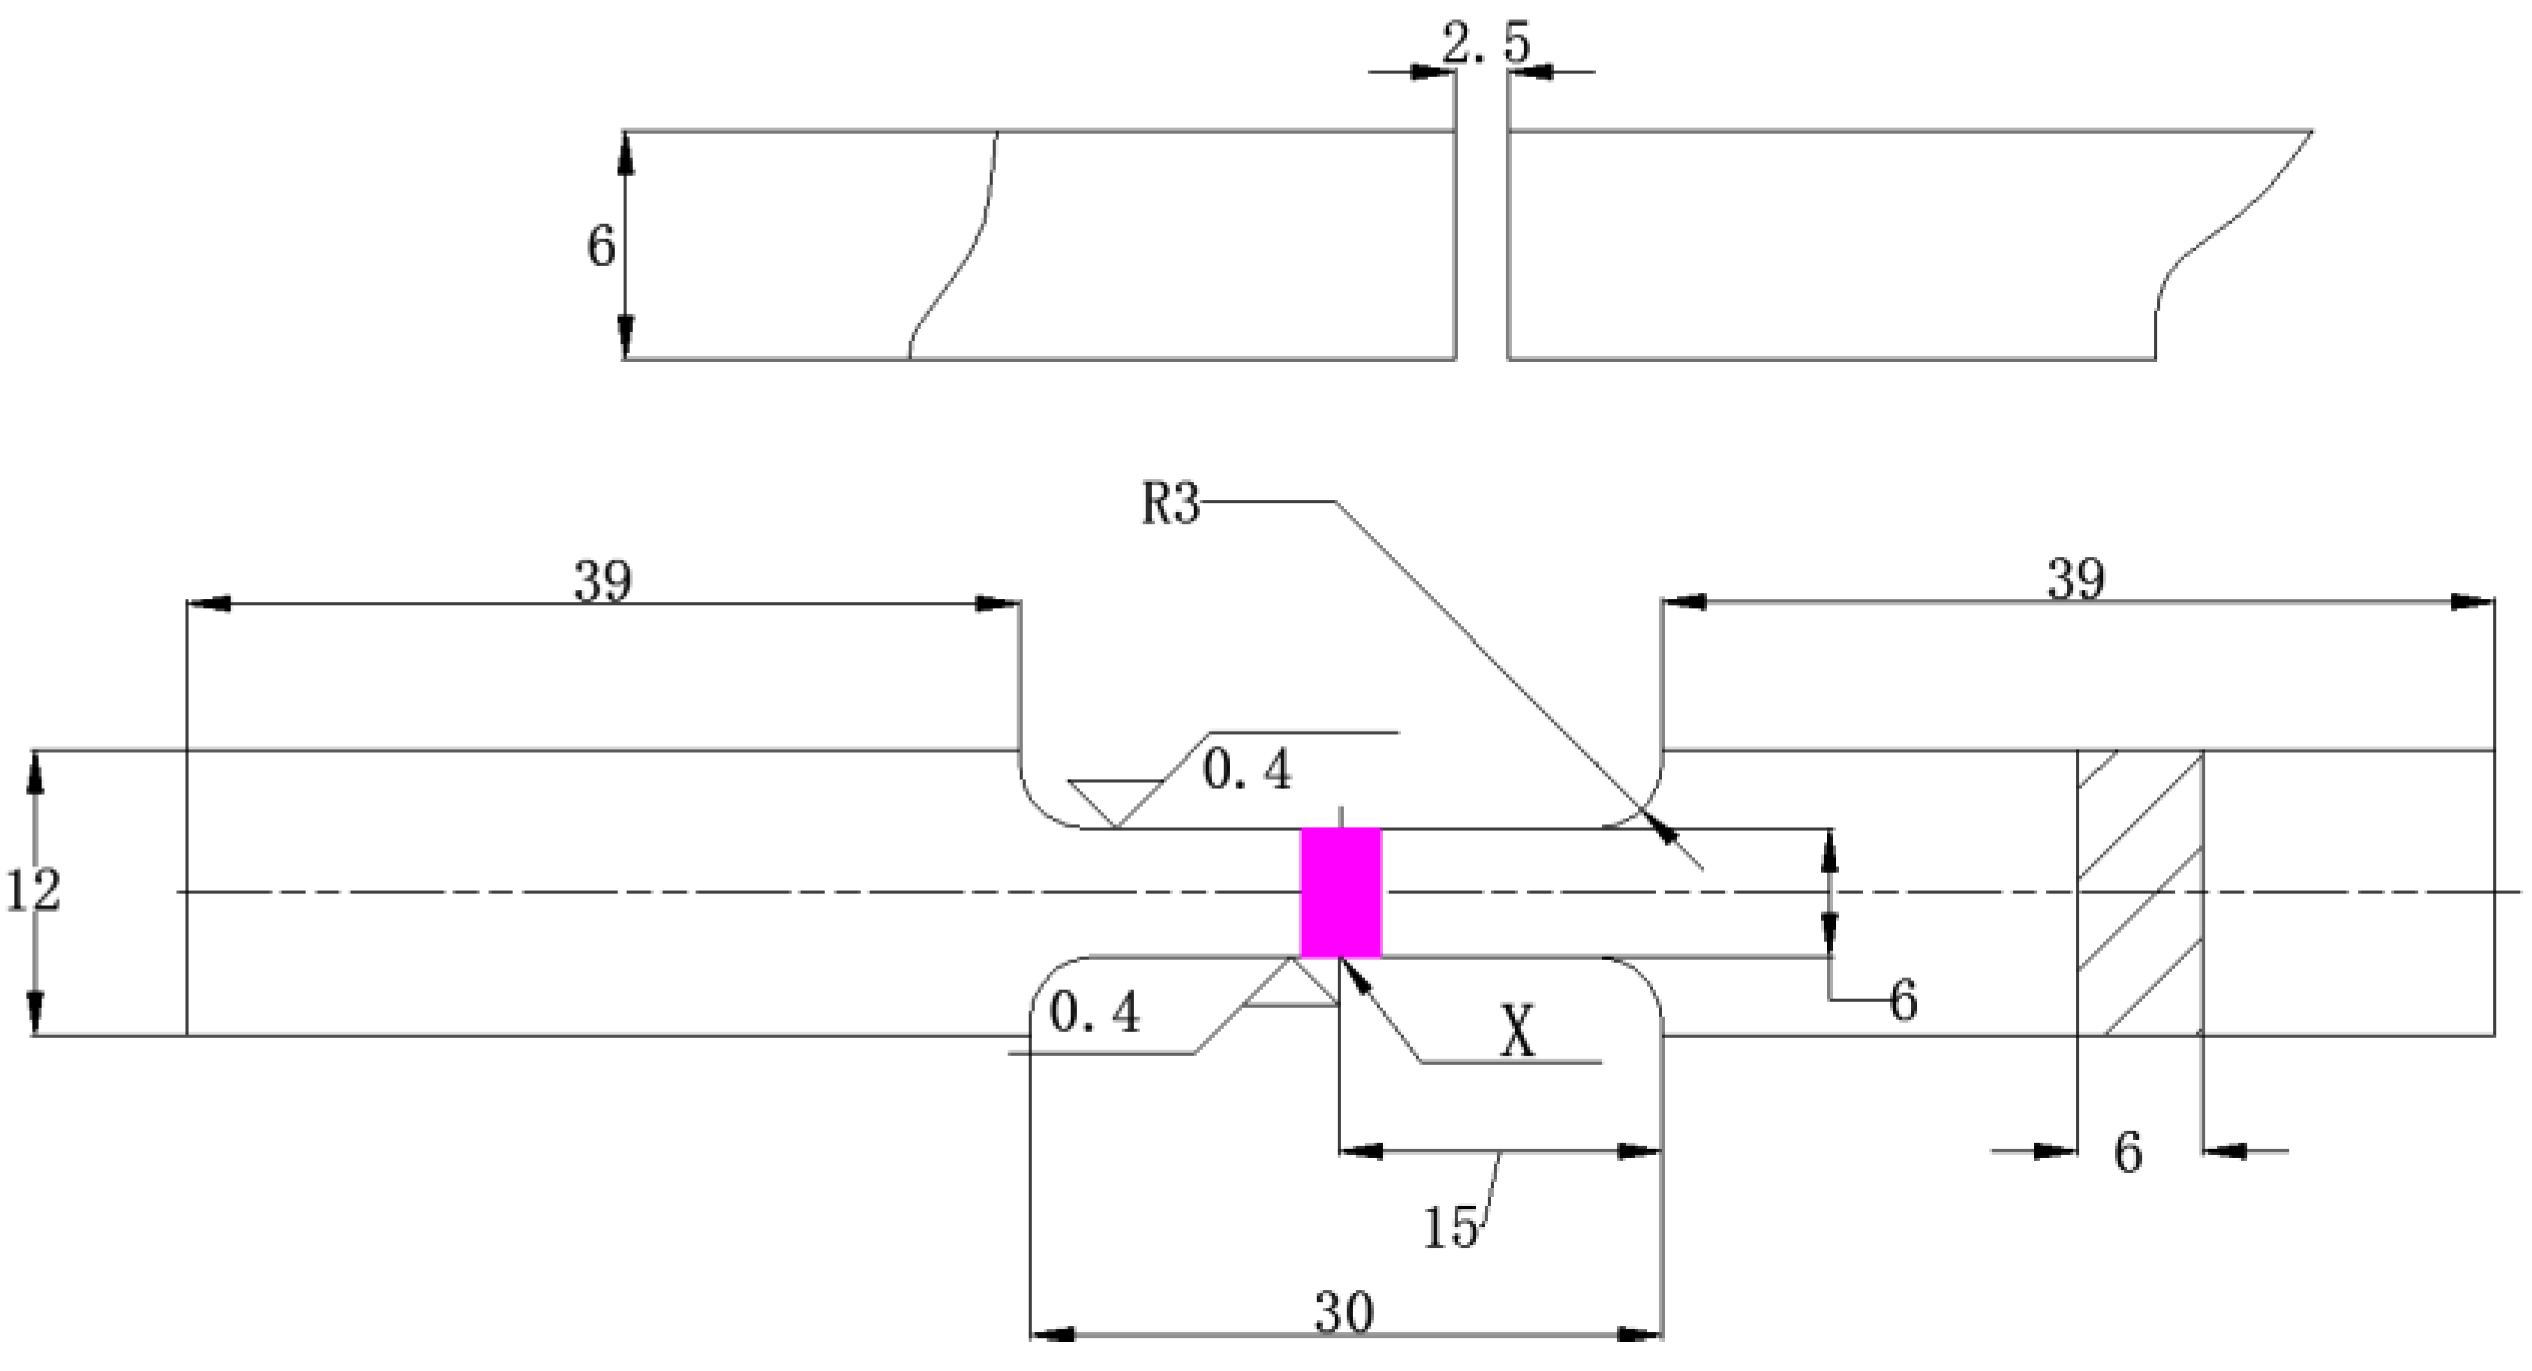
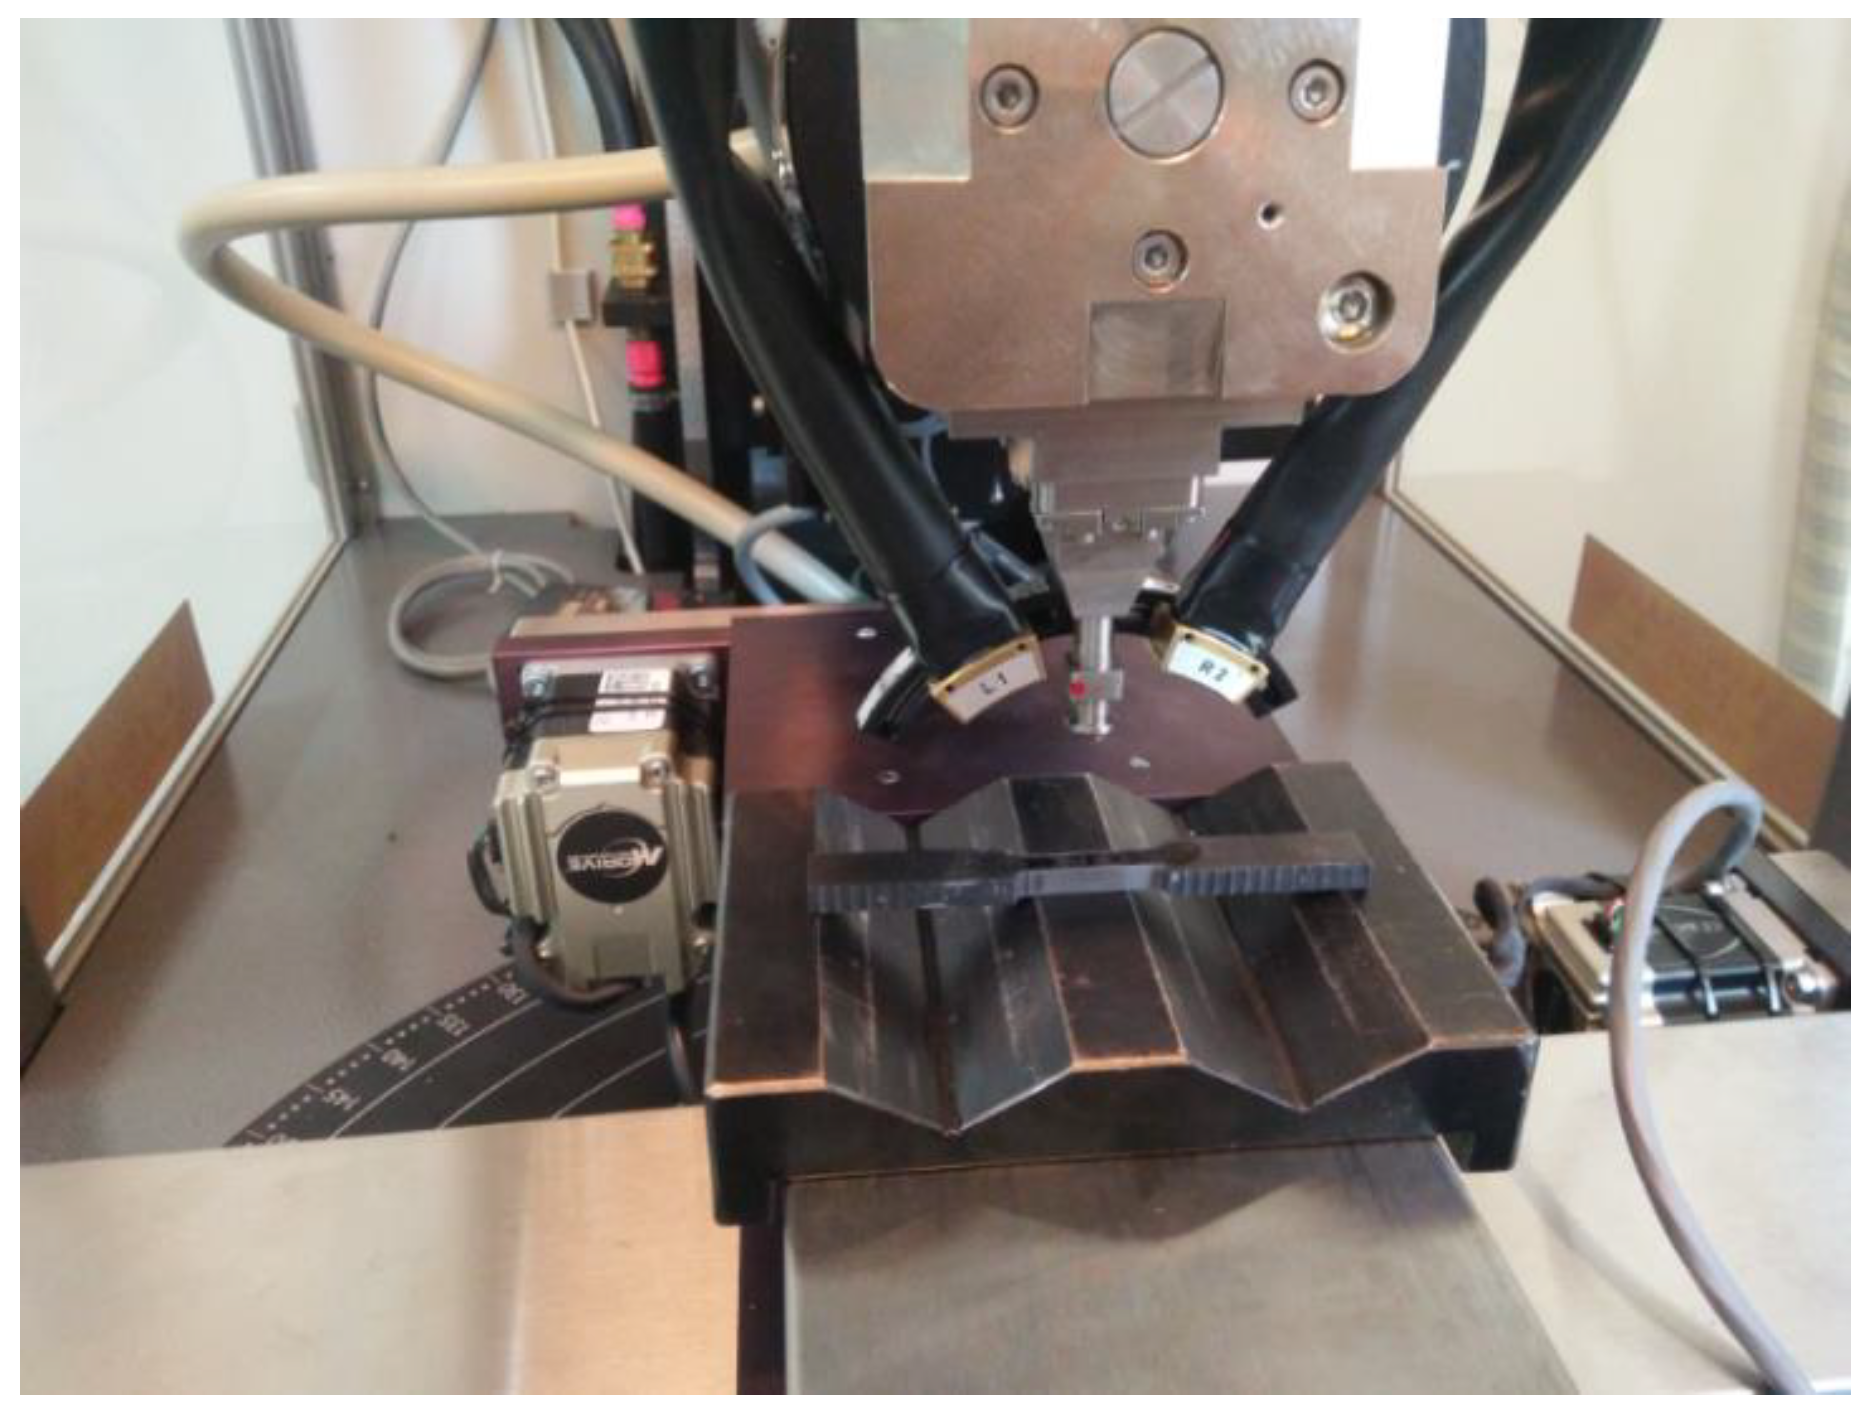
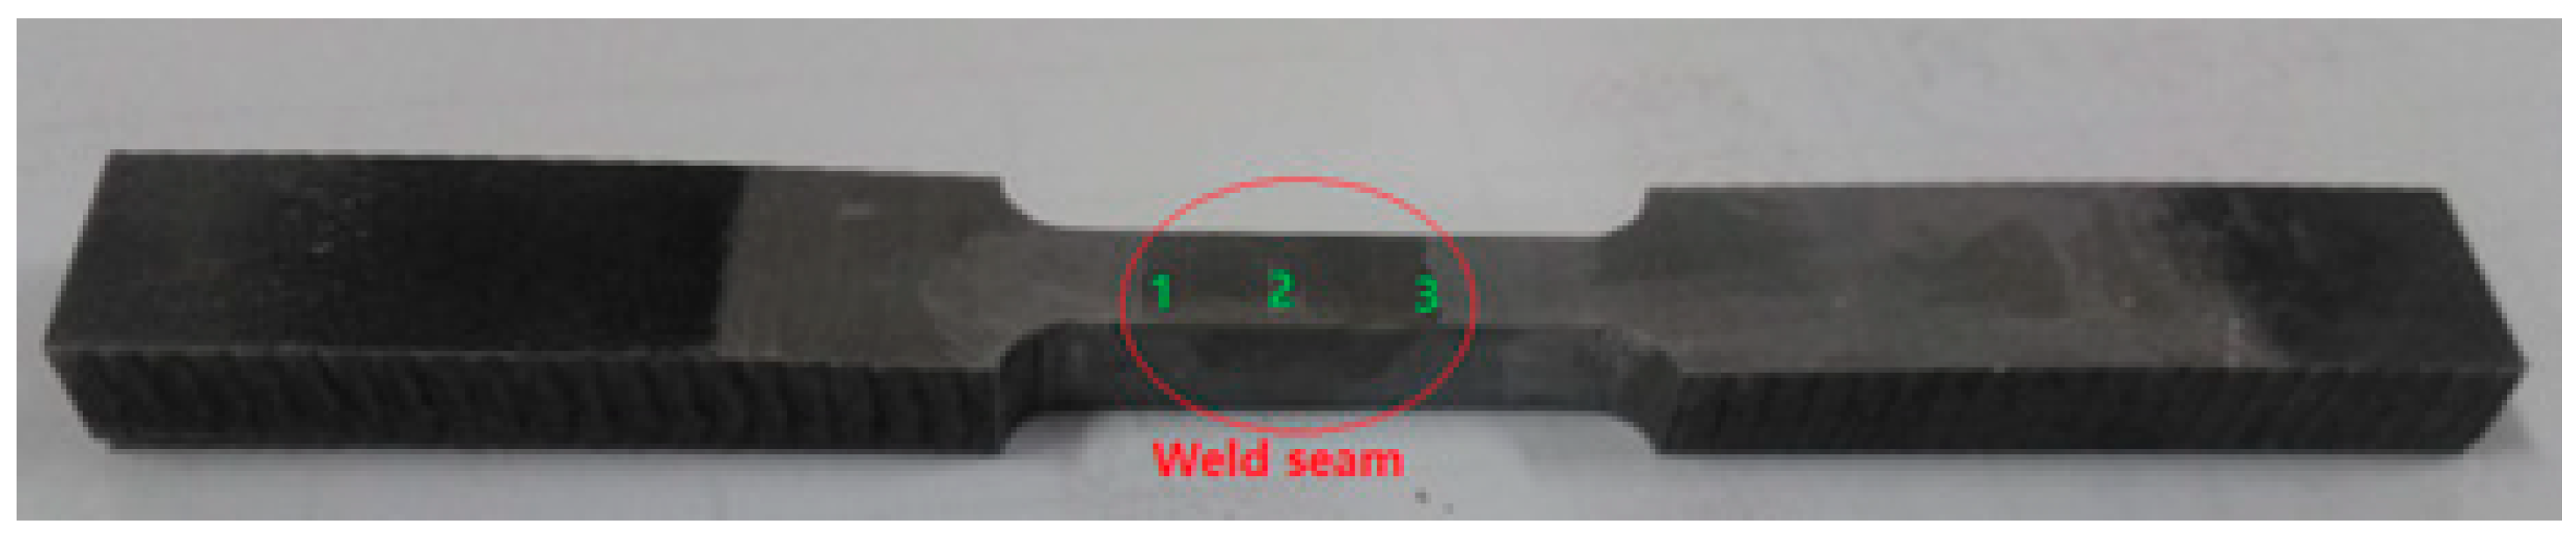
2.1. Specimen Preparation
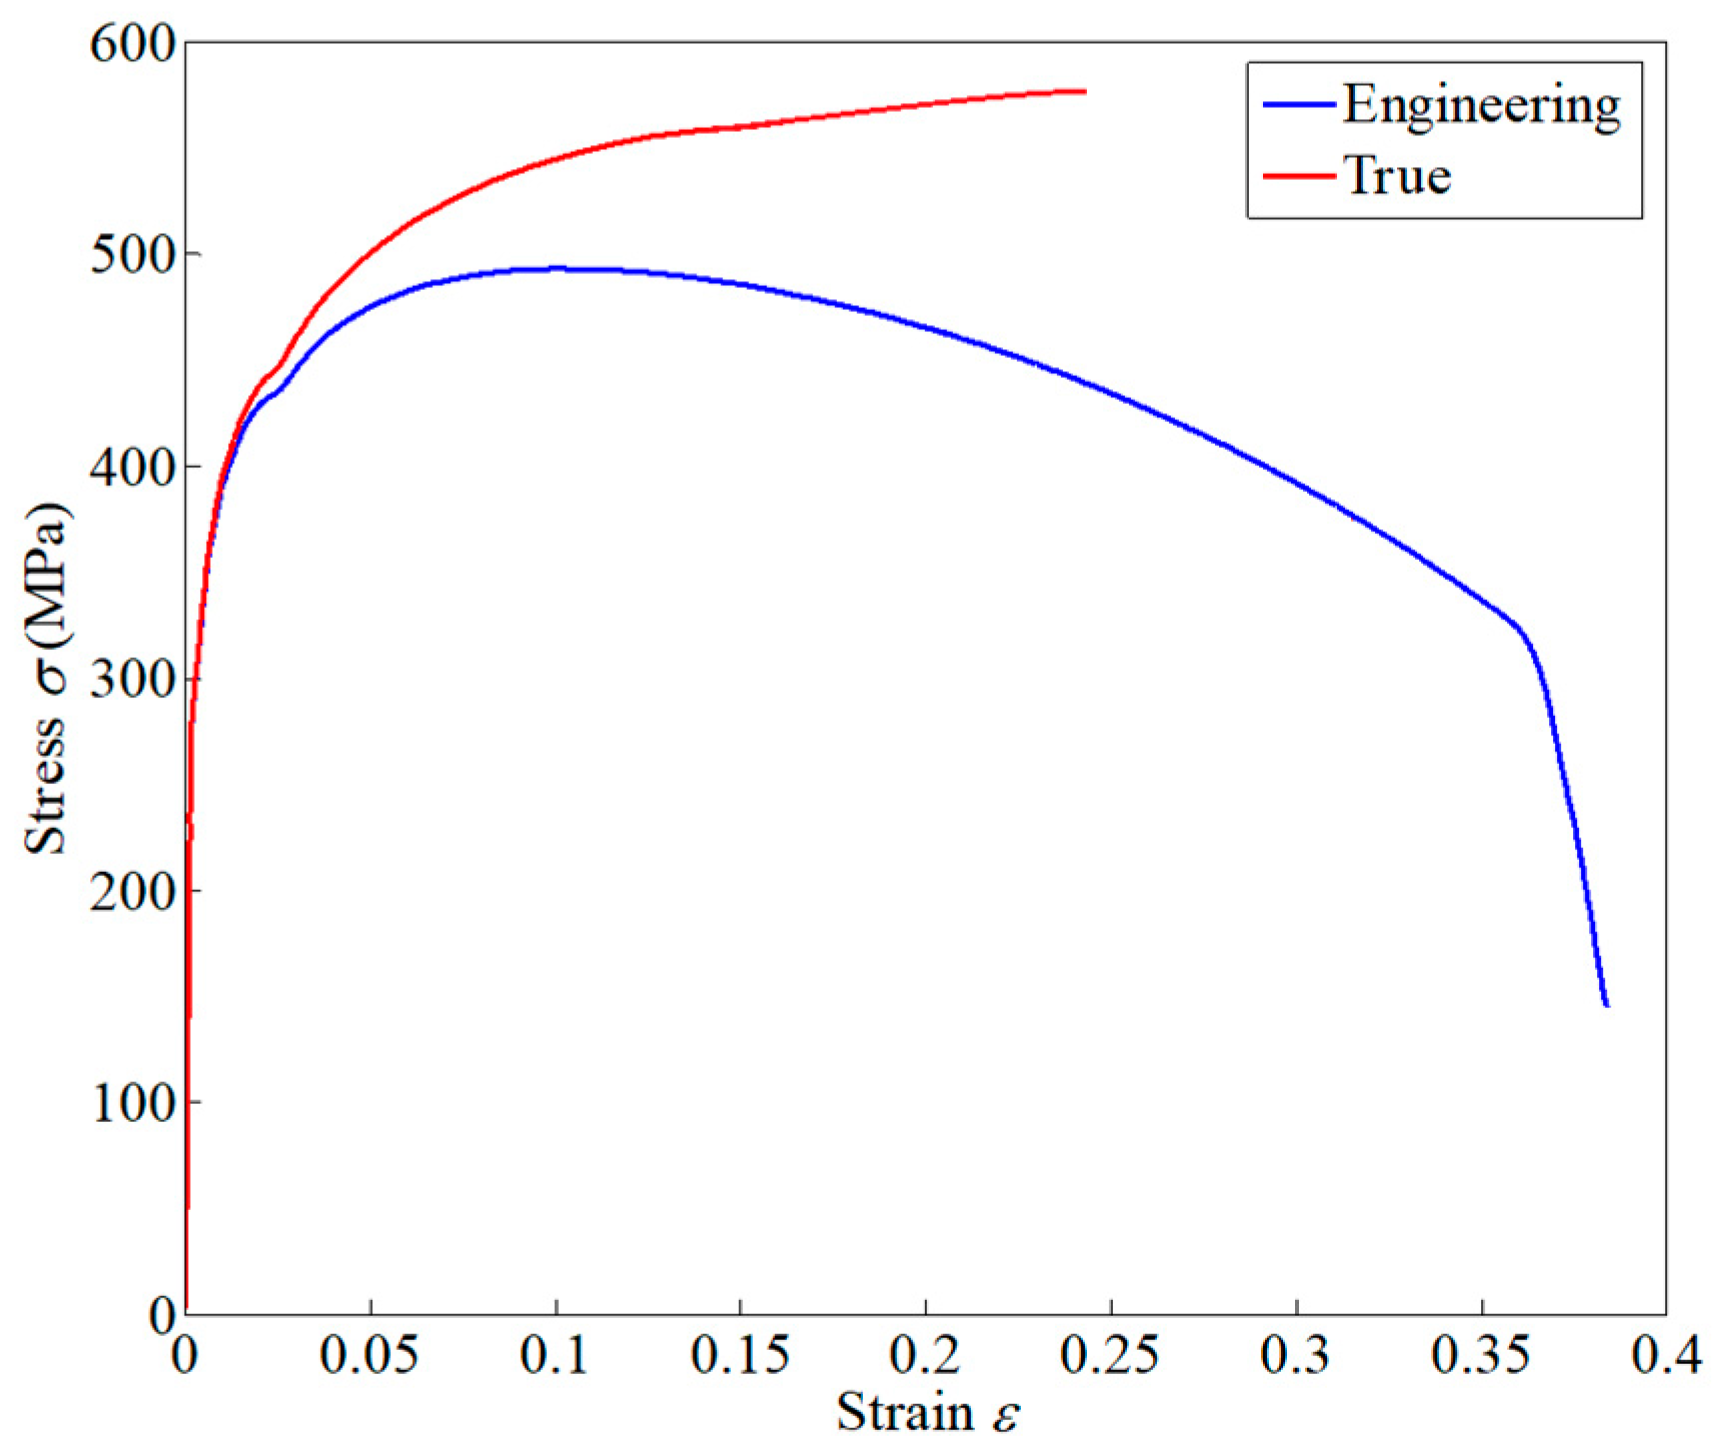
The flat butt-welded joints were designed, as in Figure 1, and connected by the arc-welding process. The weld seam is located at the middle of the specimen (purple marks). Its thickness is 6 mm. The parental material is high strength steel, and its yield strength is 460 MPa, which is widely utilized in bearing structures, like bridges or buildings.
Some research [19,20] found that if a mean stress existed, there would be a very small heat contribution offered by a thermo-elastic heat source. In general, the welding procedure could produce residual stress located at the welded zone. This tensile residual stress is usually treated as a kind of equivalent mean stress. In order to eliminate the inherent mean stress, the specimens were annealed by raising the temperature to 500 °C and preserving heat for two hours. After they were cooled to room temperature, the residual stresses on the surface of the specimen around the welded area were measured by X-ray, as shown in Figure 2. The three measuring points are shown in Figure 3, and the tested results are listed in Table 1. The residual stresses of those points on the surface of the specimen are all small, and could be considered as non-residual stress.

2.2. Monotonic Test

A monotonic tensile test was conducted on the butt joint specimen under displacement control at the rate of 0.01 mm/s. An Instron uniaxial extensometer (INSTRON, Norwood, MA, USA) with a 12 mm gauge length was utilized for measuring the strain. The true and engineering stress–strain curves are both shown in Figure 4. According to the stress and strain responses, the mechanical parameters of welded joints are listed in Table 2. The yield strength of welded joints is less than the parental material, which is possibly caused by the welding process parameters and the welding wire material.

2.3. Cyclic Test

The installation diagram of the uniaxial fatigue test and thermal measurement is shown in Figure 5. The temperature distribution contour on the surface of the specimen during the cyclic loading was recorded by a high-performance infrared (IR) camera (FLIR, Boston, MA, USA), as shown in Figure 6. This camera has high sensitivity to perceive the thermal variation of 20 mK at room temperature, and its resolution could reach 640 × 512 pixels in full field mode.
In the fully reversed fatigue tests, the applied constant stress amplitudes were 240 MPa, 260 MPa, 300 MPa and 340 MPa, which aimed at constructing a fatigue life estimation model and testing its prediction accuracy. All the fatigue tests were under load control, and the failure criterion was 50% drop of displacement. The frequency of applied uniaxial loading was 20 Hz.

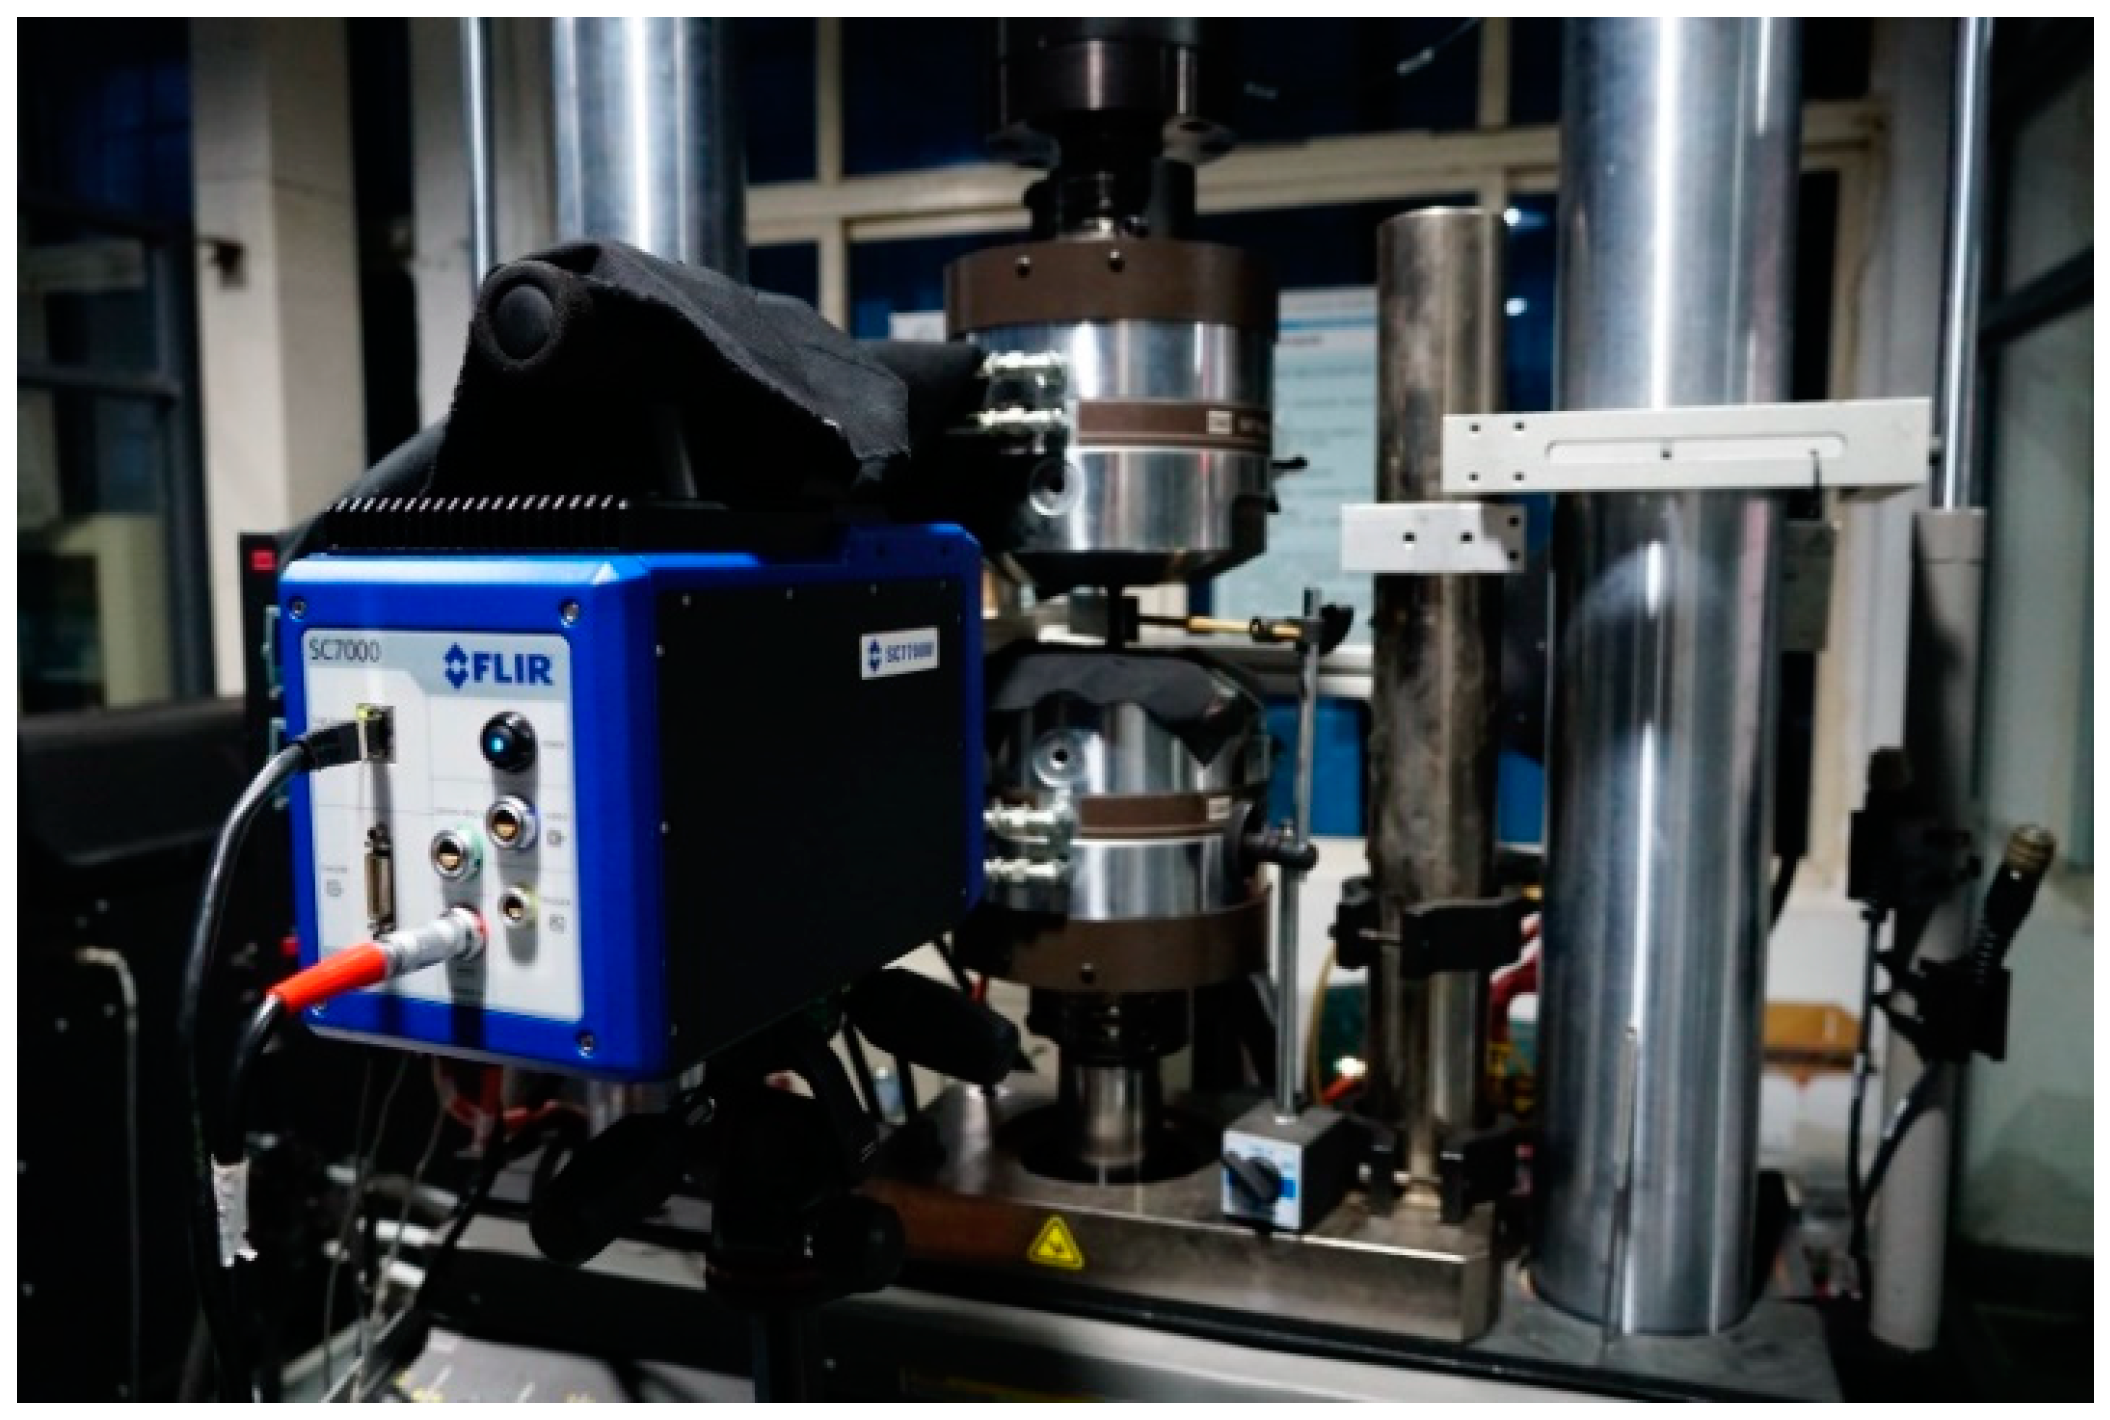
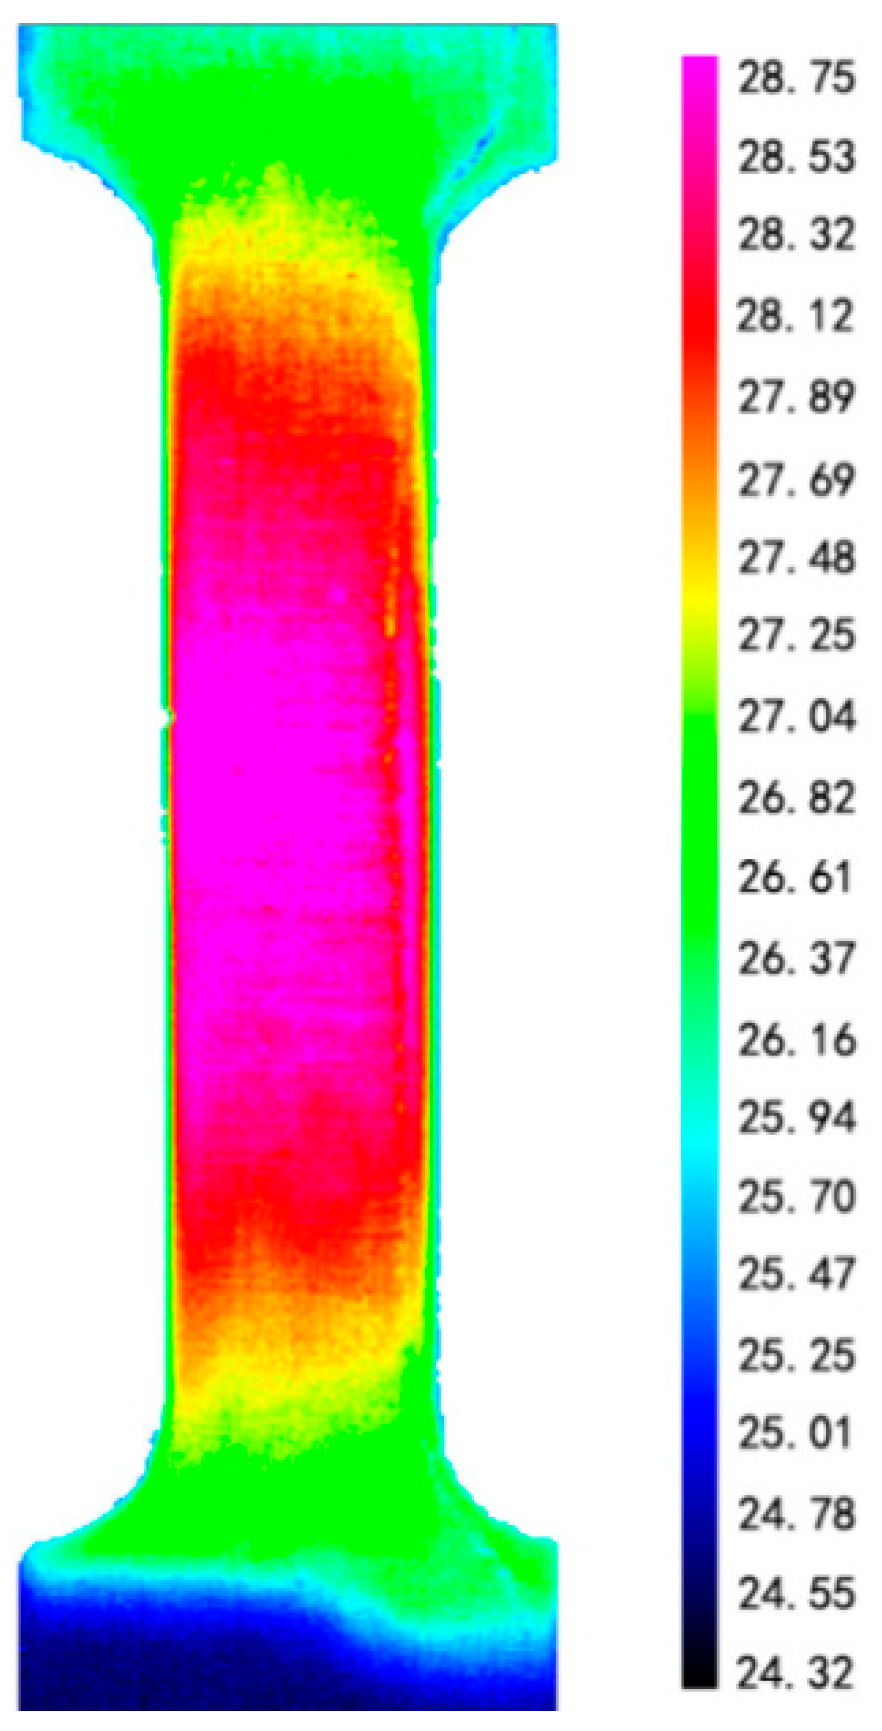
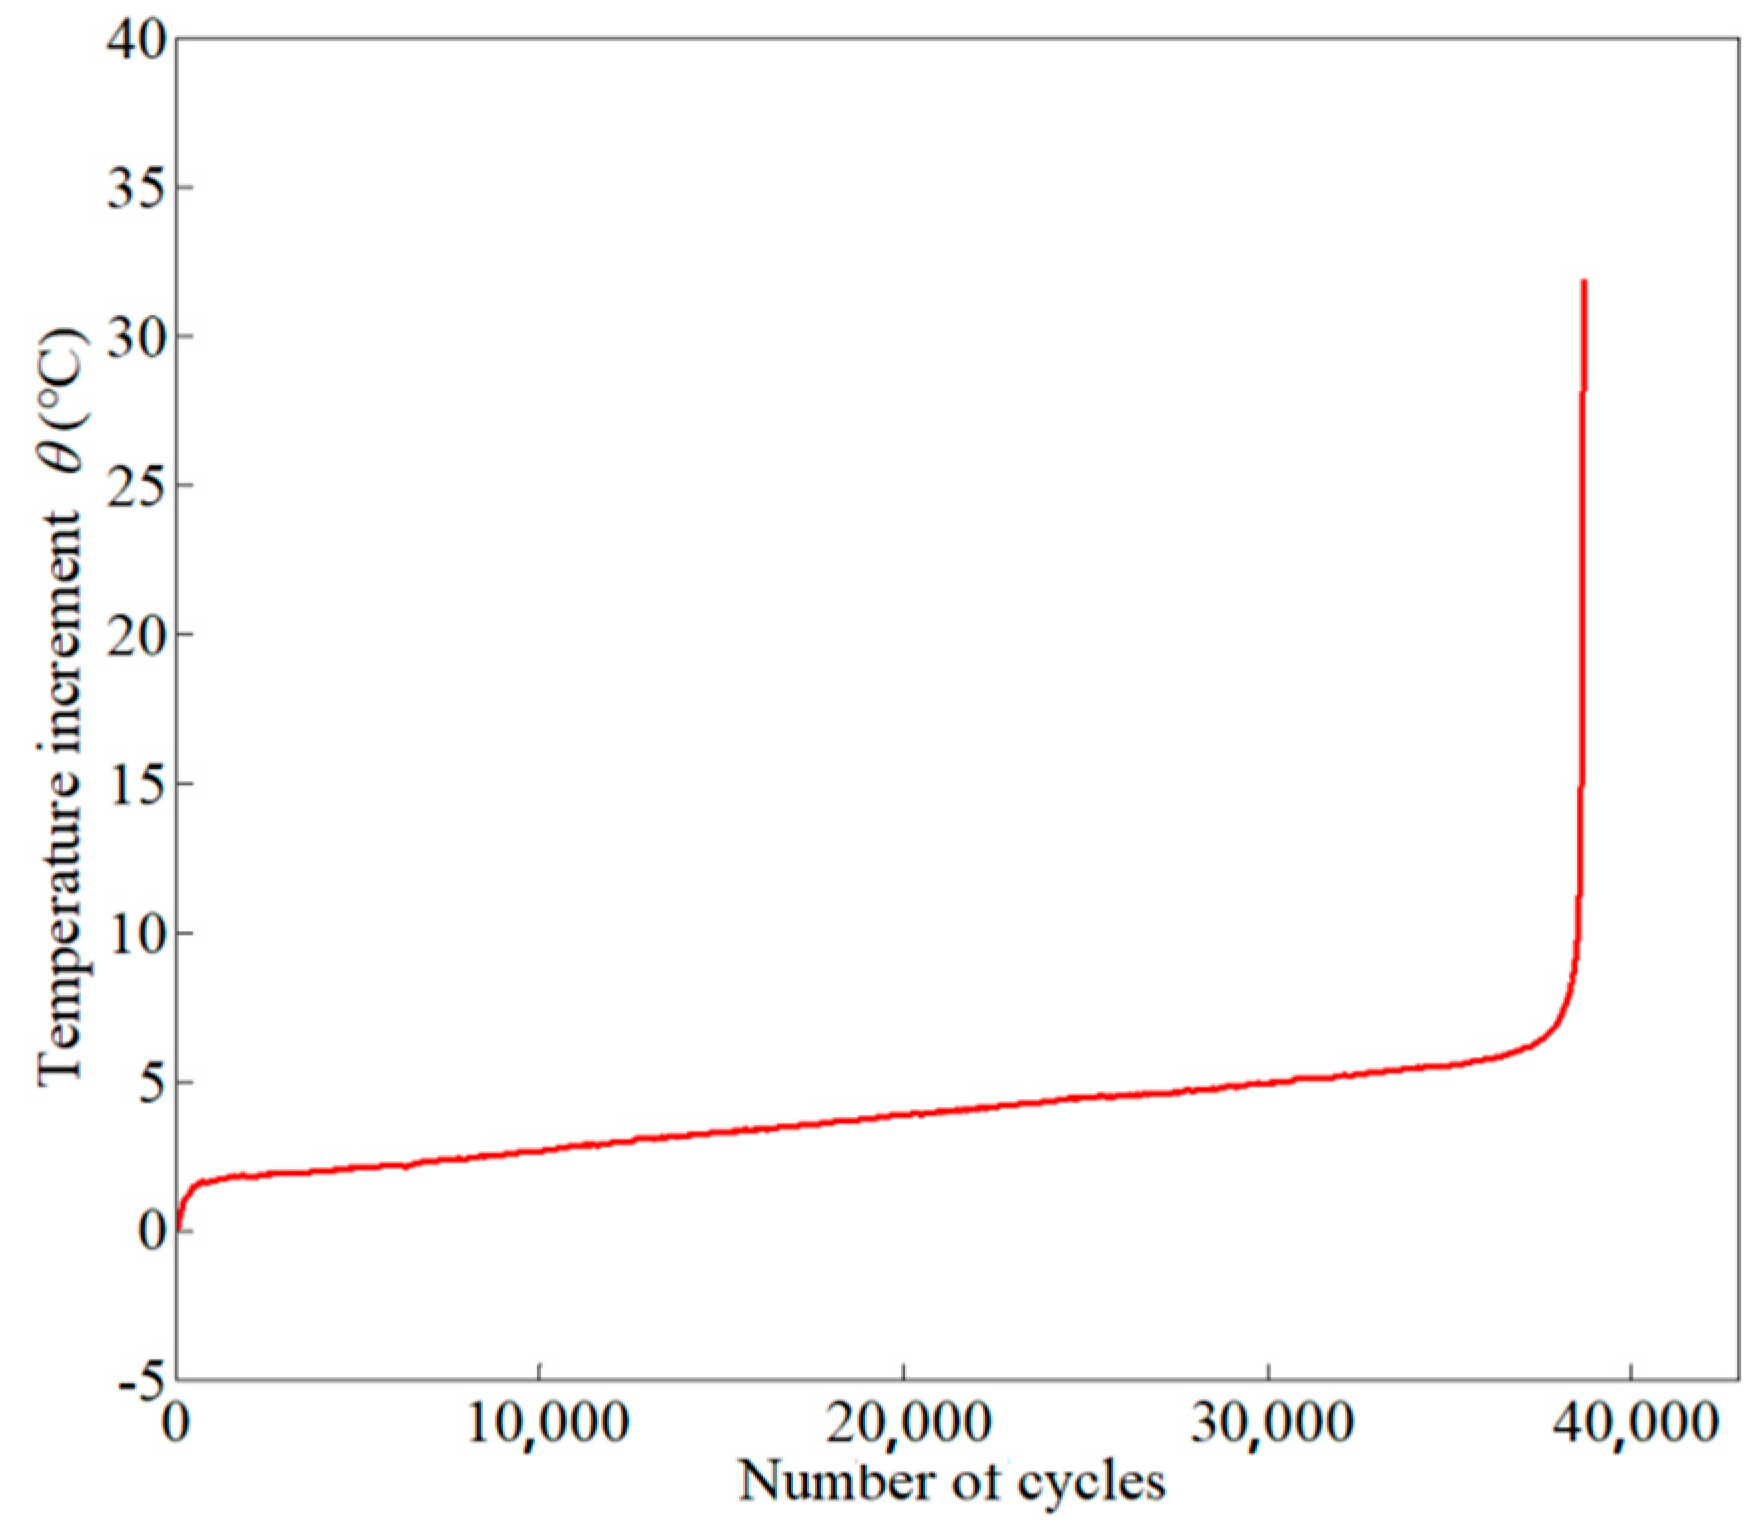
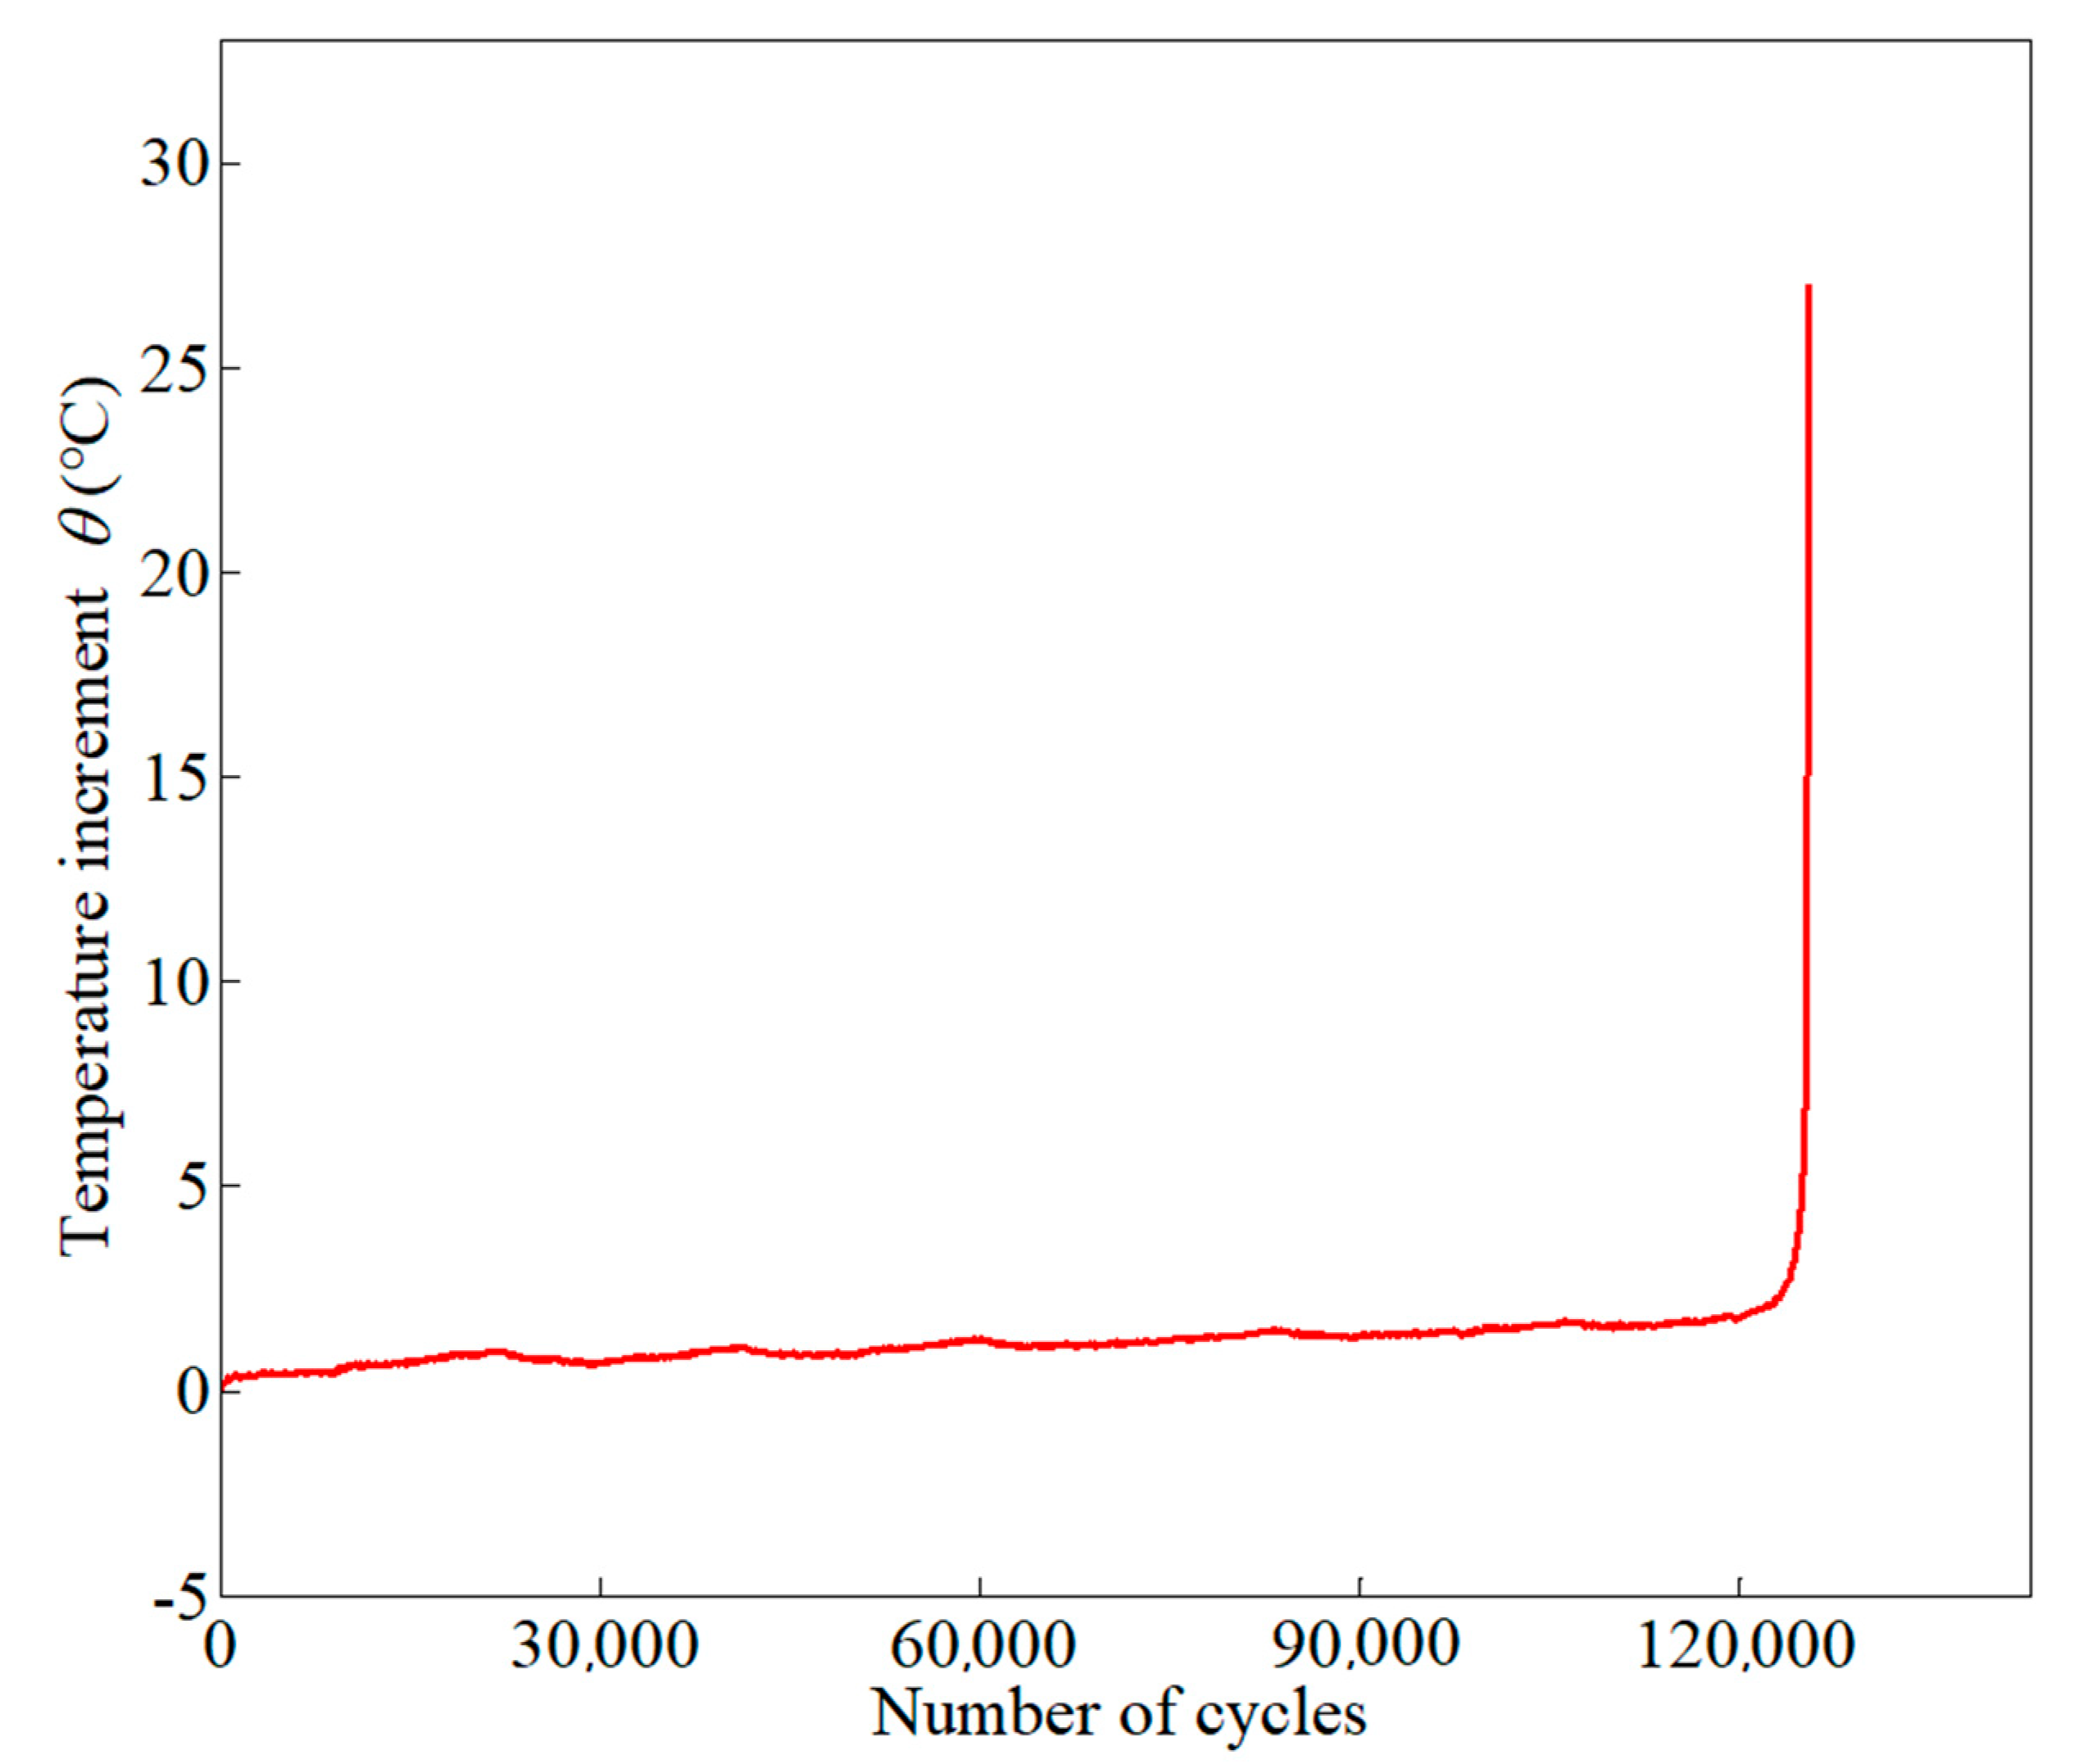
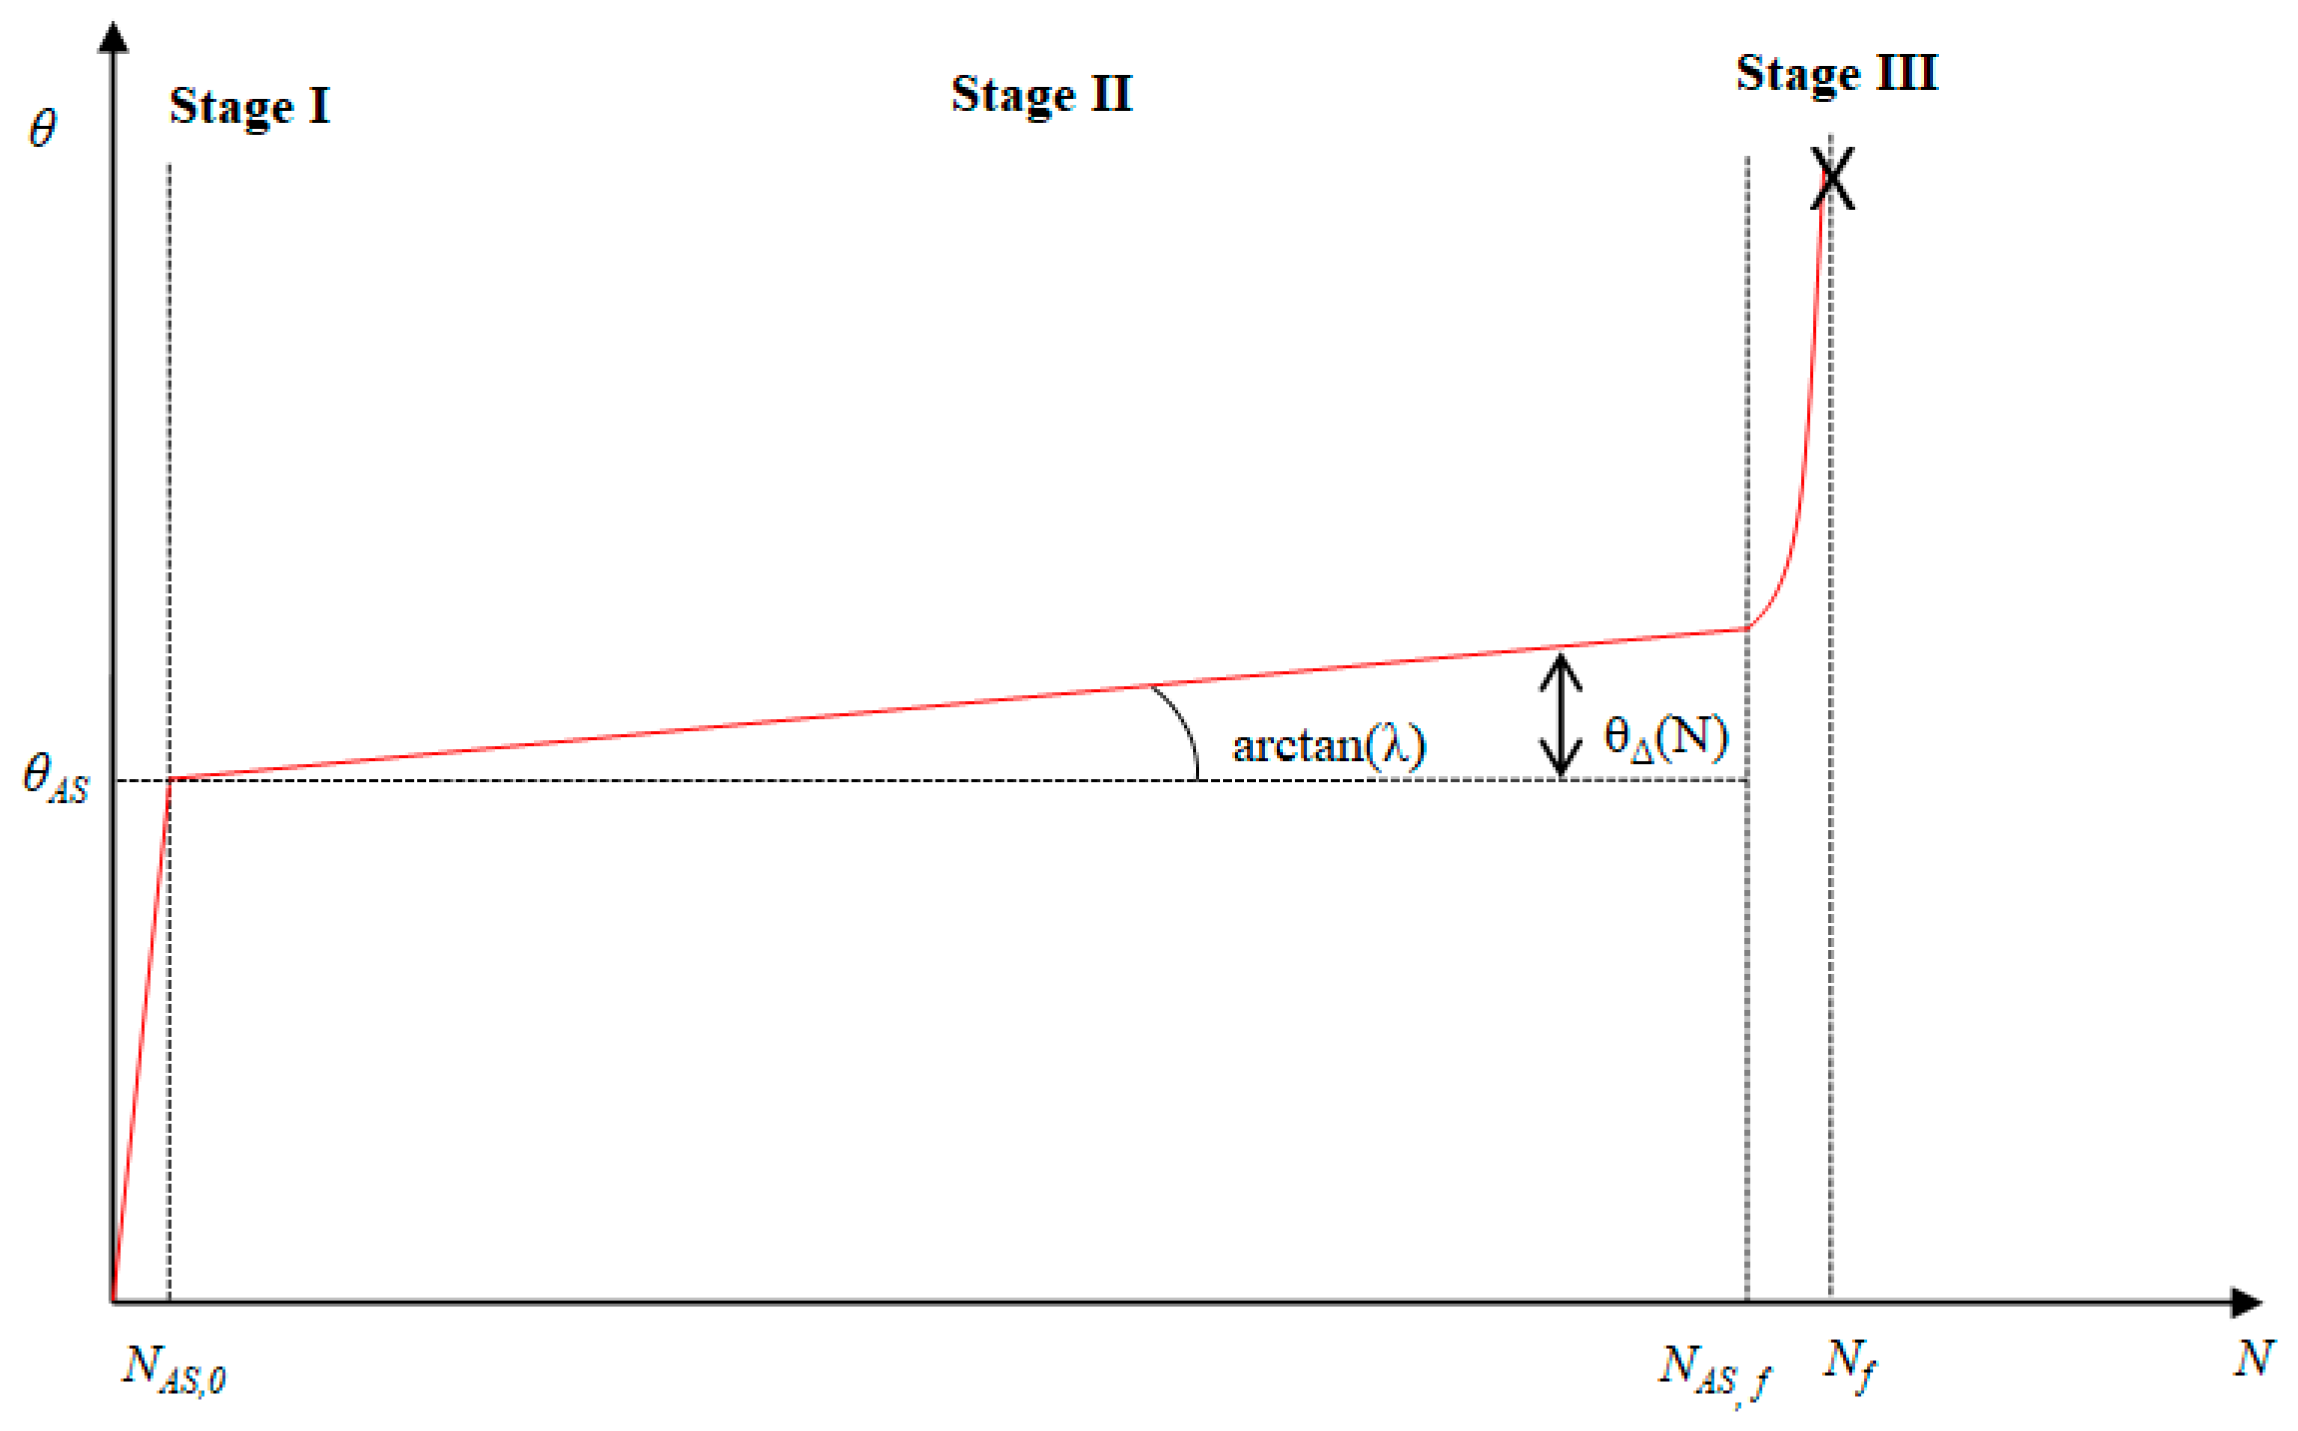
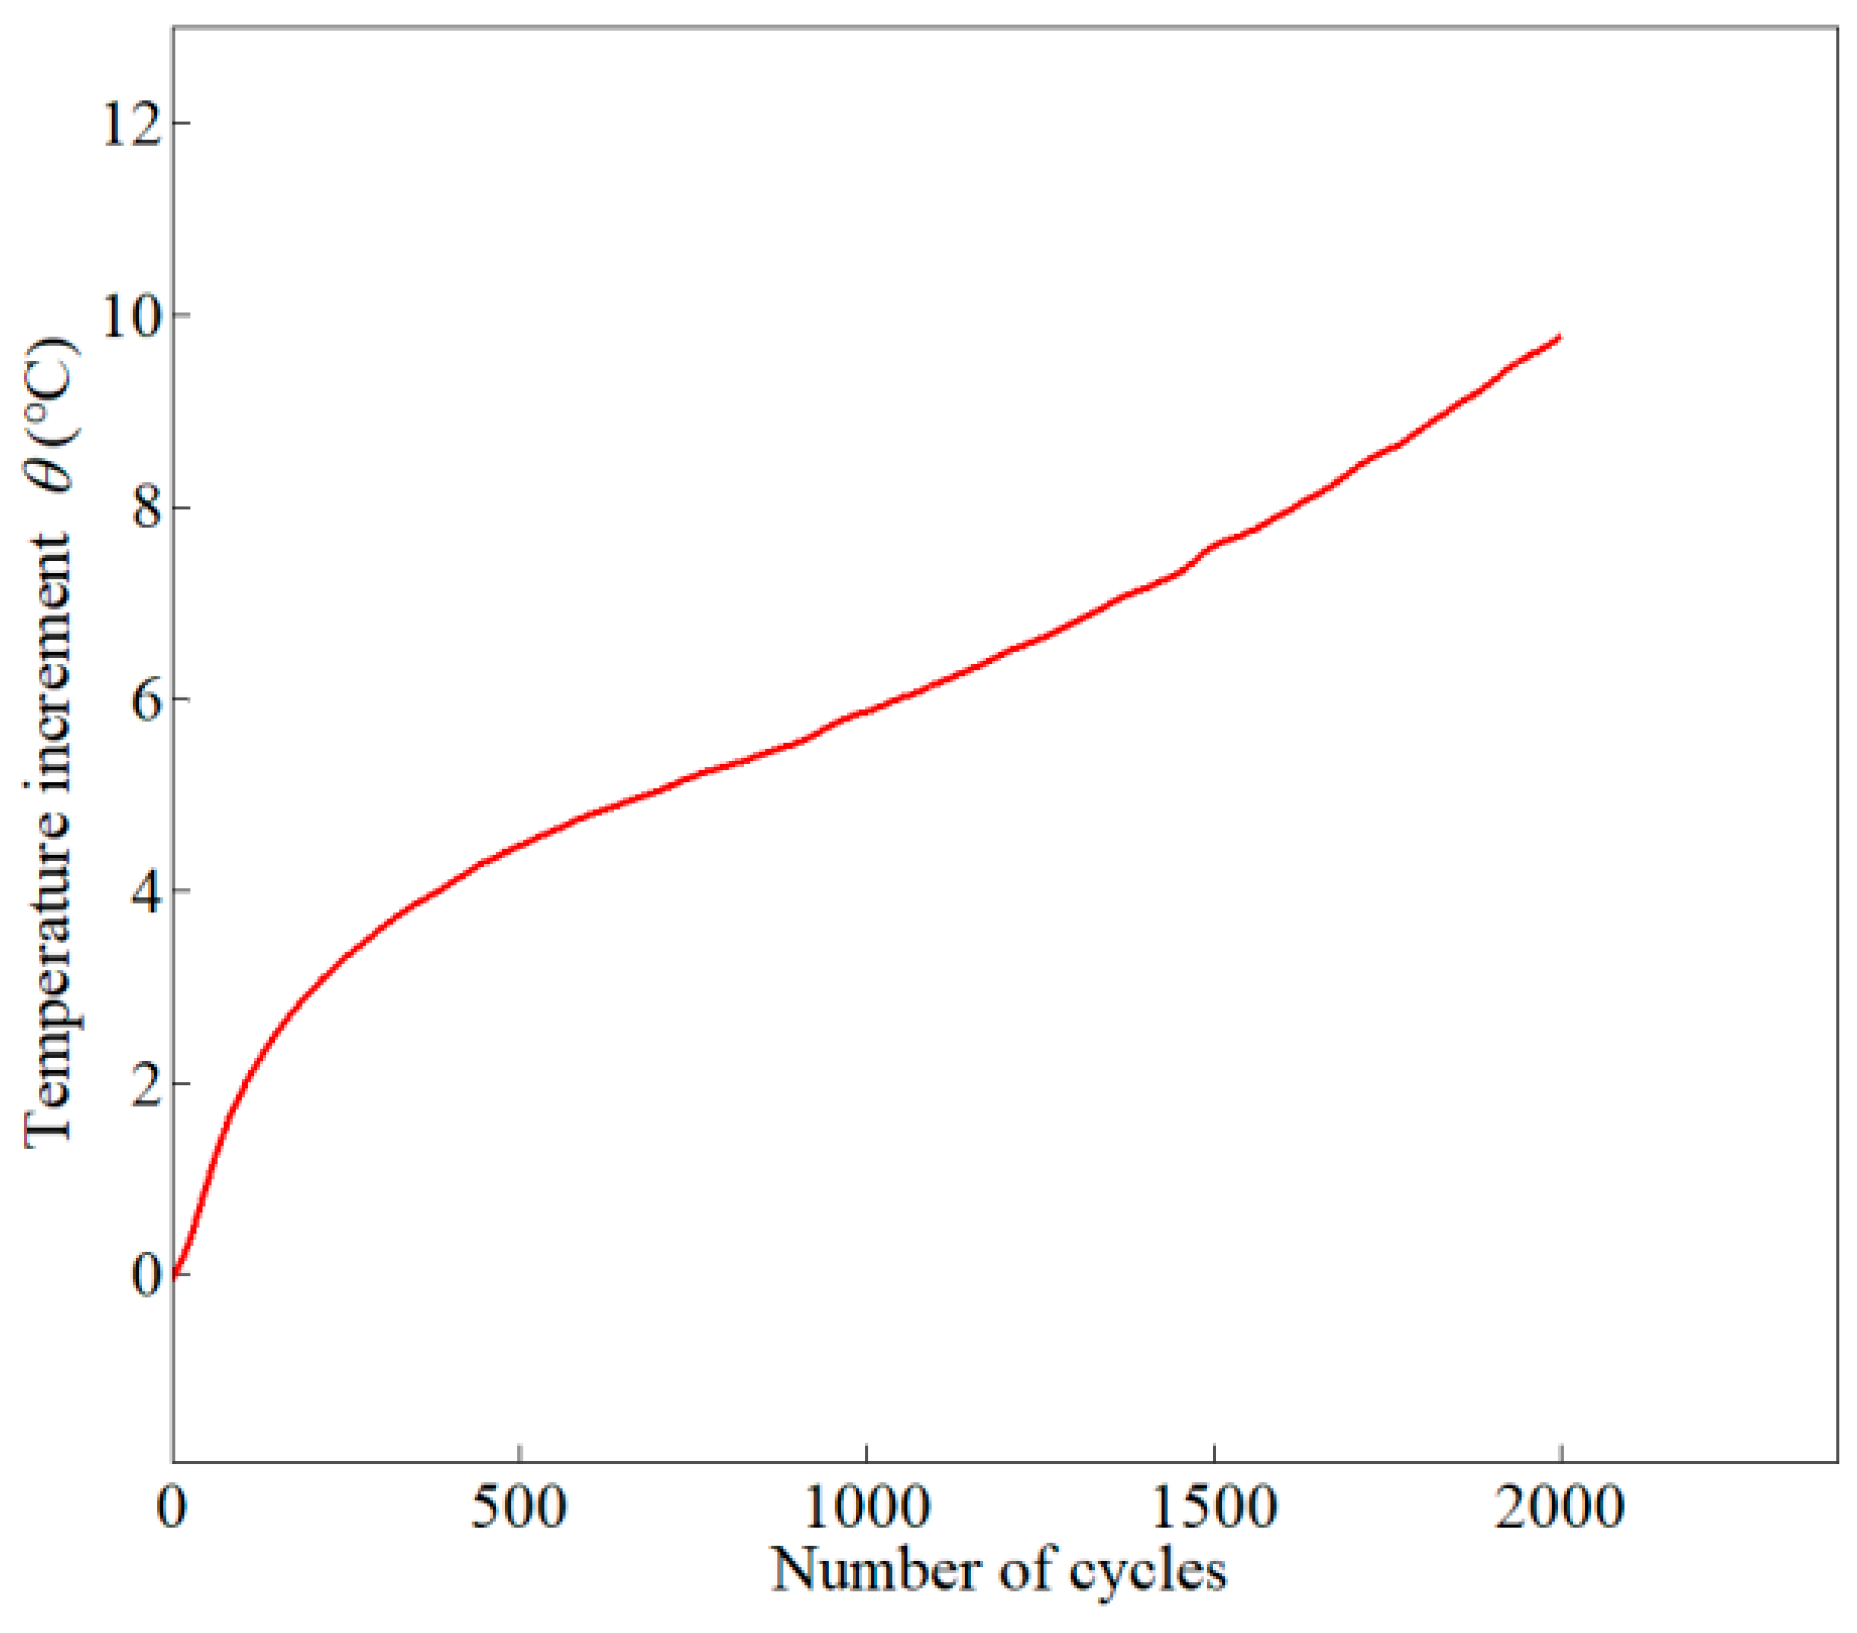
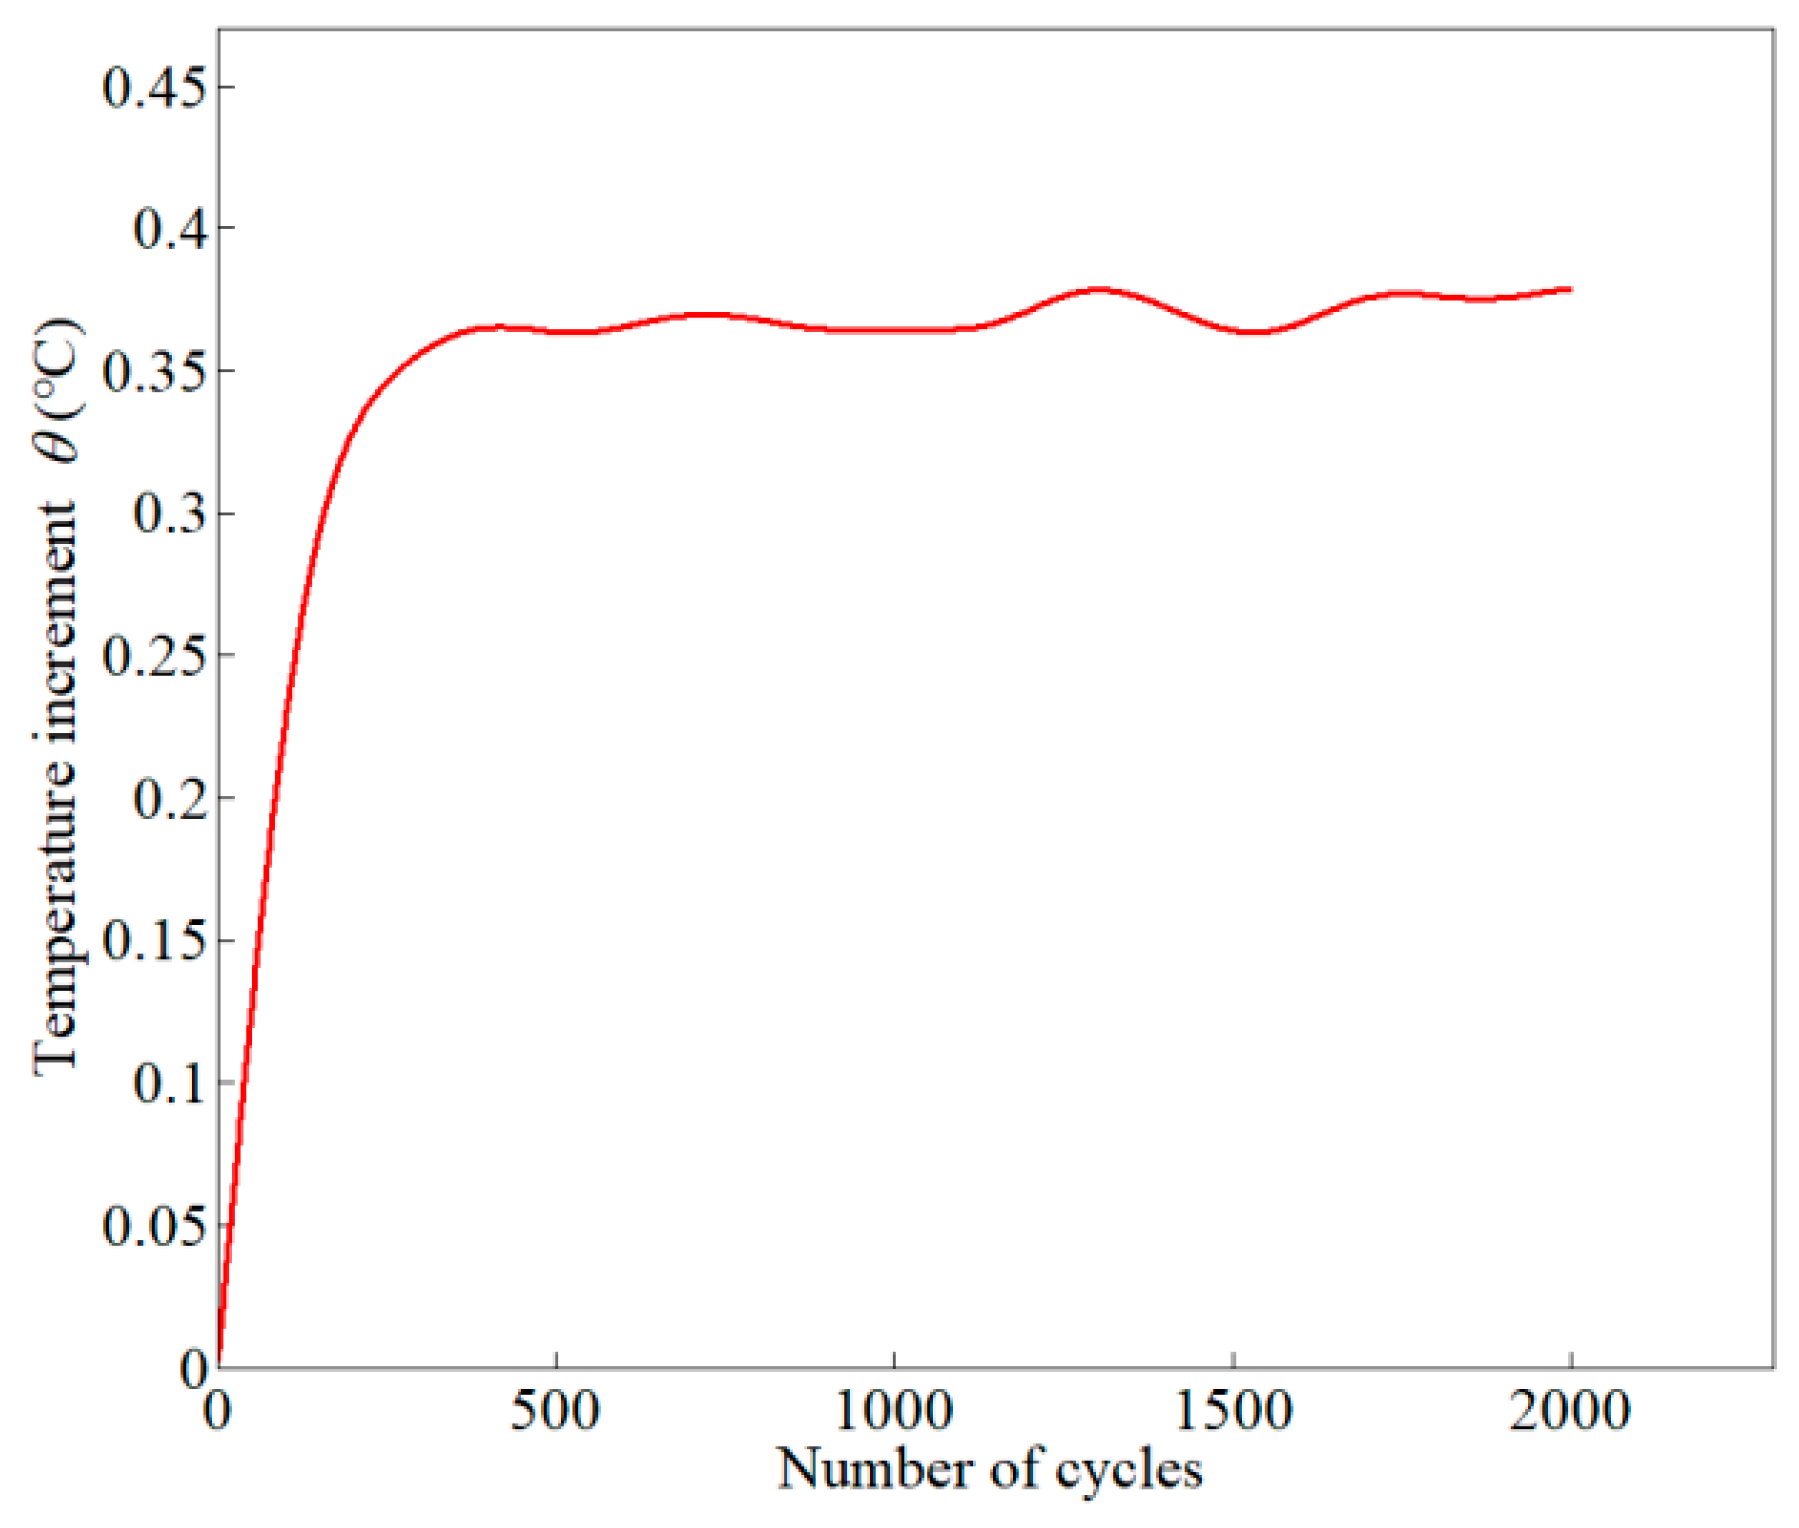
2.4. Thermal Evolution

The heat caused by the internal friction between microstructures under cyclic loading is dissipated through weld metal. The temperature increment θ with respect to initial temperature could be obtained from the thermal-graphic measurement. The thermal evolution in whole life cycles under stress amplitudes 300 MPa and 260 MPa are shown in Figure 7 and Figure 8, respectively. Before the temperature increment comes into the stable stage II, as shown in Figure 7, the temperature of the material surface increases continuously, due to cyclic straining, until a relative equilibrium state between the internal heat production and external heat exchange is reached [19,20,21,22,23]. Being different from pure metal materials, the temperature increment of this welded joint linearly increases during the stable stage II both in high stress amplitude and low stress amplitude. Thus, the method for calculating accumulated intrinsic dissipation and predicting lifespan has to be developed.

3. An Energy-Based Fatigue Life Prediction Method

3.1. Intrinsic Dissipation

According to the literature [23,24], the intrinsic dissipation based on a quantitative thermo-graphic method is considered as the fatigue indicator, instead of temperature produced on the material surface under cyclic loads. From the perspective of the fatigue damage mechanism, repeated work generated by the external loads facilitates micro grain movement and friction until the macro crack appears. During this damage evolution process, the mechanical energy transforms into heat energy, elastic and plastic strain energy, storage energy, and so on. Certainly, most of them are released in the form of heat energy, which results in thermal variations in the procedure of heat conduction, heat exchange, heat convection and heat radiation. However, it is not hard to see that the intrinsic dissipation determines thermal evolution, which is more suitable to describe fatigue failure behavior. It is assumed that there is an external heat source r during cyclic loading, while the total heat source s mainly includes three parts:
s = s t h e + d 1 + r
where s t h e is the thermoelastic heat source generated by the reversible elastic strain, and d 1 represents the intrinsic dissipation caused by the irreversible strains.
In view of thermodynamic laws, the heat source could be expressed by temperature differential equation, presented in the previous references [20,21,22,23,24]:
s = ρ C θ t k Δ θ
where ρ is density, C is specific heat, k is isotropic thermal conductivity, θ is temperature increment with respect to the initial temperature, t is time, and Δ is the Laplace operator. According to Chrysochoos and co-authors’ work [25], proposing 0D, 1D, 2D methods to solve the above differential equation, the 0D model is considered as the most appropriate approach for the heat solution in the high cycle fatigue test. Then, the term k Δ θ could be removed from Equation (2).
When the stress ratio R is minus one, the heat source s t h e tends to be zero because of the thermo-elastic coupling effect under tension-compression loading. If there is a mean stress, the heat contribution provided by the heat source s t h e is extremely small, so that it could be neglected in the thermal differential equation. The external heat source r is defined to describe heat conversion between the specimen and the environment. However, since the thermal parameters and exchange conditions are not easy to accurately determine, it has to be simplified according to the heat loss behavior. Finally, a linear equation is utilized to establish the relationship between the heat loss and temperature variation:
r = ρ C θ τ
where τ stands for a time constant characterizing the heat loss.
After Equation (1), Equation (2) and Equation (3) are integrated and deduced, the intrinsic dissipation d 1 could be expressed like this:
d 1 = ρ C ( θ t + θ τ )
It is worth mentioning that the intrinsic dissipation d 1 is defined as the average dissipated energy intensity of the affected region on the surface of the testing specimen. The heat diffusion along the thickness of specimen is assumed to be identical, while the heat loss between the specimen and the environment is still characterized by the term ρ C θ / τ , as shown in Equation (4).

3.2. Energy-Based Fatigue Life Model

In this paper, the intrinsic dissipation d 1 is regarded as the fatigue indicator. Once the fatigue damage is produced by each cyclic load, the dissipated energy is accumulated. In order to simplify calculation of the accumulated intrinsic dissipation d 1 c , the time t could be converted into the term N / f ( f = N / t ). Then, the total accumulated intrinsic dissipation d 1 c could be obtained from the definite integral of the intrinsic dissipation d 1 during the whole life cycle:
d 1 c = 0 N f d 1 / f d N
Based on the damage evolution law, the total accumulated intrinsic dissipation d 1 c has clear physical meaning, which represents the energy tolerance to failure of a kind of material applied by the cyclic loading. In other words, it is equal to the energy tolerance to failure E c .
In the Equation (4), it is noticed that the term θ / t would be zero if the asymptotic portion of temperature increase in stage II θ A S was constant. A large number of studies [23,24] support this conclusion for most pure materials. However, the welding process brings impurities and porosities, which results in non-linear fatigue damage evolution behavior and varying thermal dissipation during the whole fatigue process. Some researchers [22,23,24,25,26,27] also found there is the linear temperature evolution after the material gets into a stabilized stage II, as shown in Figure 9. Then, the energy tolerance to failure E c could be evaluated like this:
E c = d 1 c = 0 N f ρ C f ( θ N + θ τ ) d N
Wang et al. [28] presented that the temperature increment θ in stage II could be converted into the asymptotic portion of temperature increase θ A S and the incremental temperature θ Δ . It should be noted that the incremental temperature θ Δ represents the increased temperature with respect to the asymptotic portion of temperature increase θ A S during the stabilized stage II. According to the linear evolution behavior of the temperature increment θ in stage II versus the life cycles, the slope of the temperature variation curve is treated as the temperature increment rate λ , which is expressed like this:
λ = θ N = θ Δ N
Then, substituting Equation (7) into Equation (6) and taking the decomposition terms θ A S and θ Δ into account, the energy tolerance to failure E c is resolved by the following equation:
E c = 0 N f ρ C f ( θ N + θ A S + λ N τ ) d N
In fact, the number of cycles in both initial stage I and final stage III only accounts for a small part of whole life cycles, and could be ignored in the following definite integral of Equation (8). Then, its integrating result is indicated like this:
E c = ρ C λ 2 f τ N f 2 + ρ C λ f N f + ρ C θ A S f τ N f
According to Equation (9), the fatigue life N f related with dissipated energy could be calculated as the following equation:
N f = f τ ρ C λ ( 2 ρ C λ f τ E c + ( ρ C f λ + ρ C θ A S f τ ) 2 ρ C f λ ρ C θ A S f τ )
Based on Equation (10), the cyclic loading had to at least reach into the early stage II for calculating the asymptotic portion of temperature increase θ A S and the temperature increment rate λ . Once these two parameters were defined, the remaining lifetime or fatigue damage could be derived according to Equation (10) regardless of whether the thermal measurement is suspended or not.
In order to calculate intrinsic dissipation, the thermo-physical parameters and loading frequency needed to calculate the intrinsic dissipation are given in Table 3. It is worth mentioning that the time parameter τ was ascertained by calculating the heat loss from the peak temperature to the room temperature, also listed in Table 3.
Furthermore, from the above Equation (9), the energy tolerance to failure E c could be estimated once the fatigue life and loading conditions are determined. Combined, the thermal evolution in the whole lifespan under constant stress amplitudes with thermo-physical parameters, and the energy tolerances to failure E c for different stress amplitudes are listed in Table 4. It is very interesting to note that all energy tolerances to failure E c are close to 1.0 × 10⁹ J/m3. The energy tolerance to failure E c represents the inherent nature of the material or structure in some way and is independent of loading conditions. Its significance lies in allowable precise fatigue life estimation, based on Equation (10), if the thermal evolution within a certain cycle could be ascertained.
Based on the results mentioned above, the thermal evolution in 2000 cycles under stress amplitudes 340 MPa and 240 MPa are shown in Figure 10 and Figure 11, respectively. The asymptotic portion of temperature increase θ A S during the stabilized stage II and the temperature increment rate λ could be obtained from the temperature variation. Then, according to Equation (10), their life expectancies are assessed and listed in Table 5. The predicted cycles for these welded joints under high stress amplitude and low high stress amplitude are both close to experimental ones. This energy-based approach could effectively predict fatigue life for high strength welded joints through thermal-graphic measurement, merely based on the thermal evolution in several thousand cycles. Once the energy tolerance to failure E c is determined, only a very small amount of time is needed to predict life expectancy. Notably, this specimen is a typical flat butt welded joint and is applied with traditional fully reversed cyclic loadings, so its thermal evolution behavior could be helpful for characterizing the energy dissipation mechanism of similar welded structures with the same loading modes.

4. Conclusions

A fatigue life assessment model based on intrinsic energy dissipation was conducted on high strength steel welded joints. This method suggested that the intrinsic energy dissipation was considered as a fatigue indicator, rather than temperature. In this model, the linear temperature evolution in stage II was fully taken into account to guarantee calculation precision, and its predicted results were in good agreement with experimental ones for different stress amplitudes. This approach had an apparent distinct advantage in testing efficiency, because limited testing time and specimens were needed for lifetime modeling and estimation.
It was interesting to find that the energy tolerance to failure E c tended to be a constant for these welded joints under different stress amplitudes. In some way, this parameter characterized fatigue damage accumulation in the whole lifespan, and was equal and load-independent. This result may also be helpful for predicting the remaining service life of welded engineering structures, once the thermal evolution in certain cycles is obtained.

Author Contributions

Conceptualization, C.M. and F.B.; Methodology, C.M.; Software, W.L.; Validation, W.L.; Formal Analysis, C.M.; Investigation, C.M.; Resources, C.M.; Data Curation, X.X.; Writing-Original Draft Preparation, C.M.; Writing-Review & Editing, F.B.; Visualization, X.X.; Supervision, F.B.; Project Administration, C.M.; Funding Acquisition, C.M.

Funding

This research was funded by [Natural Science Foundation of Hunan Province] grant number [2017JJ3059], and [Postdoctoral Science Foundation] grant number [2017M622569], and [State Key Laboratory of Advanced Design and Manufacturing for Vehicle Body] grant number [31715012].

Acknowledgments

The authors gratefully thank for the support of the Hunan Province Natural Science Foundation (Grant No.: 2017JJ3059) and China Postdoctoral Science Foundation (Grant No.: 2017M622569) and Open Foundation of State Key Laboratory of Advanced Design and Manufacturing for Vehicle Body (Grant No.: 31715012).

Conflicts of Interest

The authors declare no conflict of interest. The funders had no role in the design of the study; in the collection, analyses, or interpretation of data; in the writing of the manuscript, and in the decision to publish the results.

References

  1. Shiozaki, T.; Yamaguchi, N.; Tamai, Y.; Hiramoto, J.; Ogawa, K. Effect of weld toe geometry on fatigue life of lap fillet welded ultra-high strength steel joints. Int. J. Fatigue 2018, 116, 409–420. [Google Scholar] [CrossRef]
  2. Costa, J.D.M.; Ferreira, J.A.M.; Abreu, L.P.M. Fatigue behavior of butt welded joints in a high strength steel. Procedia Eng. 2010, 2, 697–705. [Google Scholar] [CrossRef]
  3. Ma, L.L.; Wei, Y.H.; Hou, L.F.; Guo, C.L. Evaluation on fatigue performance and fracture mechanism of laser welded TWIP steel joint based on evolution of microstructure and micromechanical properties. J. Iron Steel Res. Int. 2016, 23, 677–684. [Google Scholar] [CrossRef]
  4. D’Angelo, L.; Nussbaumer, A. Estimation of fatigue S-N curves of welded joints using advanced probabilistic approach. Int. J. Fatigue 2017, 97, 98–113. [Google Scholar] [CrossRef] [Green Version]
  5. Ding, Y.L.; Song, Y.S.; Cao, B.Y.; Wang, G.X.; Li, A.Q. Full-range S-N fatigue life evaluation method for welded bridge structures considering hot-spot and welding residual stress. J. Bridge Eng. 2016, 21, 1–10. [Google Scholar] [CrossRef]
  6. Deng, C.; Liu, Y.; Gong, B.; Wang, D. Numerical implementation for fatigue assessment of butt joint improved by high frequency mechanical impact treatment: A structural hot spot stress approach. Int. J. Fatigue 2016, 92, 211–219. [Google Scholar] [CrossRef]
  7. Stenberg, T.; Barsoim, Z.; Balawi, S.O.M. Comparison of local stress based concepts- Effects of low- and high cycle fatigue and weld quality. Eng. Fail. Anal. 2015, 57, 323–333. [Google Scholar] [CrossRef]
  8. Schork, B.; Kucharczyk, P.; Madia, M.; Zerbst, U.; Hensel, J.; Bernhard, J.; Tchuindjang, D.; Kaffenberger, M.; Oechsner, M. The effect of the local and global weld geometry as well as material defects on crack initiation and fatigue strength. Eng. Fract. Mech. 2018, 198, 103–122. [Google Scholar] [CrossRef]
  9. Varvani-Farahani, A.; Kodric, T.; Ghahramani, A. A method of fatigue prediction in notched and un-notched components. J. Mater. Process. Technol. 2005, 169, 94–102. [Google Scholar] [CrossRef]
  10. Nykanen, T.; Mettanen, H.; Bjork, T.; Ahola, A. Fatigue assessment of welded joints under variable amplitude loading using a novel notch stress approach. Int. J. Fatigue 2017, 101, 177–191. [Google Scholar] [CrossRef]
  11. Gu, Z.; Mi, C.; Ding, Z.; Zhang, Y.; Liu, S.; Nie, D. An energy-based fatigue life prediction of a mining truck welded frame. J. Mech. Sci. Technol. 2016, 30, 3615–3624. [Google Scholar] [CrossRef]
  12. Berto, F.; Vinogradov, A.; Filippi, S. Application of the strain energy density approach in comparing different design solutions for improving the fatigue strength of load carrying shear welded joints. Int. J. Fatigue 2017, 101, 371–384. [Google Scholar] [CrossRef]
  13. Chapetti, M.D.; Jaureguizahar, L.F. Fatigue behavior prediction of welded joints by using an integrated fracture mechanics approach. Int. J. Fatigue 2012, 43, 43–53. [Google Scholar] [CrossRef]
  14. Meneghetti, G.; Ricotta, M. The use of the specific heat loss to analyze the low- and high-cycle fatigue behavior of plain and notched specimens made of a stainless steel. Eng. Fract. Mech. 2012, 81, 2–16. [Google Scholar] [CrossRef]
  15. Palumbo, D.; Galietti, U. Characterisation of steel welded joints by infrared thermographic methods. Quant. Infrared Thermogr. J. 2014, 11, 29–42. [Google Scholar] [CrossRef]
  16. Palumbo, D.; de Finis, R.; Ancona, F.; Galietti, U. Damage monitoring in fracture mechanics by evaluation of the heat dissipated in the cyclic plastic zone ahead of the crack tip with thermal measurement. Eng. Fract. Mech. 2017, 181, 65–76. [Google Scholar] [CrossRef]
  17. Luong, M.P. Fatigue limit evaluation of metals using an infrared thermographic technique. Mech. Mater. 1998, 28, 155–163. [Google Scholar] [CrossRef]
  18. La Roa, G.; Risitano, A. Thermographic methodology for rapid determination of the fatigue limit of materials and mechanical components. Int. J. Fatigue 2000, 22, 65–73. [Google Scholar] [CrossRef]
  19. Wang, X.G.; Crupi, V.; Jiang, C.; Guglielmino, E. Quantitative thermographic methodology for fatigue life assessment in a multiscale energy dissipation framework. Int. J. Fatigue 2015, 81, 249–256. [Google Scholar] [CrossRef]
  20. Wang, X.G.; Crupi, V.; Guo, X.L.; Zhao, Y.G. Quantitative thermographic methodology for fatigue assessment and stress measurement. Int. J. Fatigue 2010, 32, 1970–1976. [Google Scholar] [CrossRef]
  21. Corigliano, P.; Crupi, V.; Epasto, G.; Guglielmino, E.; Risitano, G. Fatigue life prediction of high strength steel welded joints by energy approach. Procedia Struct. Integr. 2016, 2, 2156–2163. [Google Scholar] [CrossRef]
  22. Crupi, V.; Gugliemino, E.; Maestro, M.; Marino, A. Fatigue analysis of butt welded AH36 steel joints: Thermographic method and design S N curve. Mar. Struct. 2009, 22, 373–386. [Google Scholar] [CrossRef]
  23. Guo, Q.; Guo, X.; Fan, J.; Syed, R.; Wu, C. An energy method for rapid evaluation of high-cycle fatigue parameters based on intrinsic dissipation. Int. J. Fatigue 2015, 80, 136–144. [Google Scholar] [CrossRef]
  24. Amiri, M.; Khonsari, M.M. Rapid determination of fatigue failure based on temperature evaluation: Fully reversed bending load. Int. J. Fatigue 2010, 32, 382–389. [Google Scholar] [CrossRef]
  25. Berthel, B.; Chrysochoos, A.; Wattrisse, B.; Galtier, A. Infrared image processing for the calorimetric analysis of fatigue phenomena. Exp. Mech. 2008, 48, 79–90. [Google Scholar] [CrossRef]
  26. Plekhov, O.A.; Saintier, N.; Palin-Luc, T.; Uvarov, S.V.; Naimark, O.B. Theoretical analysis, infrared and structural investigations of energy dissipation in metals under cyclic loading. Mater. Sci. Eng. A 2007, 462, 367–369. [Google Scholar] [CrossRef] [Green Version]
  27. Dumoulin, S.; Louche, H.; Hopperstad, O.S.; Børvik, T. Heat sources, energy storage and dissipation in high-strength steels: Experiments and modeling. Eur. J. Mech. 2010, 29, 461–474. [Google Scholar] [CrossRef]
  28. Wang, X.G.; Crupi, V.; Jiang, C.; Feng, E.S.; Guglielmino, E.; Wang, C.S. Energy-based approach for fatigue life prediction of pure copper. Int. J. Fatigue 2017, 104, 243–250. [Google Scholar] [CrossRef]
Figure 1. Specimen geometry of welded joint (all dimensions in mm, roughness in micrometers, tolerance for all dimensions ±0.01).
Applsci 09 00397 g001
Figure 2. Residual stress measurement by X-ray.
Applsci 09 00397 g002
Figure 3. Layout of measurement points.
Applsci 09 00397 g003
Figure 4. Stress and strain responses under monotonic tensile loading.
Applsci 09 00397 g004
Figure 5. Installation diagram of the fatigue test and thermal measurement.
Applsci 09 00397 g005
Figure 6. Temperature distribution contour measured by IR camera (unit: °C).
Applsci 09 00397 g006
Figure 7. The thermal evolution in whole life cycles under stress amplitude 300 MPa.
Applsci 09 00397 g007
Figure 8. The thermal evolution in whole life cycles under stress amplitude 260 MPa.
Applsci 09 00397 g008
Figure 9. Schematic diagram of temperature evolution versus life cycles during three stages.
Applsci 09 00397 g009
Figure 10. The thermal evolution in 2000 cycles under stress amplitude 340 MPa.
Applsci 09 00397 g010
Figure 11. The thermal evolution in 2000 cycles under stress amplitude 240 MPa.
Applsci 09 00397 g011
Table 1. Residual stress measured by X-ray.
Point 1 (MPa)Point 2 (MPa)Point 3 (MPa)
−14.55 ± 3.27−16.84 ± 12.515.09 ± 6.86
Table 2. Mechanical parameters of welded joint.
Young’s Modulus E (GPa)205
Yield Strength σ y (MPa)365
Ultimate Tensile Strength σ U T S (MPa)500
Table 3. Thermo-physical and boundary parameters of the welded joints.
ρ (kg·m−3) C (J·kg−1·K−1) k (WK−1·m−1) τ (s) f (Hz)
785046045.514.7~35.220
Table 4. Energy tolerance to failure E C under different stress amplitude.
Stress   Ratio   R Stress   Amplitude   σ a   ( MPa ) E C   ( J / m 3 )
−13001.0091 × 109
−12600.9653 × 109
Table 5. Predicted results under different stress amplitude.
Stress   Ratio   R Stress   Amplitude   σ a   ( MPa ) Predicted CyclesExperimental Cycles
−134011,80912,877
−1240401,025386,302

