Article

Wind Characteristics Investigation on The Roofs of Three Adjacent High-Rise Buildings in a Coastal Area during Typhoon Meranti

1
Key Laboratory of Building Safety and Efficiency of the Ministry of Education, Hunan University, Changsha 410082, China
2
Civil Engineering College, Hunan University of Technology, Zhuzhou 412007, China
3
School of Vocational Engineering, Health and Sciences, RMIT University, GPO Box 2476, Melbourne VIC 3001, Australia
*
Author to whom correspondence should be addressed.
Appl. Sci. 2019, 9(3), 367; https://doi.org/10.3390/app9030367
Submission received: 7 December 2018 / Revised: 15 January 2019 / Accepted: 16 January 2019 / Published: 22 January 2019
(This article belongs to the Special Issue Structural Damage Detection and Health Monitoring)

Abstract

:
This paper presents the study of the pulsating characteristics of three adjacent high-rise buildings A, B, and C under typhoon ‘Moranti’ (2016) based on the measurement of the actual top wind speed. The studied pulsating characteristics included mean wind speed and direction, turbulence intensity, gust factor, turbulence integral scale, wind speed spectrum and correlation. The relationships between each pulsating parameter and the relationship between the pulsating parameter and gust duration have been investigated. Results show that the mean wind speed and wind direction of three buildings are close. When U ≥ 10 m/s in three different sites at the same time, the turbulence intensity variation of three buildings is consistent and decreases when mean wind speed increases. Once only two locations are acquired simultaneously and the wind angle between 35° and 45°, the mean values of the along-wind and cross-wind turbulence of building A and building C are close. The along-wind turbulence of the three buildings is greater than the predicted Chinese codes for various terrains. The turbulence intensity and gust factors obtained through the analysis of the samples with the mean wind speed U ≥ 10 m/s are reasonable. The turbulence integral scales of buildings A and C are equal to the predicted values of ASCE-7 and AIJ-2004, whereas the turbulent integral scale of building B is evidently small. The gust factors of three buildings increase when the turbulence intensity increases; these two characteristics have a linear relationship. At the same time interval, building B has the maximum along-wind turbulence intensity and gust factors during the low wind speed period and building C achieves the minimum values. Building A acquires the maximum and building C obtains the minimum values in the high wind speed period. The turbulence intensity and gust factors of building B show a certain pulsation. Results show that turbulence intensity and gust factors are mainly affected by the short-term fluctuation of wind. The longitudinal wind speed spectrum of three buildings conforms well to the von Karman model. The correlation of along-wind speed depends on the wind speed, whereas the correlation of cross-wind direction is independent of wind speeds. The measured data and statistical parameters provide useful information for the wind resistance design of high-rise buildings in typhoon-prone areas.

Graphical Abstract

1. Introduction

Typhoons are highly destructive and disastrous weather systems and one of the major catastrophic weather systems that affect China. Approximately 35% of the typhoons in the entire Northwest Pacific Ocean land in China. Further attention should be paid to the harmful vibration of high-rise buildings caused by typhoons to ensure the structural safety and the comfort of residents. Therefore, analysis the typhoon characteristics, including wind field distribution and its evolution, to estimate the dynamic environment parameters and the engineering design of disaster prevention and mitigation is very important [1].
Given the particularity of each typhoon, they are difficult to simulate in the laboratory; consequently, field measurement is the most effective method and has increasingly become as an important basic and long-term direction in the study of structural wind resistance [2]. Countries with developed wind engineering research have successively established a database of wind characteristics in the region and obtained relatively complete analysis results through large-scale observations. Davenport proposed the popular Davenport spectrum [3] and several concepts of the atmospheric boundary layer, such as gradient wind, exponential law, and ground roughness, by which different terrain types are described [4] based on the statistics of the horizontal component of gust in approximately 70 spectra in strong winds. Jackson, Lösslein, Bowen, Kato et al. revealed the effects of height, ground roughness and wind speed on wind characteristics by performing a series of observations of the Gust factor, turbulence and integral length scale measured at different heights [5,6,7,8]. Li and Gu have the experimental studies of wind characteristics in China, they have monitored representative super-high-rise buildings in China to investigate wind characteristics at the top of buildings, such as mean wind speed and direction, turbulence intensity, gust factor, turbulence integral scale, wind speed spectrum and correlation [9,10,11]. An et al. have investigated the relationship between different pulsating parameters and between the pulsating parameters and gust duration by using an anemometer at the top of a building [12]. Several field measurements have been carried out on the top of high-rise buildings in Guangzhou and Shanghai, the wind characteristics, such as mean wind speed, mean wind direction, turbulence intensity, gust factor, turbulence integral length scale, probability distribution of fluctuating wind speed, and wind speed spectrum, are analyzed. These super-tall buildings are all urban landmark buildings, and their high-altitude wind characteristics are representative. However, the plane size of a single high-rise building is relatively limited, so it is difficult to conduct multi-point synchronous observation. At present, research on multi-point simultaneous observation of wind fields is generally only found in the study of extra-large bridge projects. Such as field measurement of the Great Belt Bridge in Danish [13]. Toriumi made field measurements of natural wind conducted at the Ohnaruto Bridge and the Akashi-Kaikyo Bridge [14]. For the purpose of investigating the turbulent characteristics of strong wind during a typhoon landing period, two 3-dimensional ultrasonic anemometer stations are set up 30 m horizontally apart on the Macao Friendship Bridge [15]. However, these field studies are limited to the wind field characteristics under the condition of relatively open topography near the ground, and with the continuous increase in the height of high-rise buildings being built, more attention is paid to the multi-point wind characteristics at heights above 100 m.
Although researchers have exerted considerable effort in the measurement of typhoon wind characteristics and structure response under the action of typhoons, the understanding of typhoon wind characteristics remains unclear due to the high cost, long period, and difficulty of field measurement. Thus, the study of strong wind characteristics in China is relatively insufficient in general. Insufficient field-measured data have become the main factor hindering the study of wind characteristics, especially the research on wind characteristics at the top of several adjacent high-rise buildings. Given that typhoons often affect Xiamen, the field measurement of typhoon wind characteristics in Xiamen for studying wind characteristics in Eastern China is vital. This study maintains a process monitoring record of strong wind characteristics at the top of three adjacent super-high-rise buildings in Xiamen under the action of typhoon ‘Moranti’ (2016). Through a statistical analysis of the pulsating characteristics during typhoons, this work can be a reference for wind-resistant design of super-high-rise buildings in the future.

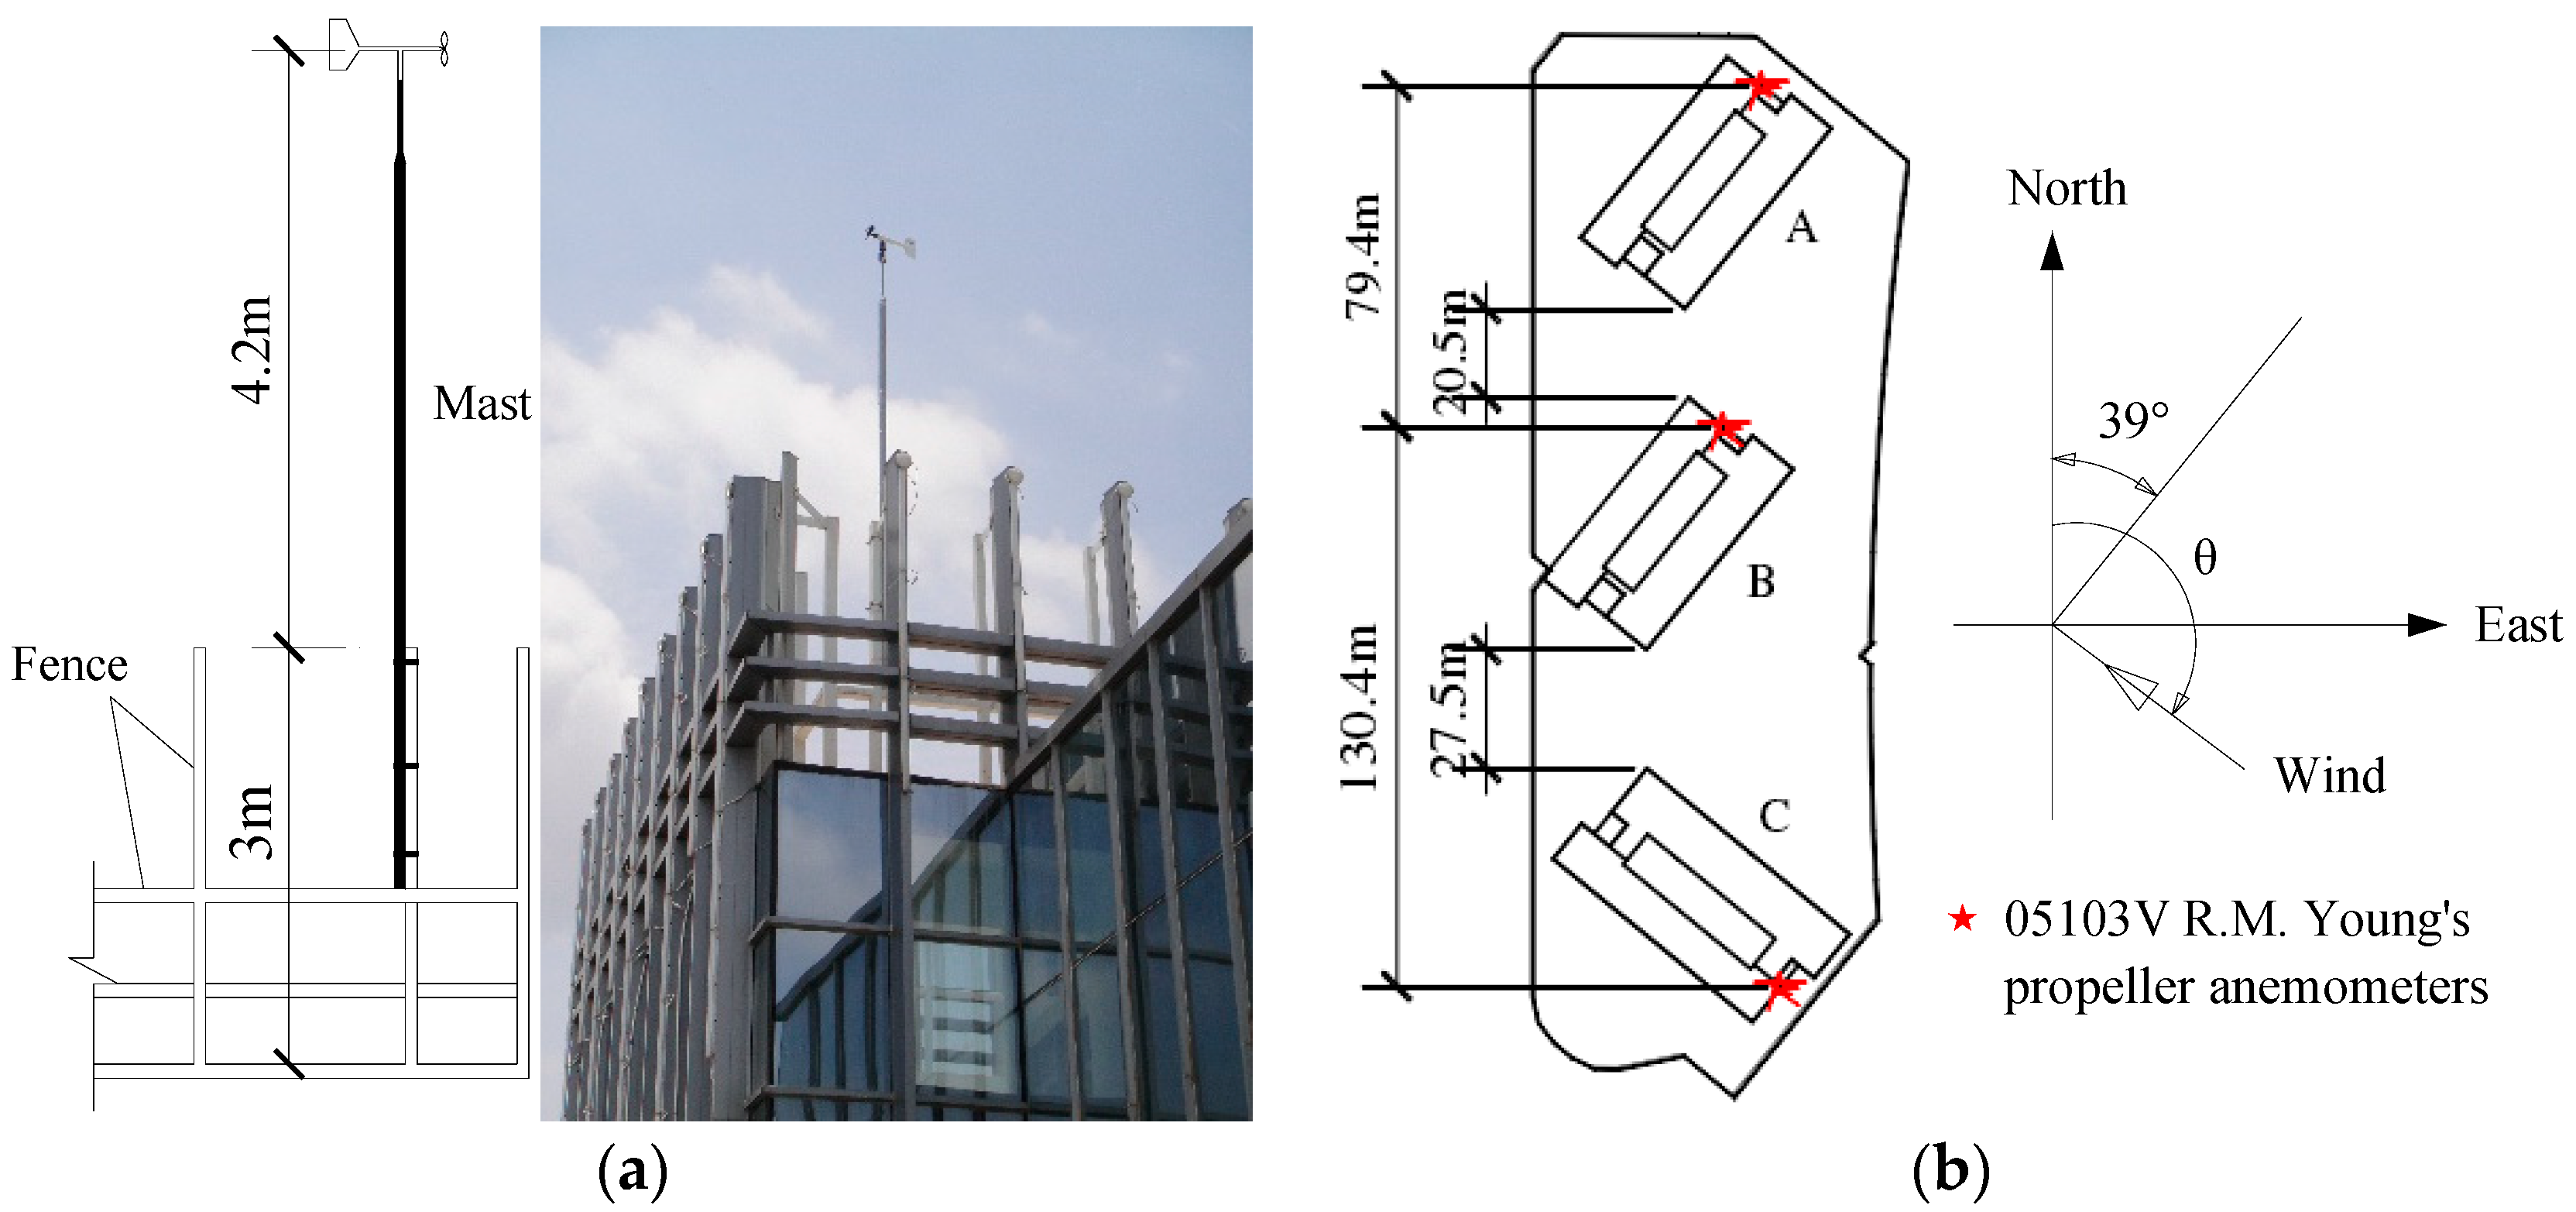
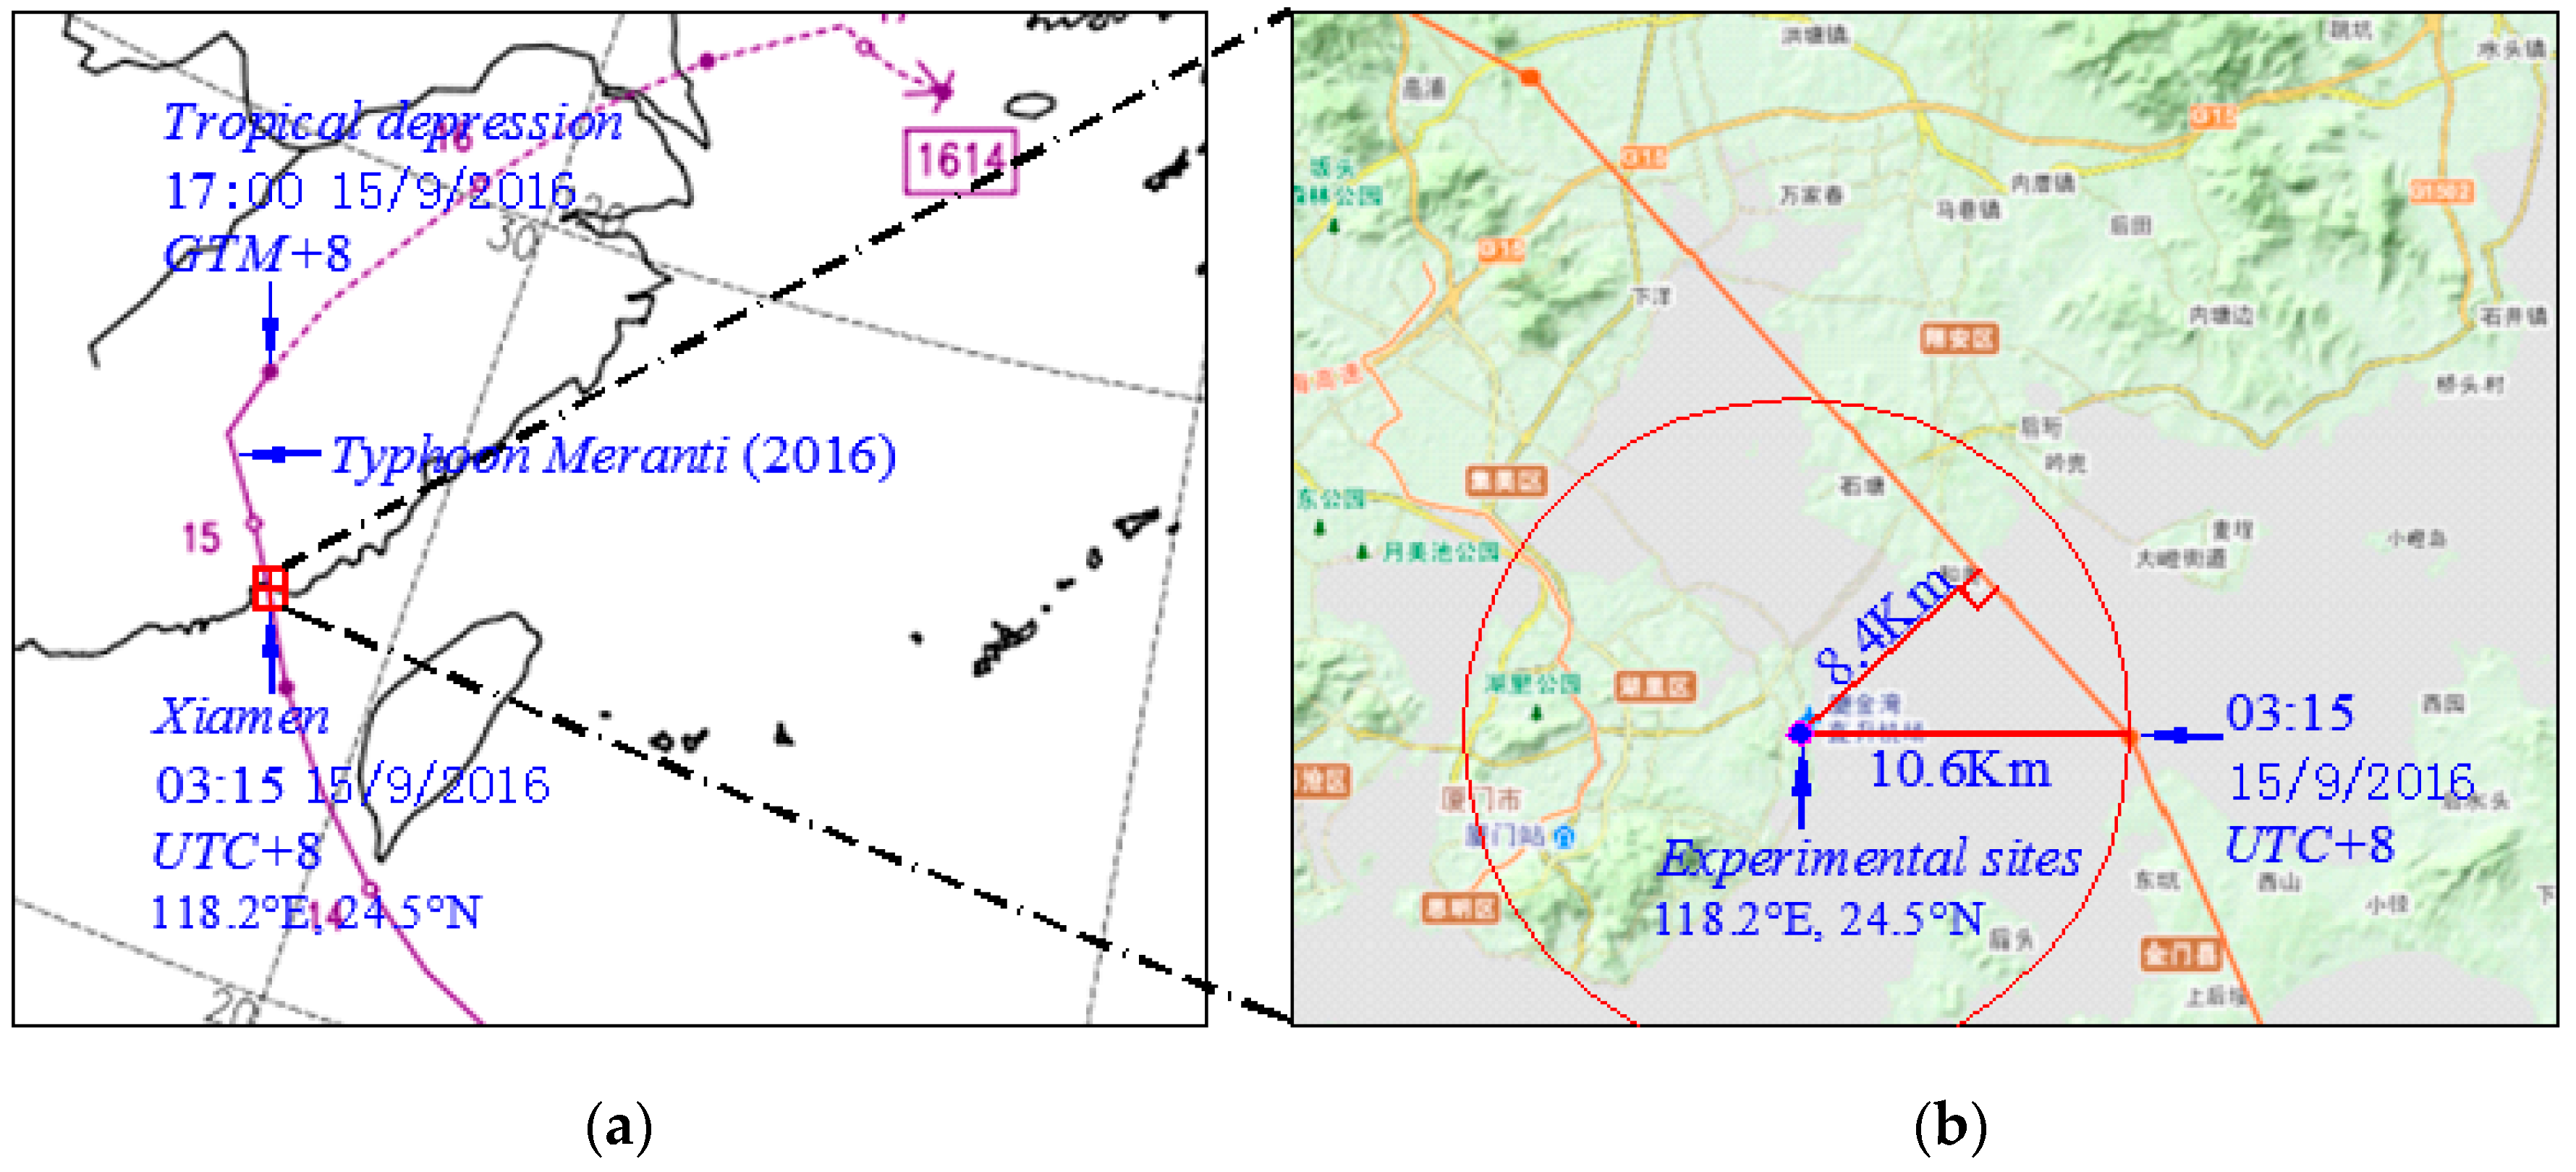
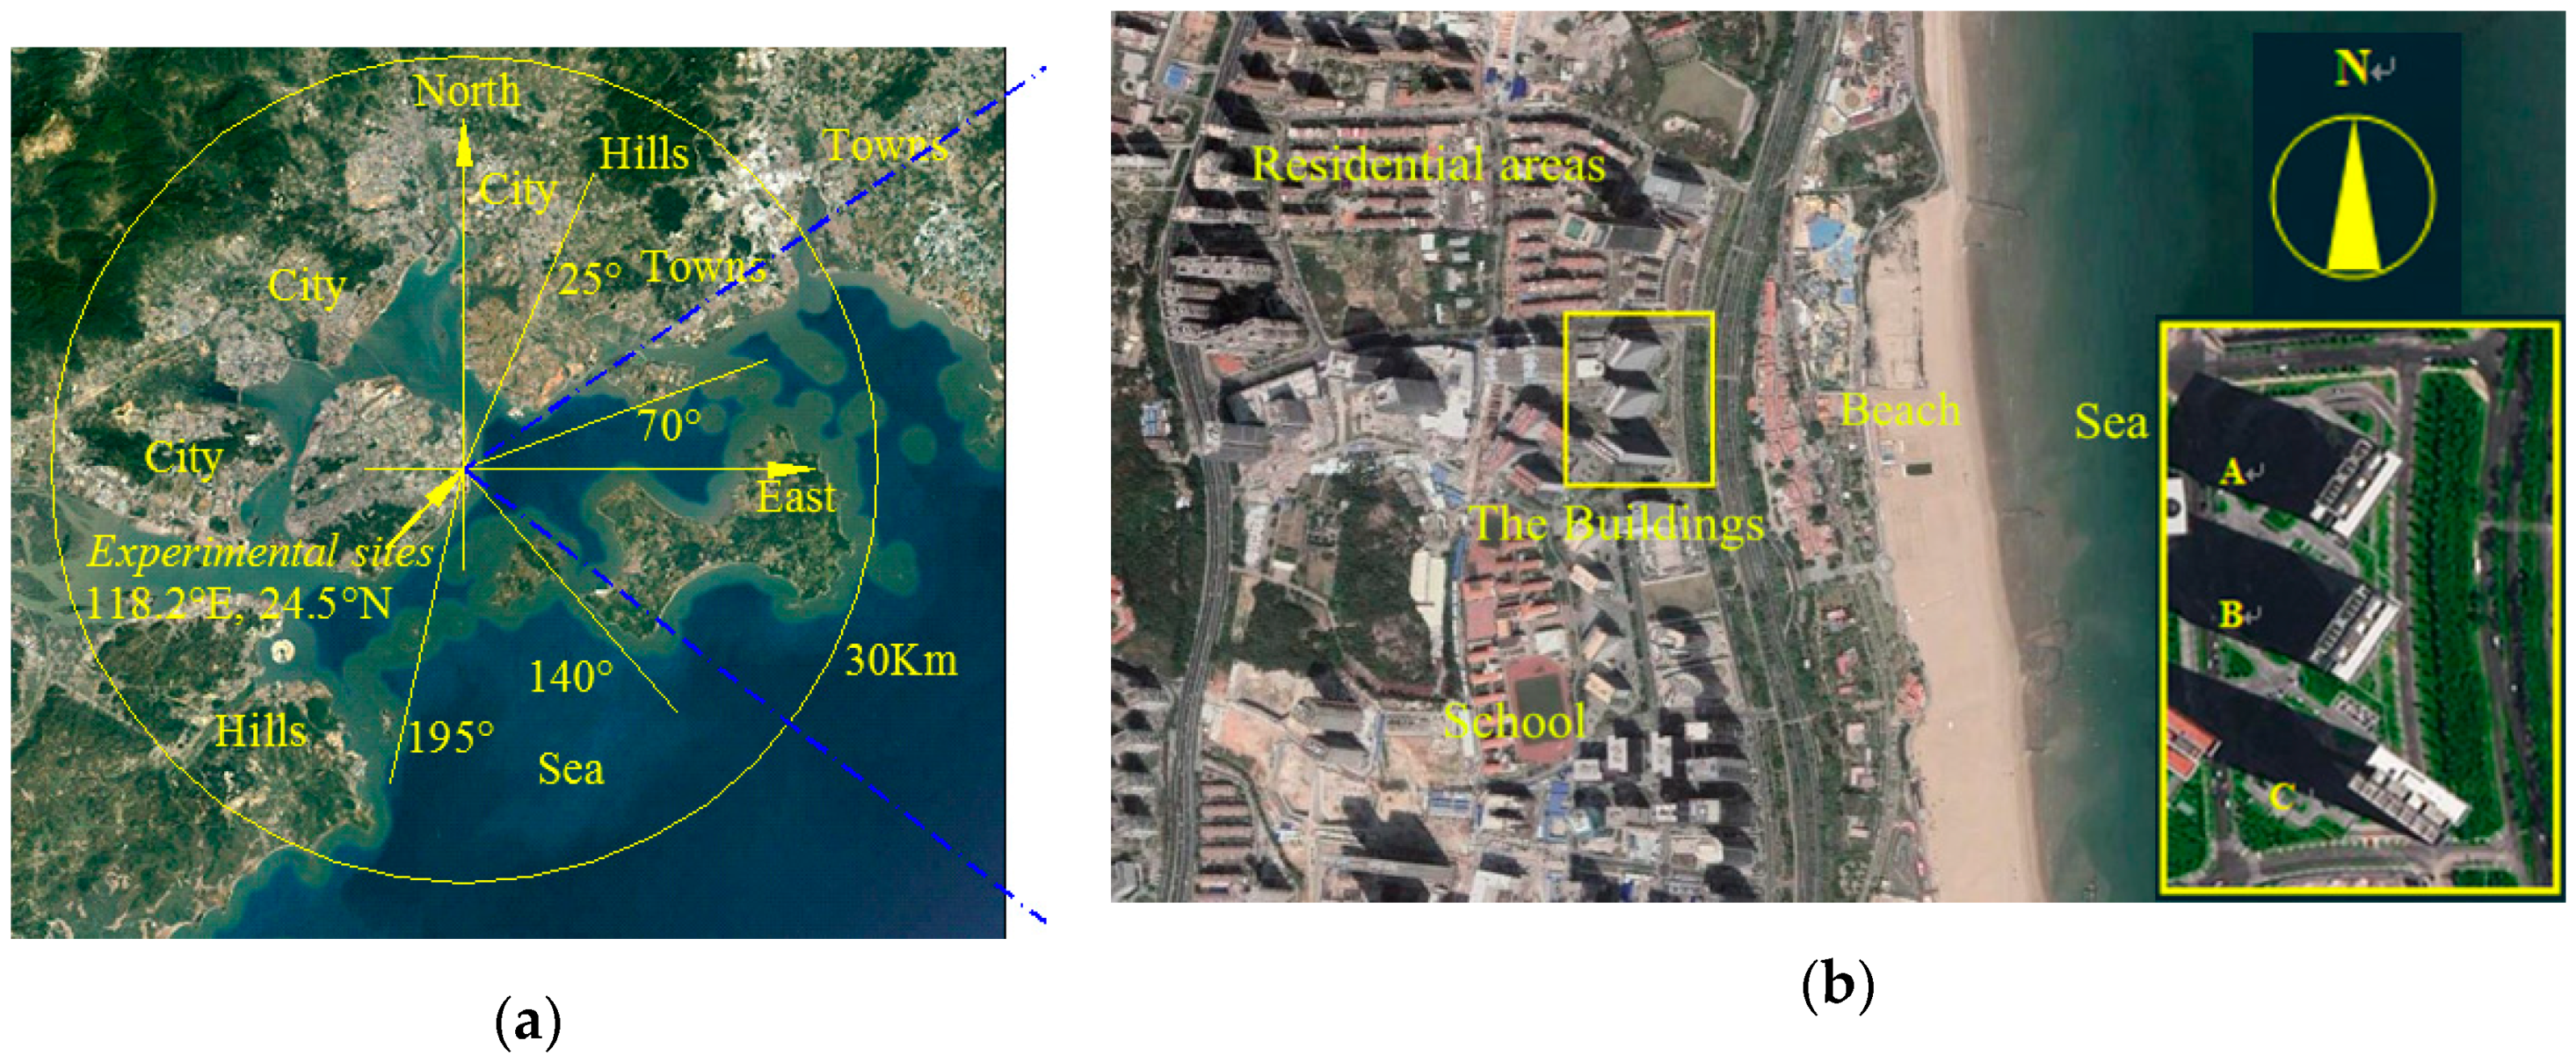
2. Field Measurements

The three high-rises buildings (A, B, and C) monitored in this study are approximately 500 m from the beach, as shown in Figure 1. Three buildings have plane size approximately 60 m × 30 m. Buildings A and B are in the northern side and face the same direction; the maximum heights are 102.9 and 110.7 m, respectively. The distance between the two buildings is 20.5 m. The height of building C is 149.8 m, as shown in Figure 2b.
The terrain around the building cluster is shown in Figure 1. The coordinates of the measurement point at the origin aids in illustrating the ground roughness in each incoming flow direction. It begins from north (set as 0°) changing clockwise to the east (set as 90°). There is a city with super high-rise buildings located between 0° and 25°. There is a town between 25° and 70°, a sea between 70° and 90°, an island at 90°~140°, and an ocean at 140°~195°. The terrain at an interval between each wind direction within 30 km of the measurement point is categorized into three types, namely; metropolis, open land, and ocean, as shown in Figure 1a. The measured high-rises and the surrounding environments are shown in Figure 1b, and several low-rise buildings and a coastal highway are located between the beach and building cluster. Six low-rise buildings are located next to the building cluster, and an open land is situated in the distance. The south contains a music school and high-rises that are barely arranged in a row, a 258 m super high-rise building is 165 m away from the northern side of high-rise A. The remaining residential areas are mainly low-rise or multi-storey buildings. The terrain around the measurement location is generally flat and open, and the experimental building is not disturbed in several incoming directions.
Typhoons are monitored using three R.M. YOUNG propeller anemometers (R. M. Young Company, Michigan, US) mounted on the mast on the roof of each building. The mast is installed 4.2 m above a 3 m high fence in the east corner of the roof (Figure 2a). The height difference of the anemometers is equal to the height difference of the buildings, and the distances between two buildings are approximately 80 and 130 m. The location and wind direction of each anemometer are shown in Figure 2b. The included angle between high-rise A/B and the north direction is 39°, and that between the long side of high-rise C and the long side of high-rise A/B is 90°. Judging from the direction of the building and the location of the anemometer, the wind fields on the roofs of high-rises A and B are less disturbed when the northeast wind is dominant. Meanwhile, the wind field on the roof of high-rise C is less disturbed when the southeast wind is dominant.
As reported by the Central Meteorological Observatory, at 2:00 PM on 10th September, 2016 (local time), Typhoon Meranti (14th typhoon in 2016) was generated on the Pacific Northwest. Its intensity was initially that of a tropical storm, but it rapidly increased in the next few days. On 13th September, Typhoon Meranti turned into a super typhoon with the highest wind speed of approximately 75 m/s in the centre and landed in Xiamen at 3:15 AM on 15th September, and the distance between the experimental building and the landing point is 10.6 km. Typhoon Meranti (2016) continued to move northwest with speed of 20 km/h toward to the northern direction and eventually weakened into a tropical depression in Jiangxi at 5:00 PM on the same day, and 8.4 km away from the experimental building, as shown in Figure 3. The wind speed and direction were simultaneously monitored on the roofs, and the sampling frequency was 25.6 Hz. The measurement began at 2:50 AM on 14th September and stopped at 3:00 AM on 15th September due to the power failure of the experimental building caused by the typhoon. The measured data were continuously recorded for 24 h. The measurement of building B stopped at 8:50 PM on 14th September, and data were continuously recorded for 18 h. The maximum instantaneous wind speed recorded was 68.2 m/s, which was measured on the roof of building C at 3:00 AM on 15th September.

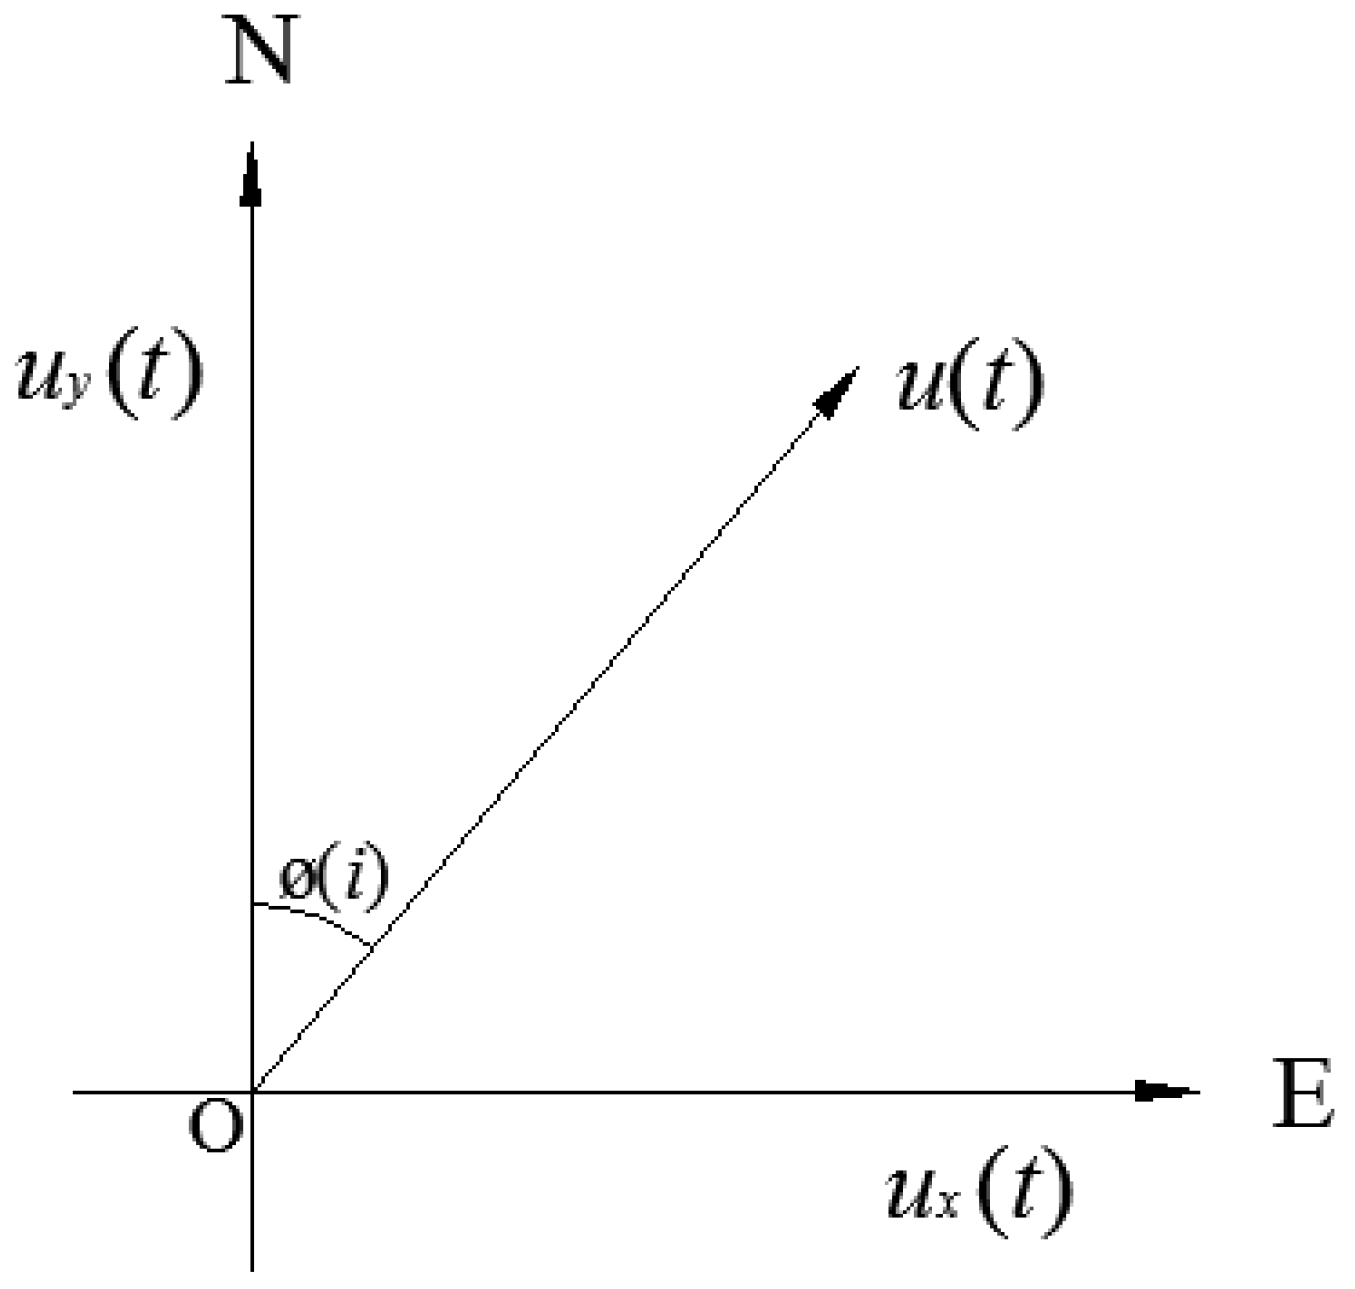
3. Research Method for Wind Characteristics

An anemometer can simultaneously measure the x and y axial wind speeds at a certain point, which are denoted as u x ( t ) and u y ( t ) , respectively. The wind speed statistical process in this study uses the vector decomposition method [16] to obtain the longitudinal and transverse horizontal components, as shown in Figure 4. Ten min is selected as the basic time interval in the statistical analysis, the mean horizontal wind speed U and mean horizontal wind direction angle ϕ are as follows:
U = u ¯ x ( t ) 2 + u ¯ y ( t ) 2
cos ( ϕ ) = u ¯ x ( t ) / U
where u ¯ x ( t ) and u ¯ x ( t ) are the mean values of the u x ( t ) and u y ( t ) samples at the basic time interval, respectively.
In the basic time interval, the horizontal longitudinal pulsating wind speed u ( t ) and horizontal longitudinal pulsating wind speed v ( t ) can be calculated using Formulas (3) and (4):
u ( t ) = u x ( t ) cos ϕ + u y ( t ) sin ϕ U
v ( t ) = u x ( t ) sin ϕ + u y ( t ) cos ϕ
Turbulence intensity describes the degree to which wind speed changes with time and space, indicating the relative strength of pulsating wind. Turbulence intensity is often defined as the ratio of the standard deviation of pulsating wind speed to the mean horizontal wind speed u in the 10 min time interval.
I i = σ i U ( i = u , v )
In the formula, σ i (I = u, v) is the standard deviation of pulsating wind speeds u ( t ) and v ( t ) in the analysis time interval.
The gust factor reflects the ratio of gust wind speed to the mean wind speed and is often defined as the t g ratio of the maximum mean wind speed in the gust duration (generally 3 s) to the mean horizontal wind speed u in the analysis time interval (10 min), that is,
G u ( t g ) = 1 + max ( u ¯ ( t g ) ) U
G v ( t g ) = max ( v ¯ ( t g ) ) U
where max ( u ¯ ( t g ) ) and max ( v ¯ ( t g ) ) represent the mean maximum wind speeds in the along-wind and cross-wind directions at time t g , respectively.
u ¯ ( t g ) = 1 N i = 1 N u ( t )
v ¯ ( t g ) = 1 N i = 1 N v ( t )
where N is the number of samples at time t g .
The turbulence integral scale is a measure of the mean size of the vortex in the air stream. On the basis of the Taylor hypothesis [17], this scale is expressed as
L i = U σ i 2 0 μ R ( τ ) d τ
where L i is the turbulent integral scale at the i ( i = u , v ) direction, μ denotes the upper limit of the integral obtained from the point where the correlation coefficient drops to 0.05 and R ( τ ) represents the autocorrelation functions of the pulsating wind speed.

4. Analysis of the Measured Fluctuating Wind Speed Data

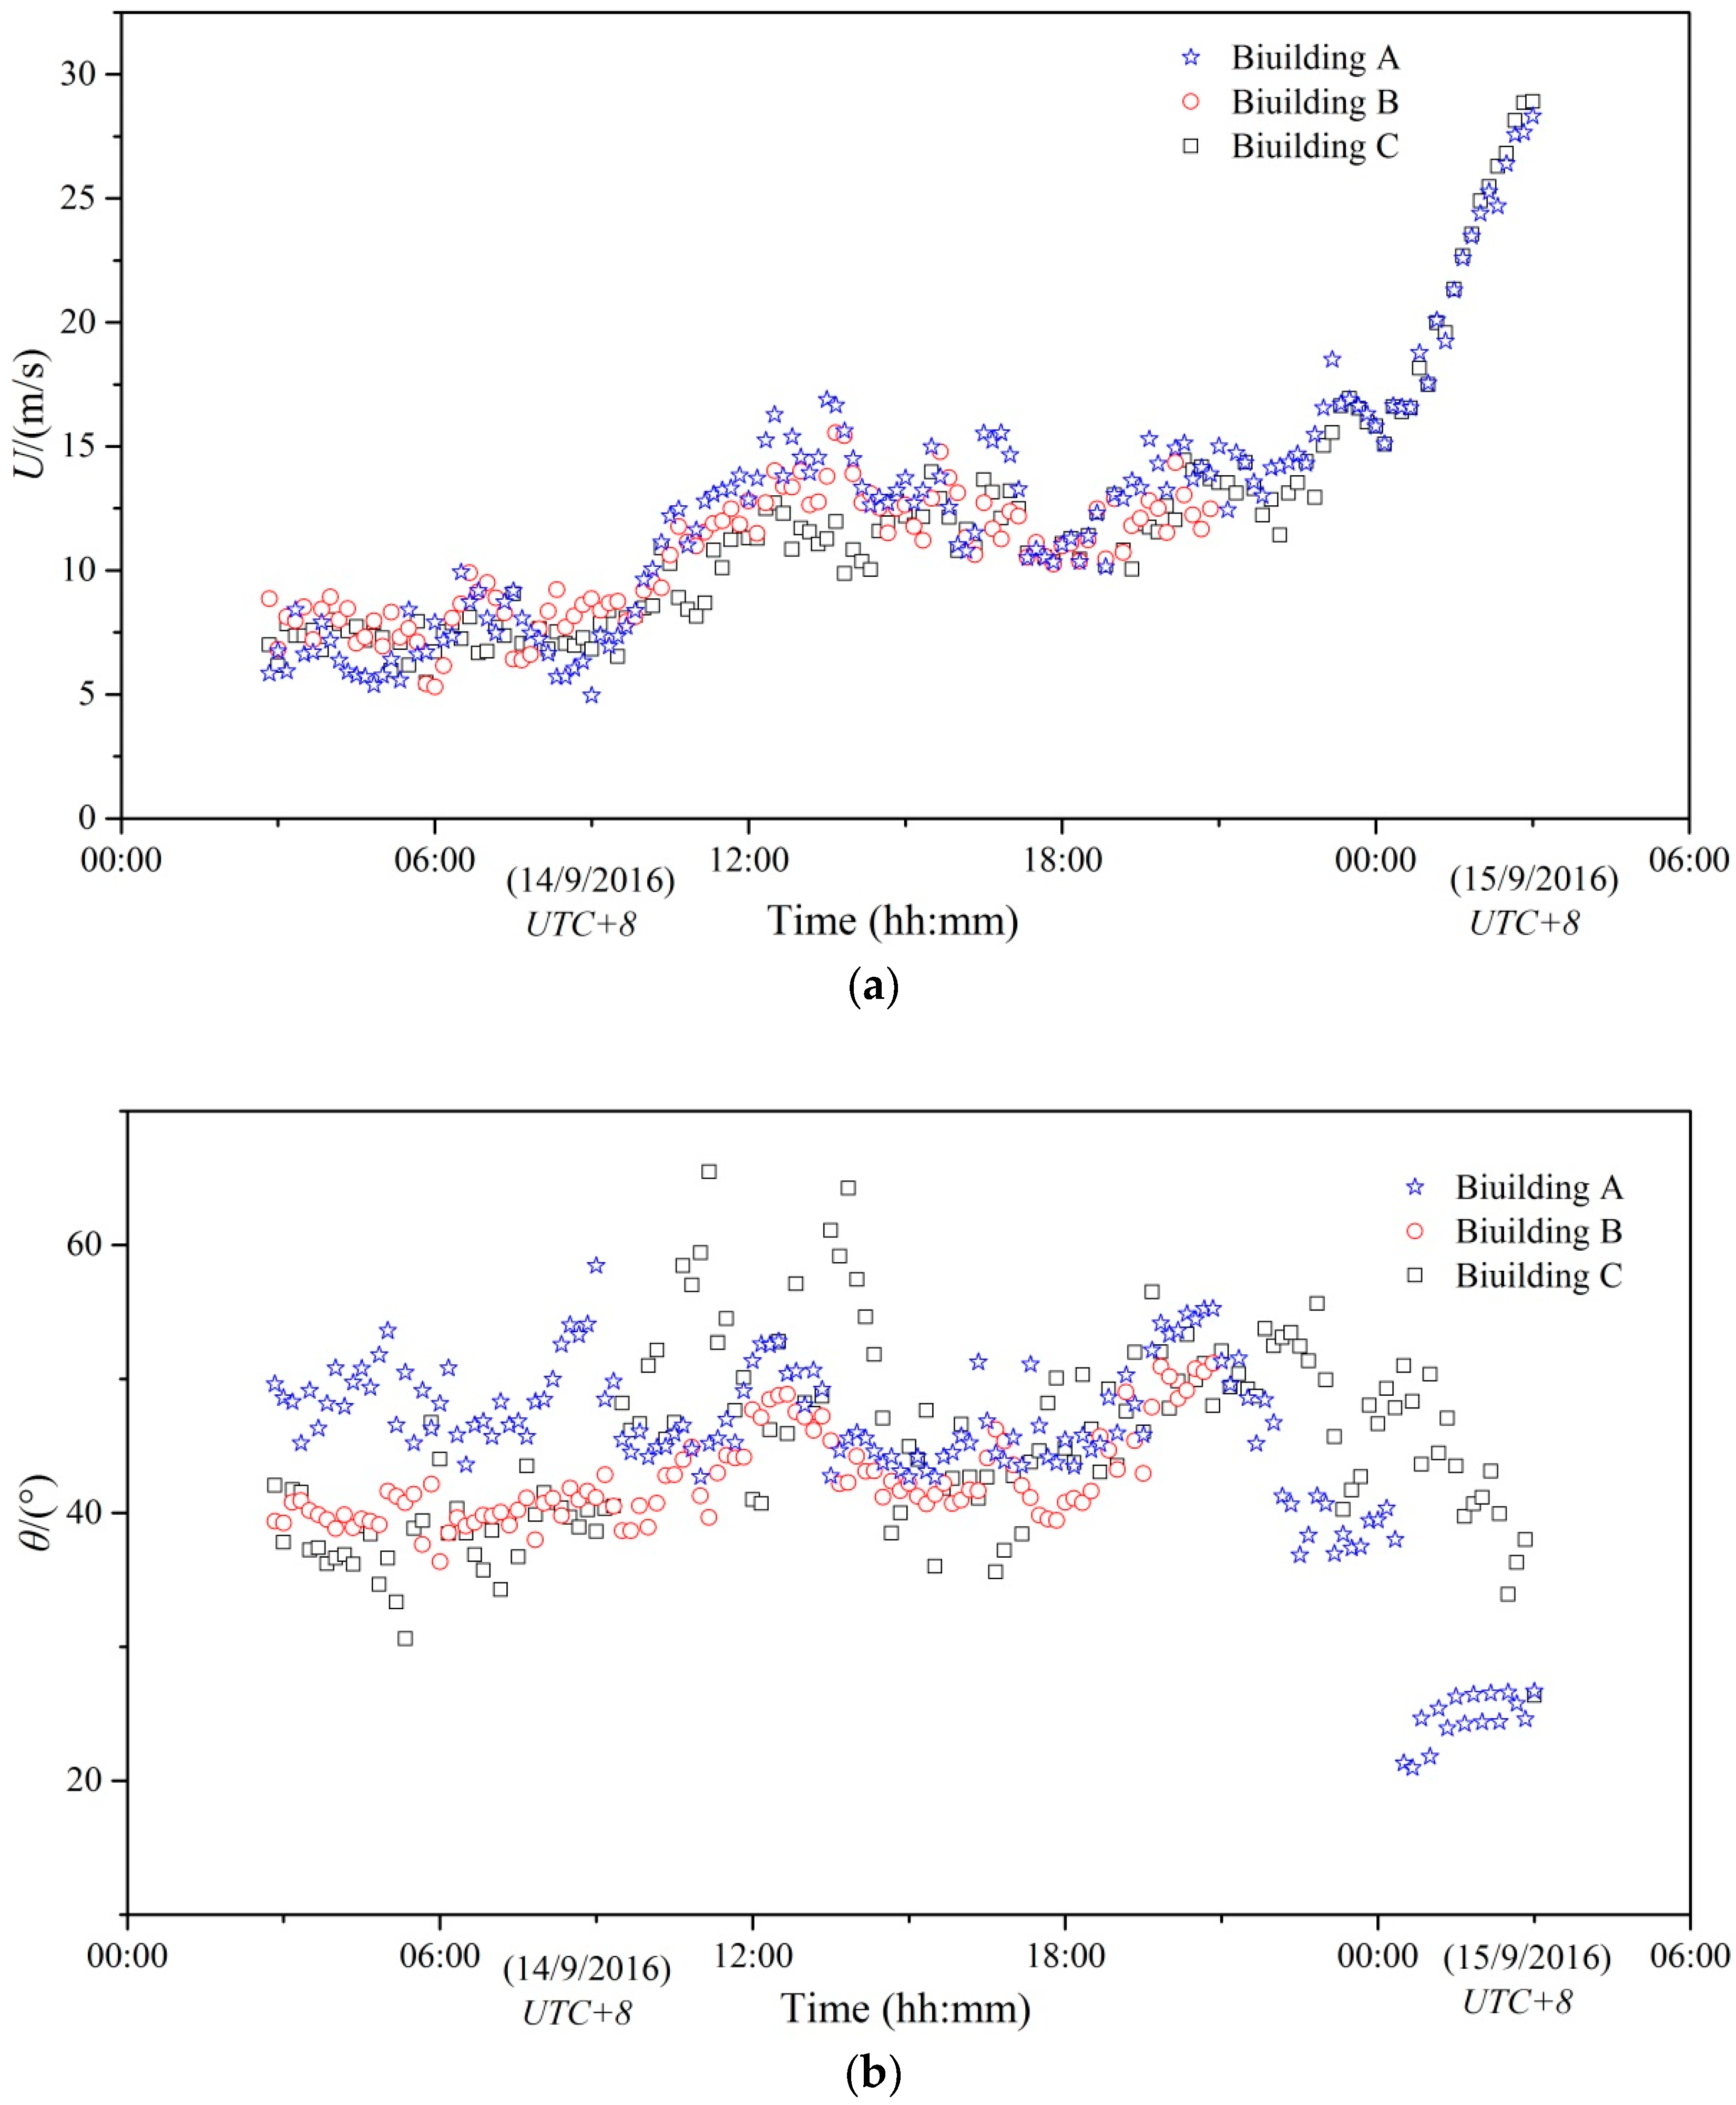
4.1. Mean Wind Speed and Wind Direction

Relevant 2D data on wind speed and direction are collected using R.M. Young 05103V-type propeller anemometers (R. M. Young Company, Michigan, US). The original data of high-rises A, B, and C are segmented into 146, 109, and 146 sub-samples based on the mean time interval of 10 min. Mean wind speed U and wind direction θ are given in Figure 5.
The mean wind speed and direction measured by the three anemometers were close, and the wind direction was discrete when the wind speed was low. The mean wind speed has a lower value 18 h before the typhoon landed, and it slowly fluctuates and increases. The wind direction was stable 6 h before the typhoon landed and the landing point of Typhoon Meranti (2016) was Xiamen. Northern hemisphere tropical cyclones rotate counter clockwise, and the wind direction slowly changed from northeast to north due to the landing location of the typhoon. The variation in the measured wind direction was consistent with this condition. As shown in the diagram, the maximum mean wind speeds measured on high-rises A, B, and C were 27.2, 15.6, and 28.9 m/s, respectively, with the mean wind directions ranging from 20° to 70°.

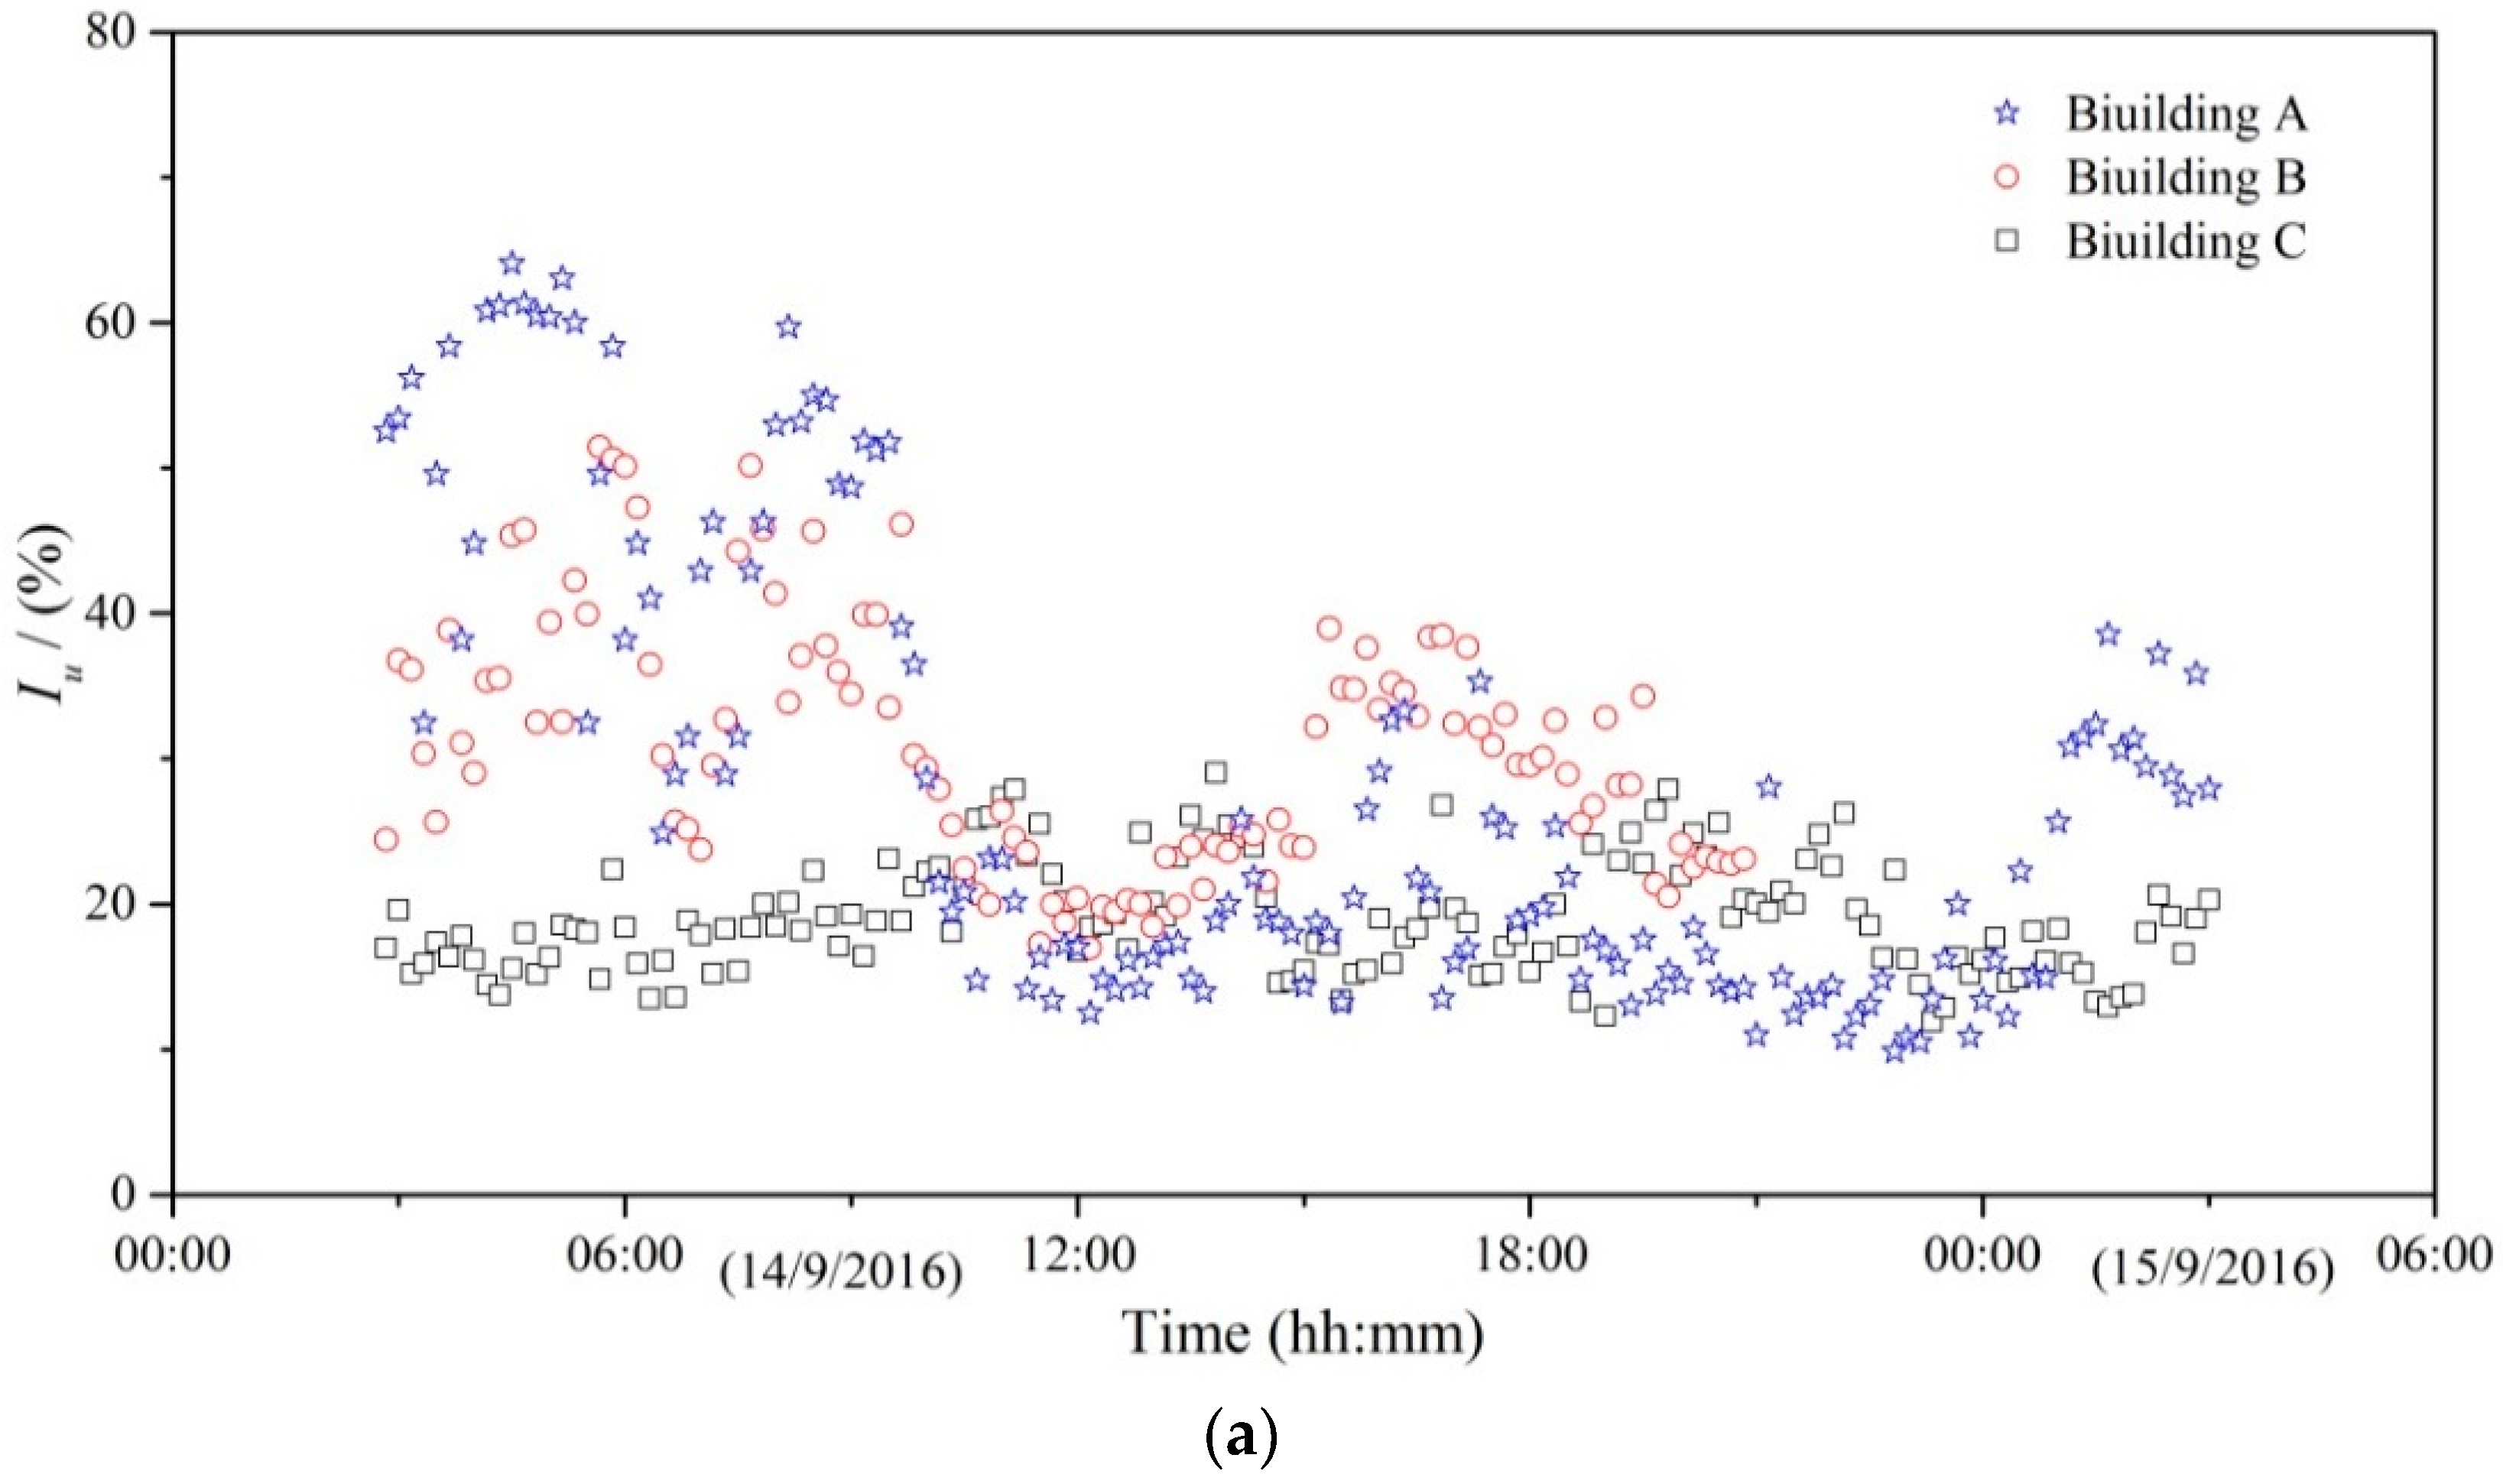
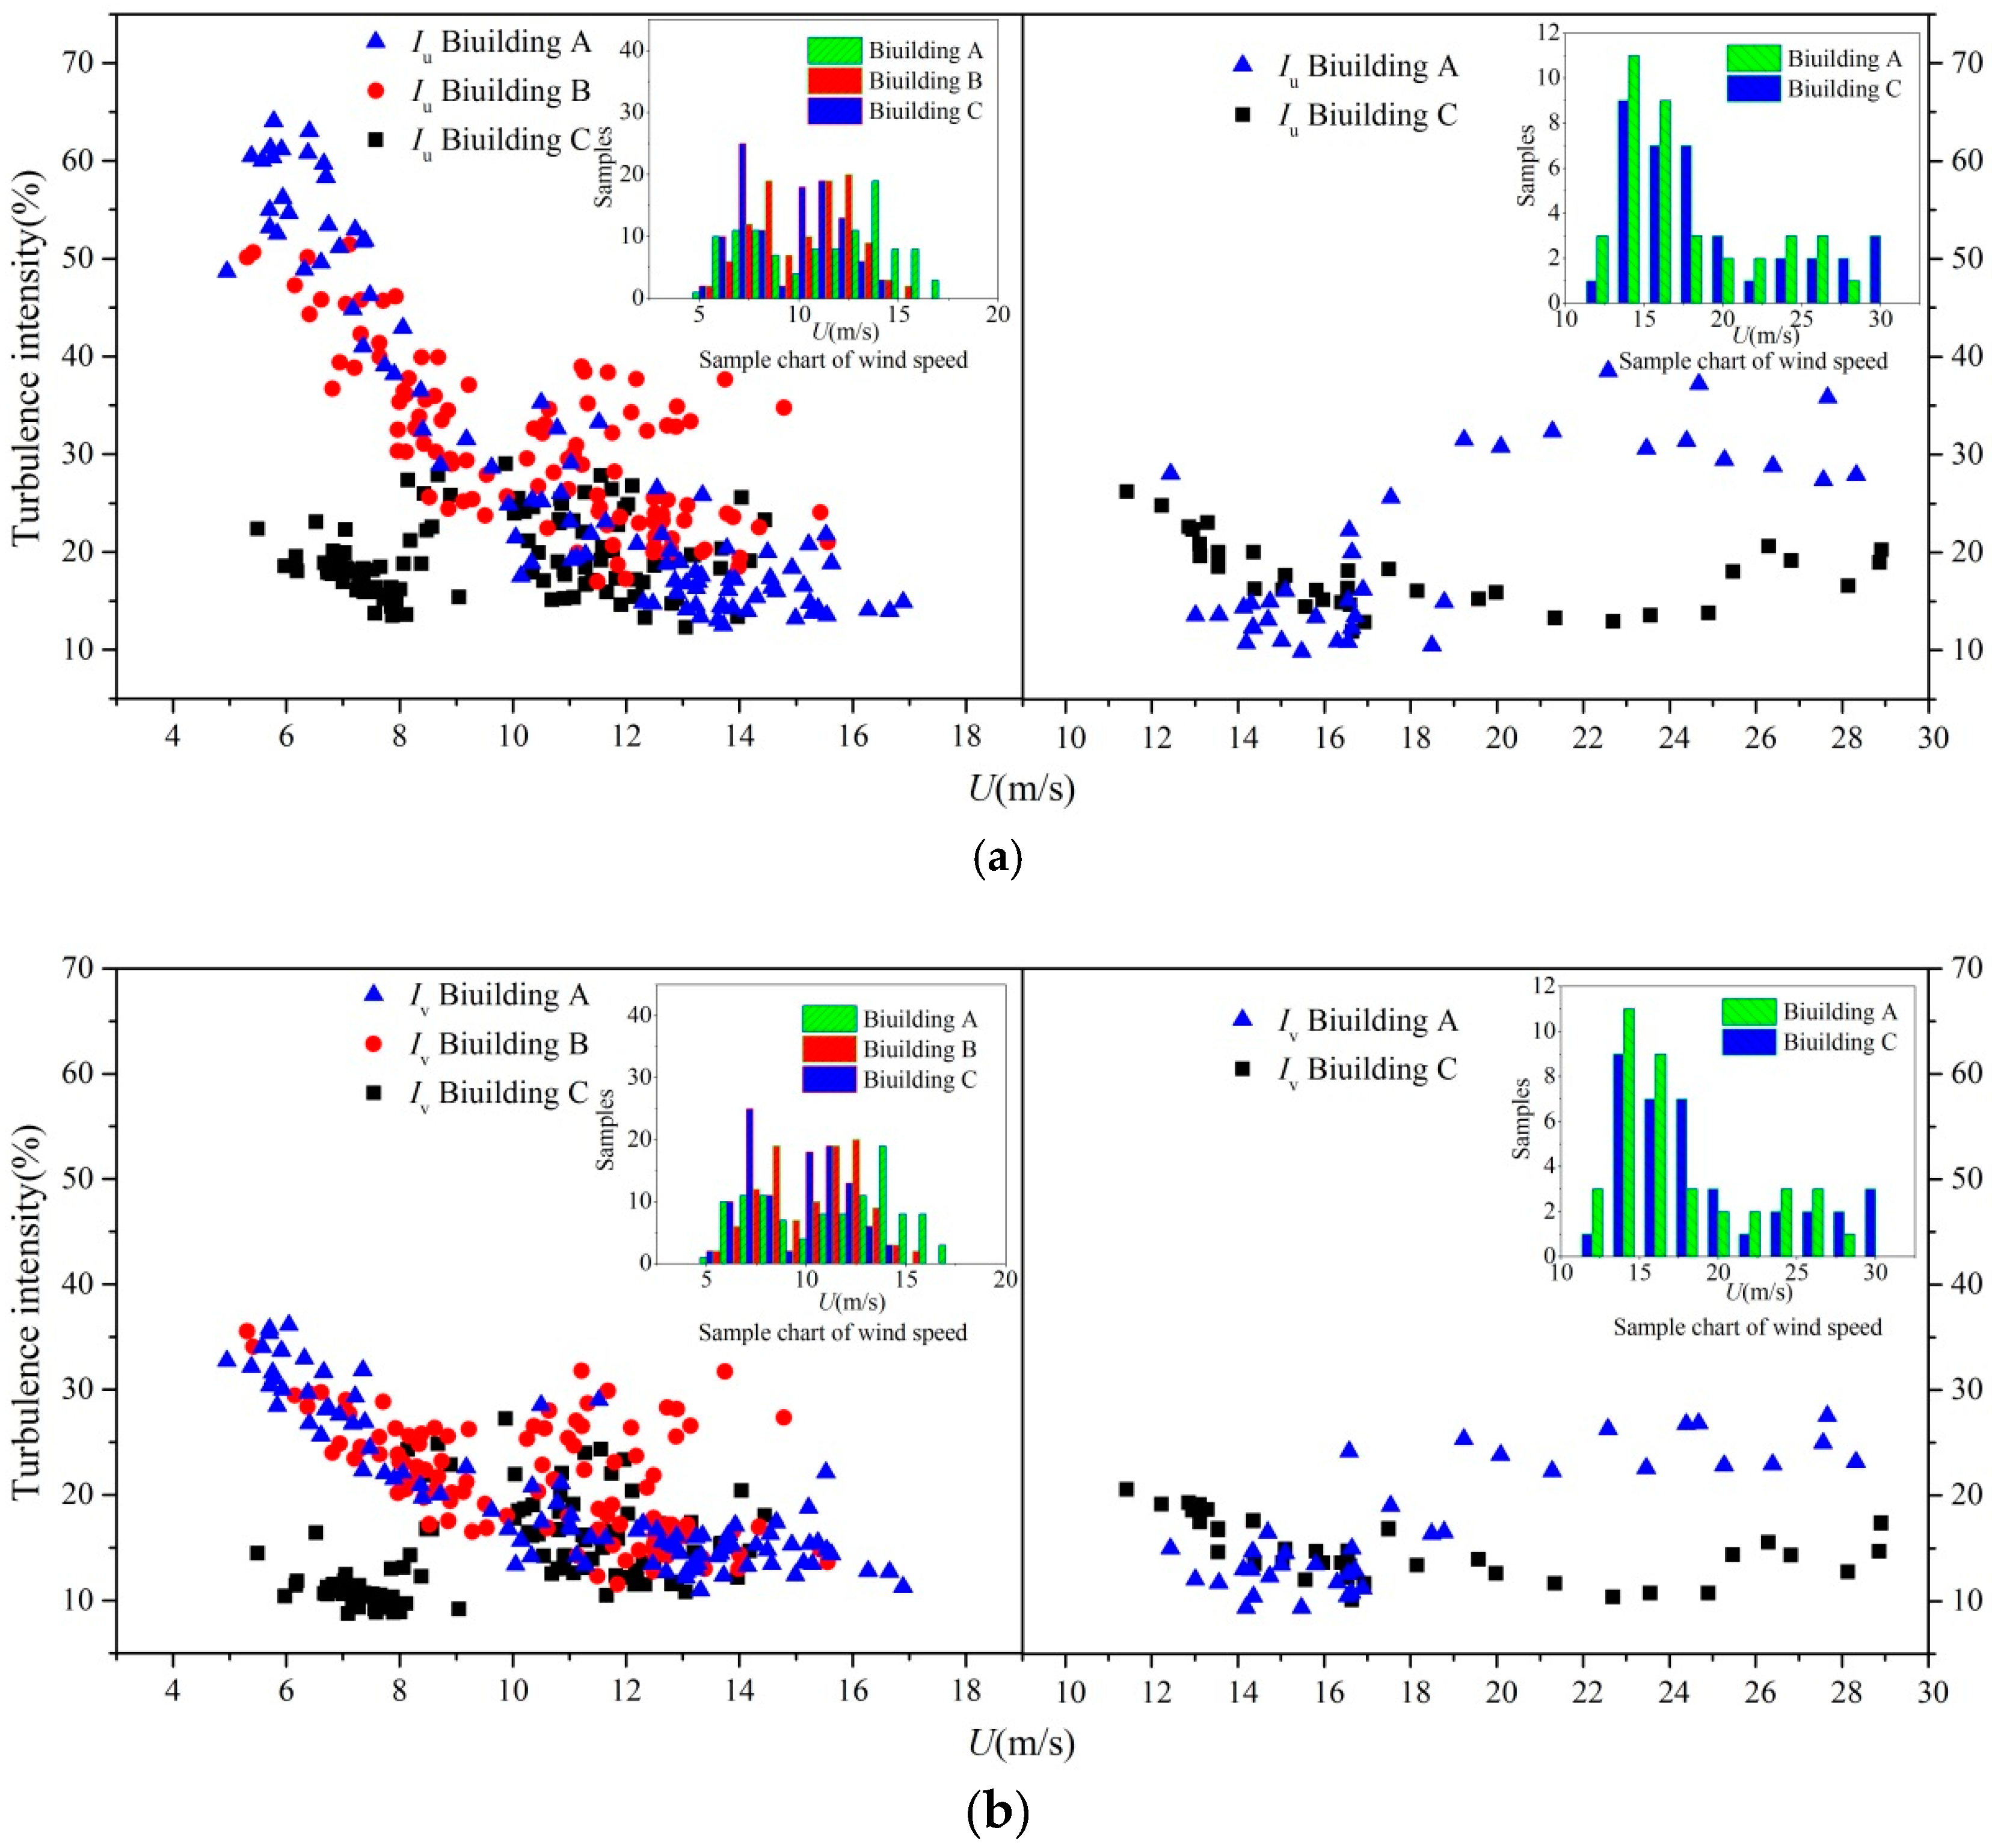
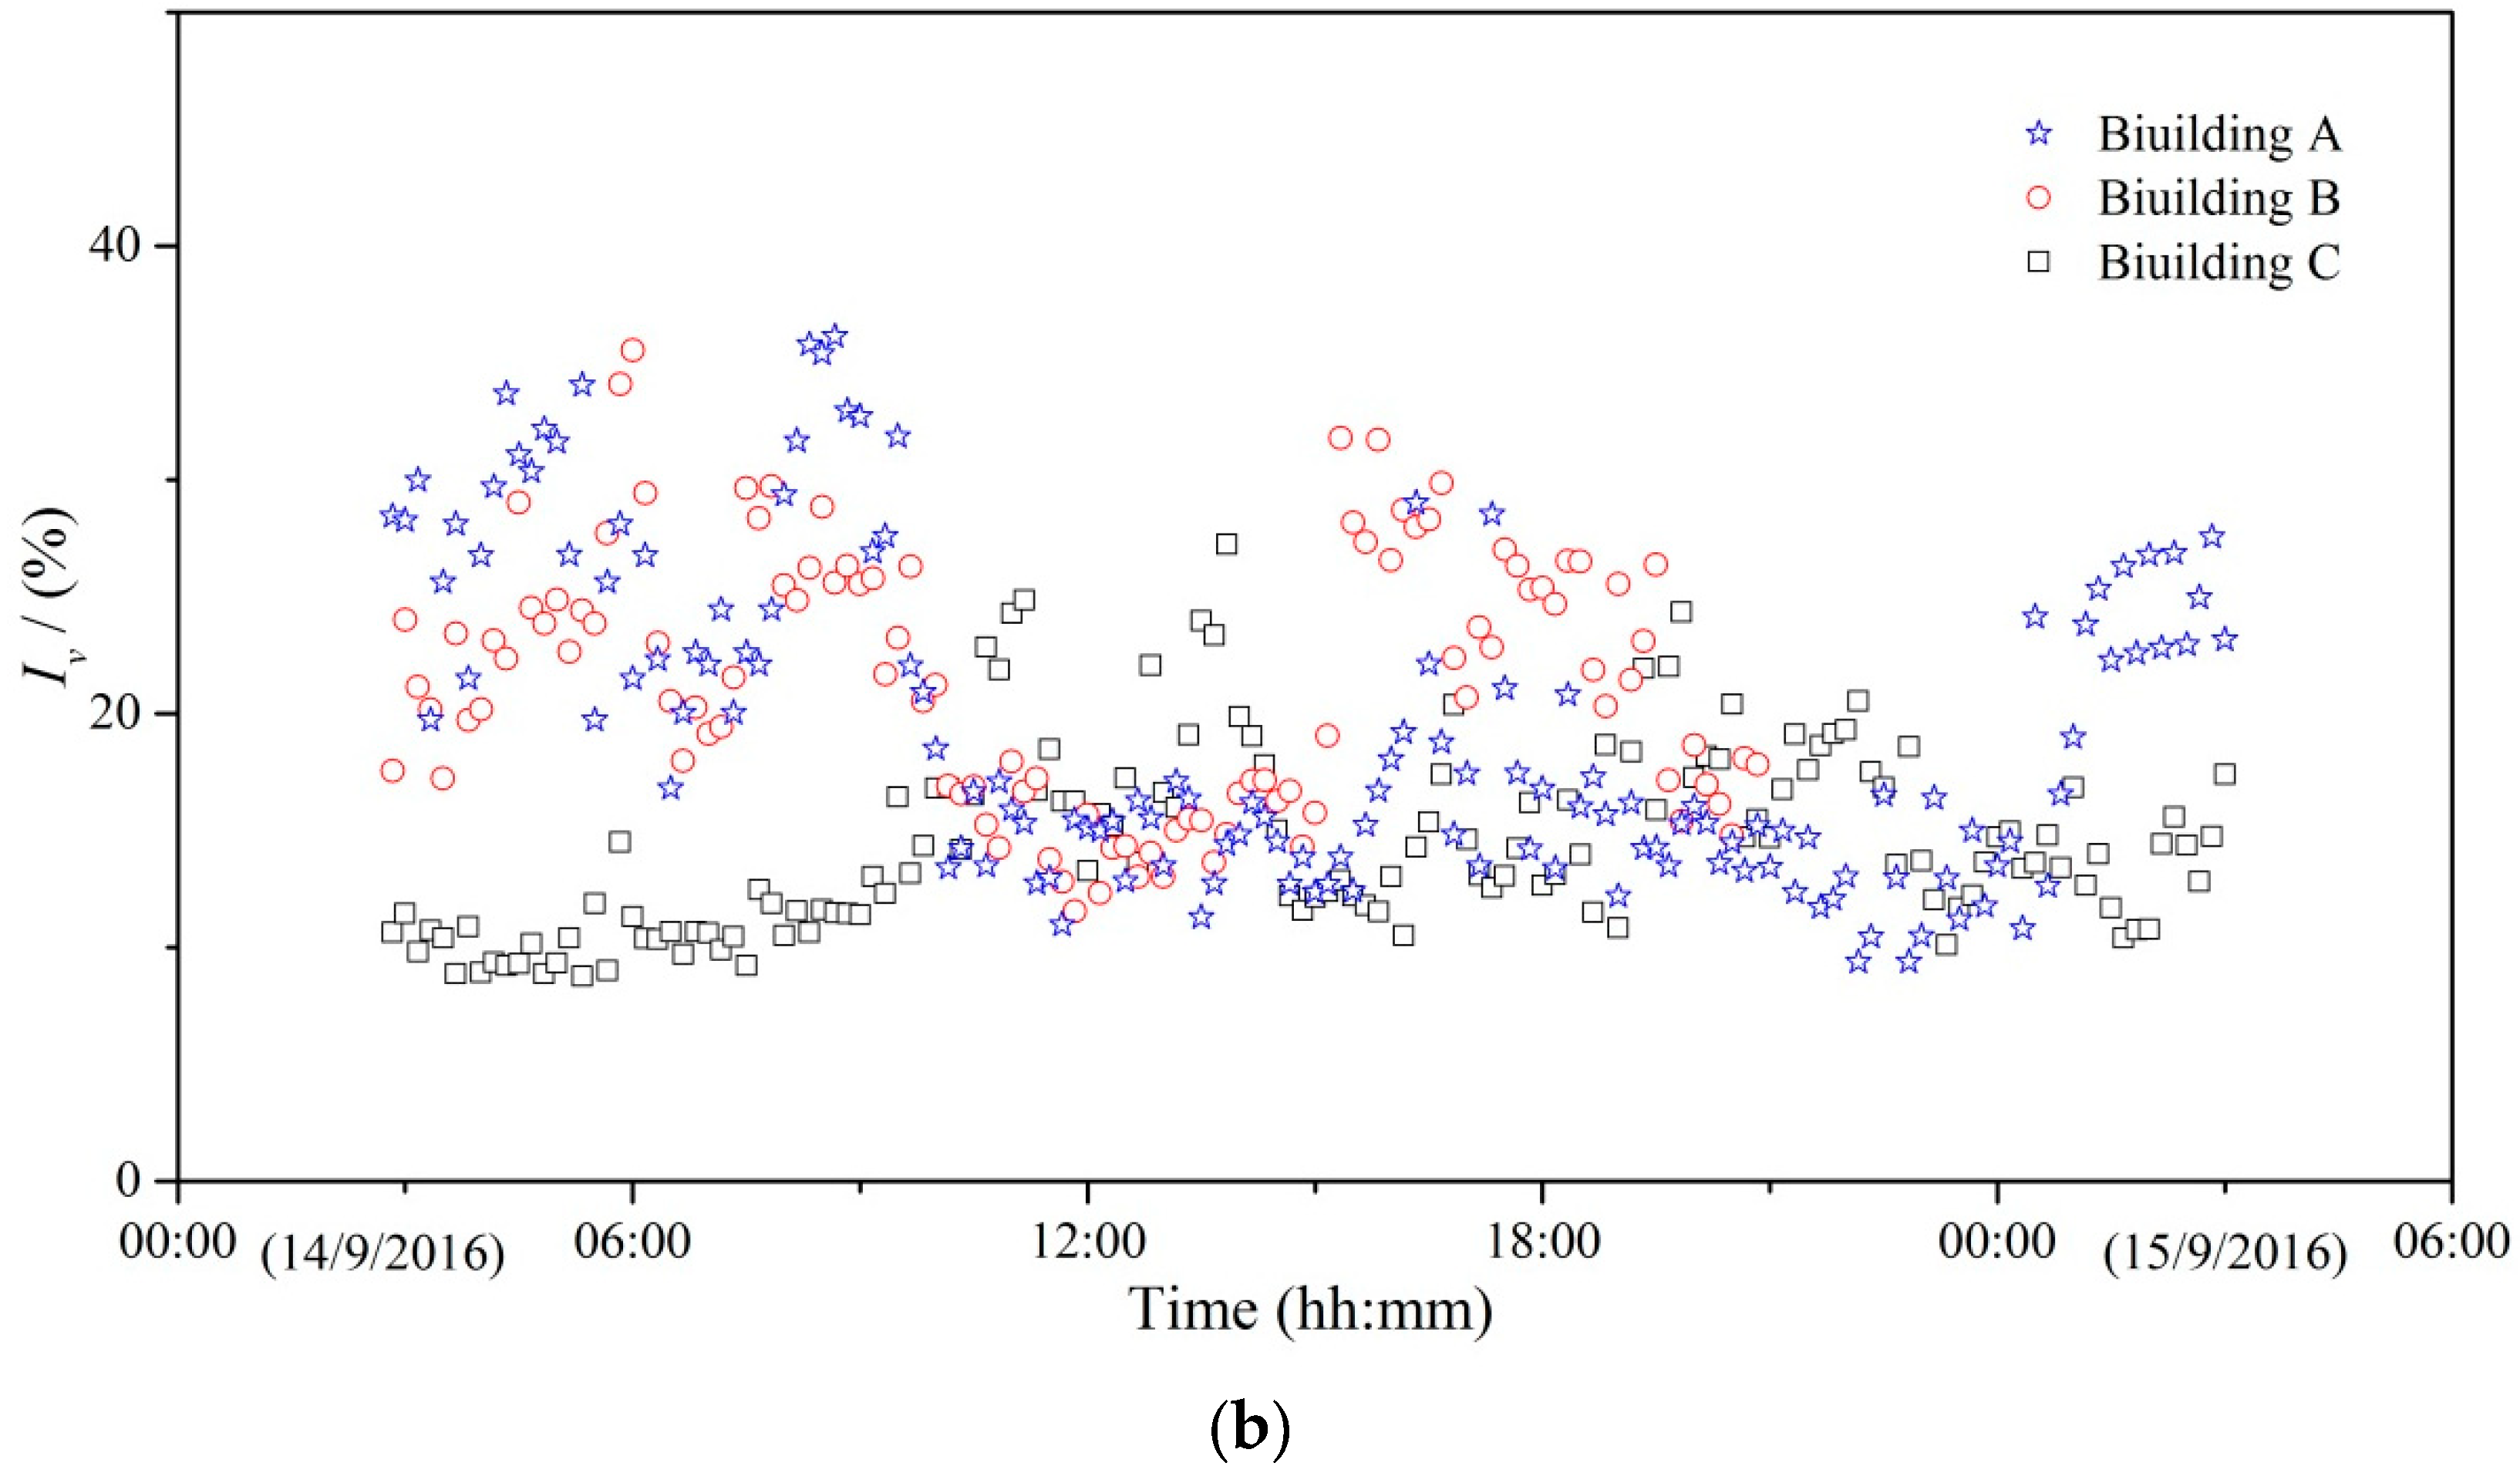
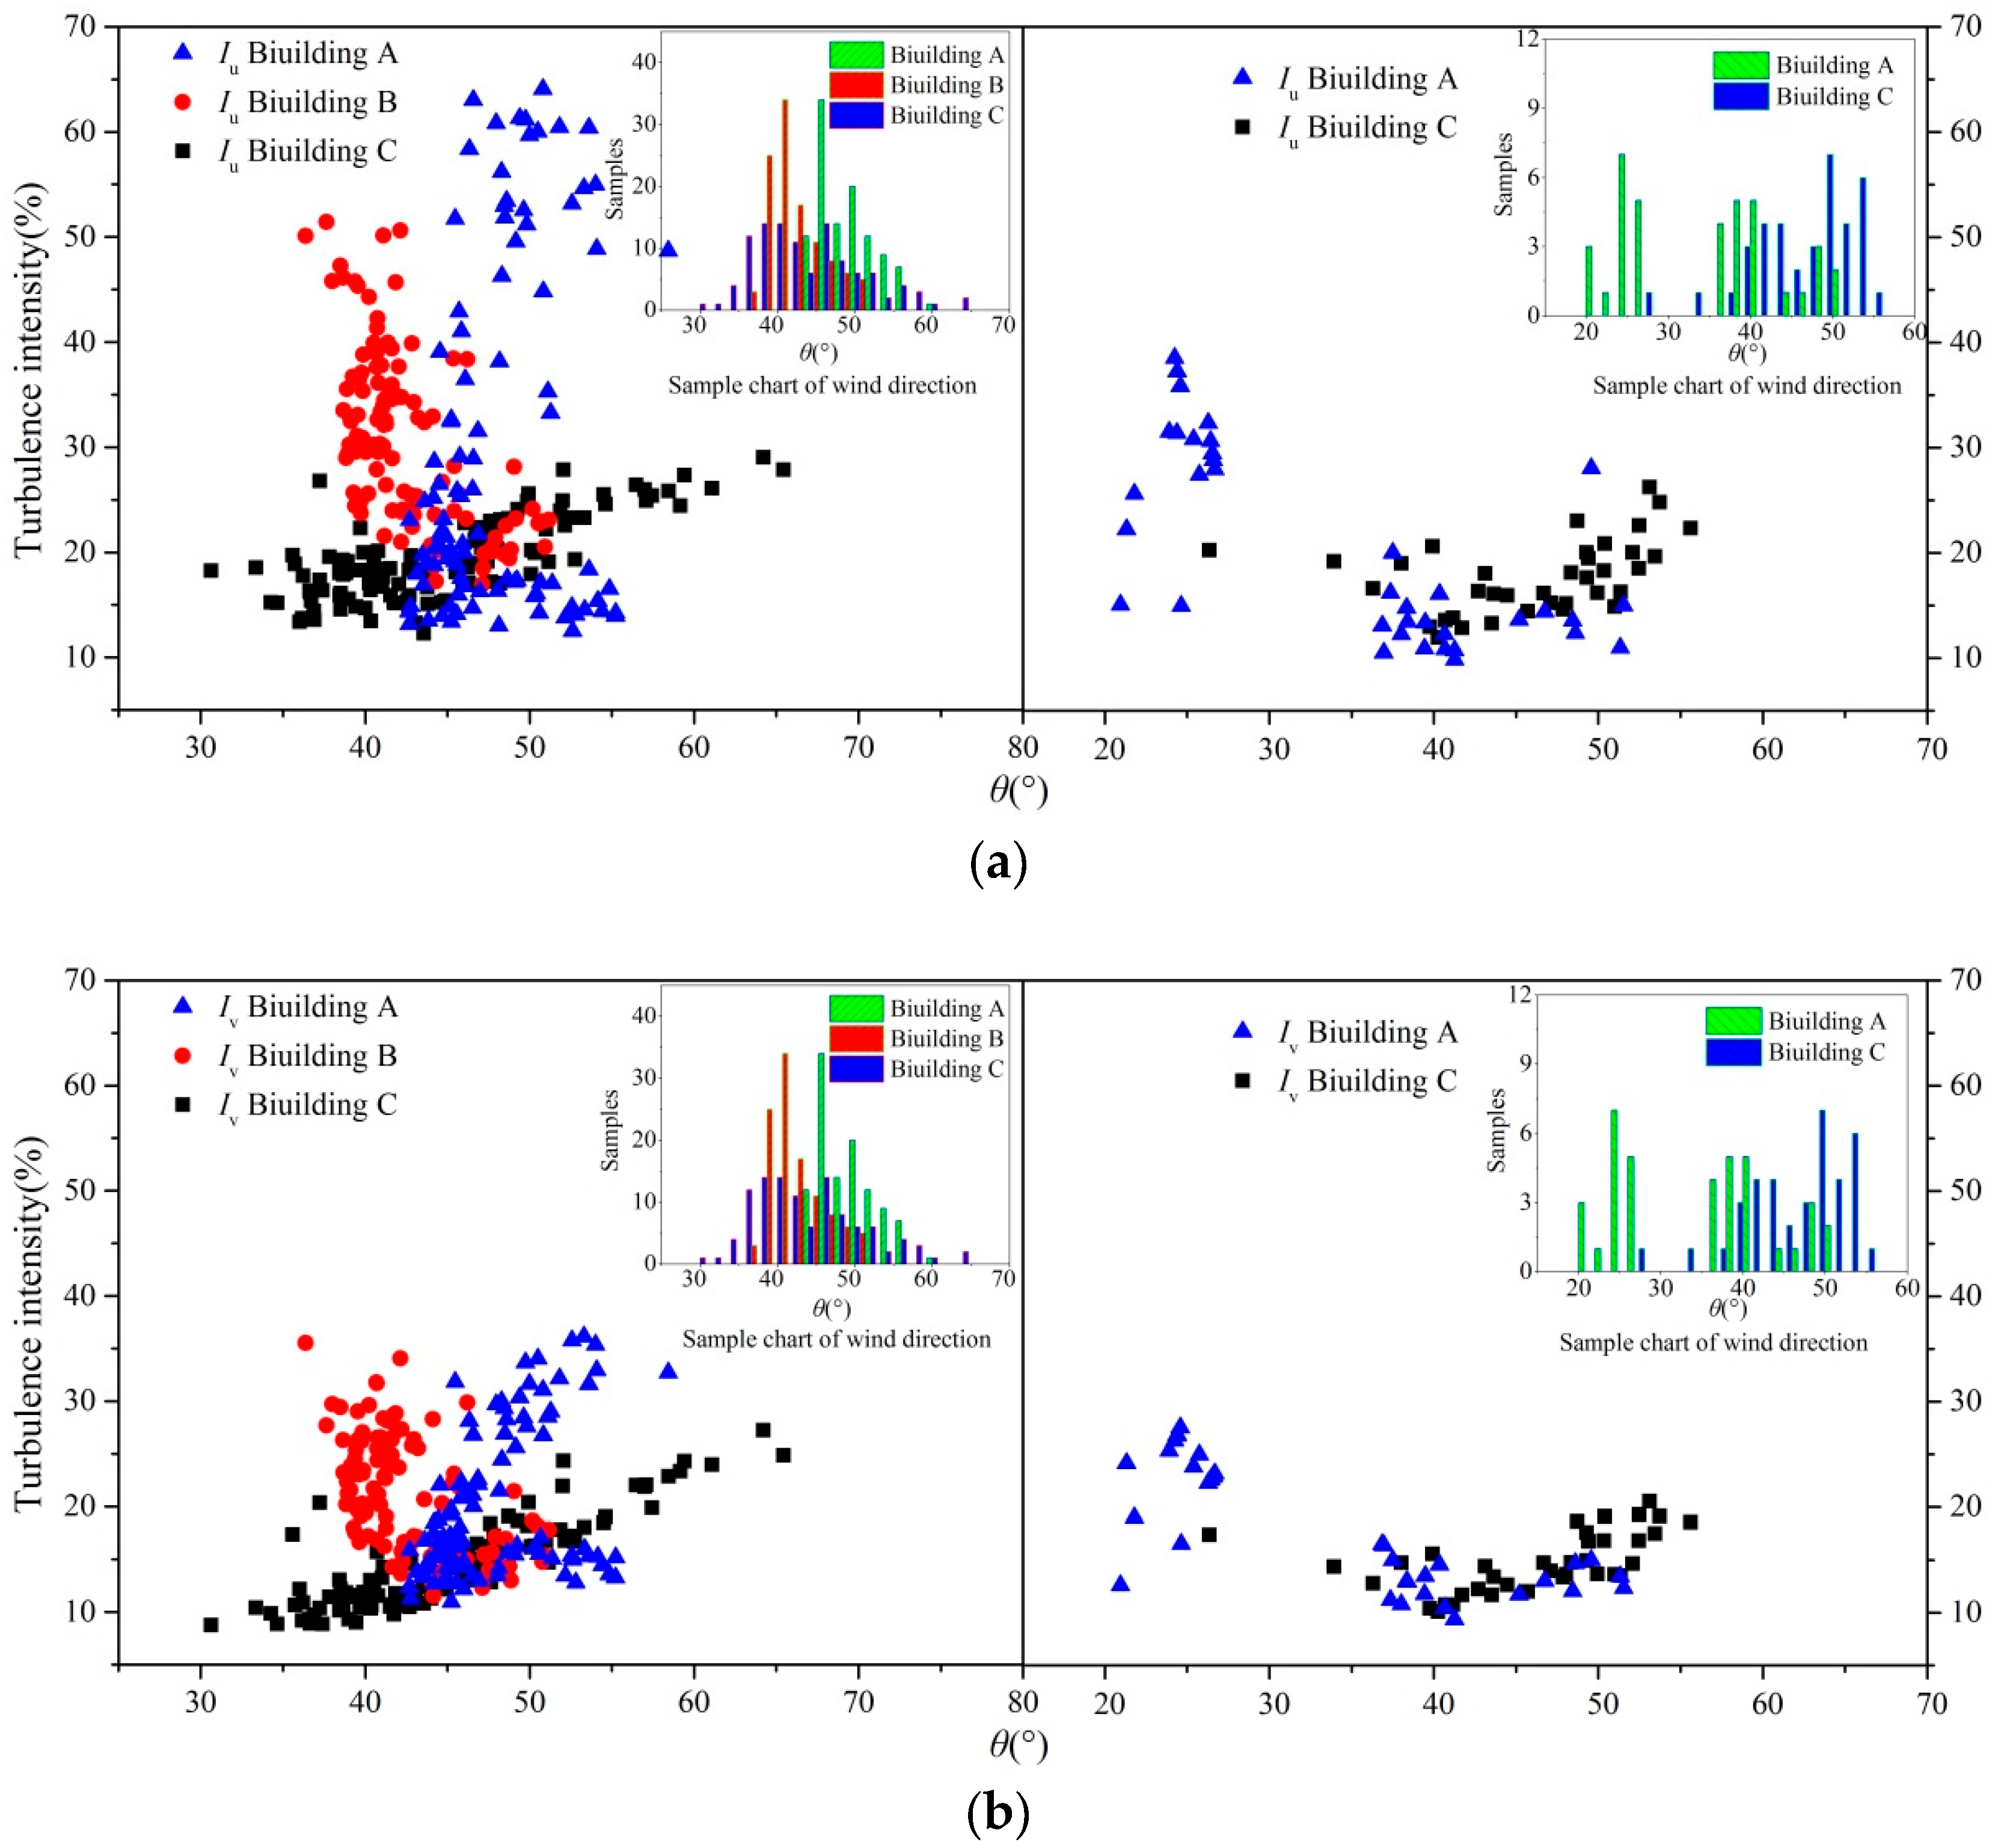
4.2. Turbulence Intensity
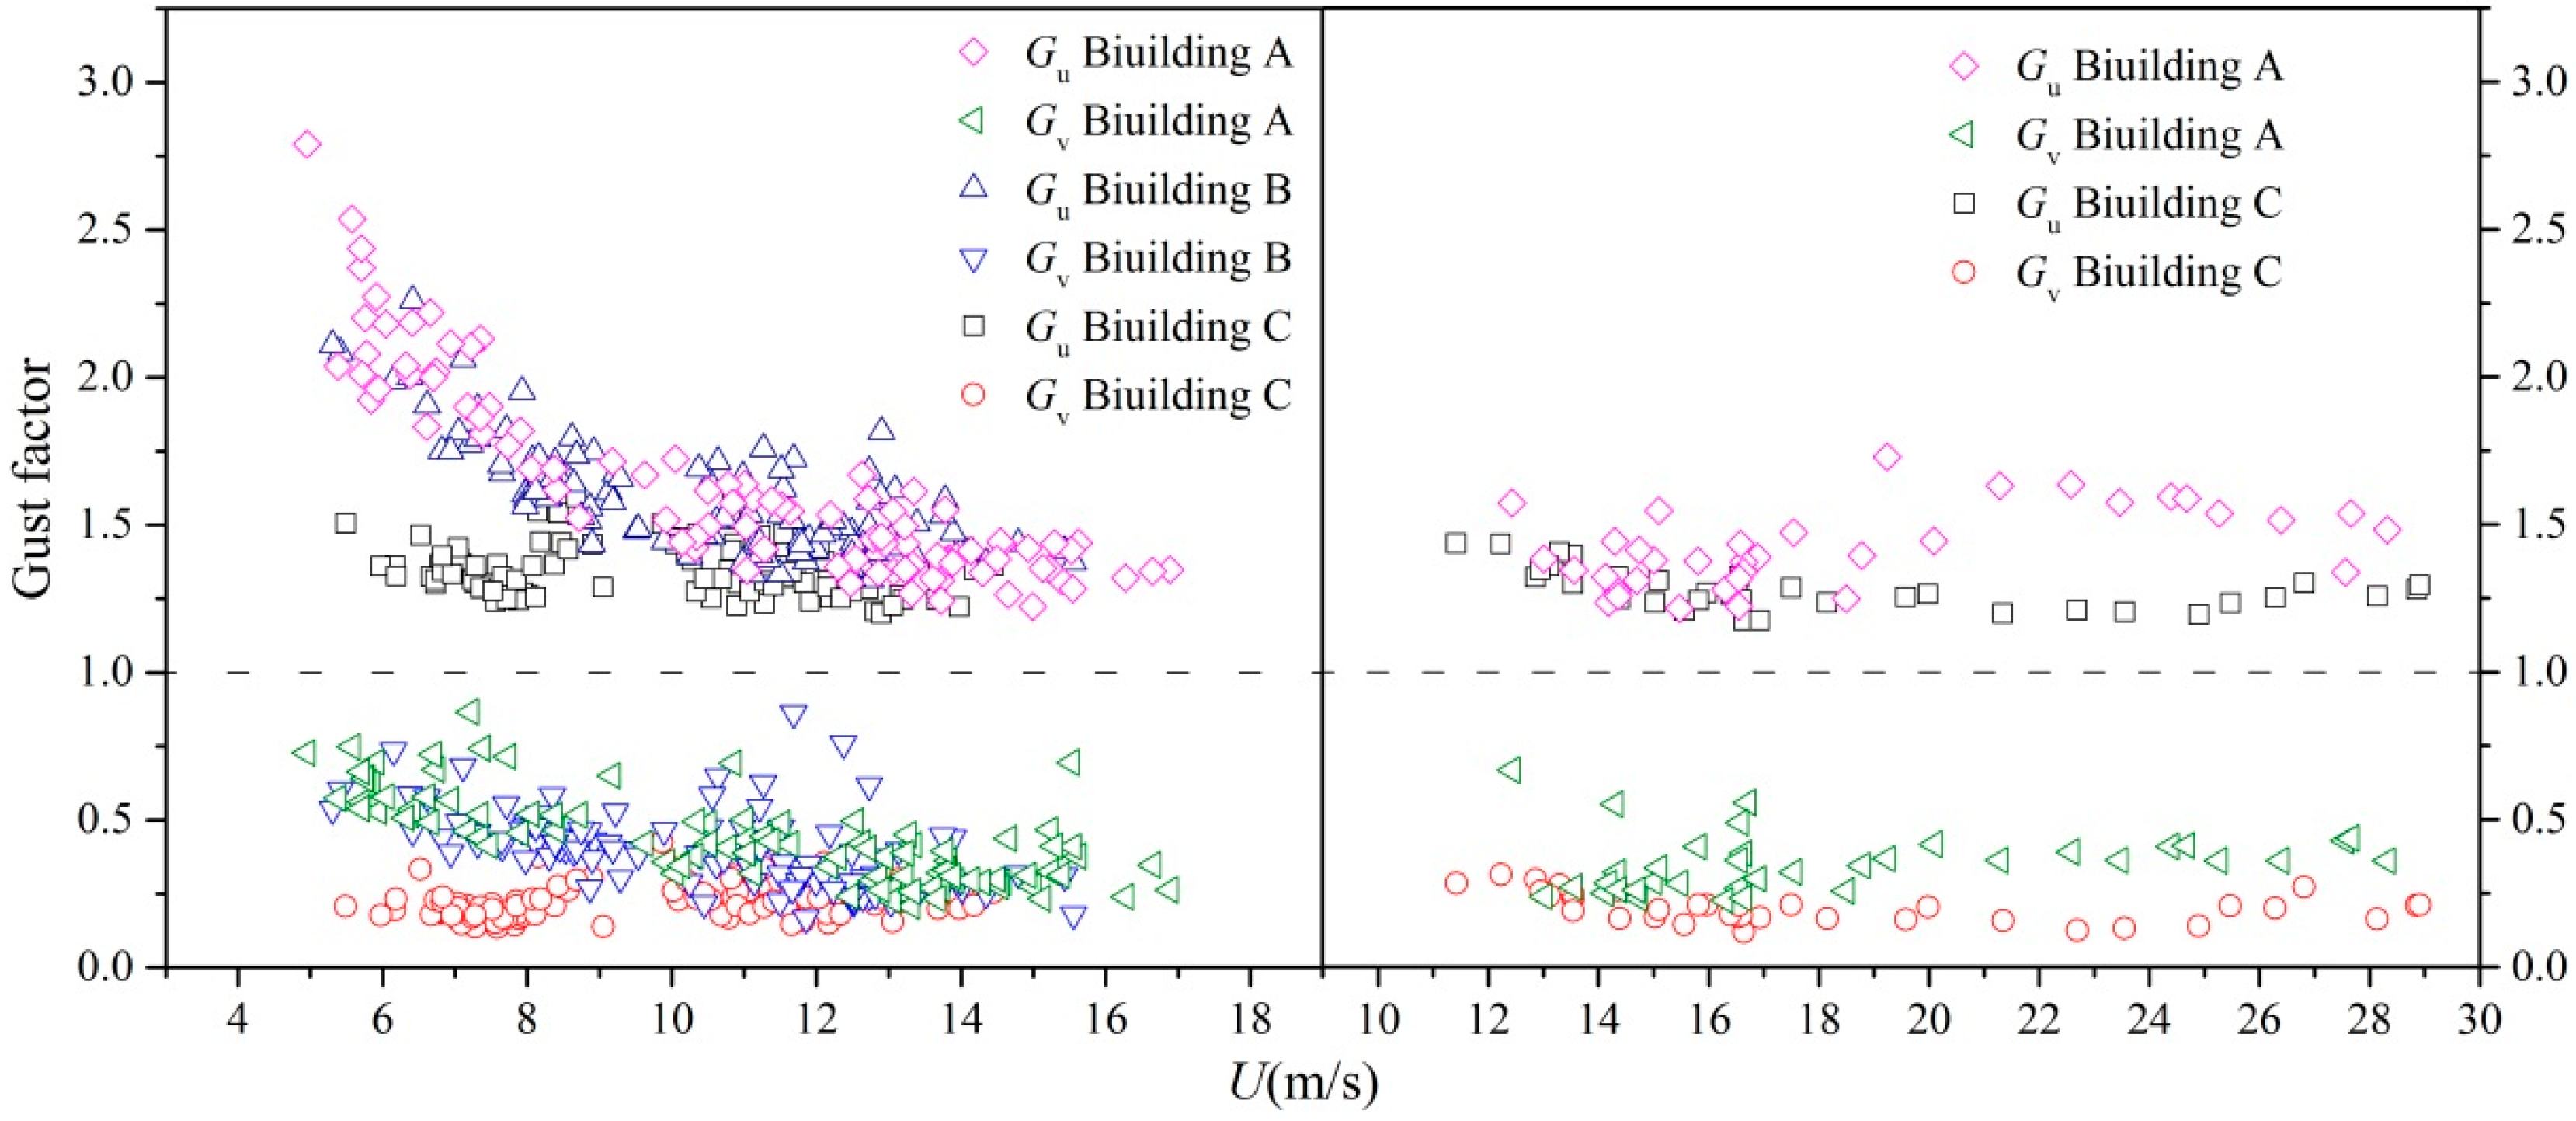
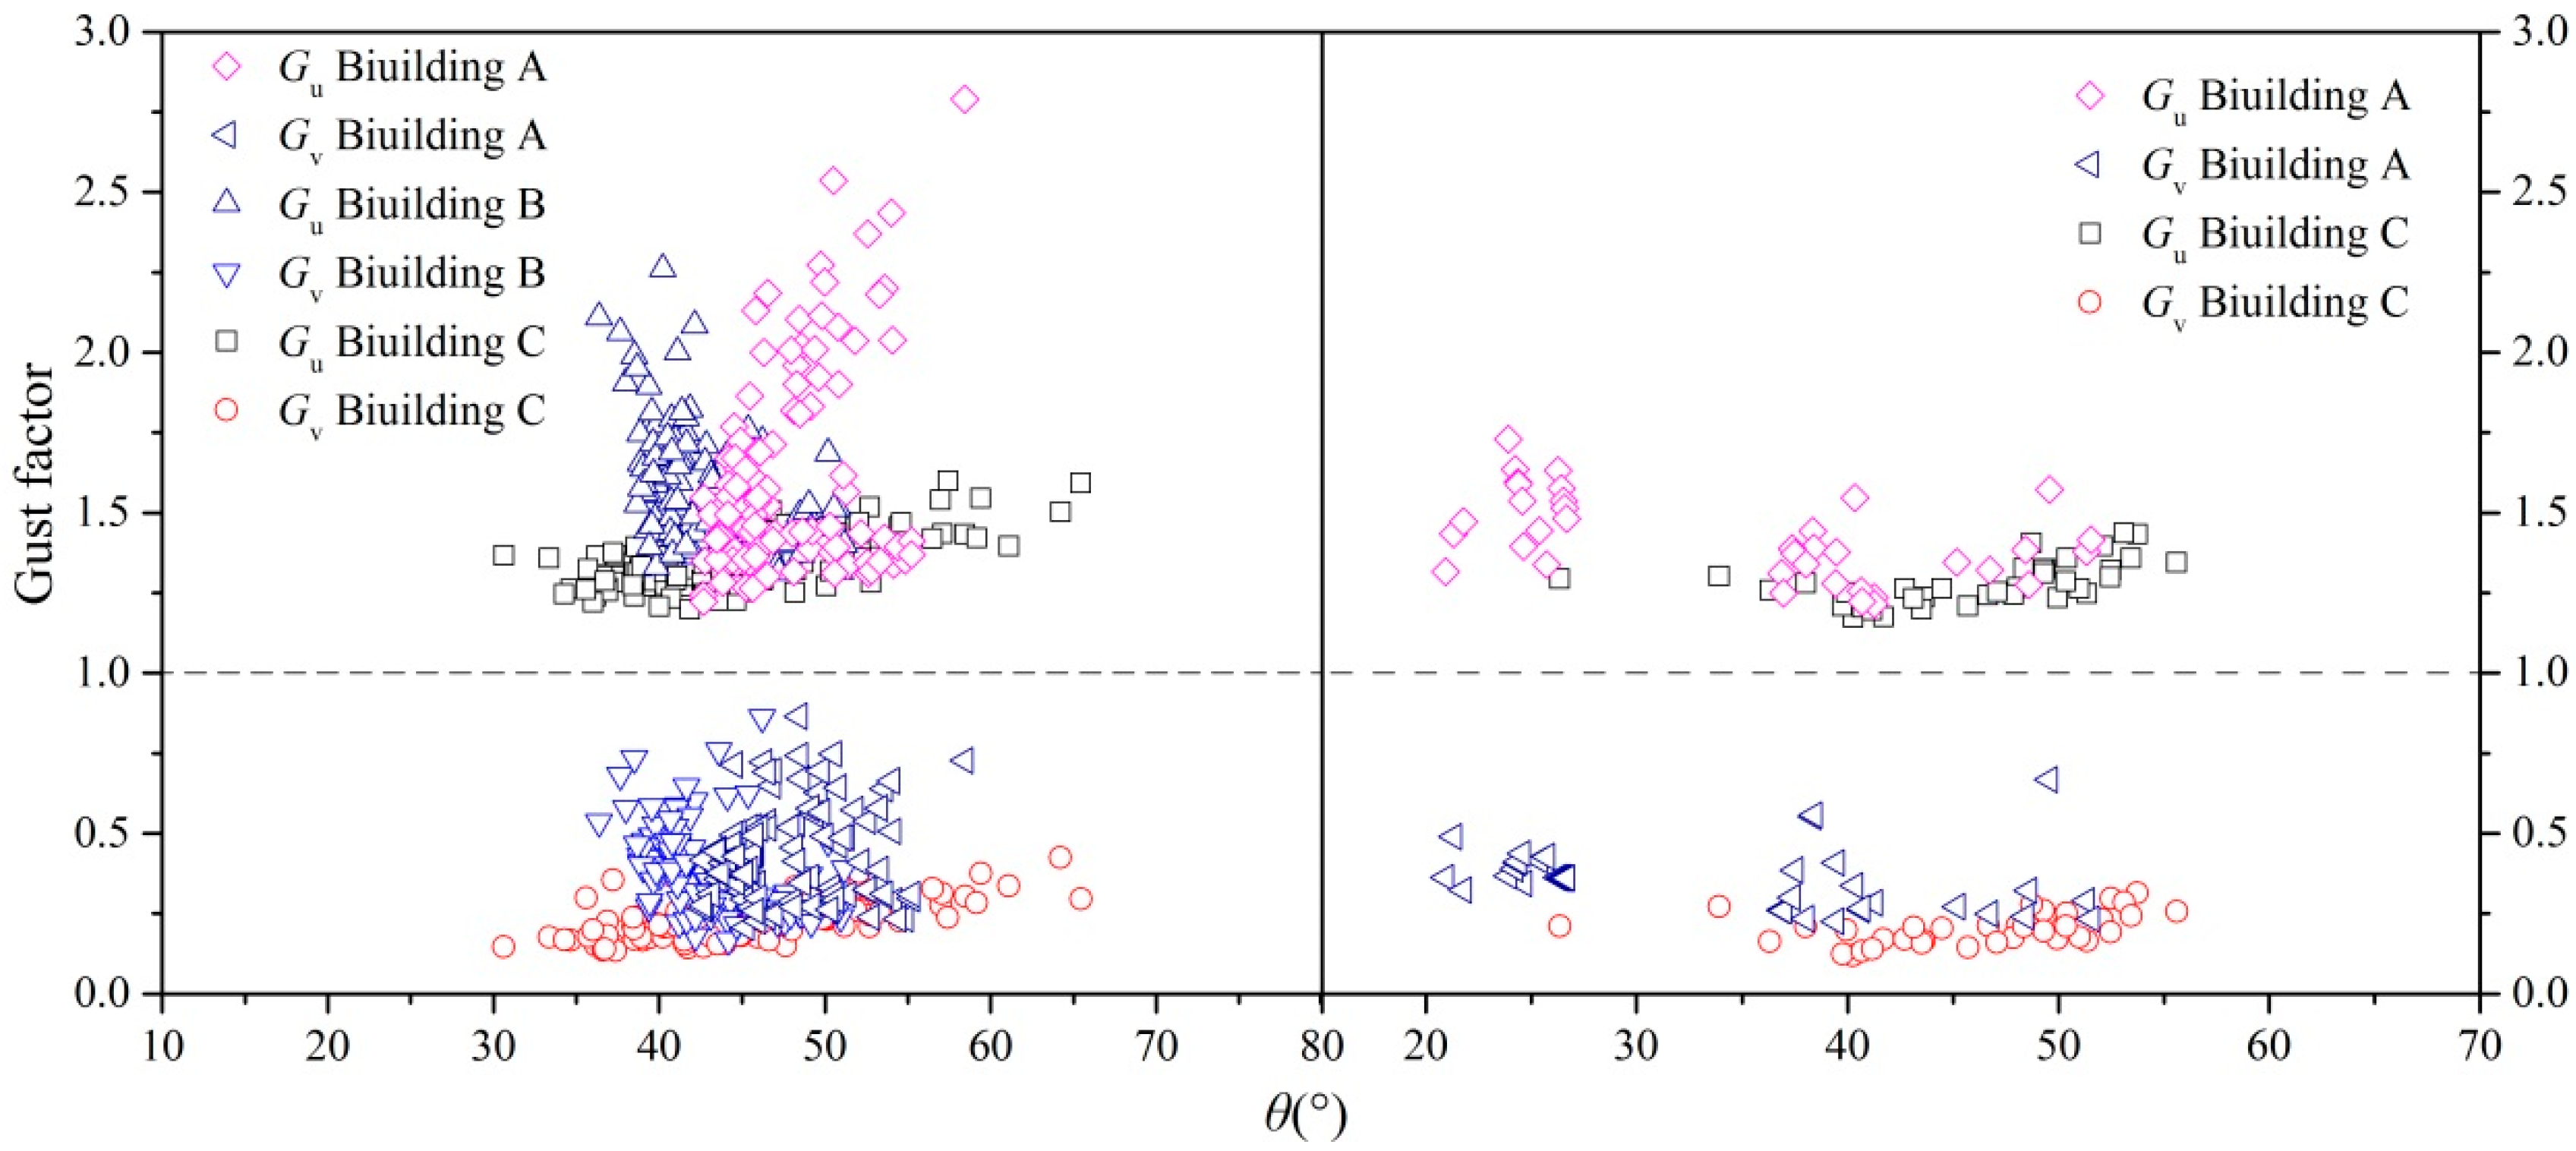
A comparison of the three high-rises in terms of turbulence in the along-wind and across-wind directions (Iu and Iv) is shown in Figure 6. Before 9:00 am on 14th September, the turbulence of buildings A and B was discrete, and the typhoon was far from the experimental building and had no effect on it at that time. The three high-rises had similar turbulence in the middle stage, but the turbulence of high-rise A increased in the late stage because the wind direction slowly moved northward, and a super high-rise is located north of high-rise A. This super high-rise produced an interference effect on the three high-rises.
Figure 7 and Figure 8 show the relationships between turbulence intensity and mean wind speed and between turbulence intensity and mean wind direction, respectively. The left side of the figures presents the synchronously recorded data of buildings A, B, and C. The right side of the figures displays the synchronously recorded data of buildings A and C when building B experienced power outage. The upper right corner of the figures exhibits the sample chart of wind speed and direction.
The left side of Figure 7 shows that when U < 10 m/s, the turbulence intensity of buildings A and B decreases with the increase in mean wind speed, whereas the turbulence intensity of building C does not change with the increase in mean wind speed. When U ≥ 10 m/s, the turbulence intensity of the three buildings changes by the same law and decreases with the increase in mean wind speed. The right side of Figure 7 indicates that the turbulence intensity of building A increases with the wind speed. When the mean wind speed reaches 19 m/s, the turbulence intensity does not change with the increase in mean wind speed. When the mean wind speed reaches 25 m/s, the turbulence intensity decreases with the increase in mean wind speed. The turbulence intensity of building C decreases with the increase in wind speed. At 19 m/s < U < 25 m/s, the turbulence intensity does not change with the increase in mean wind speed, and the mean values of the longitudinal and transverse turbulence intensity are 0.14 and 0.11, respectively. When U ≥ 25 m/s, the turbulence intensity increases with the mean wind speed, and the along-wind and cross-wind turbulence intensities are 0.19 and 0.15, respectively. In this process, the wind direction angle slowly changes from 55° to 20°, and the wind speed slowly increases. Meanwhile, the law of building A is completely different from that of building C because a super high-rise building is situated north of building A, imposing an interference effect of the upstream building, which will be considered in the next work through a wind tunnel test.
The left side of Figure 8 shows that the turbulence intensity of buildings A and B does not change with the increase in mean wind direction angle, thereby presenting a great dispersion. The turbulence intensity of building C increases with the mean wind direction angle θ. Between θ (40°, 45°), buildings A and C have further intersections at the turbulence intensity sample. The right side of Figure 8 indicates that the turbulence of building A decreases with the increase in mean wind direction angle θ, and the turbulence intensity remains stable and constant when θ > 40°. The turbulence intensity of building C decreases first and then increases with the mean wind direction angle. The inflection point interval is located between the wind direction angles θ (35°, 45°). The mean values of the along-wind and cross-wind turbulence intensity of building A are 0.14 and 0.13, respectively, whereas those of building C are 0.15 and 0.13, respectively.
Table 1 shows the comparison of along-wind direction turbulence intensity between Chinese code (GB50009-2012) and field measurements, respectively. The turbulence intensity in the along-wind direction of three high-rises ranged from 17.7% to 30.8%, which is greater than the value specified in a relevant standard (GB50009-2012) in China when the terrain category changed from Class A to Class D. This change can be explained by the interference in the building cluster.

4.3. Gust Factor

Figure 9 and Figure 10 present the relationship between gust factors and mean wind speed and between gust factors and mean wind direction, respectively. The left side of the figure shows the synchronously recorded data of buildings A, B, and C. The right side of the figure exhibits the synchronously recorded data of buildings A and C when building B experiences power outage. The line with an ordinate of 1 is used to distinguish the longitudinal and transverse gust factors (Gu and Gv). In the selected samples, the gust duration is 3 s, and Table 2 shows the mean of the gust factors of the three buildings in two phases.
The left side of Figure 9 illustrates that the change law of gust factor with the mean wind speed U is nearly identical with that of turbulence. When U < 10 m/s, the gust factors of buildings A and B decrease with the increase in mean wind speed, whereas the gust factor of building C does not change with the increase in mean wind speed. When U ≥ 10 m/s, the change law of gust factor in the three buildings is consistent and decreases with increasing mean wind speed, but the change speed is slow. The right side of Figure 9 shows that the along-wind gust factor of building A increases first and then decreases, and the maximum value is 1.73 when U = 19 m/s. The cross-wind gust factor of building A, the along-wind gust factor of building C and the cross-wind gust factor do not change with the increase in mean wind speed. Figure 10 indicates that the change law of gust factor with the mean wind speed is nearly identical with the change law of turbulence.
The analysis of Figure 7, Figure 8, Figure 9 and Figure 10 presents that the turbulence and gust factors obtained by investigating the samples at U ≥ 10 m/s are reasonable. The gust factors that meet the requirements are evaluated statistically. The mean longitudinal and transverse gust coefficients at the top of building A (102 samples) are 1.428 and 0.356, those at the top of building B (63 samples) are 1.485 and 0.351 and those at the top of building C (96 samples) are 1.319 and 0.225, respectively.

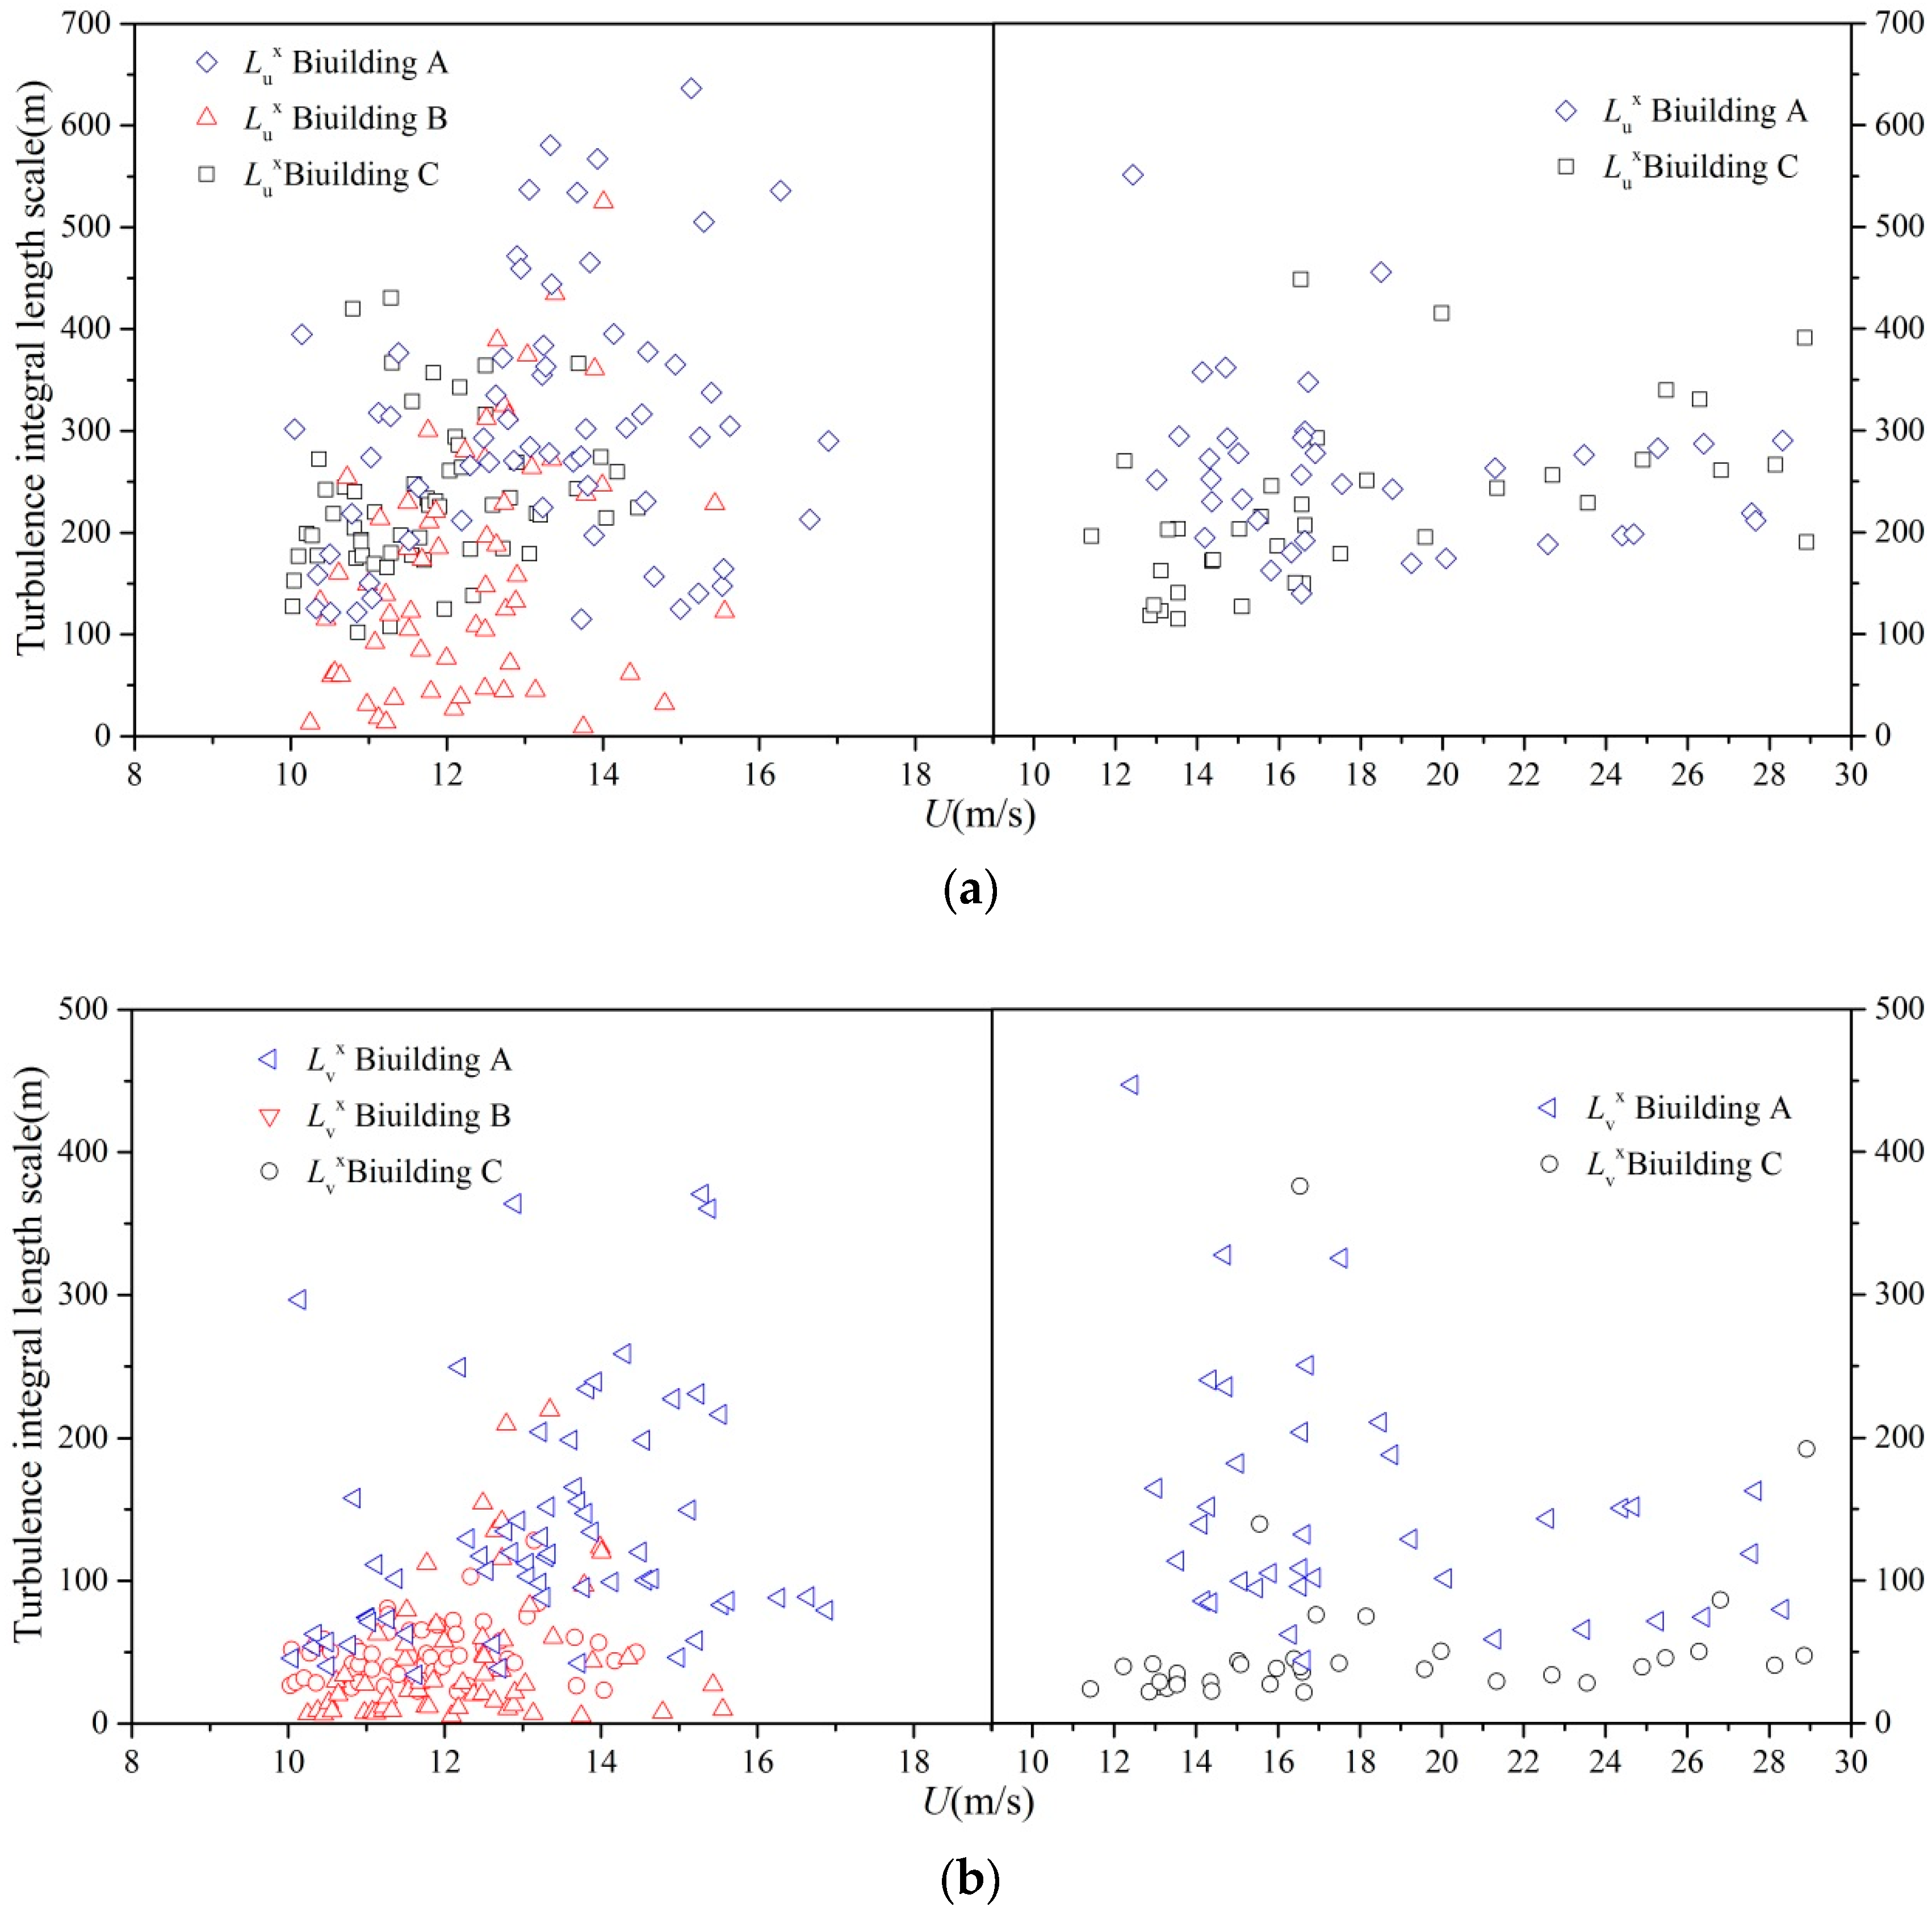
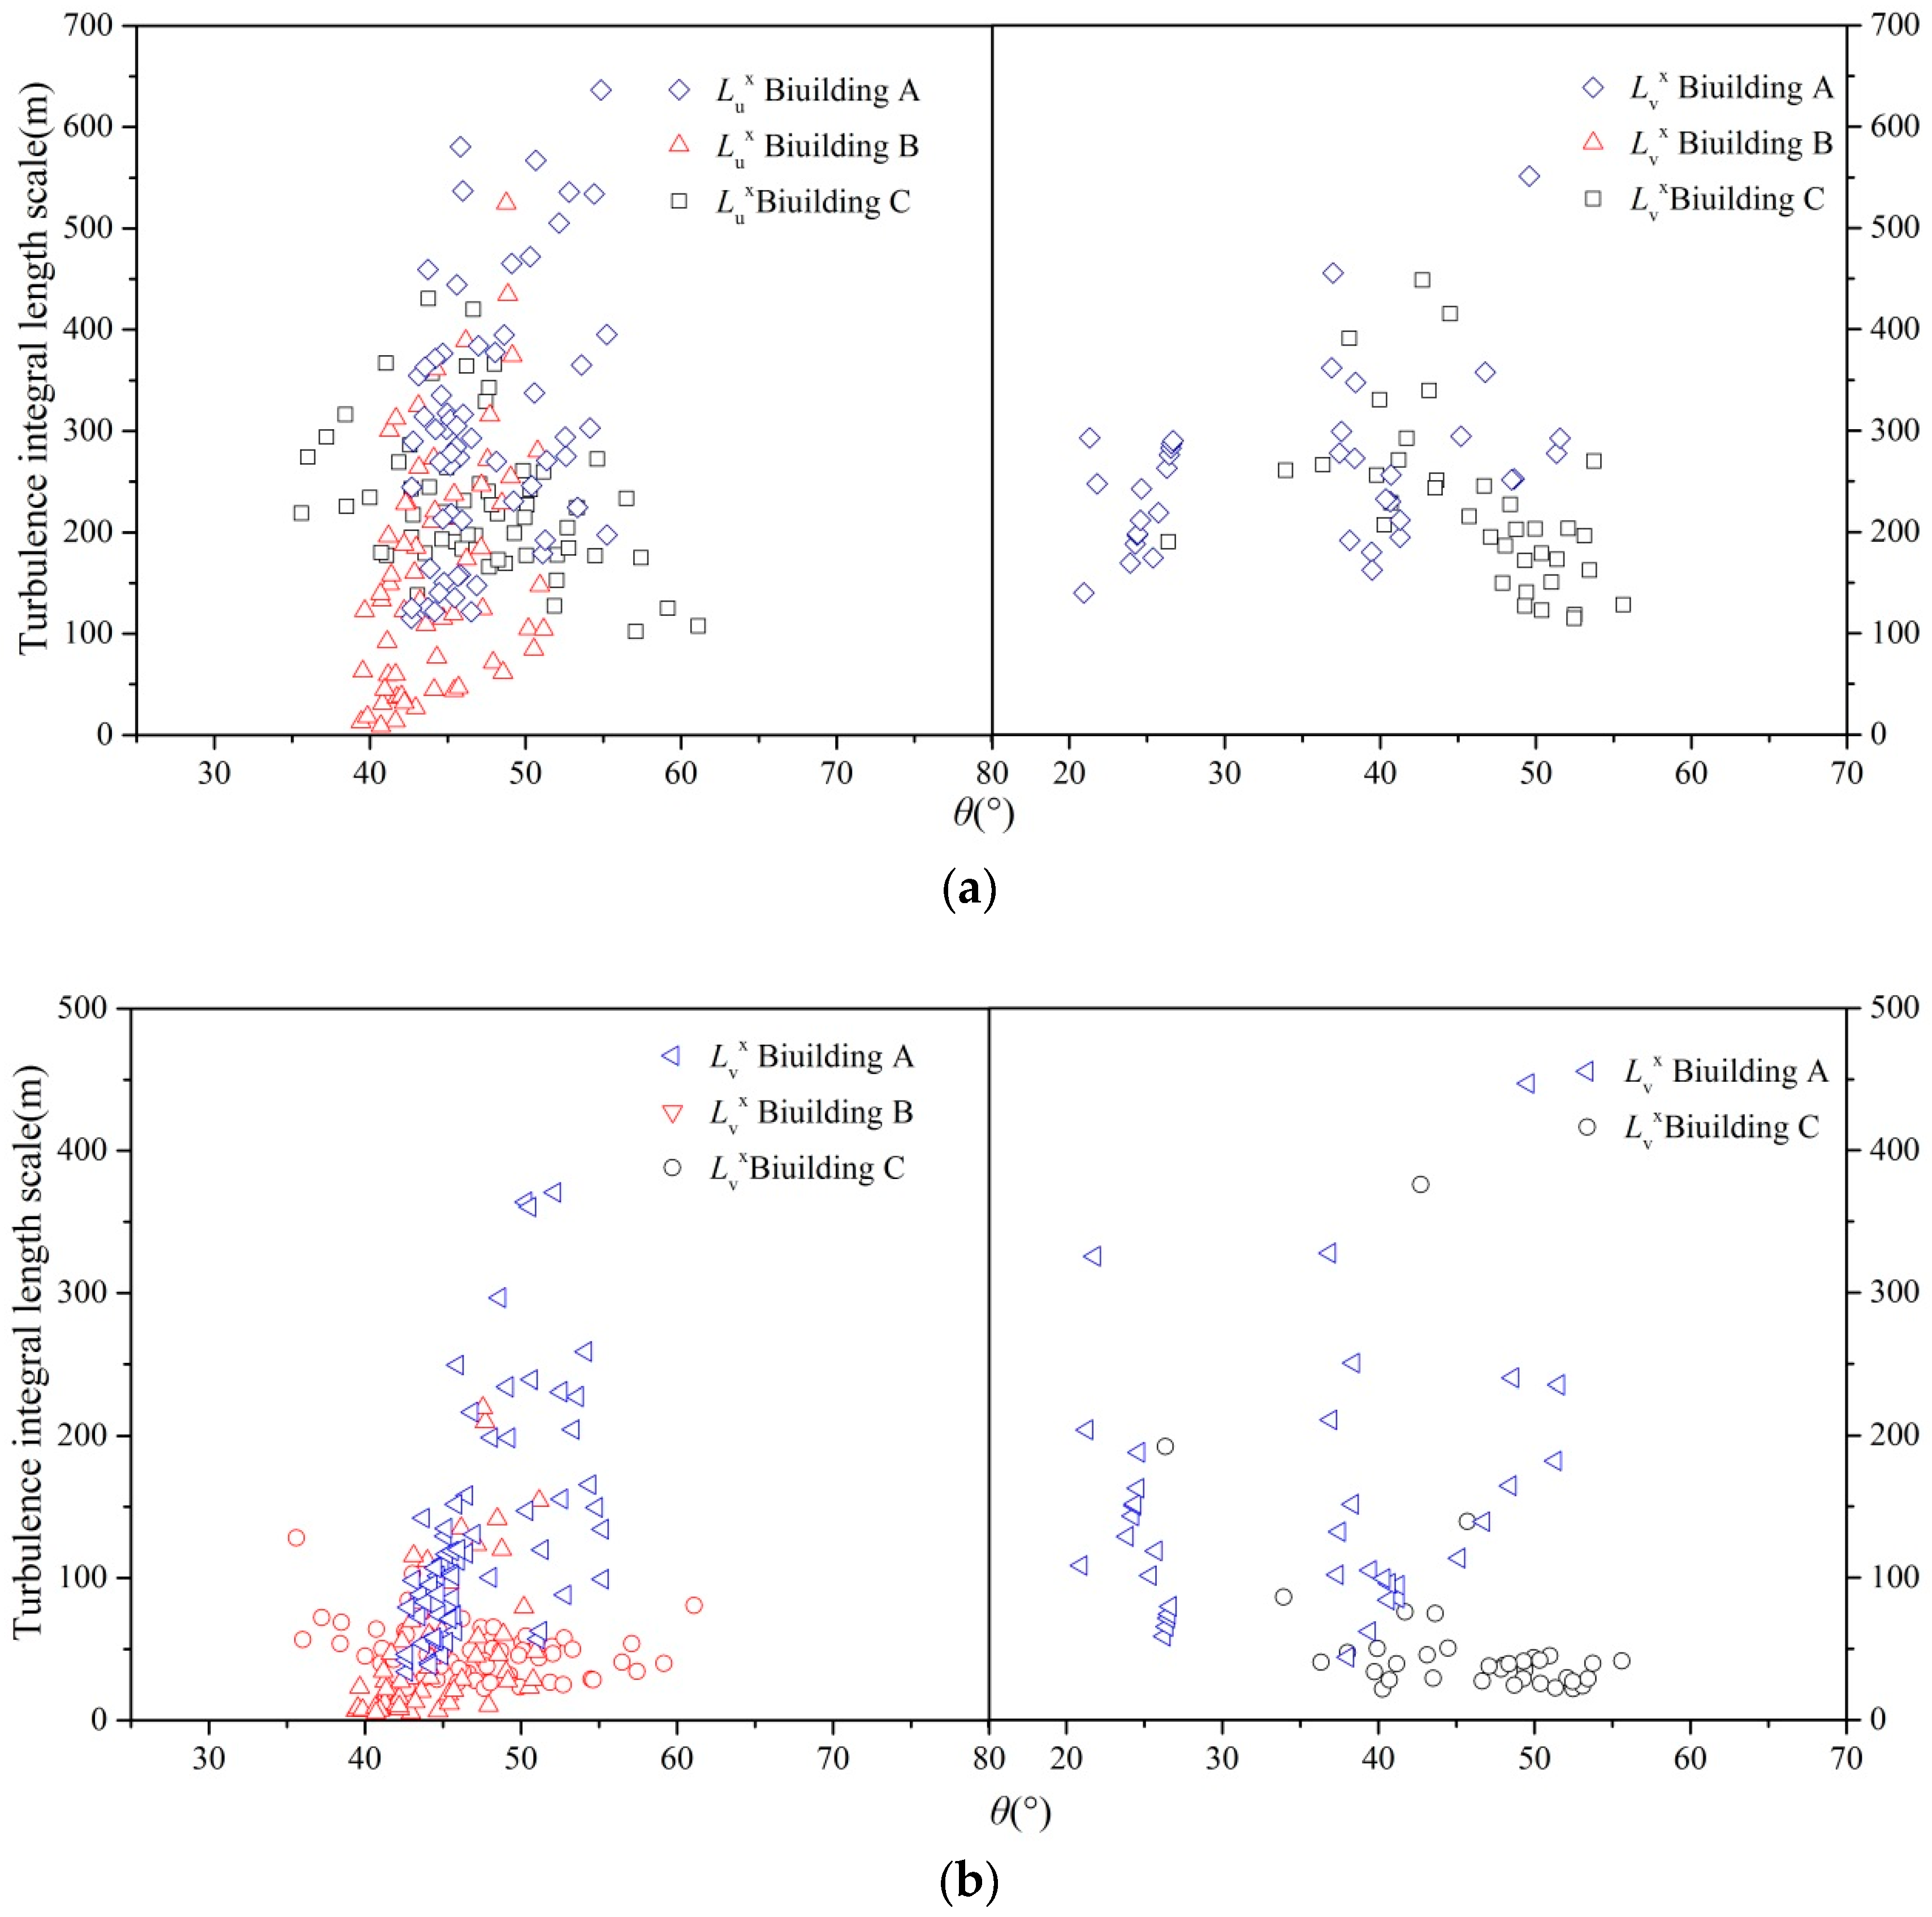
4.4. Turbulence Integral Scale

The turbulent integral length scale statistical analysis of the data of mean wind speed U ≥ 10 m/s was performed as shown in Figure 11 and Figure 12. Table 3 presents the mean value of the turbulent integral scale for the two cycles. The along-wind turbulent integral scale distribution area of building A is (115 m, 636 m), that of building B is (10 m, 524 m), and that of building C is (102 m, 403 m). All of them show a large dispersion. No relevant provisions in the Chinese specification can be used to predict the turbulence integral length scales, but the values estimated by ASCE-7 and AIJ-2004 are 277.9 m (Sea, Lu = 198.12 x (150/10)1/8 = 277.9 m) and 223.6 m (Lu = 100 x (150/30)0.5 = 223.6 m), respectively. These values are comparable to the measured values of buildings A and C. The left side of Figure 12 shows that the mean wind direction angle of building B is θ (39°, 51°), and no interference in the upstream of building B exists within this wind direction angle. According to Kwok and Khandurid, when the plane size of the building is similar, aerodynamic interference occurs between buildings, and the plane size of the three buildings are the same [18,19]. Building B is in the middle position, which explains why its turbulence integral scale is smaller than those of the other two buildings.

5. Analysis of Fluctuating Parameters

Continuous strong wind data from 9:00 AM on 14th September to 3:00 AM on 15th September are analyzed in detail. These data with high wind speed can help explain the turbulence characteristics. An environment with a low mean speed is conducive for free convection, which may introduce additional turbulence records and increase the deviation from the mean value. Moreover, several requirements should be met to obtain reasonable results. Based on the results of the previous analysis, data are selected for analysis at the mean wind speed U ≥ 10 m/s. When three measuring points are collected at the same time, three the mean wind speed is U < 16 m/s, and the samples of Building A, B, and C are 11, 10, and 9, respectively; when only two measuring points are collected at the same time, there are two samples of mean wind speed of Building A; 10 m/s ≤ U < 16 m/s, 4 samples of U ≥ 16 m/s; and 2 samples of Building C; 10 m/s ≤ U < 16 m/s, and 4 samples with U ≥ 16 m/s. Therefore, in Section 5, the main components of 10 m/s ≤ U <16 m/s and U ≥ 16 m/s are analyzed. Under the conditions determined by long time interval (1 h), the low wind speed section (10 m/s ≤ U < 16 m/s) and high wind speed section (U ≥ 16 m/s) are discussed. The difference in the observation period of the three buildings is not considered in Section 5, mainly because the low-speed section contained the whole process of simultaneous acquisition of three measuring points, while the high-speed section only had two simultaneous measuring points.

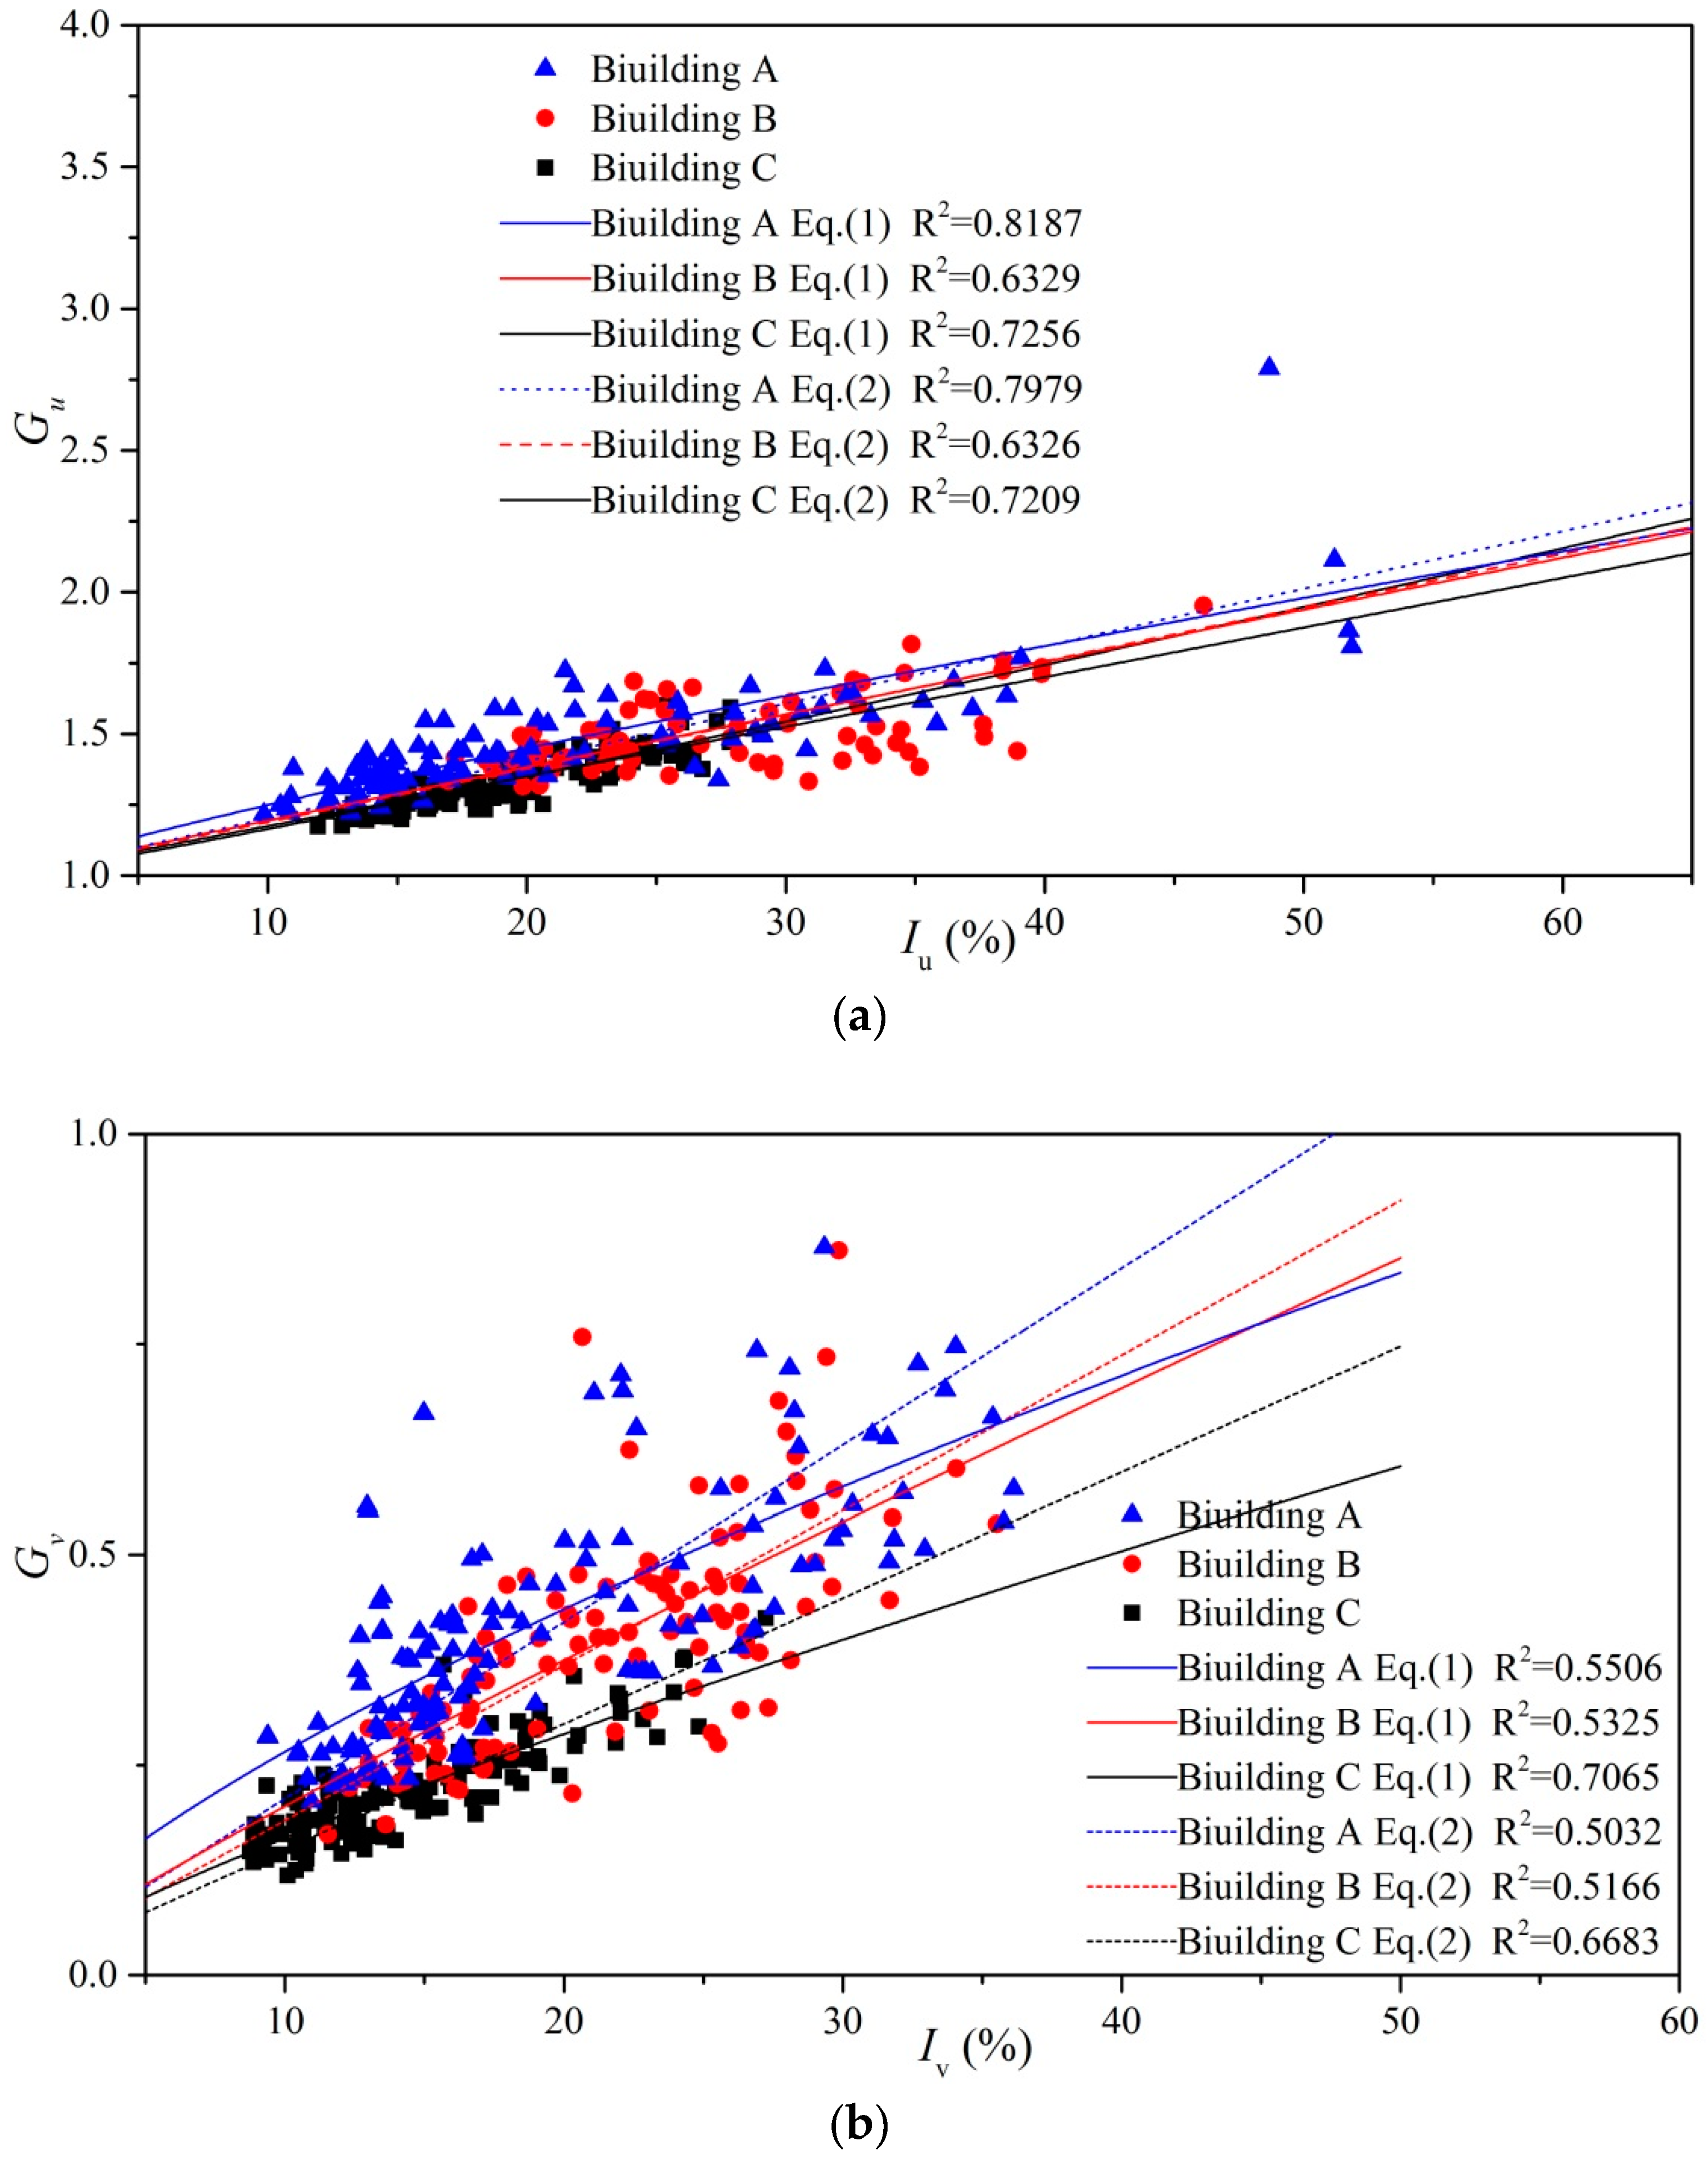
5.1. Relations Between Fluctuating Parameters

Turbulence intensity and Gust factor are two important parameters in determining the fluctuating wind speed component. On the basis of the wind field of the typhoon investigated by Choi [20] and Ishizaki [21], Cao et al. established a standardized empirical expression for describing the relations between the gust factor and longitudinal turbulence intensity [1], which is:
G u ( t g ) = 1 + k 1 I u k 2 1 ln ( T t g ) , G v ( t g ) = k 3 I v k 4 1 ln ( T t g )
where k 1 and k 2 are two parameters and average time interval T is set to 10 min. Choi suggested that k 1 = 0.62 and k 2 = 1.27 , whereas Ishizaki stated that k 1 = 0.5 and k 2 = 1.0 .
Many field measurements have revealed linear relations between the gust factor and longitudinal turbulence intensity, which means k 2 = 1.0 is widely accepted [22,23,24,25]. Gu et al. [23] conducted a statistical analysis by comparing fitting parameter k 2 with Equation (9) or the constant 1, and the results show that the calculations of the two methods are nearly identical. In this study, a linear fitting method was used to determine the relations amongst the gust factors, longitudinal turbulence intensity, and lateral turbulence intensity, which are defined as follows:
G u ( t g ) = 1 + k u I u ln ( T t g ) , G v ( t g ) = k v I v ln ( T t g )
The fitting results of Equations (9) and (10) are shown in Figure 13, and the fitting parameters are shown in Table 4. As indicated in the graph, the Gust factor increased with turbulence intensity, and the fitting curve patterns of Equations (9) and (10) are not very different. However, the fitting curve patterns of Equation (9) are different from the values given by Choi and Ishizaki. By contrast, Equation (10) only considers a single parameter, and the fitting parameters of the three high-rises are in good agreement with the value of 0.42 proposed by Erich [26]. Thus, the relations between the gust factor and turbulence can be easily fitted using Equation (10). The mean values of ku and kv are 0.356 and 0.342, respectively.

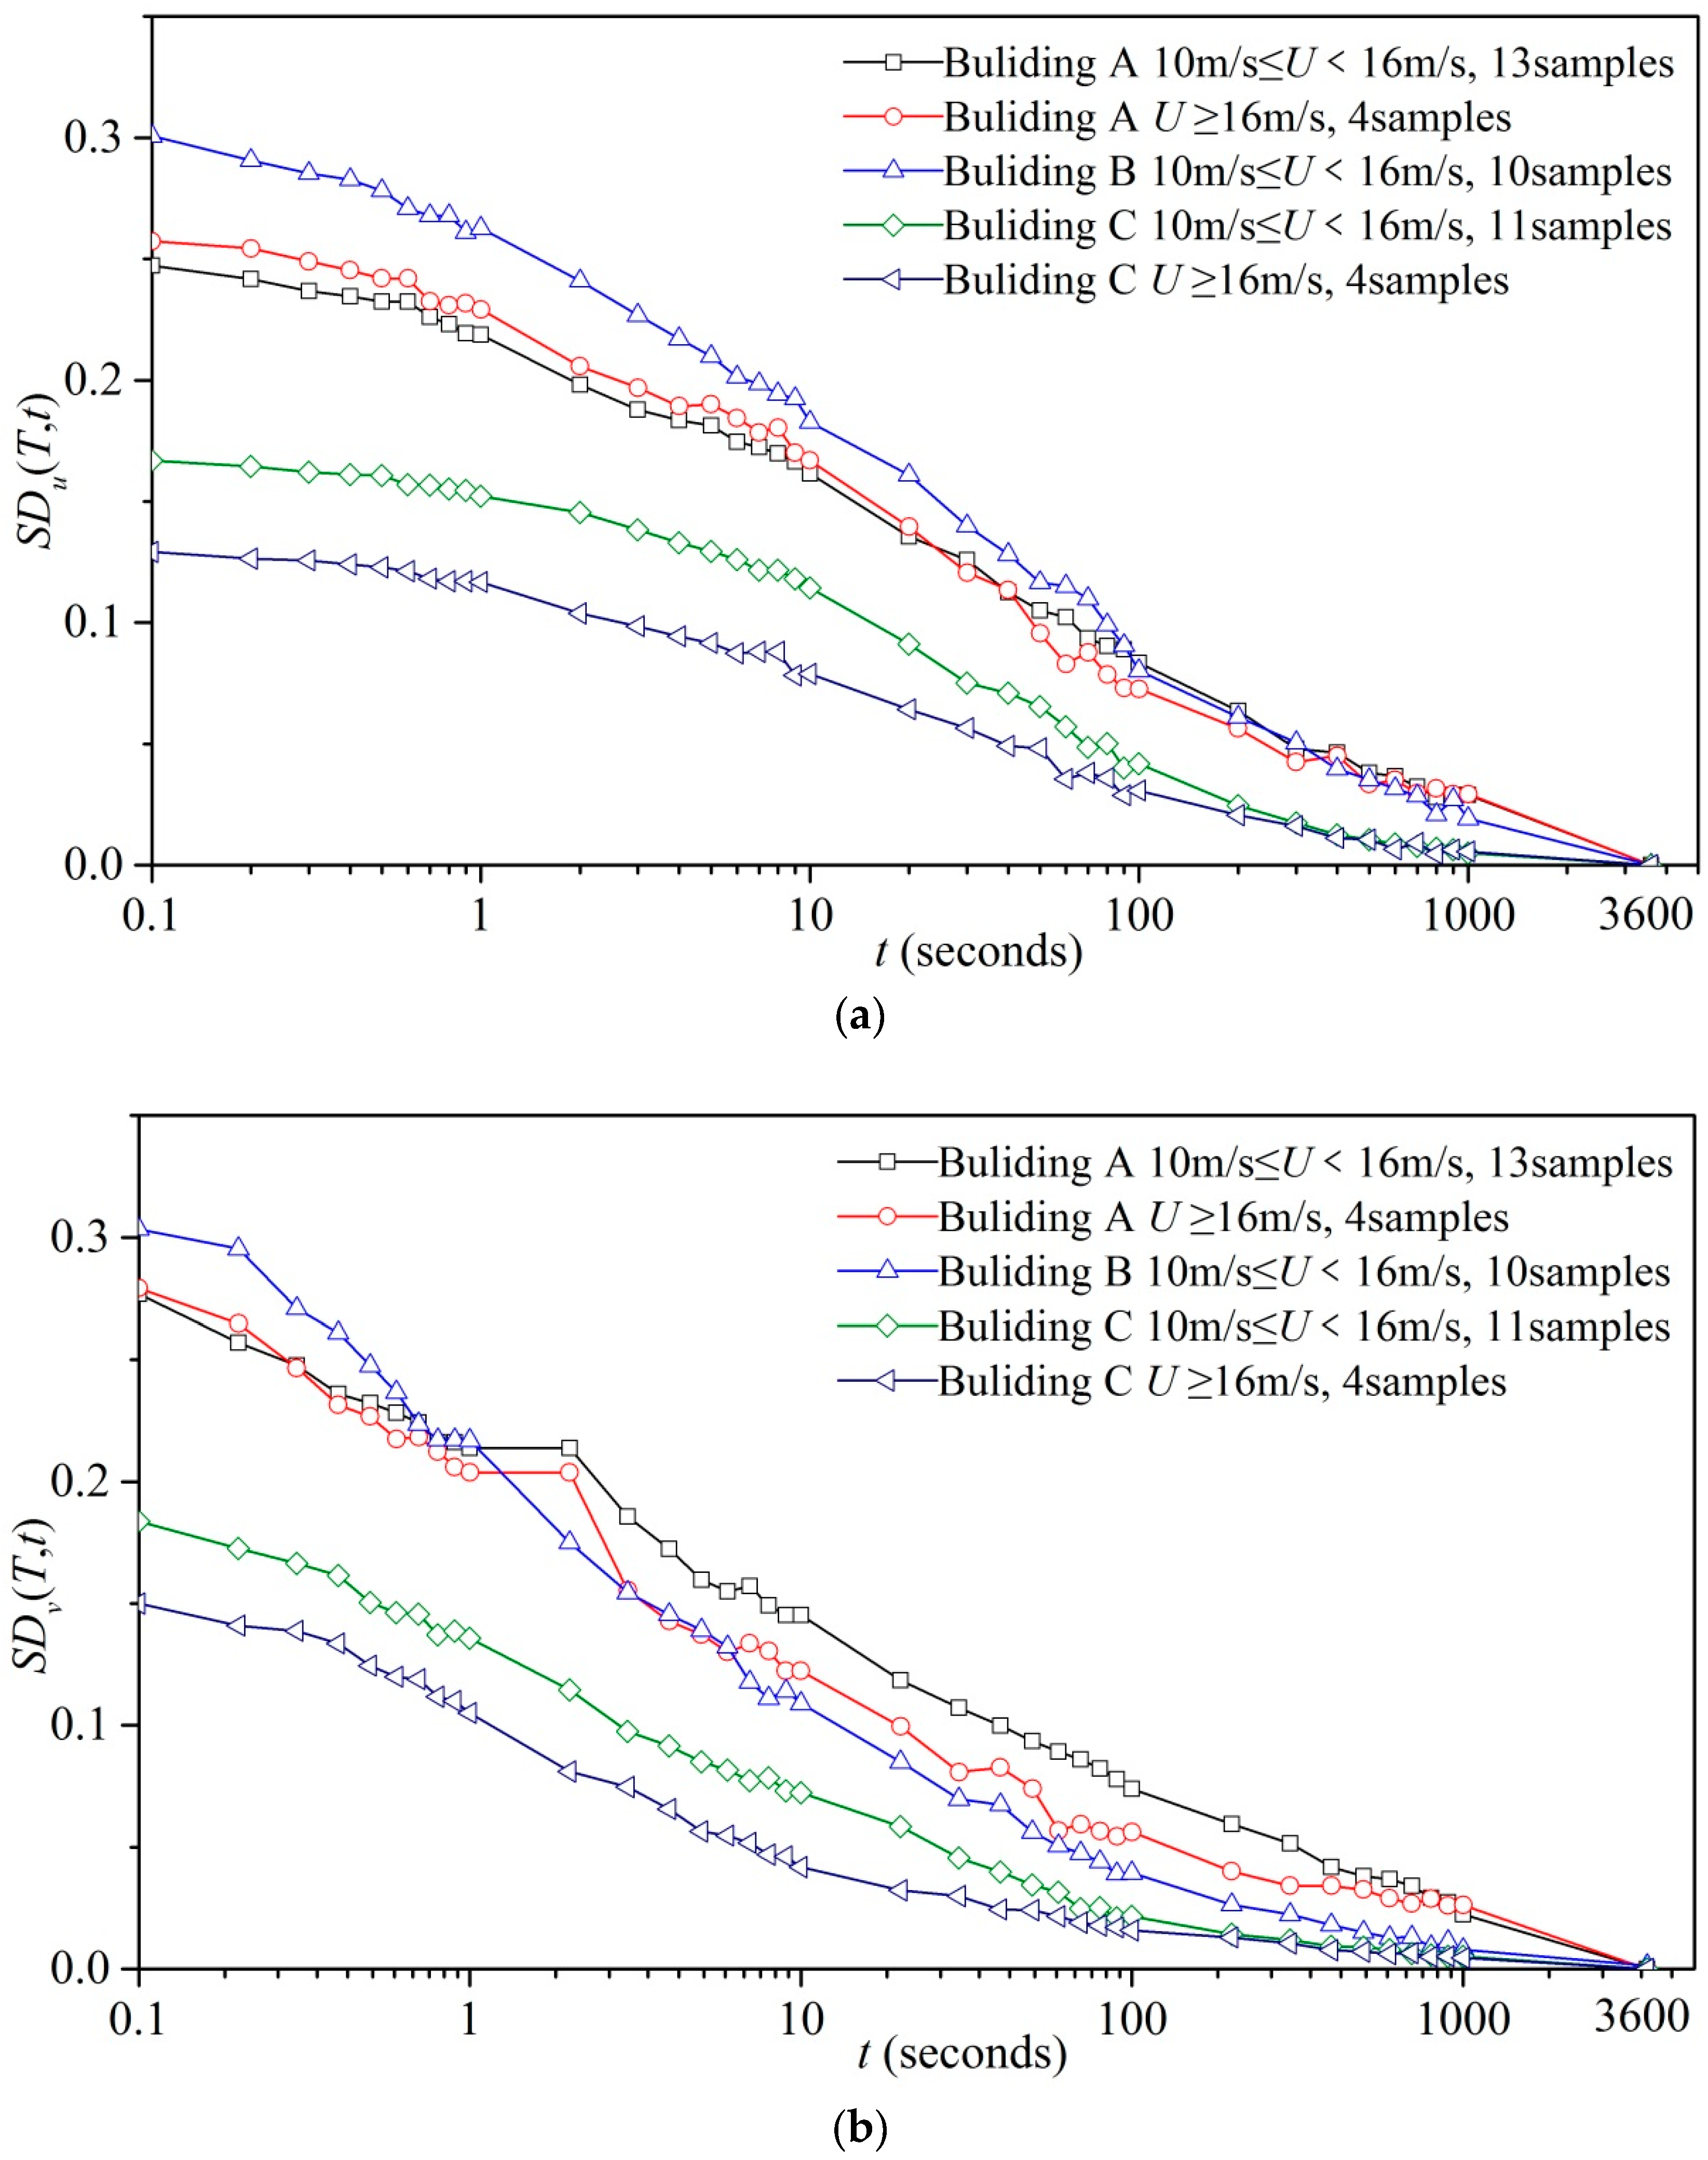
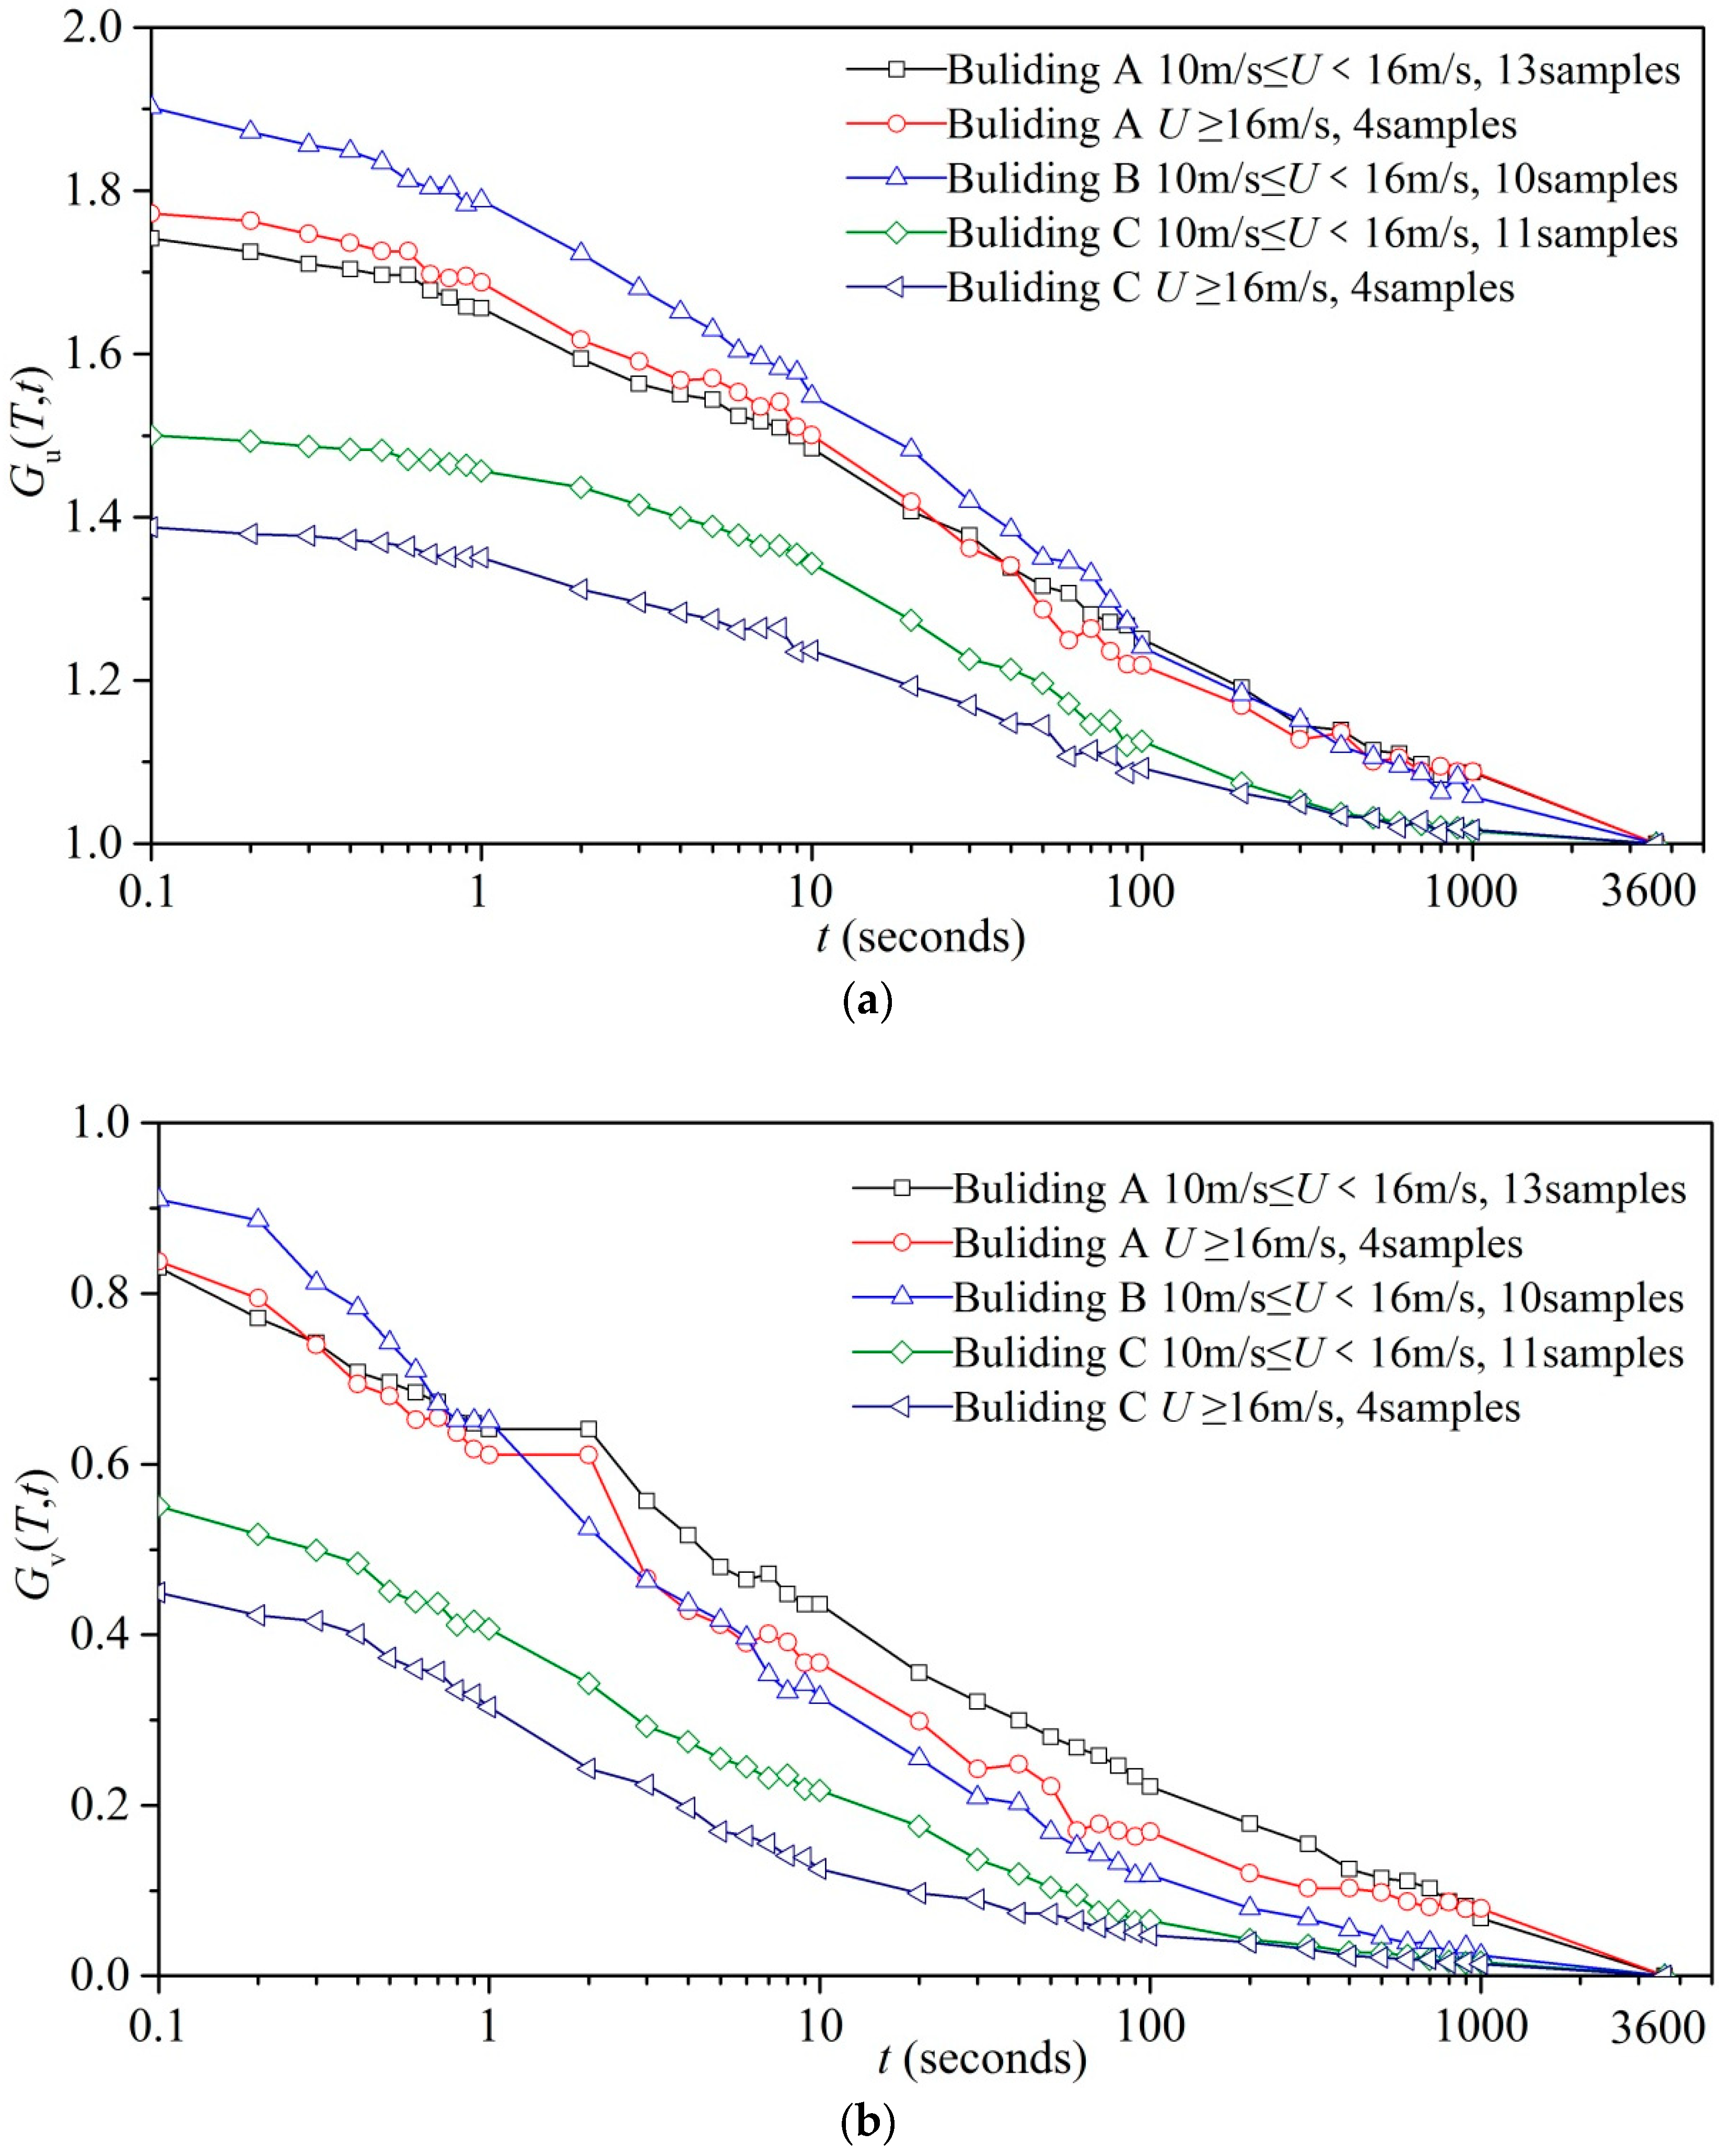
5.2. Relations Between Fluctuating Parameters and Gust Duration

There are limited field measurements studying the relations between the fluctuating parameters and gust duration. Durst revealed the statistical relations between turbulence intensity and gust factor under different gust durations and the corresponding mean hourly wind speeds for open and flat terrains [27]. Krayer and Marshall determined the variation in longitudinal turbulence intensity with time interval based on measured results [28]. Yu and Gan obtained the Gust factor and turbulence for a subsurface tropical cyclone and evaluated the variations with terrain roughness and gust duration [29]. On the basis of wind field records on the roof of Shanghai World Financial Centre, An et al. presented and assessed the variations in the gust factor and turbulence with gust duration [12]. Different gust durations (short-time interval t) exert a remarkable effect on the values of fluctuating parameters, such as turbulence intensity, gust factor, and peak factor, with the long-time interval (T). The expression for the longitudinal gust factor and turbulence intensity for a specific short-time interval is
G u ( T , t ) = u max ( T , t ) / U ( T )
S D u ( T , t ) = i = 1 N u i 2 ( t ) / ( N 1 ) U ( T )
In Equation (11), u max ( T , t ) indicates the longitudinal fluctuating wind within basic time interval T, and maximum mean wind speed U ( T ) is the mean wind speed with time interval t within the basic time interval. In Equation (12), u i indicates the longitudinal fluctuating wind speed. In this study, with T = 3600 s, time interval variable T is set to from 1 s to 1 h, and N = T/t. When gust duration t = 3 s, S D u ( T , t ) approximates turbulence Iu, as previously described. In addition, in G u ( T , t ) and S D u ( T , t ) , by replacing u with v , the gust factor in the across-wind direction G v ( T , t ) and turbulence S D v ( T , t ) can be evaluated by Equations (11) & (12), respectively.
The strong wind record for 18 h is split into 1 h time intervals, and the variations in turbulence intensity and gust factor with mean gust duration ( S D u and G u ) are shown in Figure 14 and Figure 15. As shown in Figure 14, the longitudinal turbulence intensity for the three buildings gradually decreases and the difference between the two fitting curves also decrease with increasing time interval. Within the same time interval, the turbulence intensity in the along-wind direction and the Gust factor of building B with low wind speed are the highest, and building C are the lowest. In addition, those of building A with high wind speed are the highest, and building C are the lowest. However, the variations in turbulence intensity in the across-wind direction and those in the Gust factor of building A and C are basically to the same as the turbulence intensity in the along-wind direction. The turbulence intensity and Gust factor of building B slightly fluctuated due to the interference among the high-rises. The results of fluctuating parameters substantially decreased with the increase in the value of t. The differences among the three buildings are relatively large at every wind speed when t < 100 s. However, approximately no difference is observed among them when t > 100 s. This condition indicates that turbulence intensity and Gust factor are mainly affected by short-term wind fluctuations.

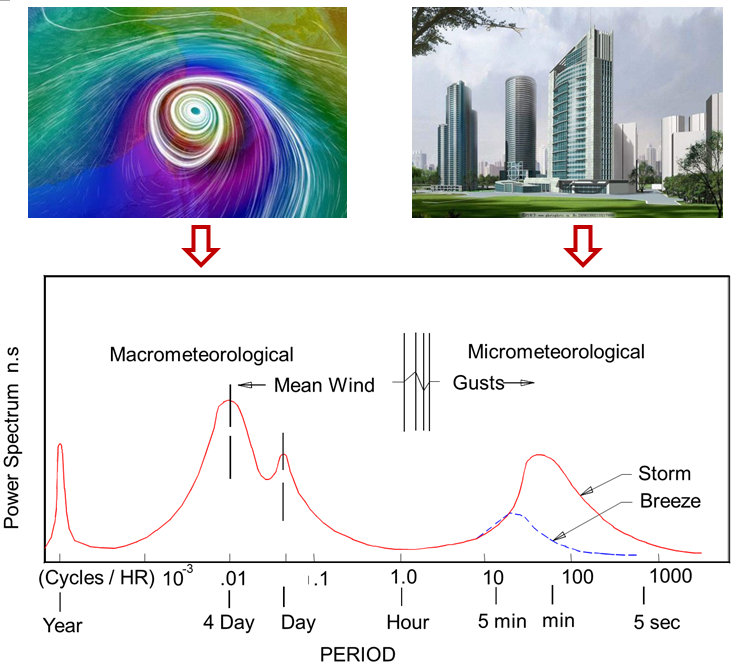
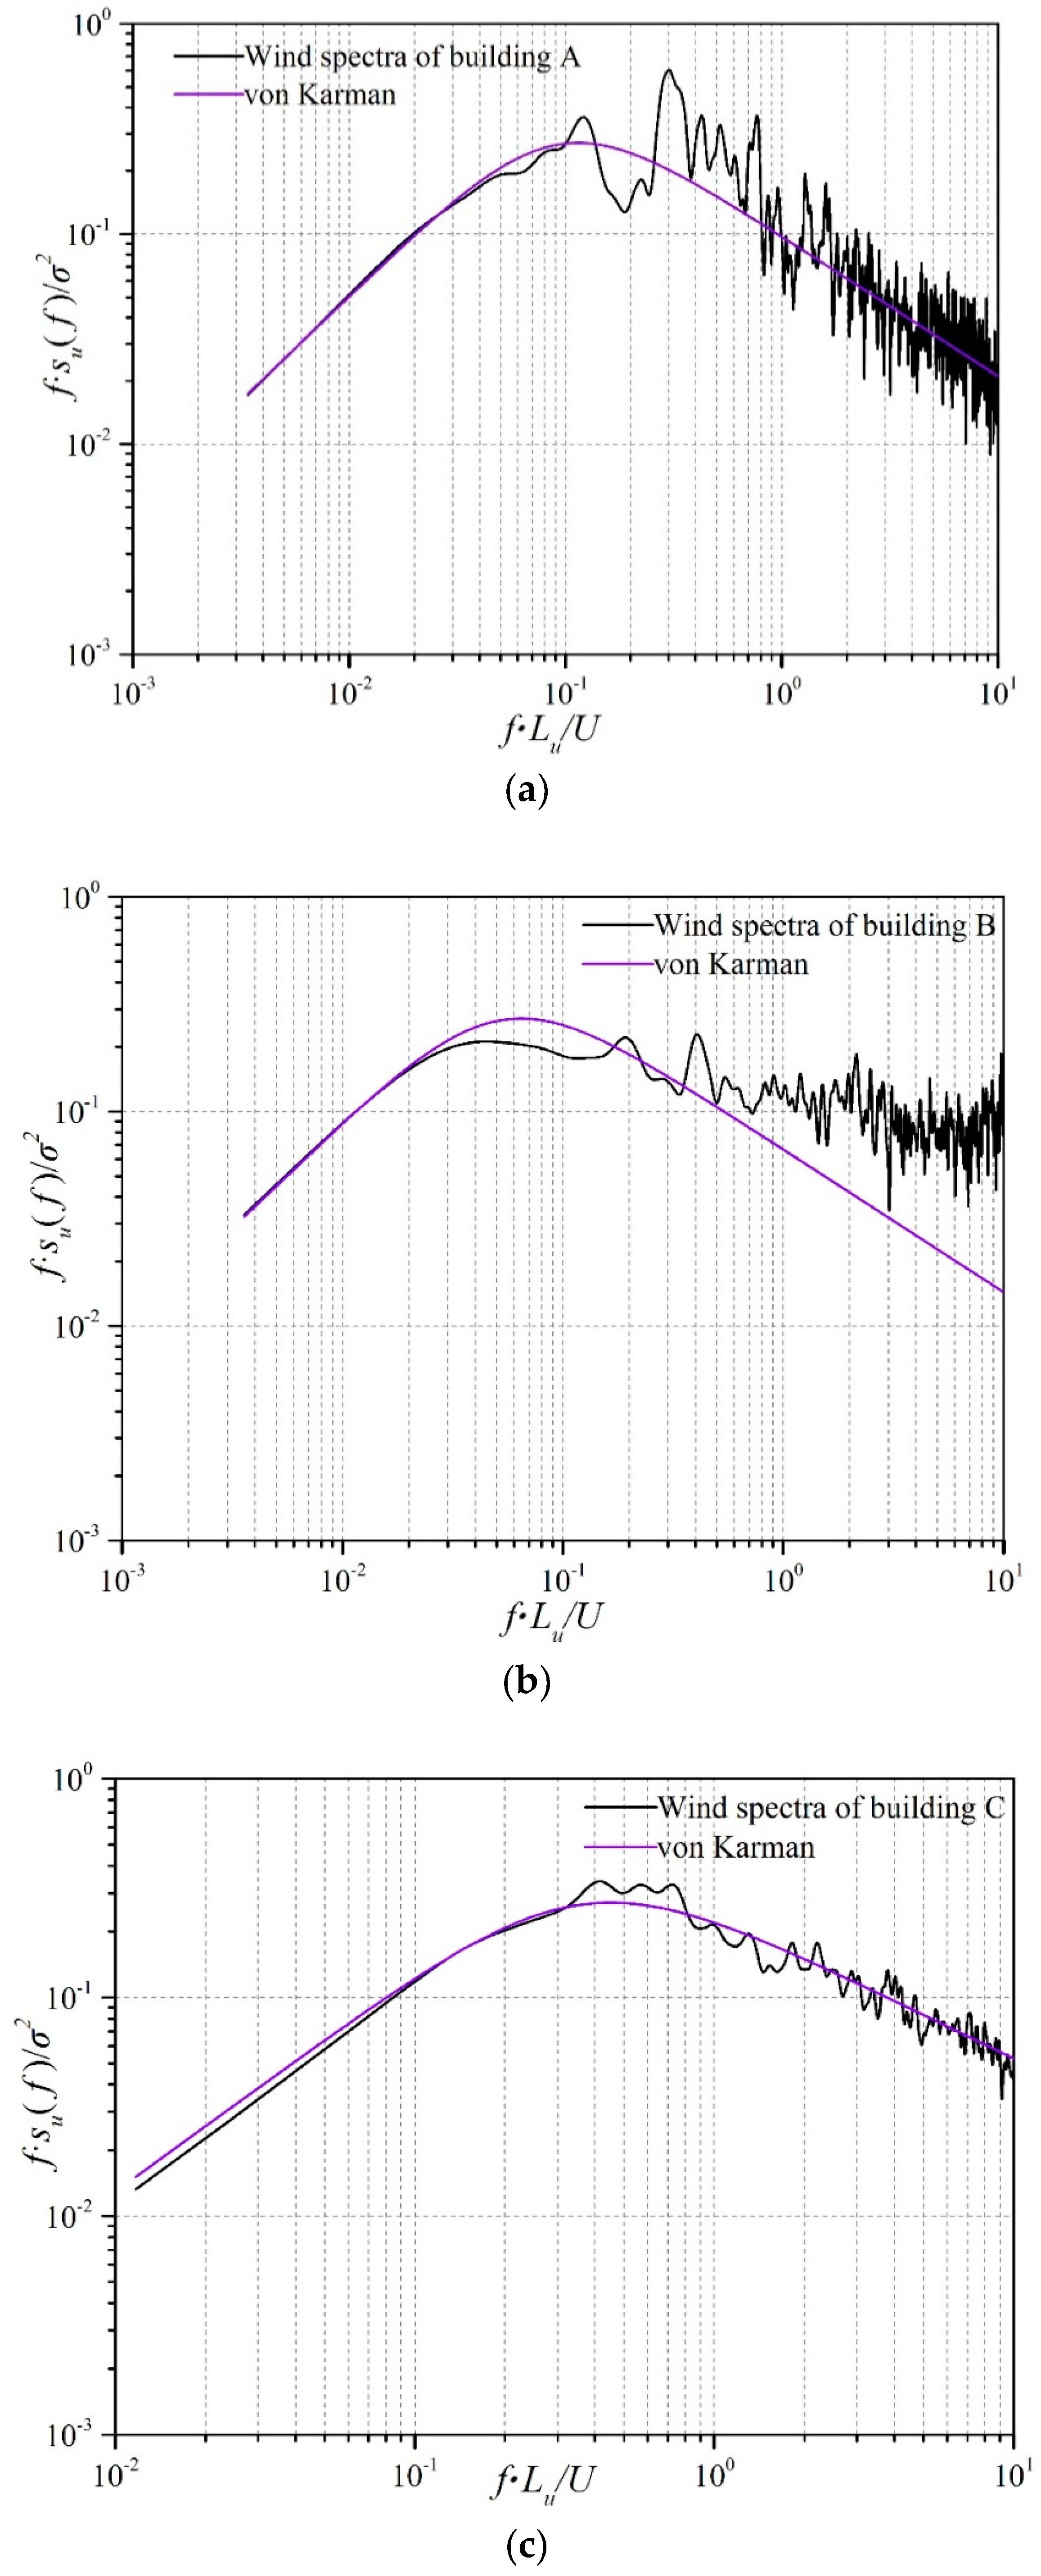
5.3. Wind Speed Spectrum

Successive measured data at the same time with U ≥ 10 m/s are given in Figure 4 to plot the fluctuating wind speed spectrum. In this study, a Welch power spectrum estimation method is adopted for the analysis. The longitudinal wind speed spectrum of the three high-rises is shown in Figure 16. The x-axis coordinate indicates the reference frequency (fz/u), and the y-coordinate indicates the normalized fluctuating wind speed spectrum. The spectrum is compared with the von Karman fluctuating wind speed spectrum. The results show that the fluctuating wind speed spectra of buildings A and C in the along-wind direction effectively fitted the von Karman model. The fluctuating wind speed spectrum of building B in the along-wind direction is higher than that of the von Karman model when the reference frequency is larger than 0.2. This phenomenon results from the interference of building B being located between building A and C. This finding will be discussed in subsequent studies.

5.4. Relativity of Wind Turbulence

The relativity of wind speed at two spatial points may be described with the spatial correlation coefficient. In this study, spatial correlation coefficient ρ x A x B and coherence function Coh x A x B ( n ) on the roofs of high-rises A and B are investigated and defined as follows:
ρ x A x B = E [ x A x B ] E [ x A x A ] E [ x B x B ]
where, x can be substituted by two corresponding fluctuating speed components u, v and E [ ] is the calculation symbol of the average.
With the mean wind speed on the roof of building A as a reference, the relations between building A and B in the spatial correlation coefficient for wind speed and mean wind speed are shown in Figure 17. The spatial correlation coefficient for the fluctuating wind speed in the along-wind direction increased with the mean wind speed. The data within the upper and lower boundaries in the graph are fitted in linearly, the spatial correlation coefficient for the fluctuating wind speed in the across-wind direction hardly changed with the mean wind speed, and the linearly-fitted slope approached zero. The correlation coefficient for the wind speed in the along-wind direction depended on the wind speed, and the higher the wind speed is, the greater the correlation coefficient is. However, the correlation coefficient in the across-wind direction was basically irrelevant to the wind speed, and the mean value of the spatial correlation coefficient for the wind speed on the roofs of building A and B in the across-wind direction is approximately 0.10.

6. Conclusions

The wind fields characteristics on the roofs of three adjacent buildings were measured during Typhoon Meranti on the east coast of Xiamen, China to analyze the fluctuating features of the selected strong wind data in detail and investigate the relations among the high-rises in wind speed. The conclusions of this study are summarized as follows:
(1) The three high-rise buildings have similar mean values of measured mean wind speed and direction, which enabled a comparison of the wind characteristics. The maximum mean wind speeds on the roofs of the buildings are 27.2, 15.6, and 28.9 m/s, respectively.
(2) The analysis period was divided into two parts. The characteristics of the winds were investigated separately of part one for the three sites (A, B, C) and part two for two sites (A, C). Reasonable results of turbulence intensity and gust factor were obtained based on the statistics of sampling with mean wind speed higher than 10 m/s. When U ≥ 10m/s of the synchronously recorded of buildings A, B, and C, the turbulence intensity of the three buildings changed by the same law and decreased with the increase of mean wind speed. When buildings A and C were synchronously recorded, the wind direction angle slowly changed from 55° to 20°, and the wind speed slowly increased. Meanwhile, the law of building A is completely different from building C because of a super high-rise building situated north of building A. This imposed an interference effect on the upstream building, which will be considered in the next work through a wind tunnel test. The turbulence intensity on the roof of three high-rises in the along-wind direction are between 17.7% and 30.8% and greater than the terrain as specified in a relevant Chinese load (GB50009-2012) changing from Class A to D. This result can be explained by the interference in the building cluster. The mean longitudinal and lateral gust factors for building A were 1.428 and 0.356, 1.485 and 0.351 for building B, and 1.319 and 0.225 for building C. The along-wind turbulent integral scale distribution area of building A is (115 m, 636 m), building B is (10 m, 524 m), and building C is (102 m, 403 m). The measured values of buildings A and C were consistent with the values estimated by ASCE-7 and AIJ-2004. When the plane size of the buildings is similar, aerodynamic interference occurs between buildings, and the plane size of the three buildings are the same. Building B is between two buildings which explains its small turbulence integral scale.
(3) The relations between gust factor and turbulence intensity were investigated. The gust factor increases with increasing turbulence intensity. The relations are fitted by using two methods, and small differences are observed. The parameters for the linear fitting method are simple and easy to compare with other results. In addition, the variations in turbulence intensity and gust factor with gust duration were evaluated. The fitting parameters ku and kv, recommended as 0.356 and 0.342, are mainly affected by short-term wind fluctuation.
(4) The wind spectrum of two high-rises is plotted and compared with the von Karman model. The wind spectrum in the longitudinal direction agrees with the von Karman model.
(5) The spatial correlation in wind speed between buildings A and B is evaluated. Wind speed remarkably affected the spatial correlation coefficient for longitudinal fluctuating wind speed. The spatial correlation coefficient for fluctuating wind speed in the across-wind direction hardly changes with increasing mean wind speed.

Author Contributions

C.W. conceived, designed, collected and analyzed data, wrote and revised the paper; Z.L. finalized the manuscript and provided the funding; Q.L. and L.H. contributed in the results and discussions and solution; Z.Z contributed to the English; J.H. and X.Z. collected and analyzed data.

Funding

This work is financially supported by the National Natural Science Foundation of China with Grant No. 51478179 and No. 51678233.

Conflicts of Interest

The authors declare no conflict of interest.

References

  1. Cao, S.; Tamura, Y.; Kikuchi, N. Wind characteristics of a strong typhoon. J. Wind Eng. Ind. Aerodyn. 2009, 1, 11–21. [Google Scholar] [CrossRef]
  2. Quan, Y.; Yao, B.; Gu, M. Research Progress of Wind Reliability of High-rise Buildings. J. Tongji Univ. (Nat. Sci.) 2015, 6, 807–815. [Google Scholar] [CrossRef]
  3. Davenport, A.G. The spectrum of horizontal gustiness near the ground in high winds. Q. J. R. Meteorol. Soc. 1961, 87, 194–211. [Google Scholar] [CrossRef]
  4. Davenport, A.G. The relationship of reliability to wind loading. J. Wind Eng. Ind. Aerodyn. 1983, 13, 3–27. [Google Scholar] [CrossRef]
  5. Jackson, P.S. Wind structure near a city centre. Bound.-Layer Meteorol. 1978, 15, 323–340. [Google Scholar] [CrossRef]
  6. Lösslein, H. The structure of turbulence during strong winds. J. Wind Eng. Ind. Aerodyn. 1988, 28, 41–49. [Google Scholar] [CrossRef]
  7. Bowen, A.J. Full scale measurements of the atmospheric turbulence over two escarpments. Wind Eng. 1980, 1, 161–172. [Google Scholar] [CrossRef]
  8. Kato, N.; Ohkuma, T.; Kim, J.R.; Marukawa, H.; Niihori, Y. Full scale measurements of wind velocity in two urban areas using an ultrasonic anemometer. J. Wind Eng. Ind. Aerodyn. 1992, 41, 67–78. [Google Scholar] [CrossRef]
  9. Li, Q.S.; Xiao, Y.Q.; Wu, J.R.; Fu, J.Y.; Li, Z.N. Typhoon effects on super-tall buildings. J. Sound Vib. 2008, 3, 581–602. [Google Scholar] [CrossRef]
  10. Fu, J.Y.; Li, Q.S.; Wu, J.R.; Xiao, Y.Q.; Song, L.L. Field measurements of boundary layer wind characteristics and wind-induced responses of super-tall buildings. J. Wind Eng. Ind. Aerodyn. 2008, 96, 1332–1358. [Google Scholar] [CrossRef]
  11. Gu, M.; Kuang, J.; Wei, X.; Xiong, L.J.; Quan, Y. Field meansurement of strong wind speed of normal climate on top of Shanghai World Financial Center. J. Tongji Univ. (Nat. Sci.) 2011, 39, 1592–1597. [Google Scholar] [CrossRef]
  12. An, Y.; Quan, Y.; Gu, M. Turbulence characteristics analysis of typhoon “Muifa” near 500 m above ground in Lujiazui district of Shanghai. China Civ. Eng. J. 2013, 46, 21–27. [Google Scholar] [CrossRef]
  13. Mann, J.; Kristensen, L.; Courtney, M.S. The Great Belt Coherence Experiment: A Study of Atmospheric Turbulence Over Water; Riso National Laboratory for Sustainable Energy: Copenhagen, Denmark, 1991; pp. 51–60.
  14. Toriumi, R.; Katsuchi, H.; Furuya, N. A study on spatial correlation of natural wind. J. Wind Eng. Ind. Aerodyn. 2000, 2, 203–216. [Google Scholar] [CrossRef]
  15. Song, L.L.; Pang, J.B.; Jiang, C.L.; Huang, H.H.; Qin, P. Field measurement and analysis of turbulence coherence for typhoon Nuri at Macao Friendship Bridge. Sci. China Technol. Sci. 2010, 10, 2647–2657. [Google Scholar] [CrossRef]
  16. Xiang, H.F.; Ge, Y.J.; Zhu, L.D. Modern Theory and Practice on Bridge Wind Resistance, 1st ed.; China Communications Press: Beijing, China, 2005; pp. 82–105. [Google Scholar]
  17. Pang, J.B.; Ge, Y.J.; Lu, Y. Methods for Analysis of Turbulence Integral Length in Atmospheric Boundary-layer. J. Tongji Univ. (Nat. Sci.) 2002, 5, 622–626. [Google Scholar] [CrossRef]
  18. Glanville, M.J.; Kwok, K.C.S.; Denoon, R.O. Full-scale damping measurements of structures in Australia. J. Wind Eng. Ind. Aerodyn. 1996, 2–3, 349–364. [Google Scholar] [CrossRef]
  19. Khanduri, A.C.; Stathopoulos, T.; Bedard, C. Wind-induced interference effects on buildings-A review of the state-of-art. Eng. Struct. 1998, 7, 617–630. [Google Scholar] [CrossRef]
  20. Choi, E.C.C. Gradient height and velocity profile during typhoons. J. Wind Eng. Ind. Aerodyn. 1983, 13, 31–41. [Google Scholar] [CrossRef]
  21. Ishizaki, H. Wind profiles, turbulence intensities and gust factors for design in typhoon–prone regions. J. Wind Eng. Ind. Aerodyn. 1983, 13, 55–66. [Google Scholar] [CrossRef]
  22. He, X.; Qin, H.; Tao, T.; Liu, W.; Wang, H. Measurement of Non-Stationary Characteristics of a Landfall Typhoon at the Jiangyin Bridge Site. Sensors 2017, 17, 2186. [Google Scholar] [CrossRef]
  23. Gu, M.; Kuang, J.; Quan, Y.; Wei, X.; Xiong, L.J. Analysis of measured wind speed data on top of SWFC. J. Vib. Shock 2009, 28, 114–118. [Google Scholar] [CrossRef]
  24. Xu, A.; Fu, J.Y.; Zhao, R.H.; Wu, J.R. Field measurements of typhoon according to civil engineering research. Acta Aerodyn. Sin. 2010, 28, 23–31. [Google Scholar] [CrossRef]
  25. Li, Q.S.; Zhi, L.H.; Hu, F. Field Measurements of Strong Wind Characteristics Near Ground in Urban Area. J. Hunan Univ. (Nat. Sci.) 2009, 36, 8–12. [Google Scholar]
  26. Erich, H. Wind Turbines, Fundamentals, Technologies, Application. Economics, 3rd ed.; Springer: Heidelberg/Berlin, Germany, 2013; pp. 505–547. [Google Scholar]
  27. Durst, C.S. Wind speeds over short periods of time. Meteor. Mag. 1960, 89, 181–186. [Google Scholar]
  28. Krayer, W.R.; Marshall, R.D. Gust factors applied to hurricane winds. Bull. Am. Meteorol. Soc. 1992, 73, 613–618. [Google Scholar] [CrossRef]
  29. Yu, B.; Chowdhury, A.G. Gust factors and turbulence intensities for the tropical cyclone environment. J. Appl. Meteorol. Clim. 2009, 48, 534–552. [Google Scholar] [CrossRef]
Figure 1. Satellite view of the measurement point and the building monitored. (a) Diagram of ground roughness in different directions. (b) Actual measurements of the building and its surrounding environment.
Applsci 09 00367 g001
Figure 2. Arrangement of the R.M. Young propeller anemometers. (a) Installation diagram and mast. (b) Layout plan of the building and wind direction.
Applsci 09 00367 g002
Figure 3. Path of Typhoon Meranti (2016) provided by the Regional Specialized Meteorological Center Tokyo. (a) The moving track during Typhoon Meranti; (b) The relationship between experimental site and typhoon.
Applsci 09 00367 g003
Figure 4. Sketch map of wind speeds and directions.
Applsci 09 00367 g004
Figure 5. Comparison of the three high-rises in terms of their mean wind speed and direction with a time interval of 10 min. (a) Mean wind speed in 10 min; (b) Mean wind direction in 10 min.
Applsci 09 00367 g005
Figure 6. Comparison of wind fields on the roofs of the three high-rises in terms of turbulence. (a) Longitudinal turbulence intensities; (b) Lateral turbulence intensities.
Applsci 09 00367 g006aApplsci 09 00367 g006b
Figure 7. Variation in turbulence intensities with 10 min mean wind speed. (a) Longitudinal turbulence intensities; (b) Lateral turbulence intensities.
Applsci 09 00367 g007
Figure 8. Variation in turbulence intensities with 10 min mean wind direction. (a) Longitudinal turbulence intensities; (b) Lateral turbulence intensities.
Applsci 09 00367 g008
Figure 9. Variation in gust factor with 10 min mean wind direction.
Applsci 09 00367 g009
Figure 10. Variation in gust factor with 10 min mean wind direction.
Applsci 09 00367 g010
Figure 11. Variation in turbulence integral length scales with 10 min mean wind speed. (a) Longitudinal turbulence intensities; (b) Lateral turbulence intensities.
Applsci 09 00367 g011
Figure 12. Variation in turbulence integral length scales with 10 min mean wind direction. (a) Longitudinal turbulence intensities; (b) Lateral turbulence intensities.
Applsci 09 00367 g012
Figure 13. (a,b) Turbulence intensity against gust factor: (a) and (b) are scatter plots and fitting results respective for the longitudinal and lateral direction.
Applsci 09 00367 g013
Figure 14. Comparison of the three high-rises with turbulence and gust factor varying with gust duration and wind speed. (a) Estimated values of S D u ( T , t ) ; (b) Estimated values of S D v ( T , t ) .
Applsci 09 00367 g014
Figure 15. Comparison of the three high-rises with turbulence and gust factor varying with gust duration and wind speed. (a) Estimated values of G u ( T , t ) , (b) Estimated values of G v ( T , t ) .
Applsci 09 00367 g015
Figure 16. Wind speed spectra of the three high-rises in the along-wind direction. (a) Building A; (b) Building B; (c) Building C.
Applsci 09 00367 g016
Figure 17. Relations between spatial correlation coefficients for wind speed on the roofs of high-rises A and B and mean wind speed. (a) Longitudinal spatial correlation coefficient; (b) Lateral spatial correlation coefficient.
Applsci 09 00367 g017
Table 1. Comparison of longitudinal turbulence intensity between Chinese load code for the design of building and field measurements.
PeriodsBuildingSamplesMean Longitudinal Turbulence IntensityClass D TerrainClass C TerrainClass B TerrainClass A Terrain
Three sitesBuilding A10930.4%17.3%12.6%9.3%8.6%
Building B10930.8%
Building C10919.4%
Two sitesBuilding A3720.3%
Building C3717.7%
Table 2. Mean gust factor of two periods.
PeriodsBuildingSamplesMean Longitudinal Gust FactorMean Lateral Gust Factor
Three sitesBuilding A651.640.44
Building B631.590.40
Building C591.350.24
Two sitesBuilding A371.420.35
Building C371.280.20
Table 3. Mean gust factor of two periods.
PeriodsBuildingSamplesMean Longitudinal Turbulence Integral Length Scales (m)Mean Lateral Turbulence Integral Length Scales (m)
Three sitesBuilding A65306130
Building B6316446
Building C5923149
Two sitesBuilding A37260149
Building C3722455
Table 4. Fitted parameters of the two equations.
BuildingEquation (1)Equation (2)
longitudinalAk1 = 0.333k2 = 1.851ku = 0.382
Bk1 = 0.349k2 = 1.978ku = 0.357
Ck1 = 0.380k2 = 2.087ku = 0.330
lateralAK3 = 0.258K4 = 1.711kv = 0.397
BK3 = 0.300K4 = 1.898kv = 0.348
CK3 = 0.200K4 = 1.814kv = 0.282

