Micro Particle Sizing Using Hilbert Transform Time Domain Signal Analysis Method in Self-Mixing Interferometry

 , and
, and 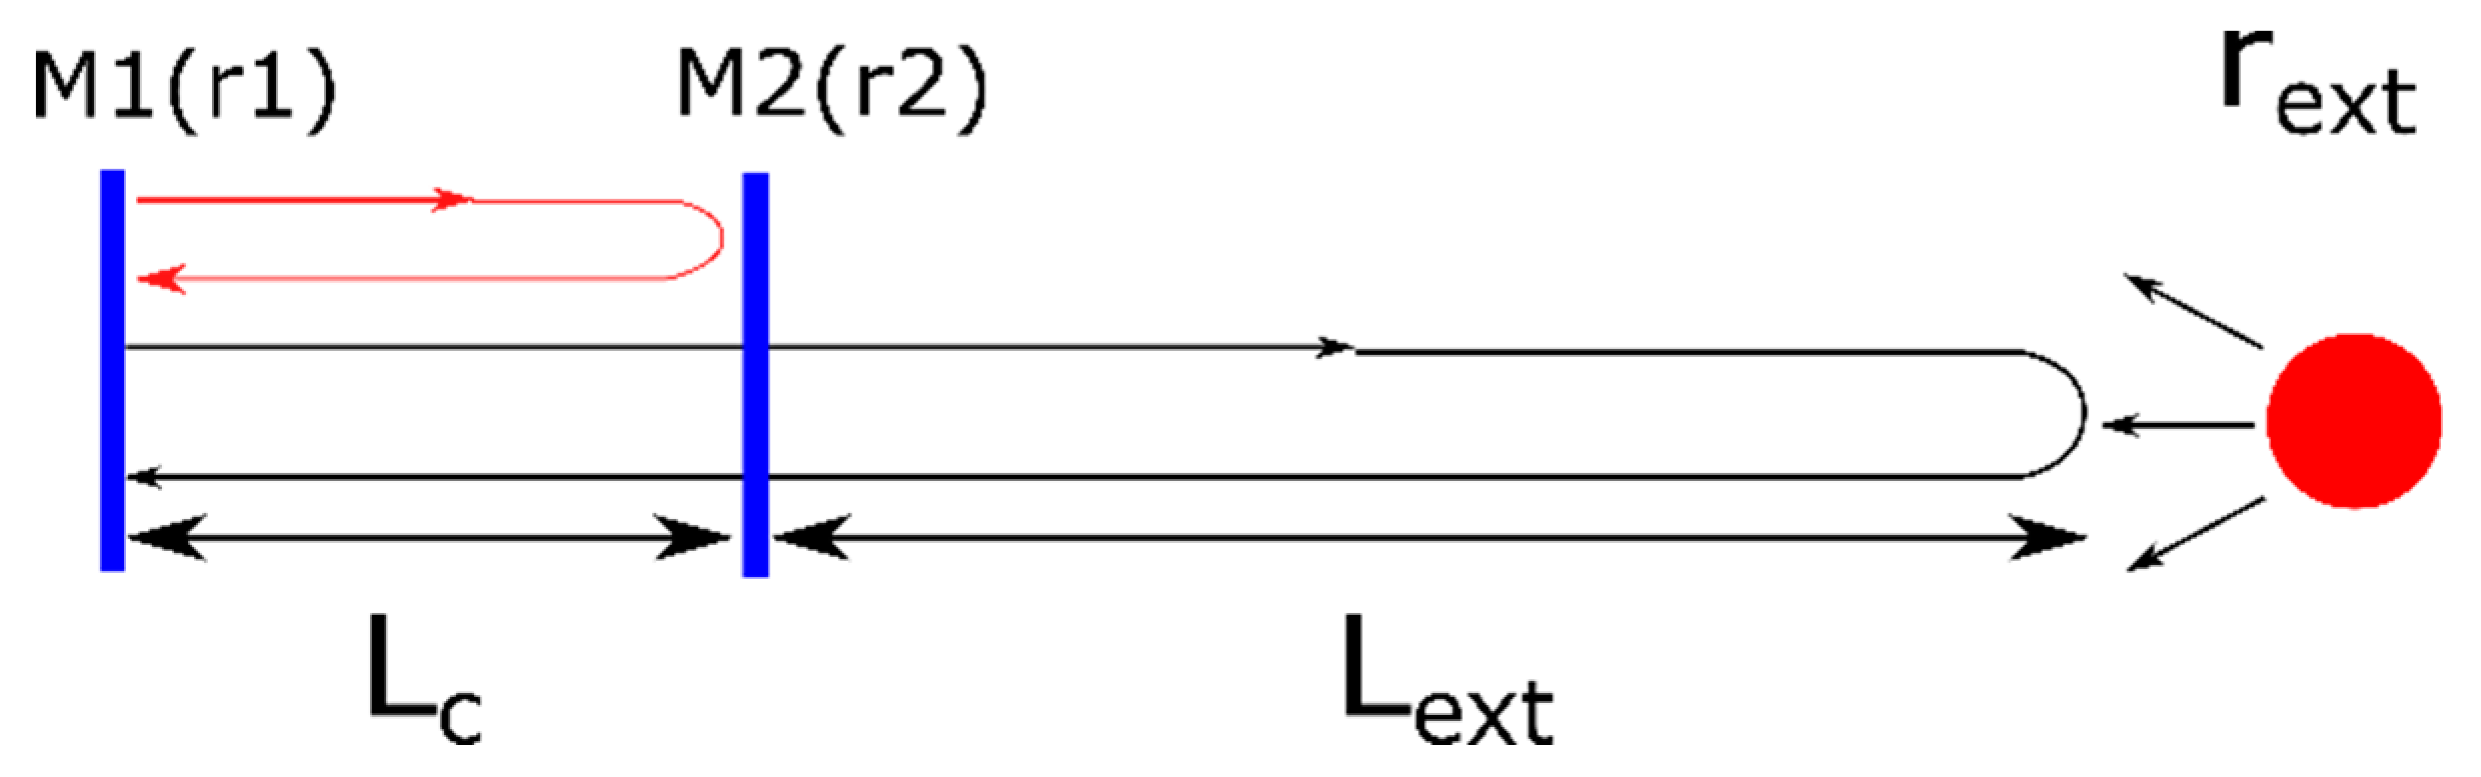
Abstract
1. Introduction
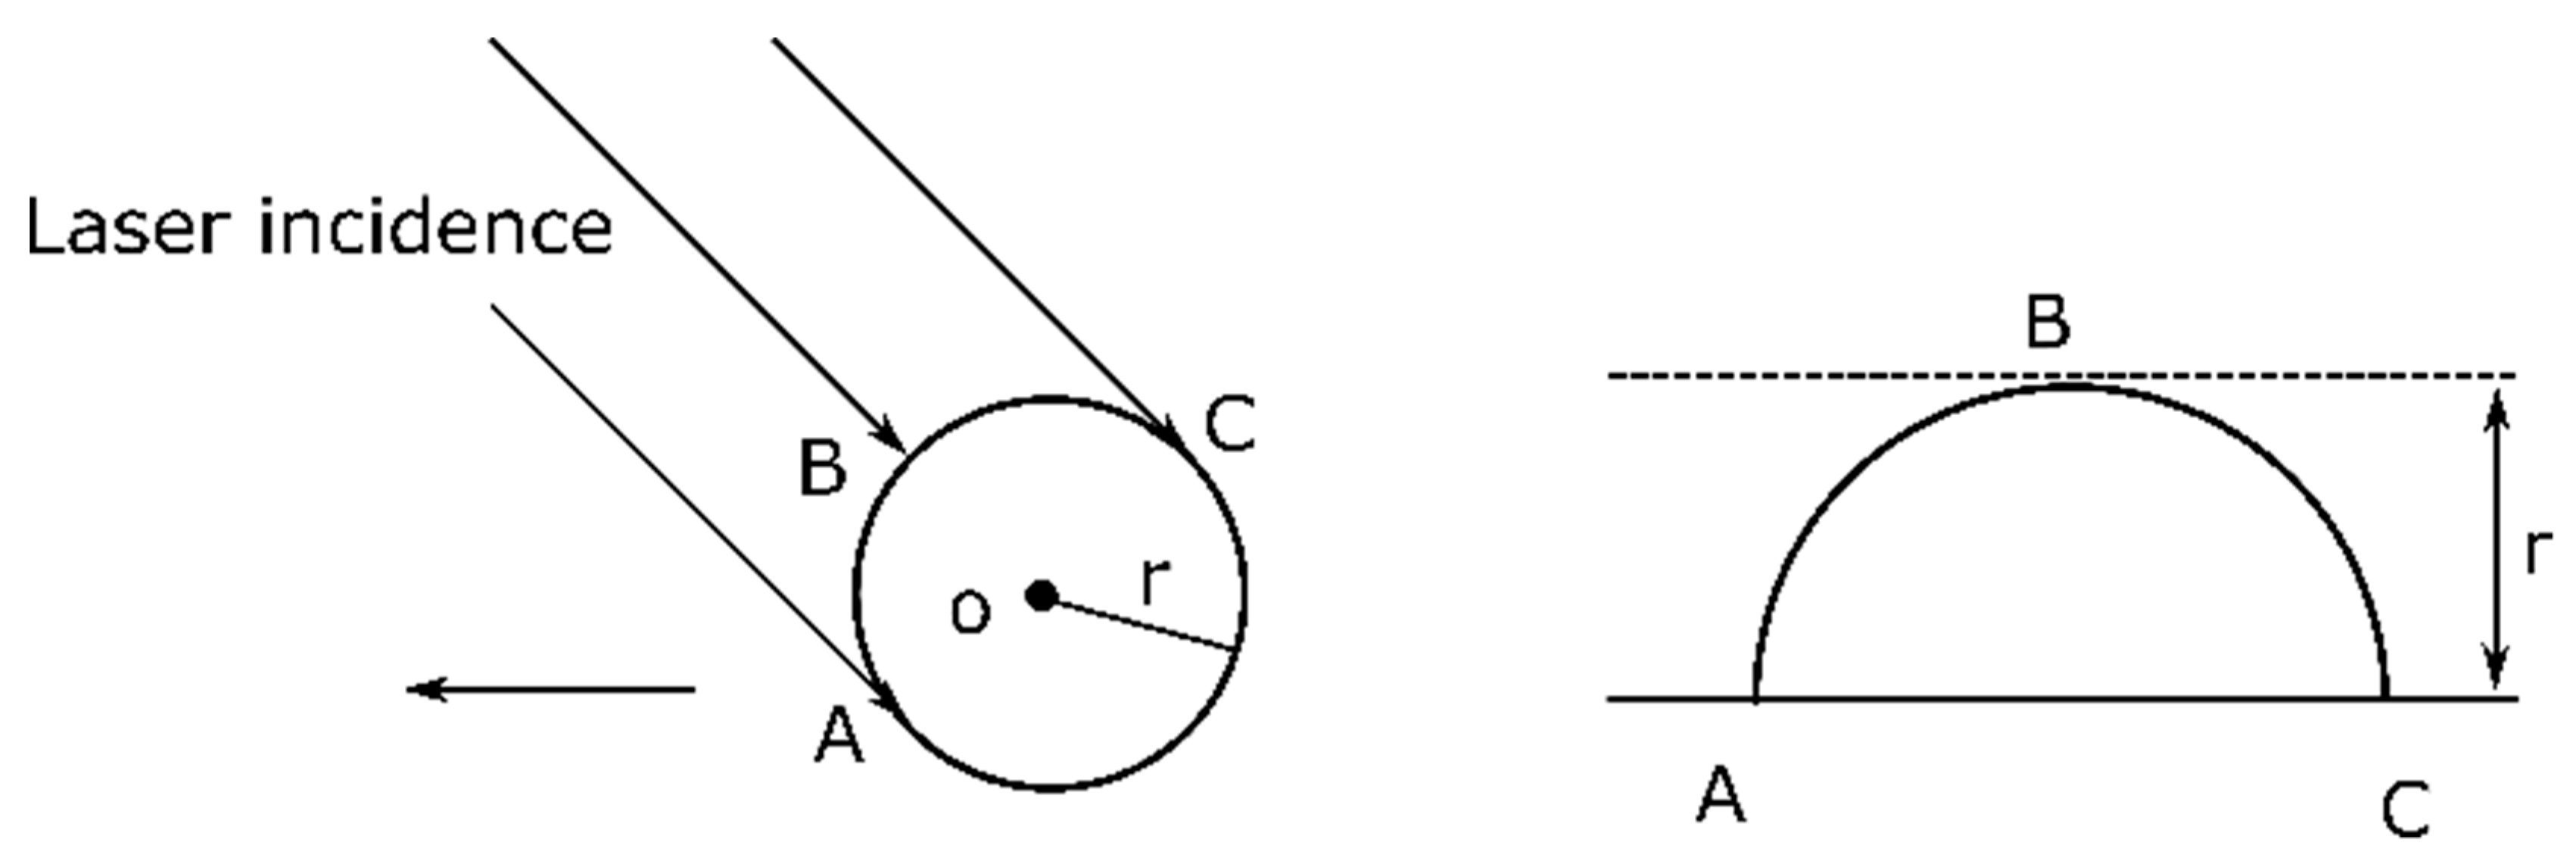
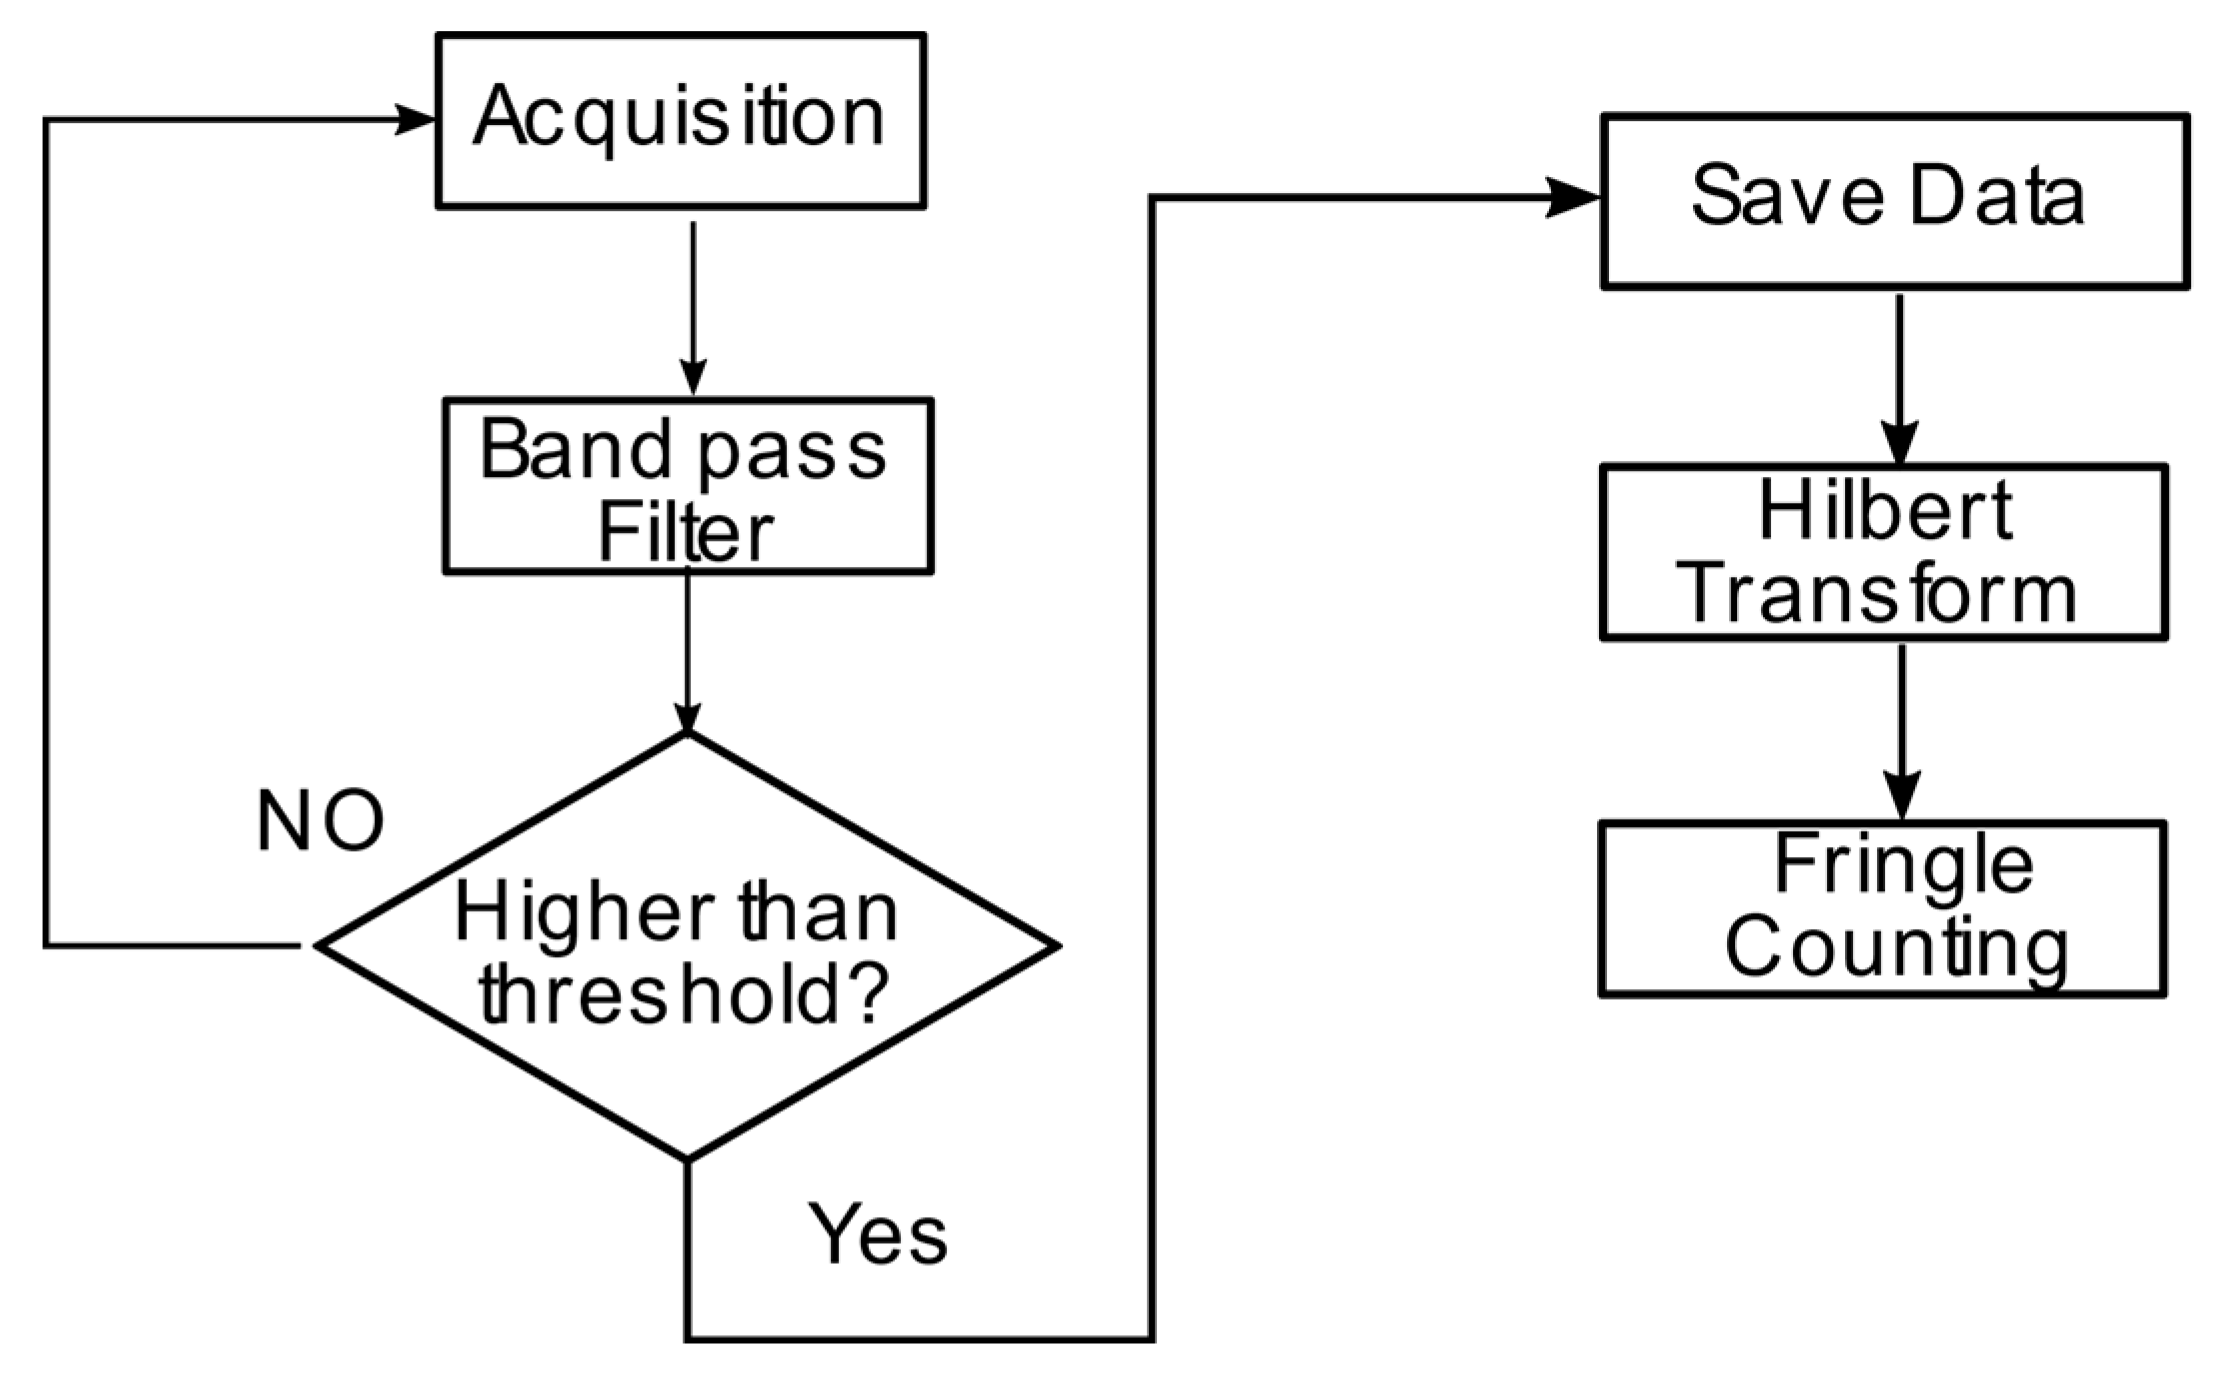
2. Theory
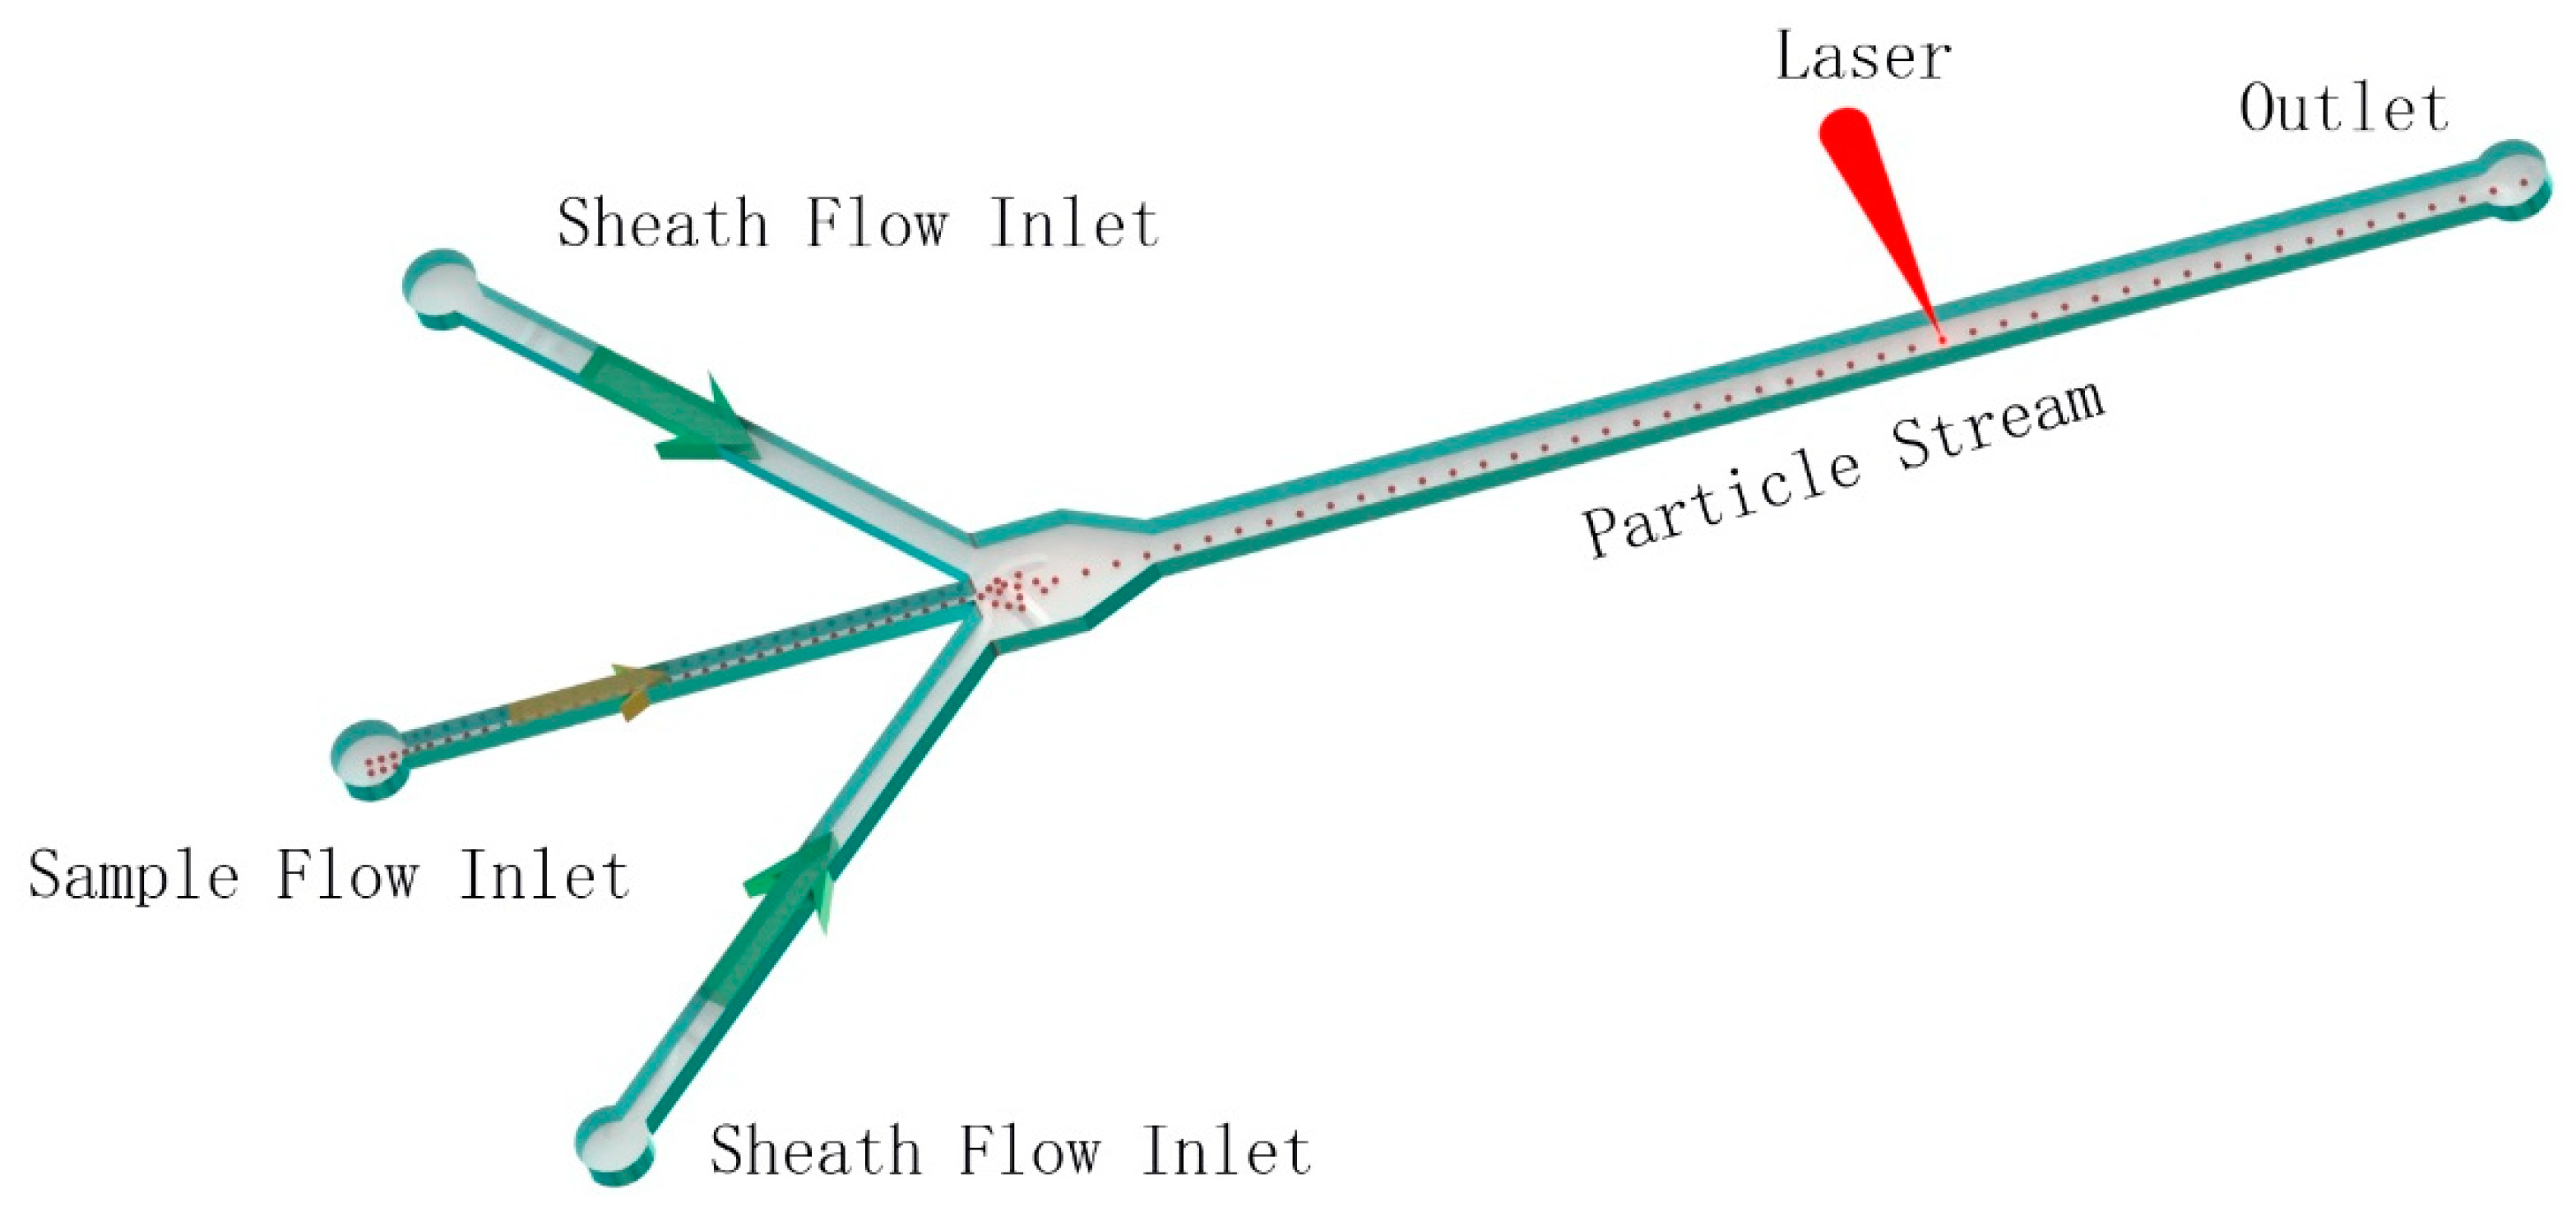
3. Experimental Study
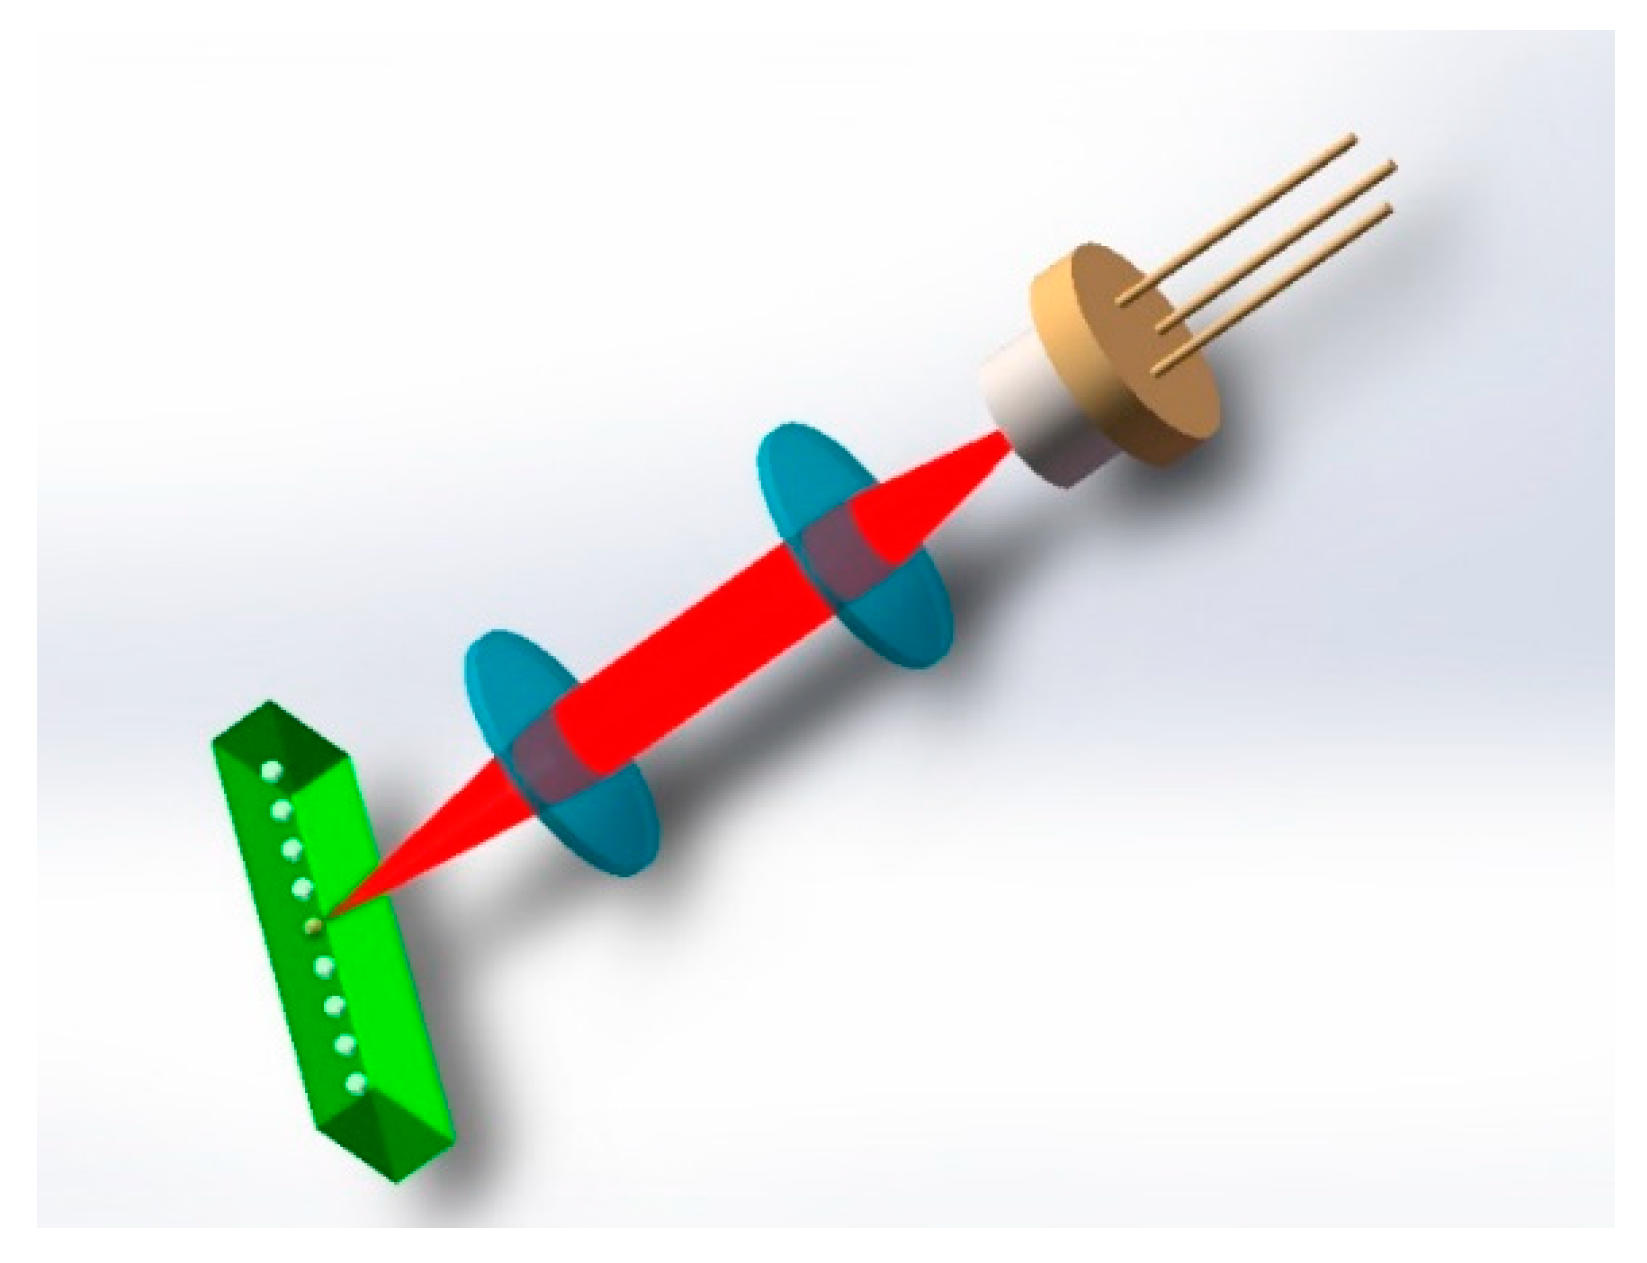
Experimental Setup
4. Results and Discussion
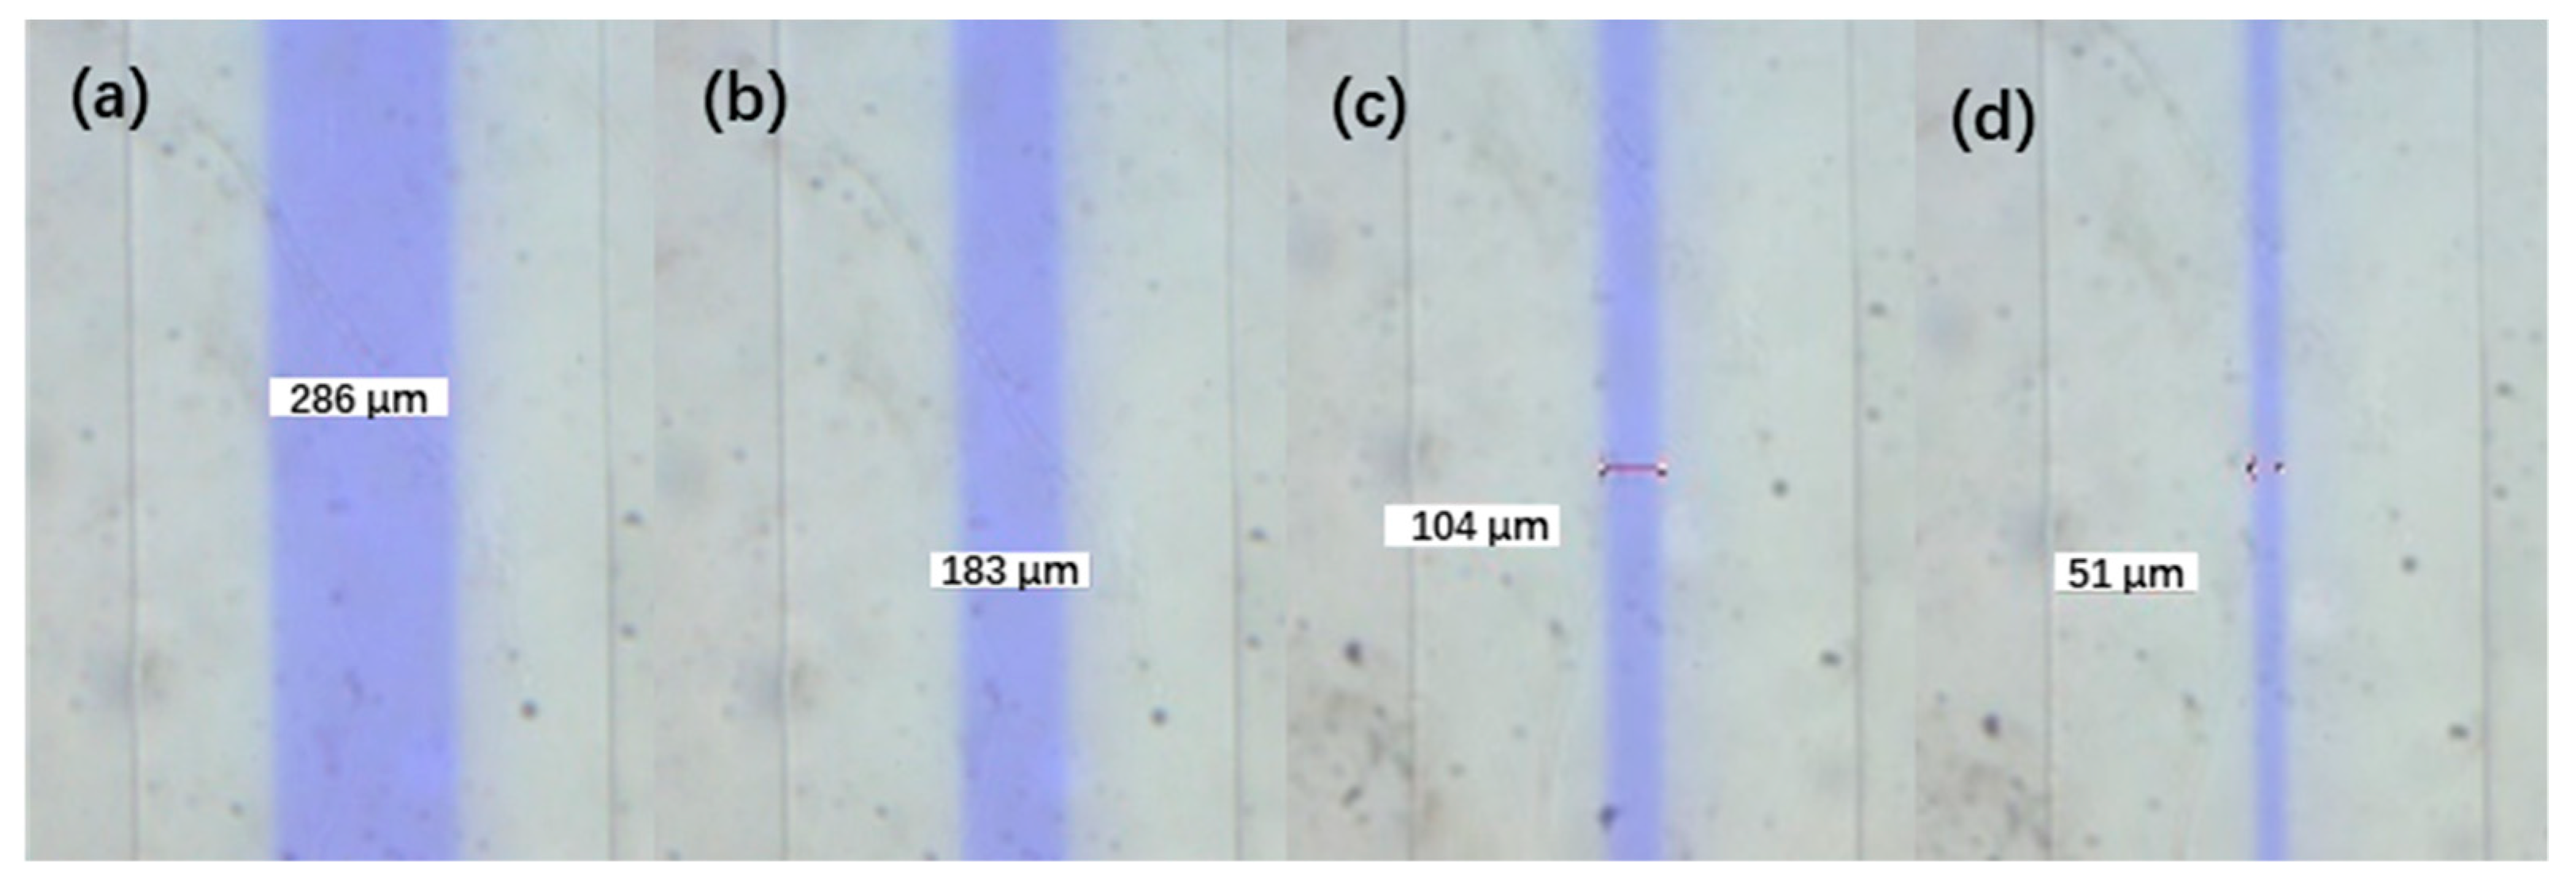
4.1. Hydrodynamic Focusing of Dye and Particle Streams
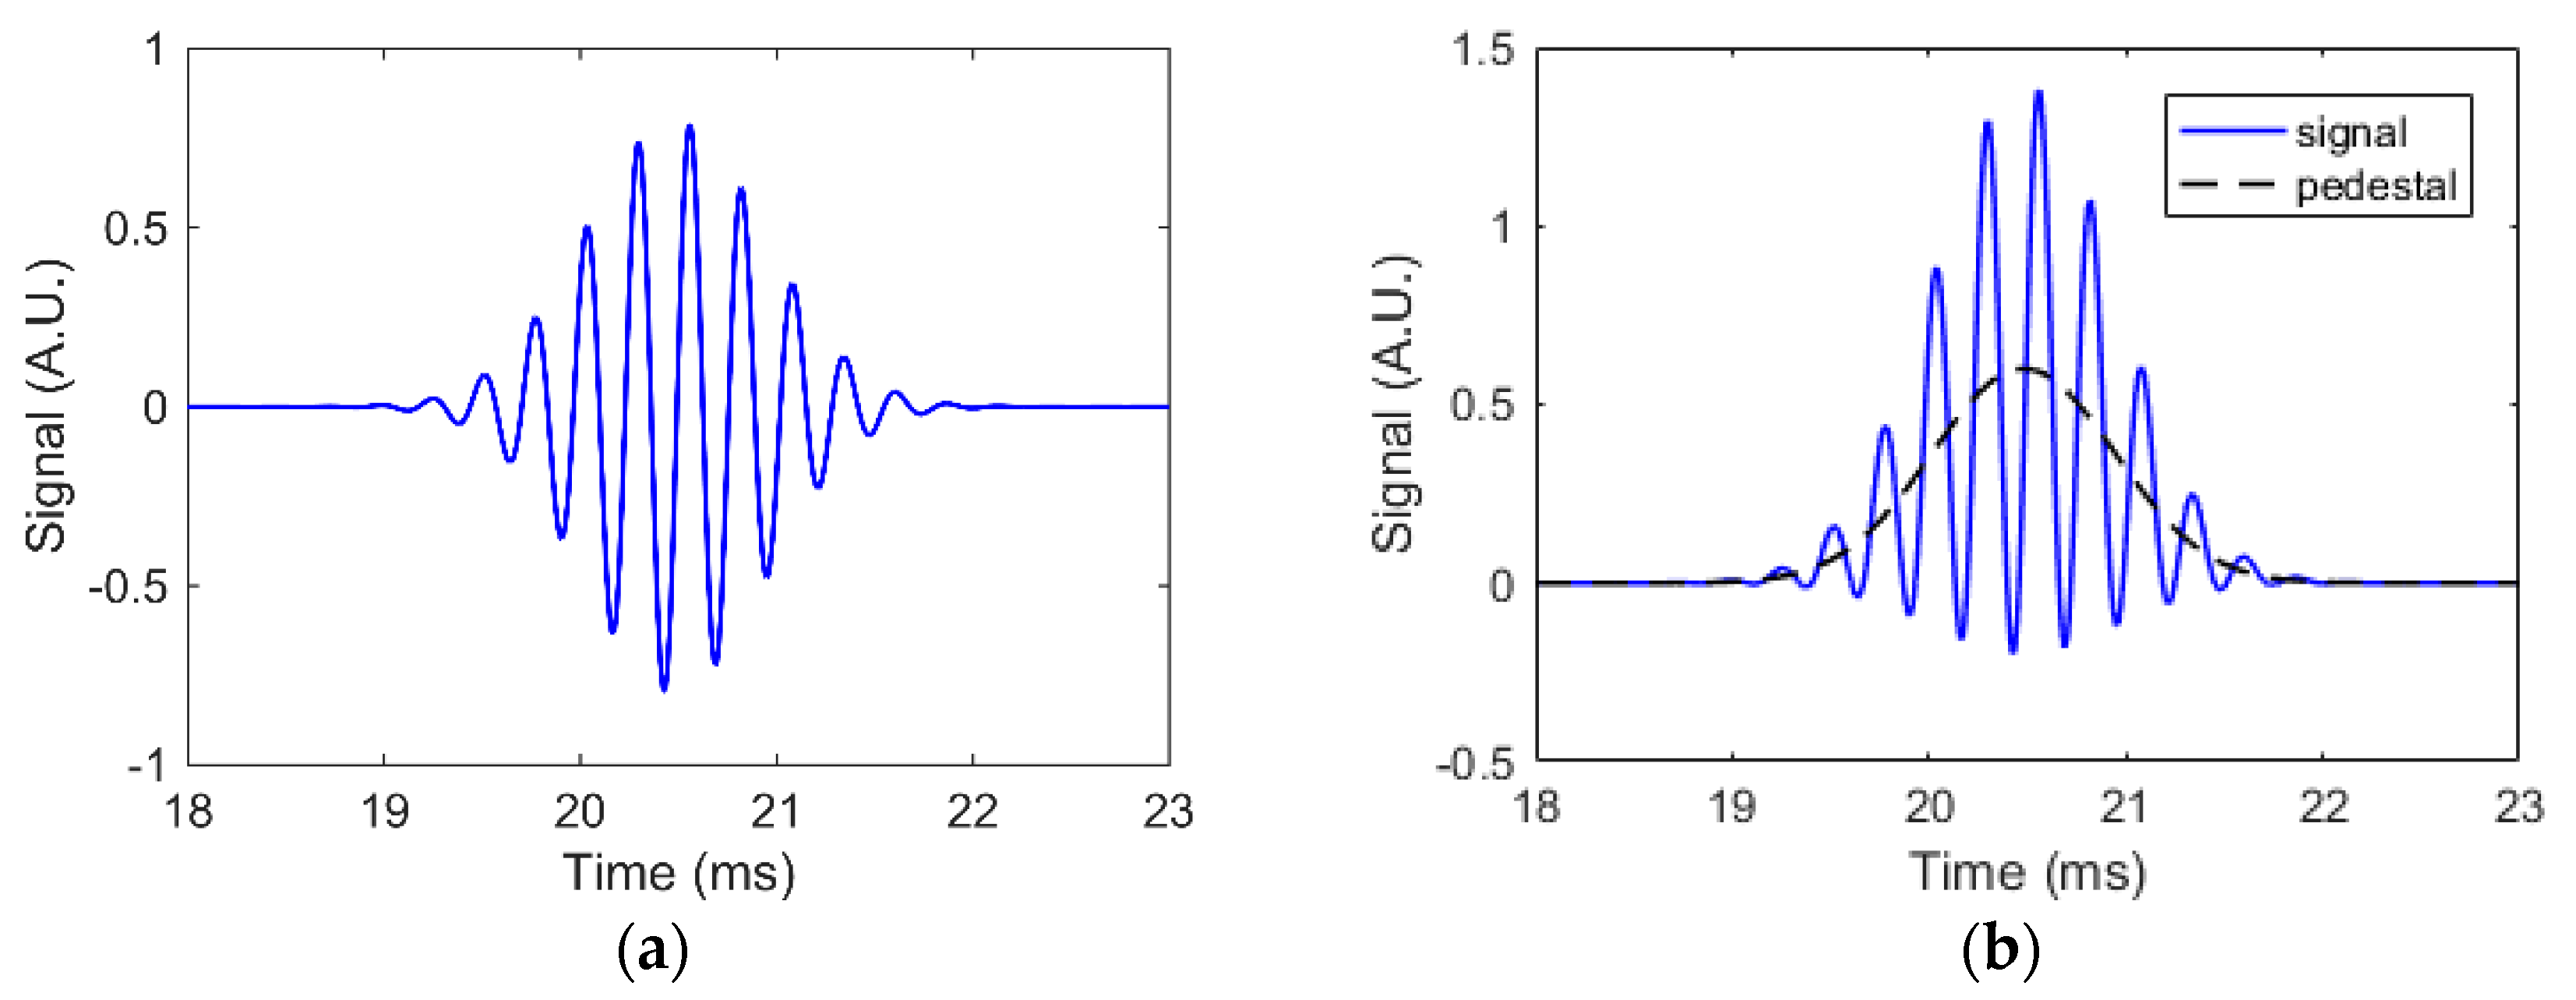
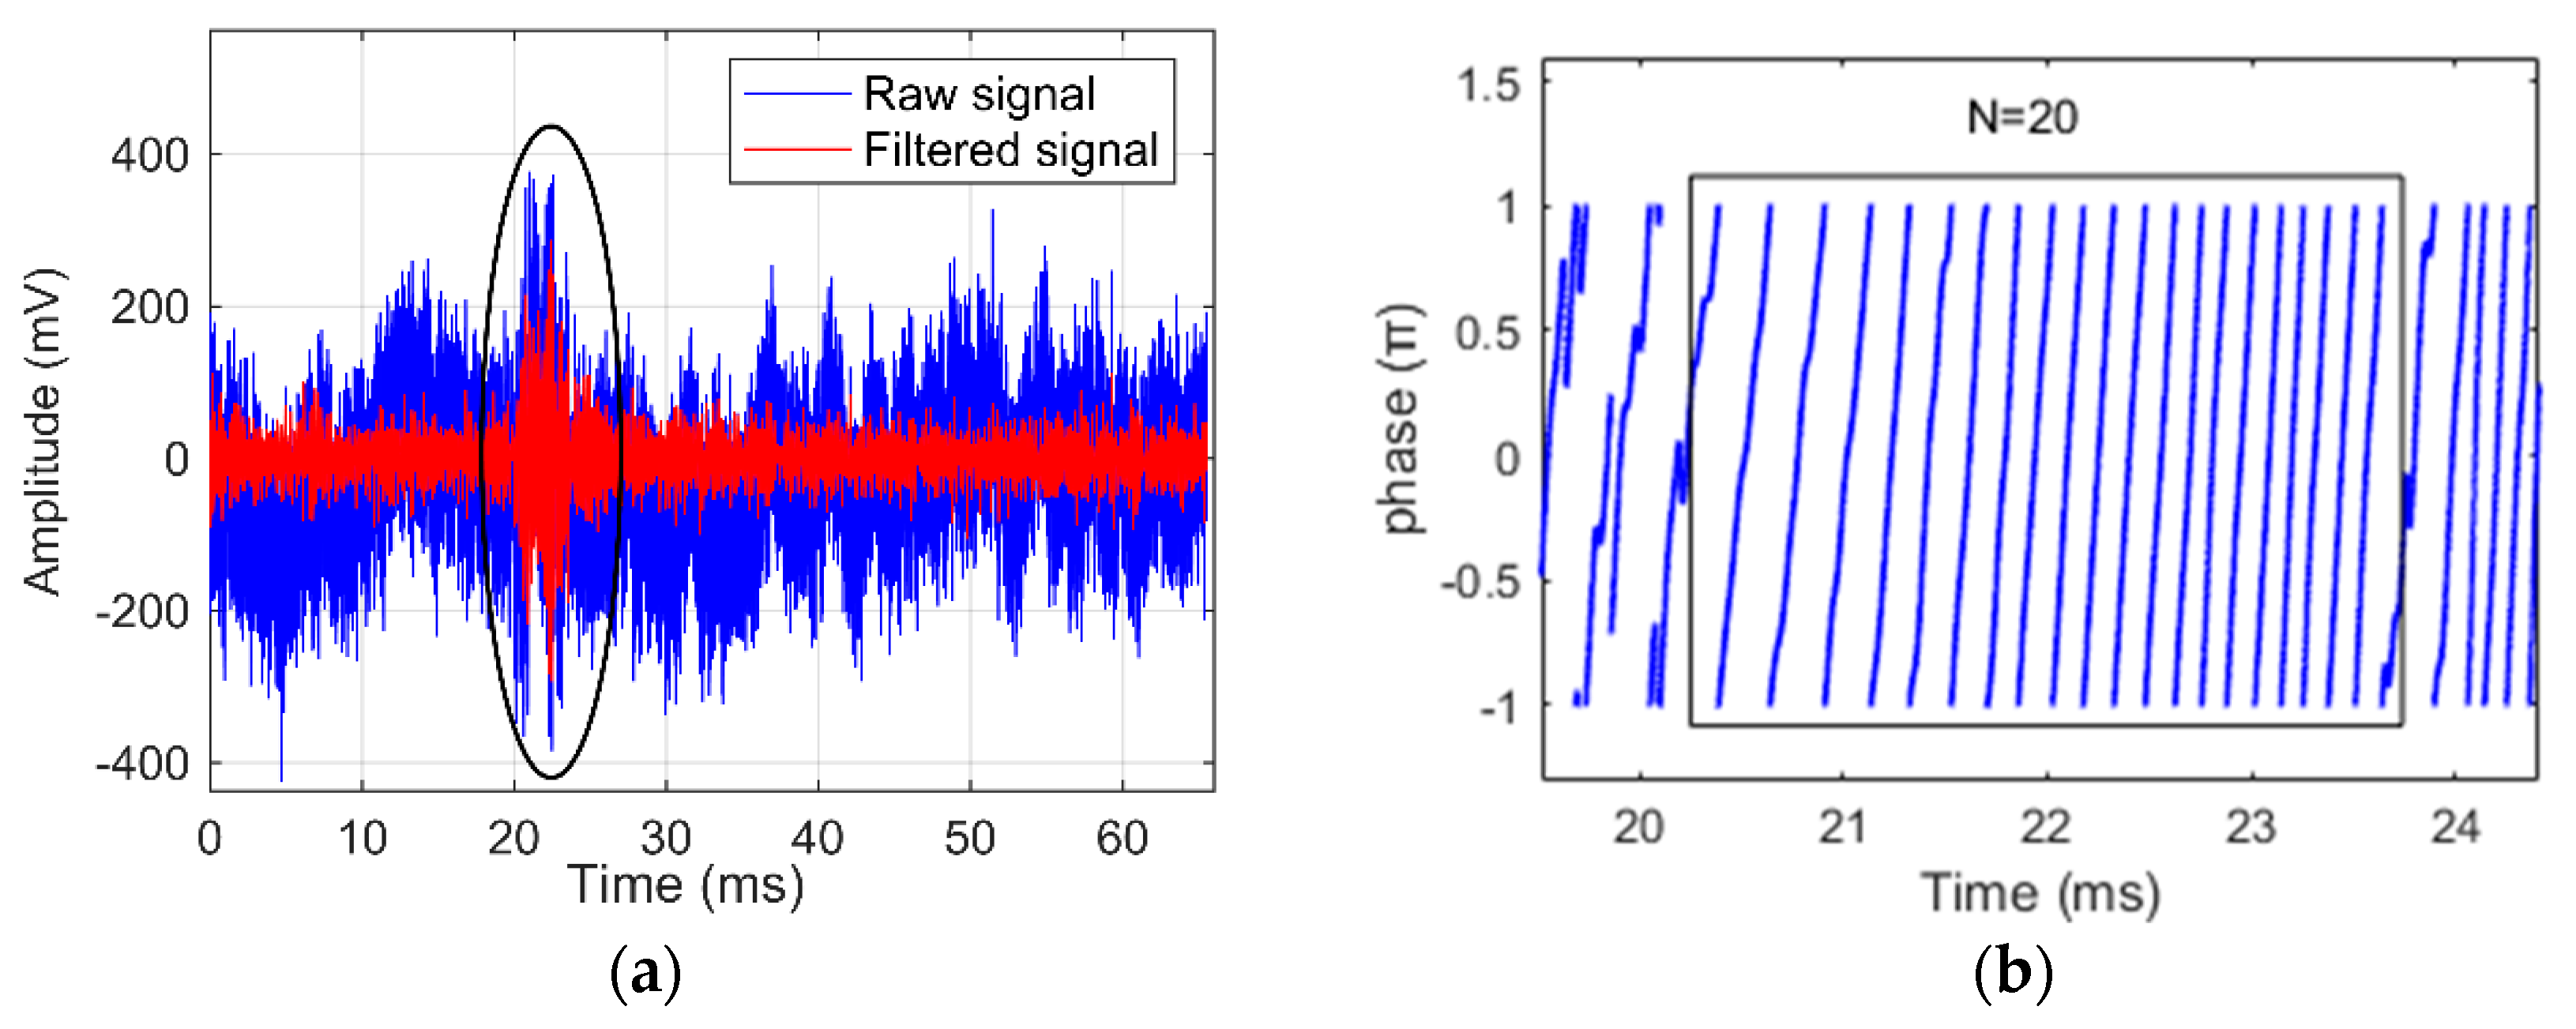
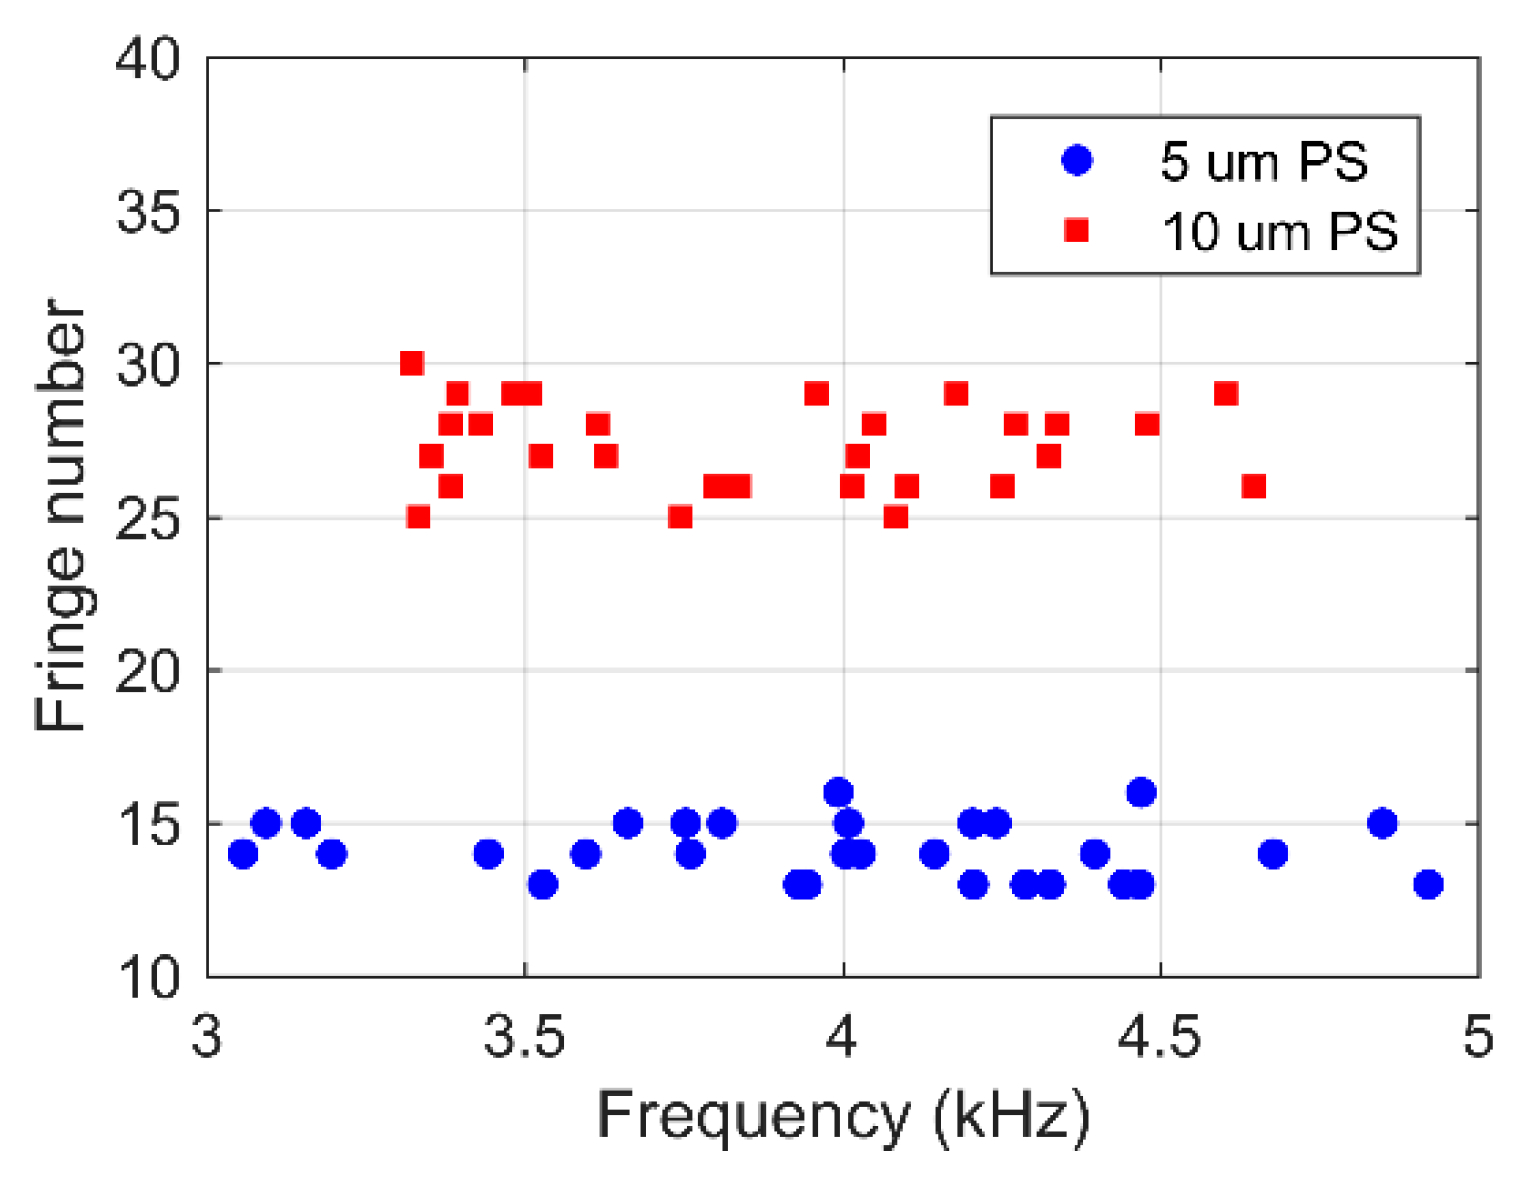
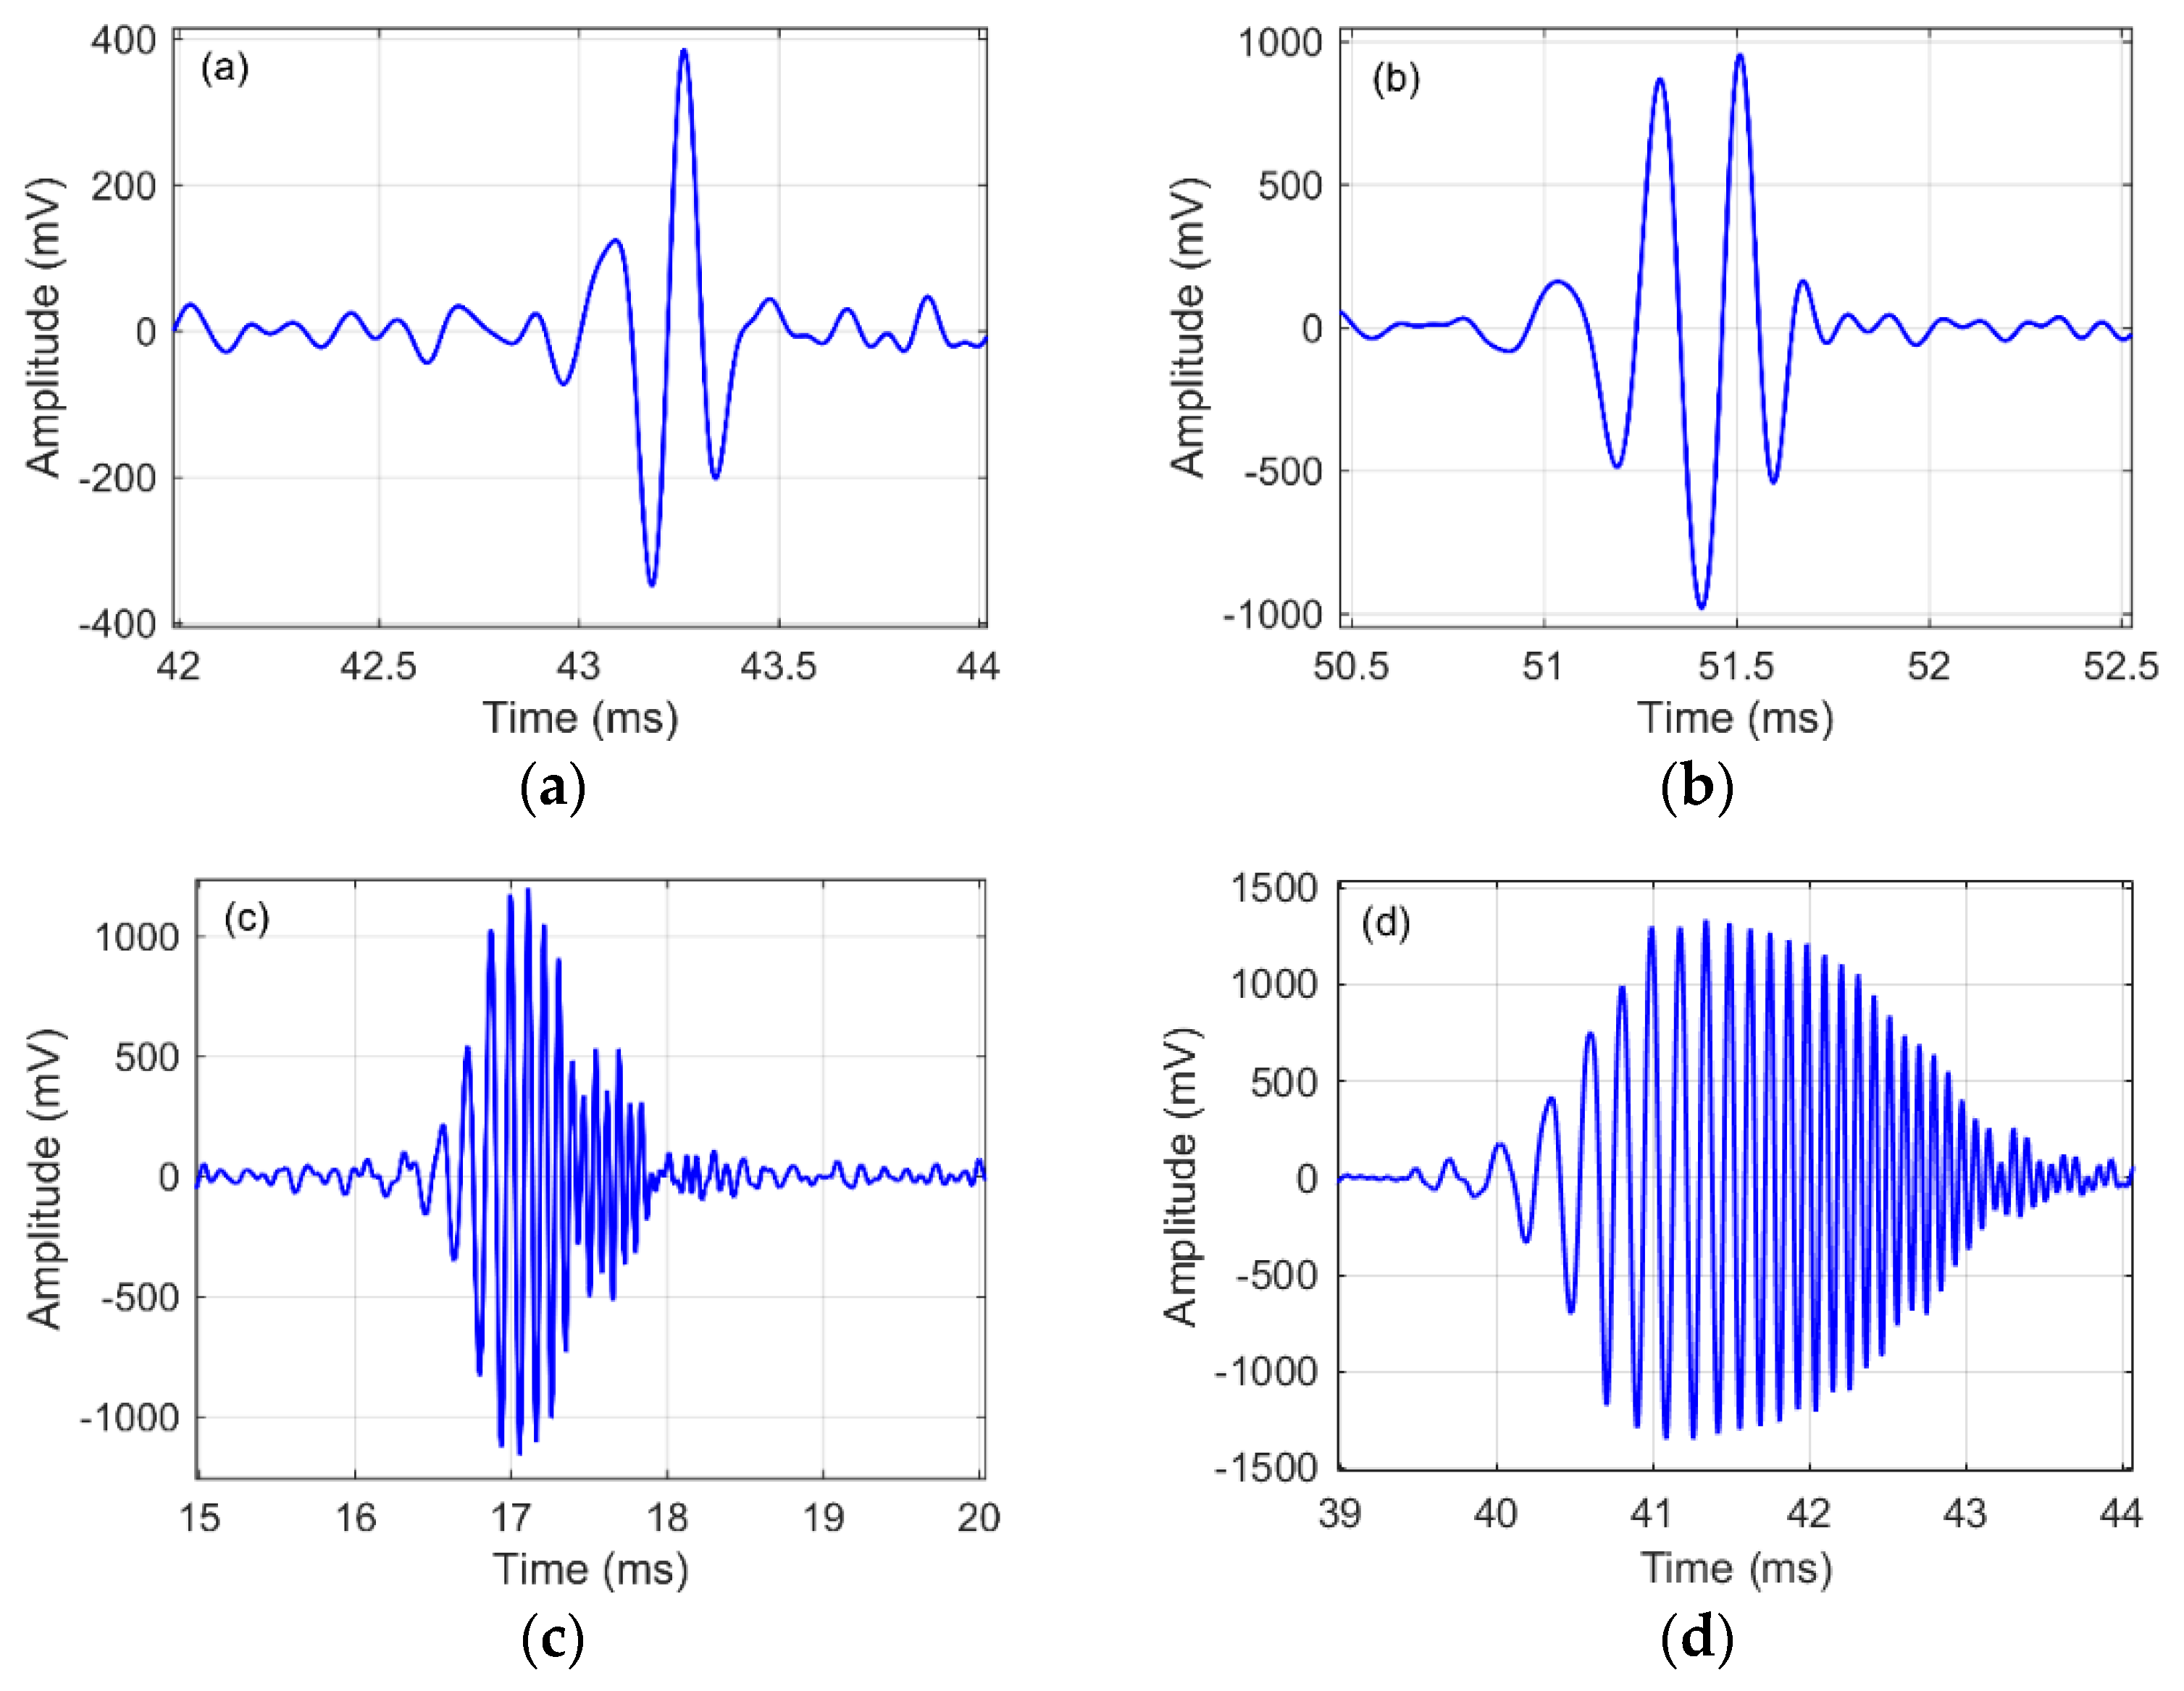
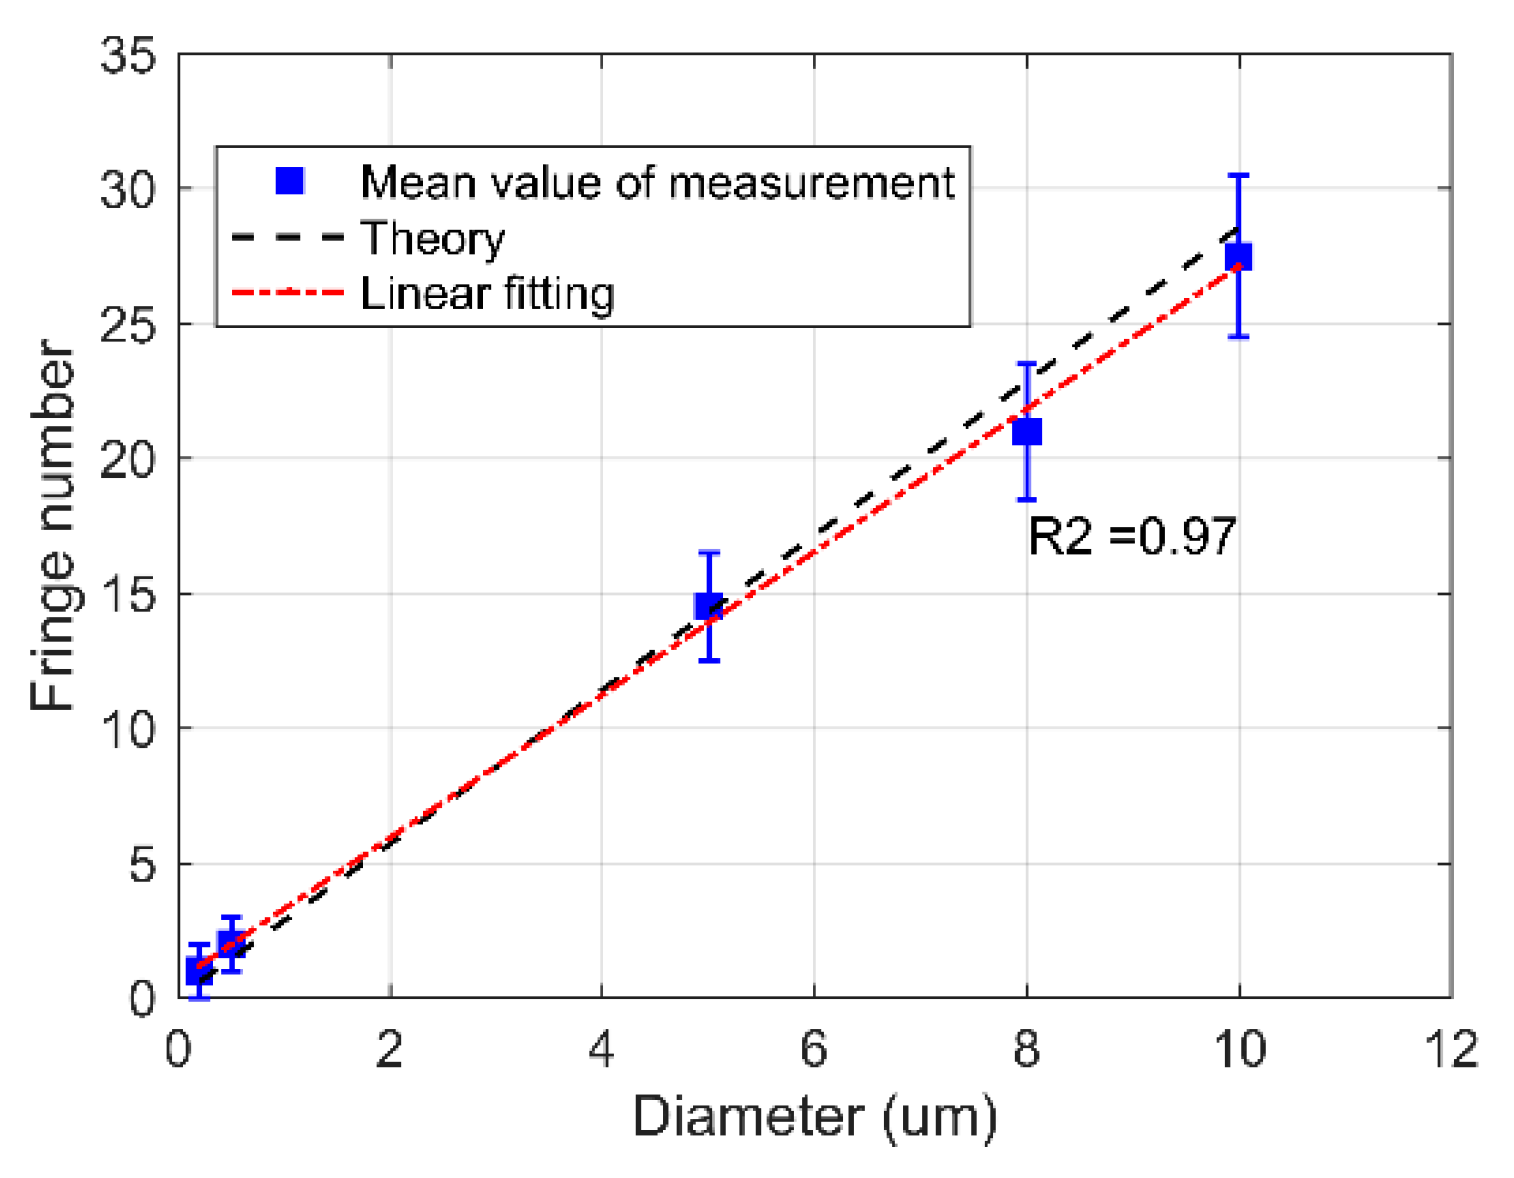
4.2. Single Particle Sizing Measurement
5. Conclusions
Author Contributions
Funding
Acknowledgments
Conflicts of Interest
References
- Zhao, Y.; Perchoux, J.; Campagnolo, L.; Camps, T.; Atashkhooei, R.; Bardinal, V. Optical feedback interferometry for microscale-flow sensing study: Numerical simulation and experimental validation. Opt. Express 2016, 24, 23849–23861. [Google Scholar] [CrossRef] [PubMed]
- Zhao, Y.; Camps, T.; Bardinal, V.; Perchoux, J. Optical Feedback Interferometry Based Microfluidic Sensing: Impact of Multi-Parameters on Doppler Spectral Properties. Appl. Sci. 2019, 9, 3903. [Google Scholar] [CrossRef]
- Norgia, M.; Pesatori, A.; Rovati, L. Self-mixing laser doppler spectra of extracorporeal blood flow: A theoretical and experimental study. IEEE Sens. J. 2012, 12, 552–557. [Google Scholar] [CrossRef]
- Campagnolo, L.; Nikolić, M.; Perchoux, J.; Lim, Y.L.; Bertling, K.; Loubiere, K.; Prat, L.; Rakić, A.D.; Bosch, T. Flow profile measurement in microchannel using the optical feedback interferometry sensing technique. Microfluid. Nanofluid. 2013, 14, 113–119. [Google Scholar] [CrossRef]
- Slot, M.; Koelink, M.H.; Scholten, F.G.; de Mul, F.F.; Weijers, A.L.; Greve, J.; Graaff, R.; Dassel, A.C.; Aarnoudse, J.G.; Tuynman, F.H. Blood flow velocity measurements based on the self-mixing effect in a fibre-coupled semiconductor laser:in vivo and in vitro measurements. Med. Biol. Eng. Comput. 1992, 30, 441–446. [Google Scholar] [CrossRef]
- Zakian, C.; Dickinson, M.; King, T. Particle sizing and flow measurement using self-mixing interferometry with a laser diode. J. Opt. A Pure Appl. Opt. 2005, 7, S445–S452. [Google Scholar] [CrossRef]
- Zakian, C.; Dickinson, M.; King, T. Dynamic light scattering by using self-mixing interferometry with a laser diode. Appl. Opt. 2006, 45, 2240–2245. [Google Scholar] [CrossRef]
- Sudo, S.; Miyasaka, Y.; Otsuka, K.; Takahashi, Y.; Oishi, T.; Ko, J.Y. Quick and easy measurement of particle size of Brownian particles and plankton in water using a self-mixing laser. Opt. Express 2006, 14, 1044. [Google Scholar] [CrossRef]
- Sudo, S.; Miyasaka, Y.; Kamikariya, K.; Nemoto, K.; Otsuka, K. Microanalysis of Brownian particles and real-time nanometer vibrometry with a laser-diode-pumped self-mixing thin-slice solid-state laser. Jpn. J. Appl. Phys. Part 2 Lett. 2006, 45, L926. [Google Scholar] [CrossRef]
- Sudo, S.; Miyasaka, Y.; Nemoto, K.; Kamikariya, K.; Otsuka, K. Detection of small particles in fluid flow using a self-mixing laser. Opt. Express 2007, 15, 8135–8145. [Google Scholar] [CrossRef]
- Otsuka, K.; Ohtomo, T.; Makino, H.; Sudo, S.; Ko, J.Y. Net motion of an ensemble of many Brownian particles captured with a self-mixing laser. Appl. Phys. Lett. 2009, 94, 241117. [Google Scholar] [CrossRef]
- Ohtomo, T.; Sudo, S.; Otsuka, K. Three-channel three-dimensional self-mixing thin-slice solid-state laser-Doppler measurements. Appl. Opt. 2009, 48, 609. [Google Scholar] [CrossRef] [PubMed]
- Sudo, S.; Otsuka, K. Evaluation of resonance phenomena of mechanical oscillator by self-mixing solid-state laser Doppler vibrometry. Appl. Opt. 2019, 58, 1530. [Google Scholar] [CrossRef] [PubMed]
- Wang, H.; Shen, J.; Wang, B.; Yu, B.; Xu, Y. Laser diode feedback interferometry in flowing Brownian motion system: A novel theory. Appl. Phys. B 2010, 101, 173–183. [Google Scholar] [CrossRef]
- Wang, H.; Shen, J. Fast and economic signal processing technique of laser diode self-mixing interferometry for nanoparticle size measurement. Appl. Phys. B Lasers Opt. 2014, 115, 285–291. [Google Scholar] [CrossRef]
- Herbert, J.; Bertling, K.; Taimre, T.; Rakić, A.D.; Wilson, S. Microparticle discrimination using laser feedback interferometry. Opt. Express 2018, 26, 25778. [Google Scholar] [CrossRef]
- Contreras, V.; Lönnqvist, J.; Toivonen, J. Detection of single microparticles in airflows by edge-filter enhanced self-mixing interferometry. Opt. Express 2016, 24, 8886. [Google Scholar] [CrossRef]
- Atashkhooei, R.; Ramirez-Miquet, E.E.; da Costa Moreira, R.; Quotb, A.; Royo, S.; Perchoux, J. Optical Feedback Flowmetry: Impact of Particle Concentration on the Signal Processing Method. IEEE Sens. J. 2018, 18, 1457–1463. [Google Scholar] [CrossRef]
- Moreira, R.D.C.; Perchoux, J.; Zhao, Y.; Tronche, C.; Jayat, F.; Bosch, T. Single nano-particle flow detection and velocimetry using optical feedback interferometry. In Proceedings of the 2017 IEEE Sensors, Glasgow, UK, 29 October–1 November 2017; pp. 1–3. [Google Scholar]
- Wang, W.M.; Grattan, K.T.V.; Palmer, A.W.; Boyle, W.J.O. Self-mixing interference inside a single-mode diode laser for optical sensing applications. J. Light. Technol. 1994, 12, 1577–1587. [Google Scholar] [CrossRef]
- Servagent, N.; Bosch, T.; Lescure, M. A laser displacement sensor using the self-mixing effect for modal analysis and defect detection. IEEE Trans. Instrum. Meas. 1997, 46, 847–850. [Google Scholar] [CrossRef]
- Durst, F.; Zare, M. Removal of Pedestals and Directional Ambiguity of Optical Anemometer Signals. Appl. Opt. 1997, 13, 2562–2579. [Google Scholar] [CrossRef] [PubMed]
- Chang, C.C.; Yang, R.J. Hydrodynamic Focusing Effect on Two-Unmixed-Fluid in Microchannels. Int. J. Nonlinear Sci. Numer. Simul. 2008, 9, 213–220. [Google Scholar] [CrossRef]
- Arriaga, A.L. Analysis and Implementation of Algorithms for Embedded Self-mixing Displacement Sensors Design. Ph.D. Thesis, University of Toulouse, Toulouse, France, July 2014. [Google Scholar]
- Zhang, Z.; Li, C.; Huang, Z. Vibration measurement based on multiple Hilbert transform for self-mixing interferometry. Opt. Commun. 2019, 436, 192–196. [Google Scholar] [CrossRef]
- Wei, Y.; Huang, W.; Wei, Z.; Zhang, J.; An, T.; Wang, X.; Xu, H. Double-path acquisition of pulse wave transit time and heartbeat using self- mixing interferometry. Opt. Commun. 2017, 393, 78–184. [Google Scholar] [CrossRef]
- Zhen, H.; Chengwei, L.; Songquan, L.; Zhenghe, Z.; Dongyu, L. Speckle affected fringe detection based on three envelope extraction for self-mixing displacement measurement. Opt. Commun. 2017, 392, 100–108. [Google Scholar] [CrossRef]
- Arriaga, A.L.; Bony, F.; Bosch, T. Speckle-insensitive fringe detection method based on Hilbert transform for self-mixing interferometry. Appl. Opt. 2014, 53, 6954. [Google Scholar] [CrossRef]


© 2019 by the authors. Licensee MDPI, Basel, Switzerland. This article is an open access article distributed under the terms and conditions of the Creative Commons Attribution (CC BY) license (http://creativecommons.org/licenses/by/4.0/).
Share and Cite
Zhao, Y.; Zhang, M.; Zhang, C.; Yang, W.; Chen, T.; Perchoux, J.; Ramírez-Miquet, E.E.; Moreira, R.d.C. Micro Particle Sizing Using Hilbert Transform Time Domain Signal Analysis Method in Self-Mixing Interferometry. Appl. Sci. 2019, 9, 5563. https://doi.org/10.3390/app9245563
Zhao Y, Zhang M, Zhang C, Yang W, Chen T, Perchoux J, Ramírez-Miquet EE, Moreira RdC. Micro Particle Sizing Using Hilbert Transform Time Domain Signal Analysis Method in Self-Mixing Interferometry. Applied Sciences. 2019; 9(24):5563. https://doi.org/10.3390/app9245563
Chicago/Turabian StyleZhao, Yu, Menglei Zhang, Chen Zhang, Wuxiong Yang, Tao Chen, Julien Perchoux, Evelio E. Ramírez-Miquet, and Raul da Costa Moreira. 2019. "Micro Particle Sizing Using Hilbert Transform Time Domain Signal Analysis Method in Self-Mixing Interferometry" Applied Sciences 9, no. 24: 5563. https://doi.org/10.3390/app9245563
APA StyleZhao, Y., Zhang, M., Zhang, C., Yang, W., Chen, T., Perchoux, J., Ramírez-Miquet, E. E., & Moreira, R. d. C. (2019). Micro Particle Sizing Using Hilbert Transform Time Domain Signal Analysis Method in Self-Mixing Interferometry. Applied Sciences, 9(24), 5563. https://doi.org/10.3390/app9245563