1. Introduction and Motivation
Gait recognition has been studied extensively in recent years as a biometric identification method that does not require the user to approach the sensor or to interact with the recognition system. Moreover, human locomotion can be analyzed with low resolution cameras and is difficult to hide, making gait recognition a very attractive method in video surveillance and security systems. Depending on how the walking dynamics and body shape data are used in the recognition process, gait recognition techniques may be divided into a model and appearance based techniques. Model based techniques use explicit models to represent and track different parts of the body over time, such as legs and arms, and construct a gait signature that is later used during recognition. These techniques have high computational requirements for model construction and parameter estimation. Appearance based techniques, on the other hand, do not rely on body models. Instead, silhouette representations of persons are extracted from the images. The extraction is not computationally expensive, hence such methods are suitable for real-time usage.
In recent years, there has been a growing proliferation of smart 3D sensors that in addition to the usual 2D camera video stream also provide depth information, often combined. Starting with Microsoft Kinect in 2011, several fast mass market 3D sensors became available that provide a real-time depth stream alongside the RGB stream. There are two types of such sensors, structured light sensors that illuminate the object with a light pattern and use a standard 2D camera to measure depth via triangulation, and time-of-flight sensors that measure depth by estimating the time delay from light emission to light detection. In both cases, an active low power IR projector is used to illuminate the target and the signal reflected from the target is captured with a receiver. A passive stereo camera setup can also be used to derive the depth information using stereo vision. Stereo vision is computationally expensive task, but it can provide a depth stream in environment conditions that are not suitable for depth sensing using active time-of-flight or structured light technologies, i.e., it can be used outdoors in sunlight and can capture the depth information with sufficient detail at distances larger than 10 m.
Both active and passive depth sensors are easily available today, are able to provide RGB and depth streams in real-time, and can be used in different sets of environmental conditions. It is therefore of benefit to study how appearance based methods can be extended and modified to harness additional depth information that is now available. For example, the silhouettes can be extracted from depth rather than from RGB images. This is important because depth in many cases provides better foreground/background separation than color based algorithms since it is less affected by changes of lighting conditions, shadows, and foreground and background regions having similar colors. New gait features can be defined and constructed relying on additional volumetric information of the walking subject that is now available, i.e., capturing the movement of body parts in all three dimensions. Finally, a person’s size can now easily be estimated using the available information of the subject’s distance from the camera. With regard to silhouettes used by appearance based methods, this means that the size of the silhouette can now be used as a feature and taken into account for classification. It is of interest therefore to test the hypothesis that the addition of depth information can extend the applicability and improve the recognition accuracy of gait recognition methods without incurring a considerable performance penalty.
In this work, two methods (Height-GEI integration (HGEI-i) and Height-GEI fusion (HGEI-f)) that enhance appearance based gait recognition methods by integrating the height of a person in the recognition process are proposed and studied. The height of a person is estimated from the silhouette using the additional depth information now available. The approaches were tested on populations with different sizes and height distributions derived from a TUM Gait from Audio, Image and Depth (GAID) [
1] dataset, a large dataset containing both RGB and depth based silhouettes. The proposed methods were also applied to and compared with Backfilled GEI (BGEI) [
2], another recent approach that harnesses depth information in gait recognition to construct a feature that is valid irrespective of the walking direction of the subject relative to the camera (front or side views). Since BGEI uses a depth stream as input, the extension of BGEI with one of the proposed methods in order to harness also the size of the silhouette is straightforward. The experimental results for the proposed approaches show that recognition rates are improved when compared to existing appearance based gait recognition methods which use only 2D data. Both approaches are suitable for real-time processing.
This paper is structured as follows. In
Section 2, the state-of-the-art research on appearance based gait recognition methods using depth video stream as input is listed and described briefly.
Section 3 describes the key processing steps performed by gait recognition methods in general, and by the proposed methods in particular, starting from the depth and RGB input streams. In
Section 4, the two proposed recognition methods that extend appearance based gait recognition with depth derived feature are proposed and described. In
Section 5, the experimental setup is described with the presentation of the dataset used in the experiments, the selection of parameters for the methods, and the definition of the set of experiments. In the same section, the results are then presented, analyzed, and discussed. Finally, the concluding remarks are given in
Section 6.
2. Related Work
Gait recognition methods that use RGB video stream as input have been extensively researched. The reader can consult for example the work of Singh et al. [
3] for a recent survey. Particularly relevant to this research is the work from Han and Bhanu [
4], which uses a spatiotemporal gait representation, called Gait Energy Image (GEI), to characterize human walking properties. Binary silhouettes are extracted from RGB images, size normalized, and aligned. Then, the average silhouette over a gait cycle is constructed, where pixels of higher intensity correspond to positions where human body occurs more frequently. This average silhouette is named Gait Energy Image (GEI). GEI is one of the most influential works in the field of gait recognition, from which several other appearance based methods are derived.
Appearance based gait recognition methods that use both RGB and depth video streams are more recent. The reviewed methods generally introduce new gait features based on depth or RGB-D streams. These features are then used for side-view gait recognition [
2,
5], or for frontal gait recognition [
2,
6,
7]. Some methods [
8,
9] are also used for gender recognition tasks. In this section, they are briefly described.
Sivapalan et al. [
6] extended GEI with 3D information and presented Gait Energy Volume (GEV) which uses reconstructed voxel volumes instead of temporally averaging segmented silhouettes. They tested basic GEV implementation on CMU MoBo database, and also experimented on frontal depth images evaluating them on an in-house developed database created with Kinect sensor. Hofmann et al. [
5] also extended the traditional GEI using depth information to, in addition to GEI, calculate also the edges and depth gradients within the person’s silhouettes, which are then aggregated in cells, normalized, and finally averaged over a gait cycle to obtain a new representation called Depth Gradient Histogram Energy Image (DGHEI).
Borràs et al. [
8] presented DGait, a new gait database acquired with a depth camera. DGait was acquired with Kinect sensor in an indoor environment and contains videos from 53 subjects walking in different directions, and each video is labeled according to the subject, gender, and age. In addition, they performed gait-based gender classification experiments with the mentioned database to show the usefulness of depth data in this context. In their experiments, they extracted 2D and 3D gait features based on shape descriptors for gender identification using an advanced version of support vector machine (SVM) called Kernel SVM. According to the results, depth can be very relevant for gait classification problems. Lu et al. [
9] investigated the problem of human identity and gender recognition from gait sequences with arbitrary walking directions. They obtained human silhouettes by background subtraction and clustering. For each cluster, a cluster-based averaged gait image (C-AGI) is calculated. Then, they presented a sparse reconstruction based metric learning (SRML) method for discriminative gait feature extraction. Besides that, the authors created a new gait database with a Kinect sensor in an indoor environment called Advanced Digital Sciences Center Arbitrary Walking Directions (ADSC-AWD).
Chattopadhyay et al. [
7] proposed a new feature called Pose Depth Volume (PDV) for frontal gait recognition by partial volume reconstruction of the frontal surface of the silhouettes from Kinect RGB-D streams.
Iwashita et al. [
10] proposed a novel method where an image of the human body is divided into multiple areas and features are extracted for each area. For each area, a matching weight is estimated based on the similarity between the extracted features and those in the database for standard clothes. The identification of a subject is performed by weighted integration of similarities in all areas.
Sivapalan et al. [
2] proposed the Backfilled Gait Energy Image (BGEI) appearance based feature. BGEI can be constructed from frontal depth images as well as side-view silhouettes. The same feature thus can be used across different capturing systems. They used their own created database obtained with a Kinect sensor to evaluate the feature.
3. Image Processing and Feature Extraction
The gait recognition process consists of several processing steps performed sequentially before the final classification step. The input to the system typically consists of video streams coming from one or more cameras. In addition to the RGB stream, other streams may be provided simultaneously by the smart sensor. In particular, a depth stream can be provided directly by the sensor or derived from overlapped regions in video streams of two or more cameras using stereo vision processing.
The raw images obtained from the video stream must be processed to extract the silhouettes and derive features used afterwards in the recognition stage. With respect to the methods described in this paper, the silhouette can be extracted from either the depth or RGB video streams; however, the depth stream is necessary for estimation of its size. In this section, the main processing steps necessary to obtain the features used for gait recognition are described as pertaining different input stream types.
3.1. Input Video Stream Processing
Depending on the technique used to acquire depth information from the scene, sensors that provide both RGB and depth video streams in real-time, i.e., 3D cameras, can be divided into two categories: active or passive sensors.
Active sensors use an active source of energy, i.e., a projector, to emit a laser beam or a pattern of light, typically in the infrared spectrum, and a receiver to capture the light reflected from the objects in the scene. Common active sensors are laser range scanners, and, more recently, consumer grade sensors based on structured light and time-of-flight technologies [
11]. Sensors based on structured light and time-of-flight technologies, besides being typically much cheaper than laser scanners, have the advantage of capturing the entire scene at the same time, making them suitable for usage in gait recognition and other dynamic scenes applications.
Active 3D sensors have a limited range due to the projector power being limited for safety reasons. The typical range of consumer grade active sensors used for gait recognition is around 5 m. Furthermore, they are either not usable or perform poorly outdoors when daylight is strong because the sunlight overwhelms the projected pattern, making it undetectable. Moreover, identical sensors, using the same frequency and pattern, should not overlap the view to avoid interference. The raw depth images are typically noisy and contain artifacts and missing pixels, thus the first stage of image processing usually comprises filtering the noise (e.g., median filter) and applying morphological image processing operations such as dilate and emboss operators.
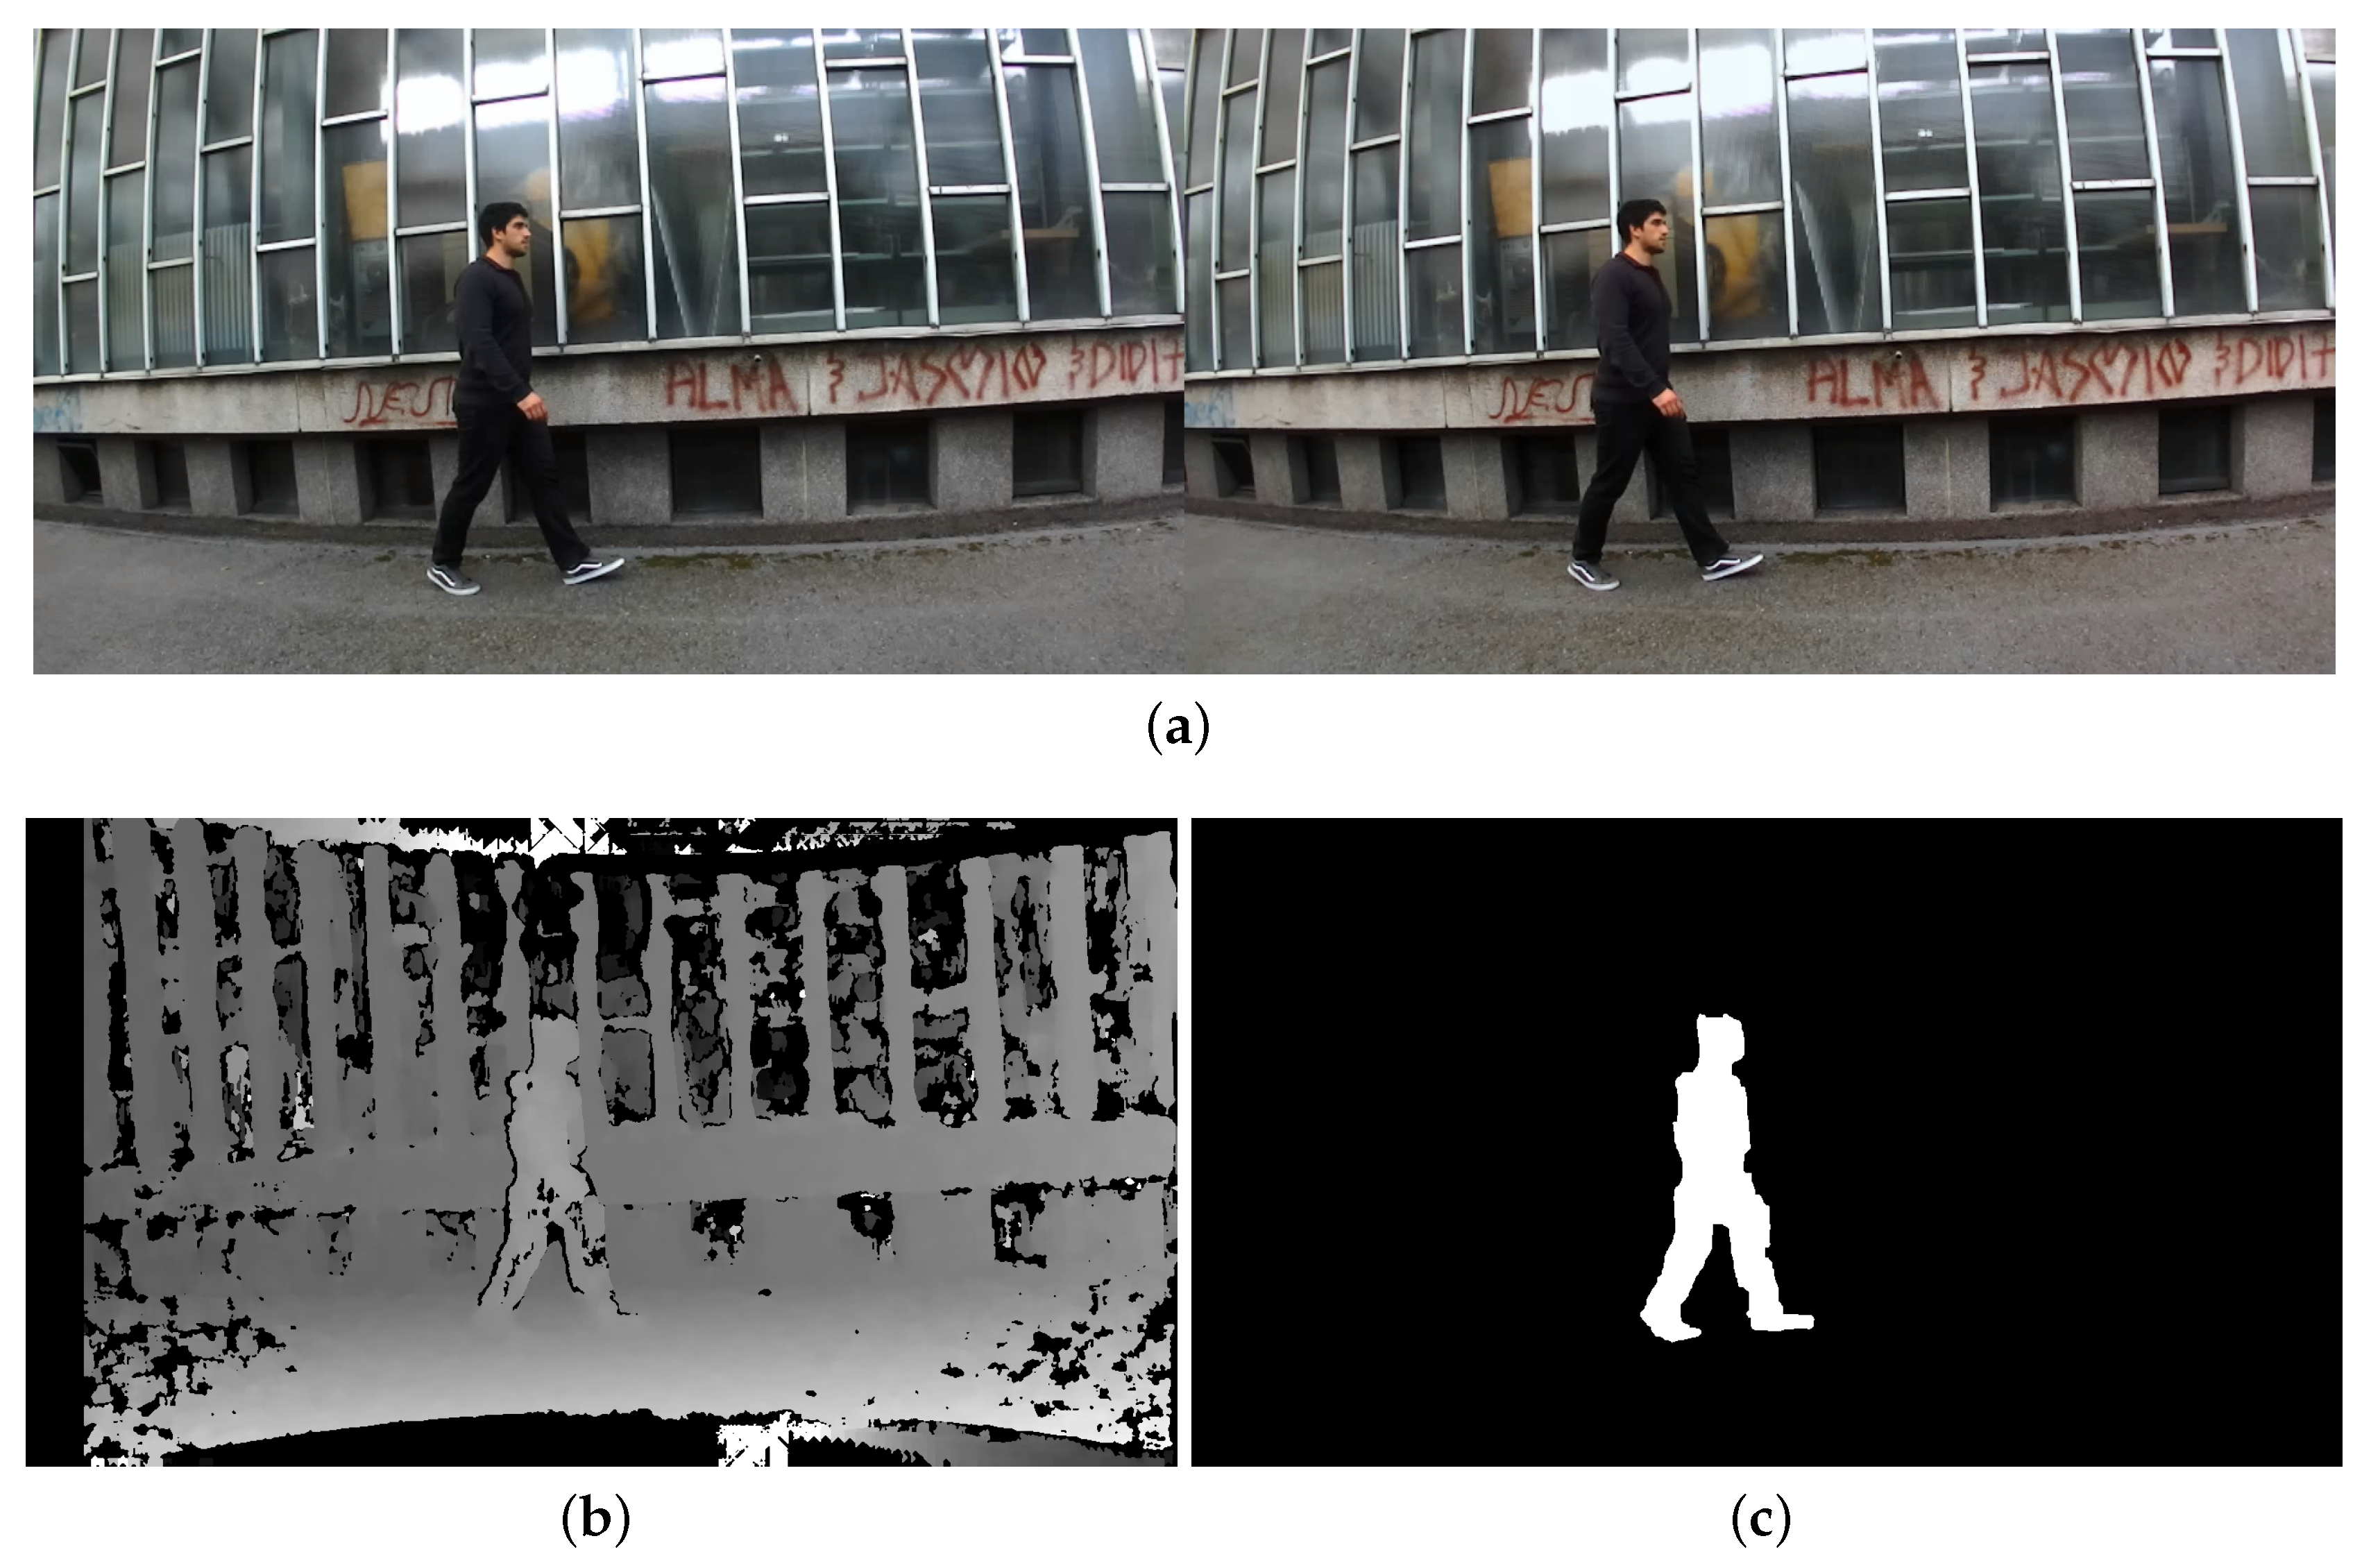
Passive sensors, on the other hand, do not use an active projector at all. To obtain the image of the scene, the sensor relies on the light naturally present in the scene (either sunlight or from external artificial light sources). The calculation of the depth information is not based on the structure of light source or time measurements. Instead, two or more receivers (e.g., RGB or infrared cameras) are used to recover the range information using stereo vision processing techniques. Depending on the resolution, the baseline distance between cameras, and the lighting conditions in the scene, stereo vision is not intrinsically limited in range, like active sensors, but instead capable of calculating depth information at much larger distances. In addition, they can be used outdoors without any problem. Disadvantages of passive sensors are the additional computational burden for stereo vision processing, and the presence of undesired artifacts in the resulting depth images, due to, for example, featureless parts of the scene, where correspondences between the images of cameras cannot be found, thus no depth information can be extracted. Without an active projector, they are also more sensitive to reflections, shadows, and other features in the scene. This is noticeable in
Figure 1.
The image processing steps applied to raw depth images from passive sensors are similar to those of the active sensors; however, to obtain better results, they should be fine tuned after installation of the cameras and specifically for the particular application and scene requirements.
3.2. Extraction of Silhouettes
To extract silhouettes of people walking from RGB images, different approaches are used in gait recognition methods. Silhouettes are obtained using background subtraction and foreground detection methods, combined with some form of thresholding. Background subtraction represents a technique for segmenting out objects of interest in a scene [
12]. Methods such as Gaussian mixture models (GMM) [
13,
14], background modeling, and subtraction by codebook construction, kernel density estimation (KDE) [
15], and others are typically used. Foreground and background separation is different in the case of depth images. Detailed information on background extraction from depth images can be found in [
16].
Rarely, the person is walking at the same exact distance from the camera. If the subject’s distance from the camera varies, as is usually the case, then the silhouette size varies and should be normalized first. The extracted silhouettes are therefore all resized to the same size. The region of interest (ROI) is typically defined calculating a bounding box around a silhouette, and all the silhouettes are then scaled into uniform size [
5,
17]. The horizontal position is placed so that the torso in each frame is approximately at the same location.
3.3. Gait Cycle Determination
A video sequence can include several gait cycles. To avoid redundancy, feature extraction is ideally performed for each gait cycle. For example, to obtain consistent GEI images, frames covering the whole gait cycle should be used. However, it is not important where the beginning of the gait cycle is placed exactly, as long as the criterion is consistently used. Single gait cycle, as stated in [
18], can be measured from any subsequent event on the same foot, i.e., one foot strike to the subsequent foot strike of the same foot. Two phases of gait cycles are important: stance phase and swing phase. Stance phase is the phase that consists of the entire time that a foot is on the ground, while, in the swing phase, the foot is in the air [
18]. The estimation of the gait period is done through the analysis of the periodic time sequence of the width/length [
19,
20] of the bounding box of a moving silhouette. To cope effectively with both lateral and frontal views, in [
21], four projections are extracted directly from differences between the silhouette and the bounding box and then converted into associated 1D signals used for estimation.
3.4. GEI Image Creation
To capture the gait features, the GEI image [
4] is constructed from the silhouette frames during a complete gait cycle. It is defined as
where
N represents the number of silhouette frames in the gait cycle,
t represents the frame number in a gait cycle at a moment of time, and
I(i, j) is the original silhouette image with
(i, j) values in the 2D image coordinate.
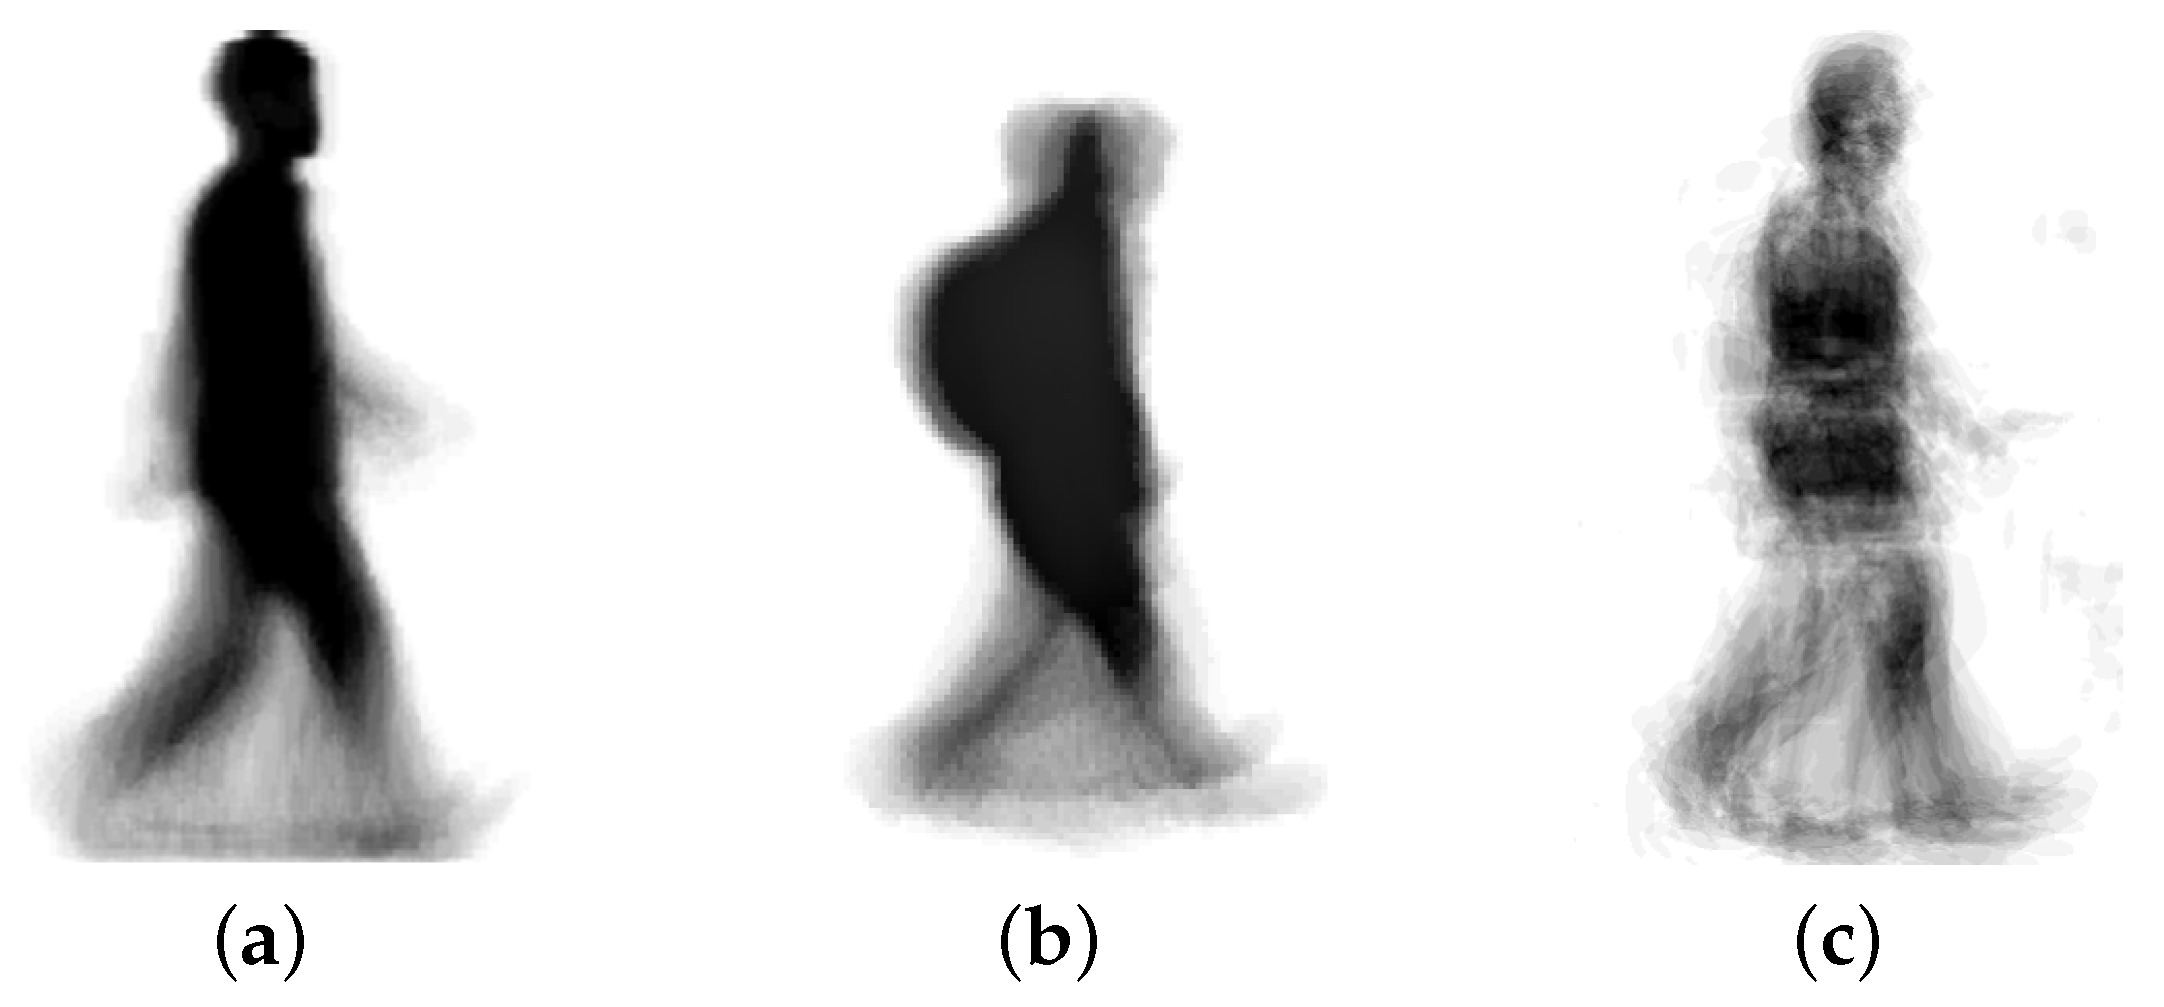
Example GEI images are shown in
Figure 2.
3.5. Determination of Human Height from the Silhouette
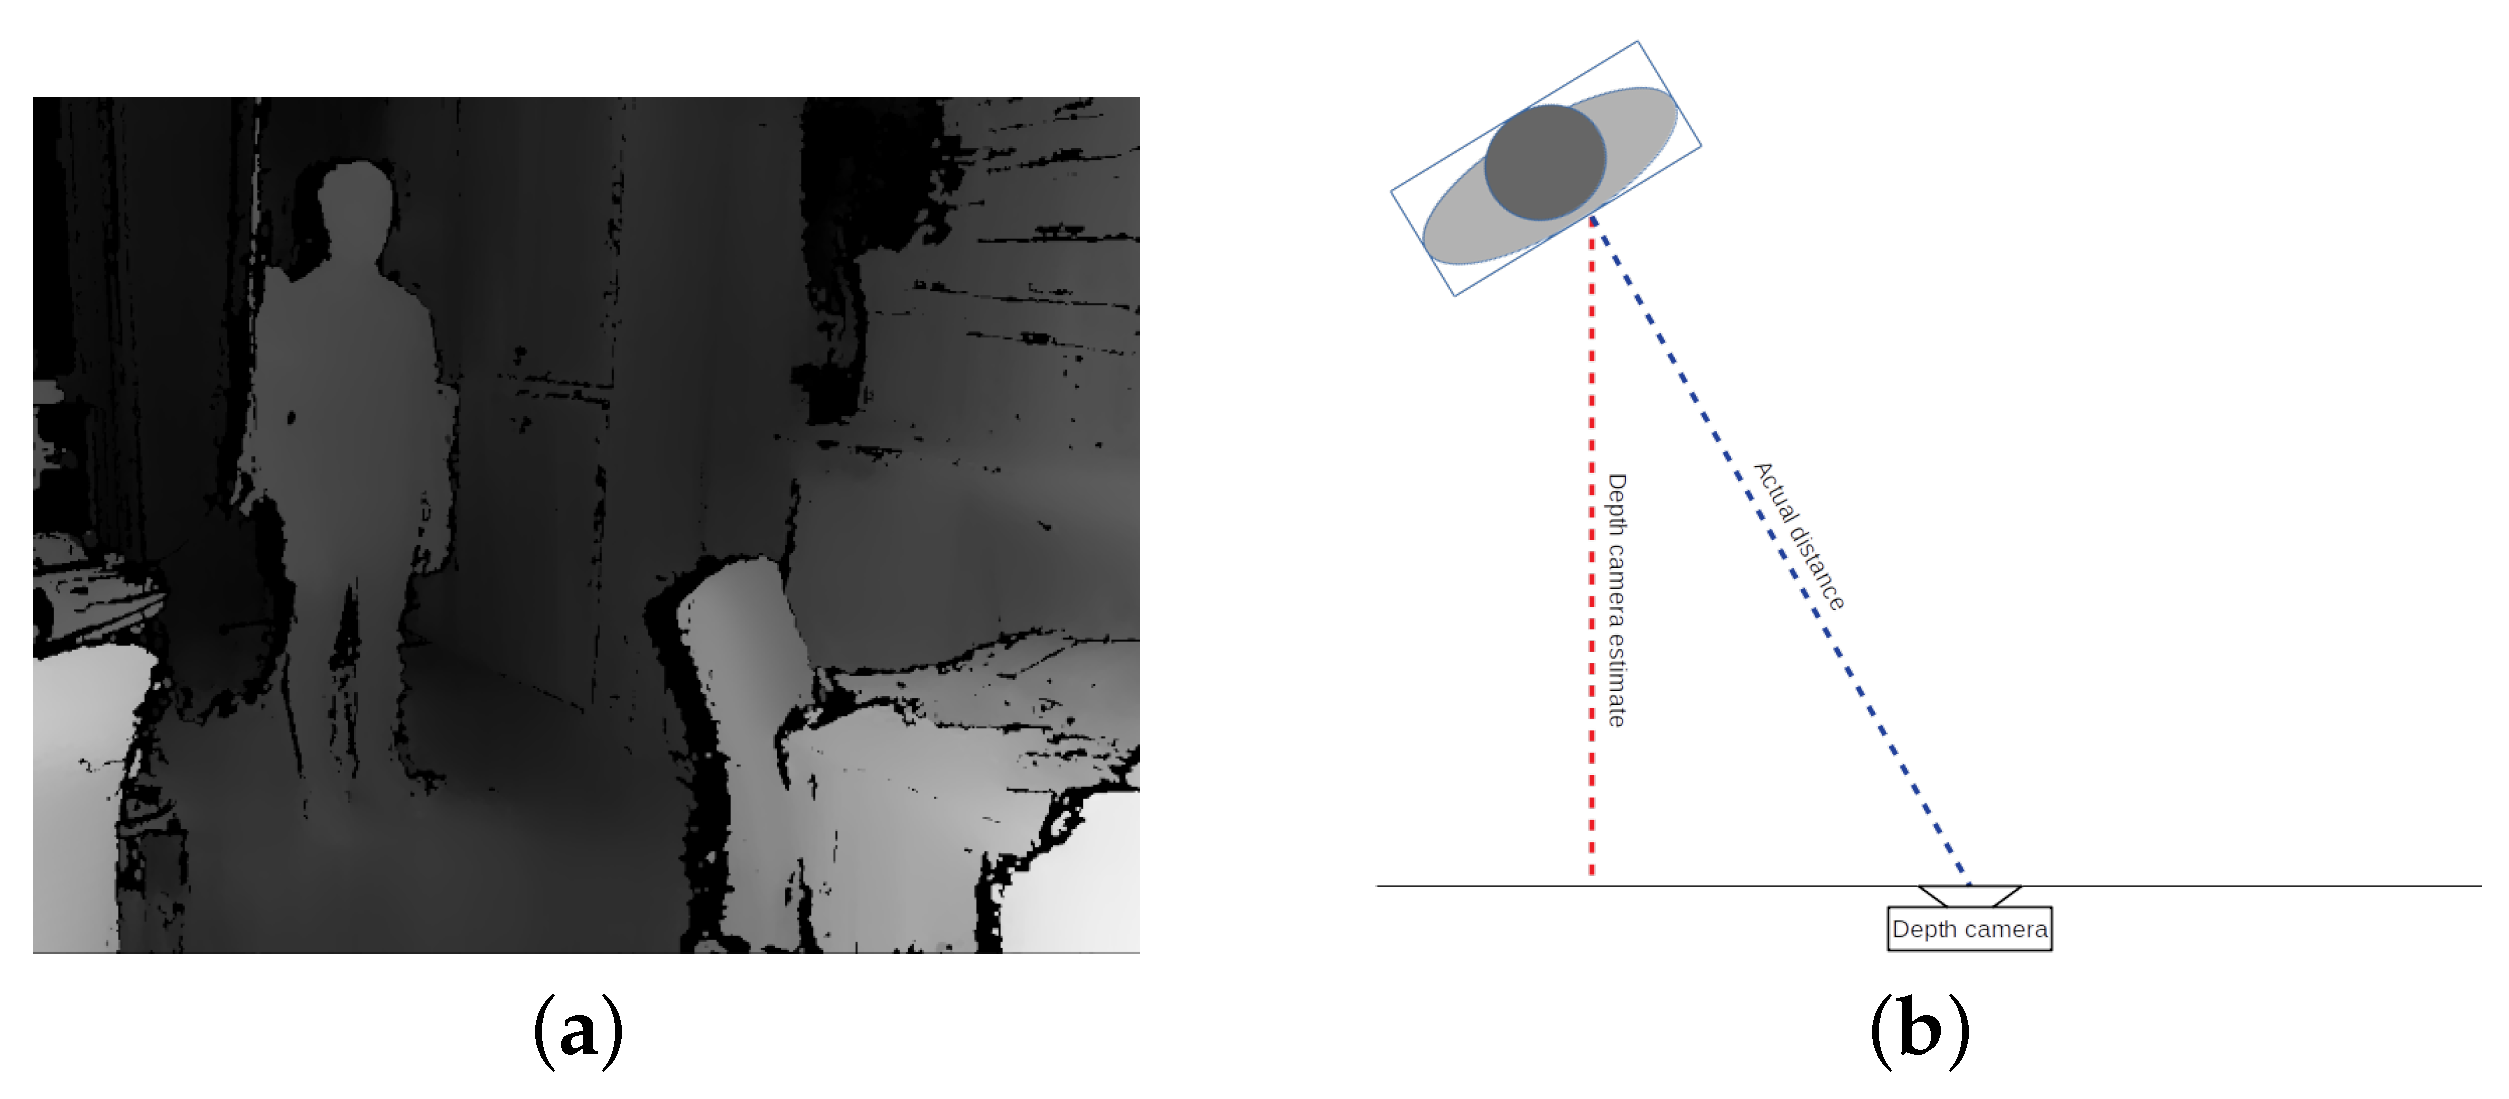
Once the silhouette has been extracted, the height of the corresponding person can be estimated using the information regarding the distance of the person from the camera. This information can be derived since the distance of each point of the silhouette is encoded in the depth image (
Figure 3).
The height feature is constructed as the average of the estimated silhouette heights in the gait cycle:
The height estimation accuracy depends on various factors, including the type and technology of depth sensor used, the environment conditions, the current motion state of the subject, etc. An analysis of the estimation accuracy obtainable from depth images in indoor environments and estimation results of different methods is presented in [
22]. In particular, the analysis reports height estimation results for humans in the state of walking, as opposed to humans standing still in front of the camera, which is of interest for this work.
4. Proposed Recognition Methods
In this work, two methods are proposed (Height-GEI integration (HGEI-I) and Height-GEI fusion (HGEI-f)) that extend appearance based gait recognition methods based on Gait Energy Image (GEI) by using the additional depth information available to estimate the size of the silhouette. To be more precise, the height of the silhouette is used to represent its size.
The two methods differ in the way the classifier combination is performed. The first method, HGEI-i, performs the early fusion at the feature level, while HGEI-f performs the late fusion at the decision level [
23].
The initial processing steps and the feature extraction process, described in the previous section, are identical for both approaches.
4.1. Dimensionality Reduction
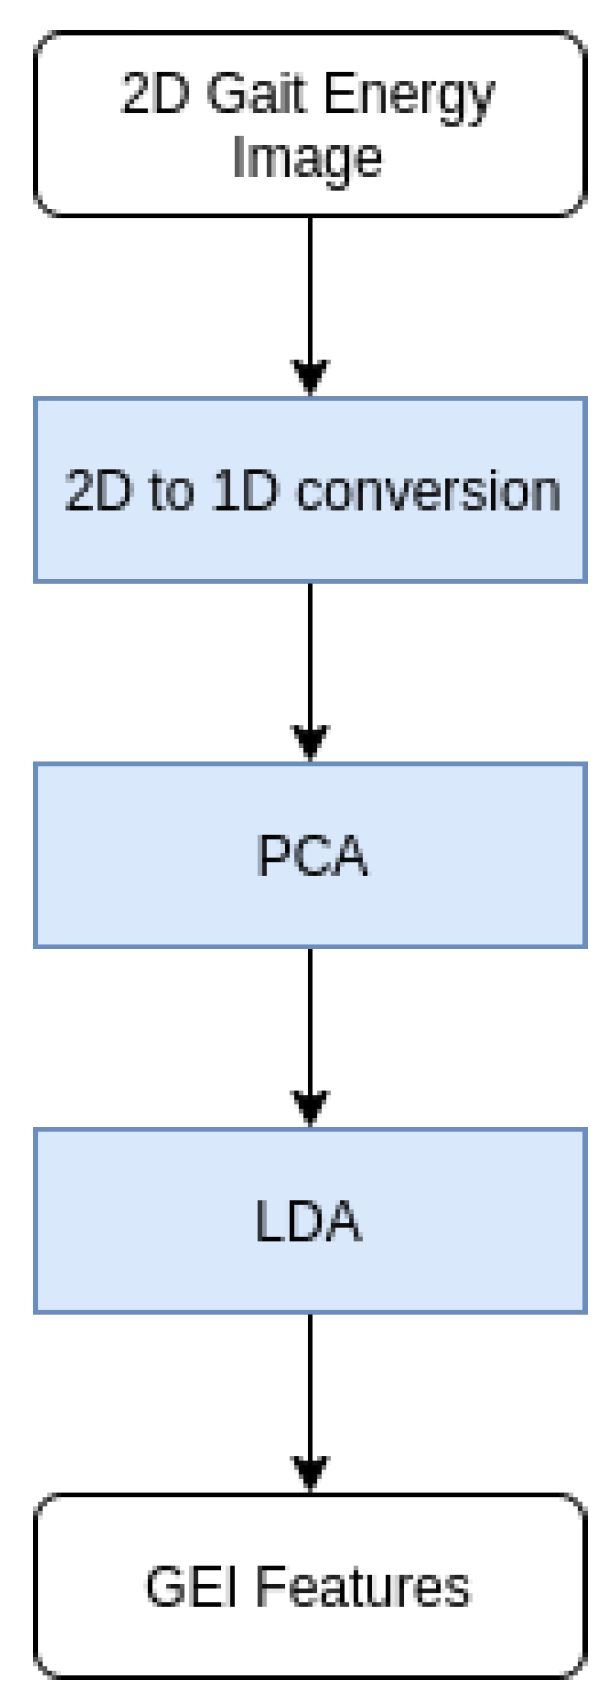
After obtaining GEI from the video sequence, image data are converted to one-dimensional array, stacking image columns one after another. Dimensionality of that array is reduced using Principal Component Analysis (PCA), followed by Linear Discriminant Analysis (LDA). This process was described by Hofmann et al. [
5] in more detail.
Figure 4 shows the processing pipeline for the used dimensionality reduction process.
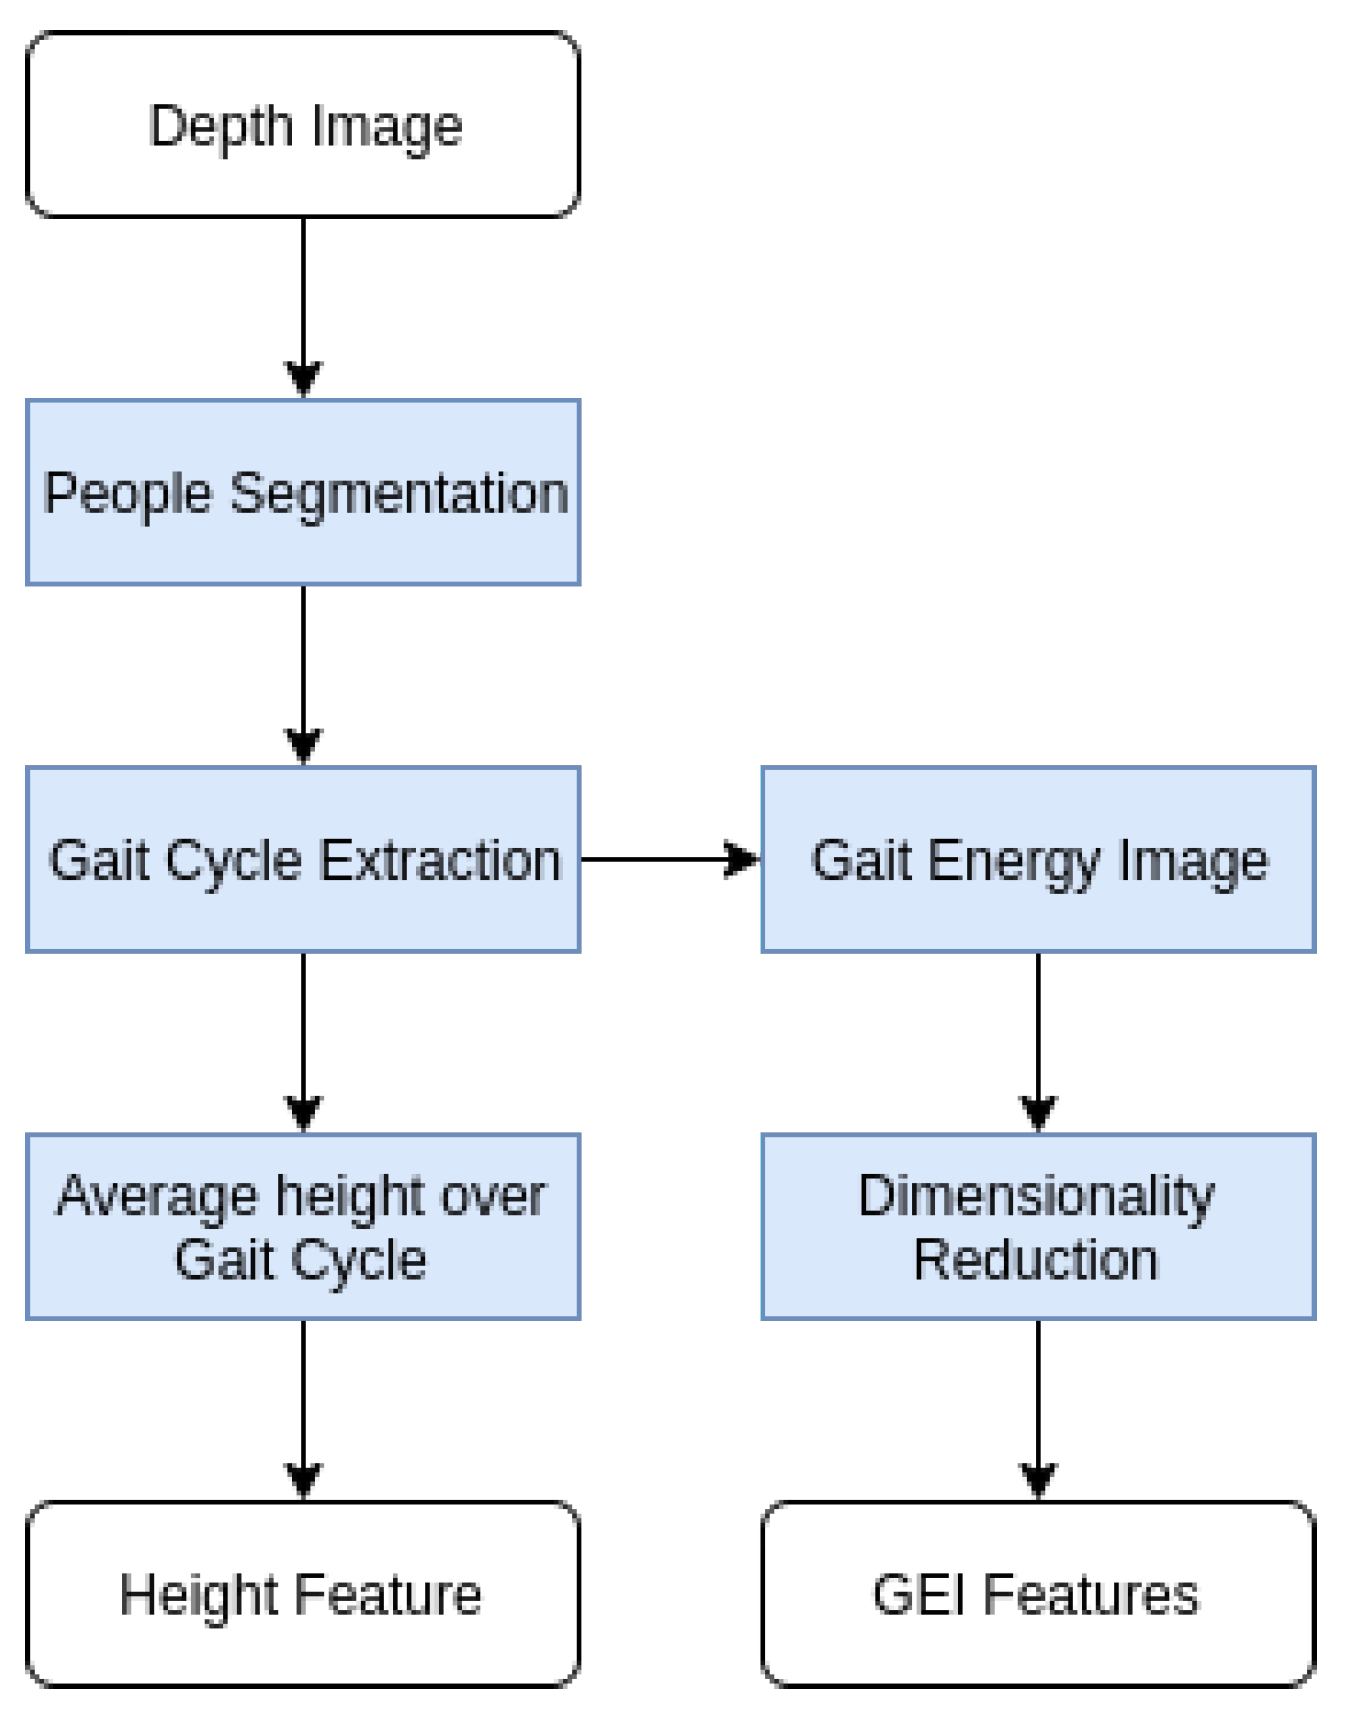
Based on preliminary experimental evaluation of the computation time and accuracy, and target application, the selected number of components to be extracted with PCA and LDA was set to be 50 and 10, respectively. The complete feature extraction process from a depth video source to the GEI and height features is shown in
Figure 5.
4.2. Height-GEI Integration (HGEI-i)
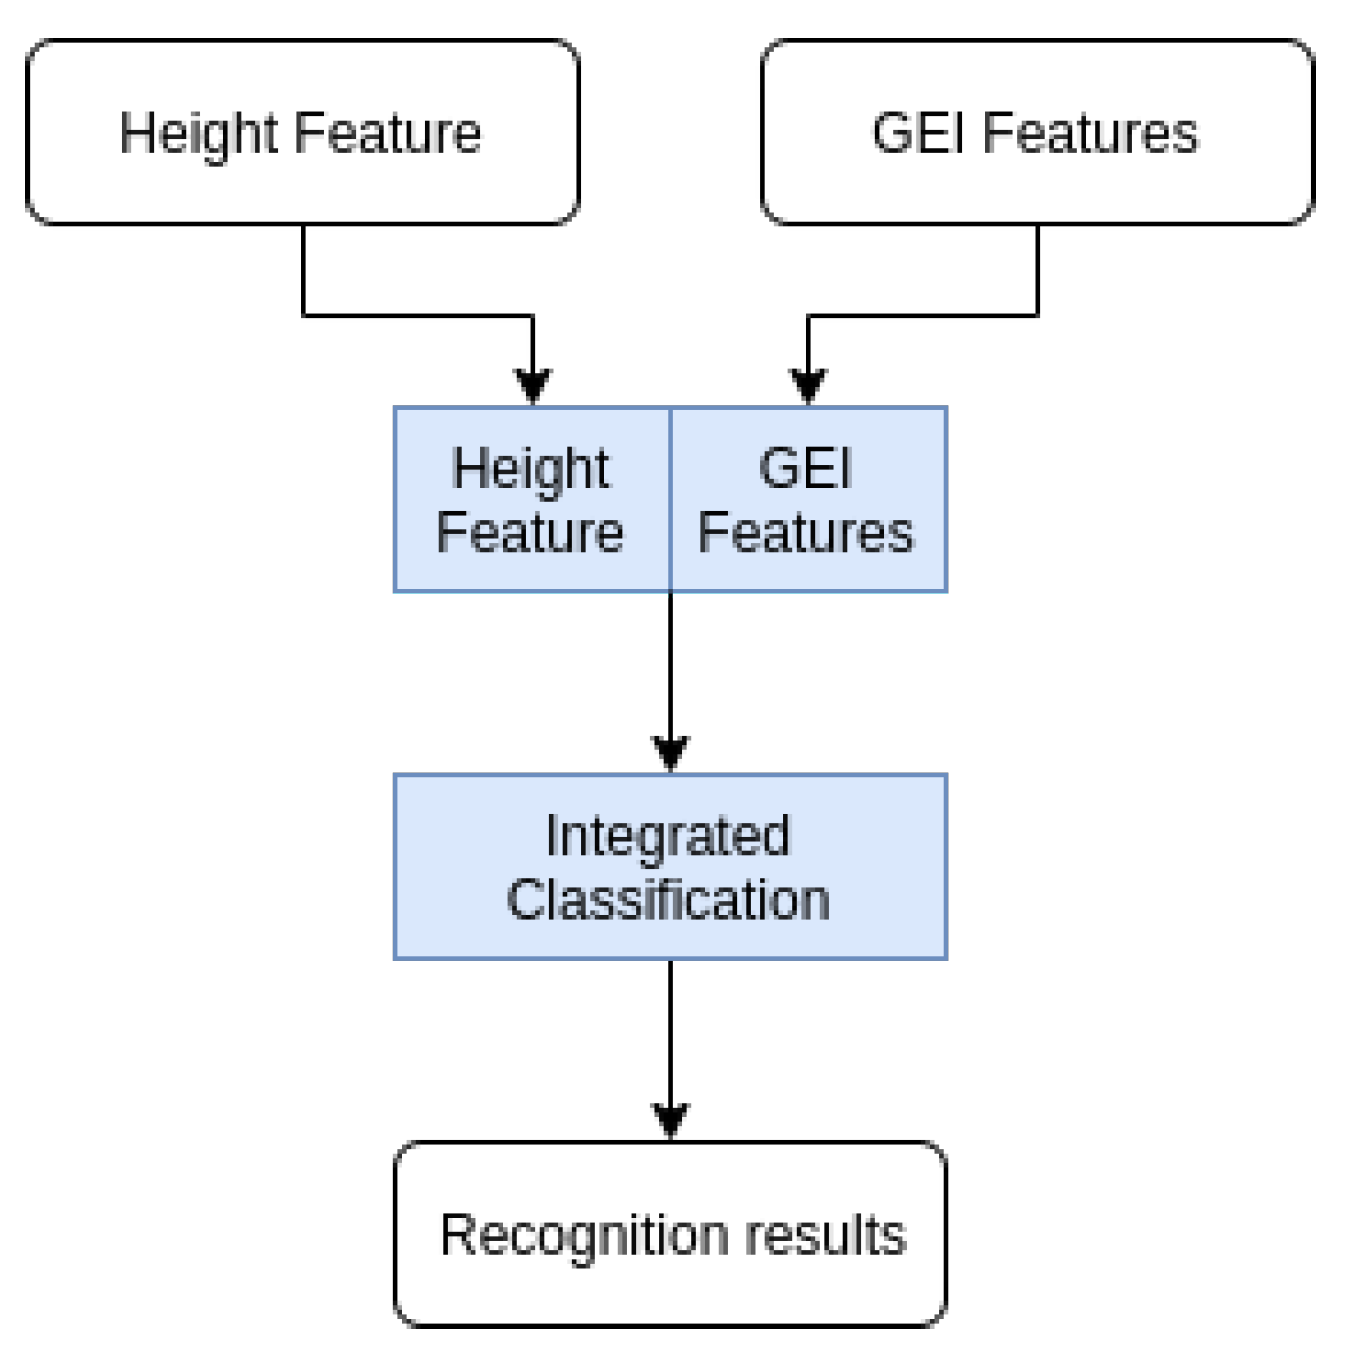
In the first proposed approach, GEI silhouettes and depth features are extracted using the process explained in the previous sections. A person’s height information is added as one of the features alongside the features obtained from GEI, after the dimensionality reduction with PCA and LDA. Height information attribute is added to the feature vector resulted from LDA, thus extending the number of attributes. After this integration step, classification is performed. These processing steps are shown in
Figure 6.
4.3. Height-GEI Fusion (HGEI-f)
In the second approach, GEI silhouettes and person height information are analyzed separately and, based on the results from both classification processes for each sample, a single prediction is made. Processing steps for the second approach are depicted in
Figure 7.
For optimal determination of fusion parameters, a method based on alpha integration proposed by Safont et al. [
24] is used. For each class, alpha and weight parameters are determined using the multiclass least mean square error (LMSE) criterion for the optimization algorithm. In the original manuscript by Safont et al., Gradient Descent is proposed as the optimization method. In this work, a NOMAD [
25] implementation of Mesh Adaptive Direct Search algorithm (MADS) [
26] is used for its high precision and derivative-free optimization.
Using per class classification probabilities from GEI and Height classifiers (
) and predetermined weights (
) and
parameters, fusion probabilities are calculated using the following equation:
5. Experimental Validation
To validate the hypothesis stated in the introduction and to provide insights into the expected increase in recognition accuracy that can be expected with the addition of height in the recognition process, a series of experiments were performed. The experimental setup is such that it enables a basis for comparison of the recognition accuracy obtained from a classical appearance based gait recognition method relying on GEI, a 3D extension of the method using BGEI features, and the proposed methods that also integrate the height feature alongside the GEI or BGEI features. Classification based on the height feature only was also performed to provide further insight into the expected classification performance of height feature relative to GEI. Since the recognition accuracy based on height feature is dependent on the height distribution of the tested population, which varies in different target applications, different height distributions that cover typical gait recognition application scenarios were considered. Furthermore, since generally the classification performance of people recognition methods varies with the number of classes, i.e., with the target population size and the number of persons to be recognized, all experiments were performed on three different population sizes. The experimental setup is described next and then the results are presented and analyzed.
5.1. Experimental Setup
5.1.1. Dataset
In this paper, a subset of TUM GAID dataset [
1] containing audio, RGB, and depth recordings suitable for studying gait recognition was used. TUM GAID dataset is freely available for research purposes, contains both RGB and depth recordings of a large number of subjects, and is therefore suitable for the stated research objectives.
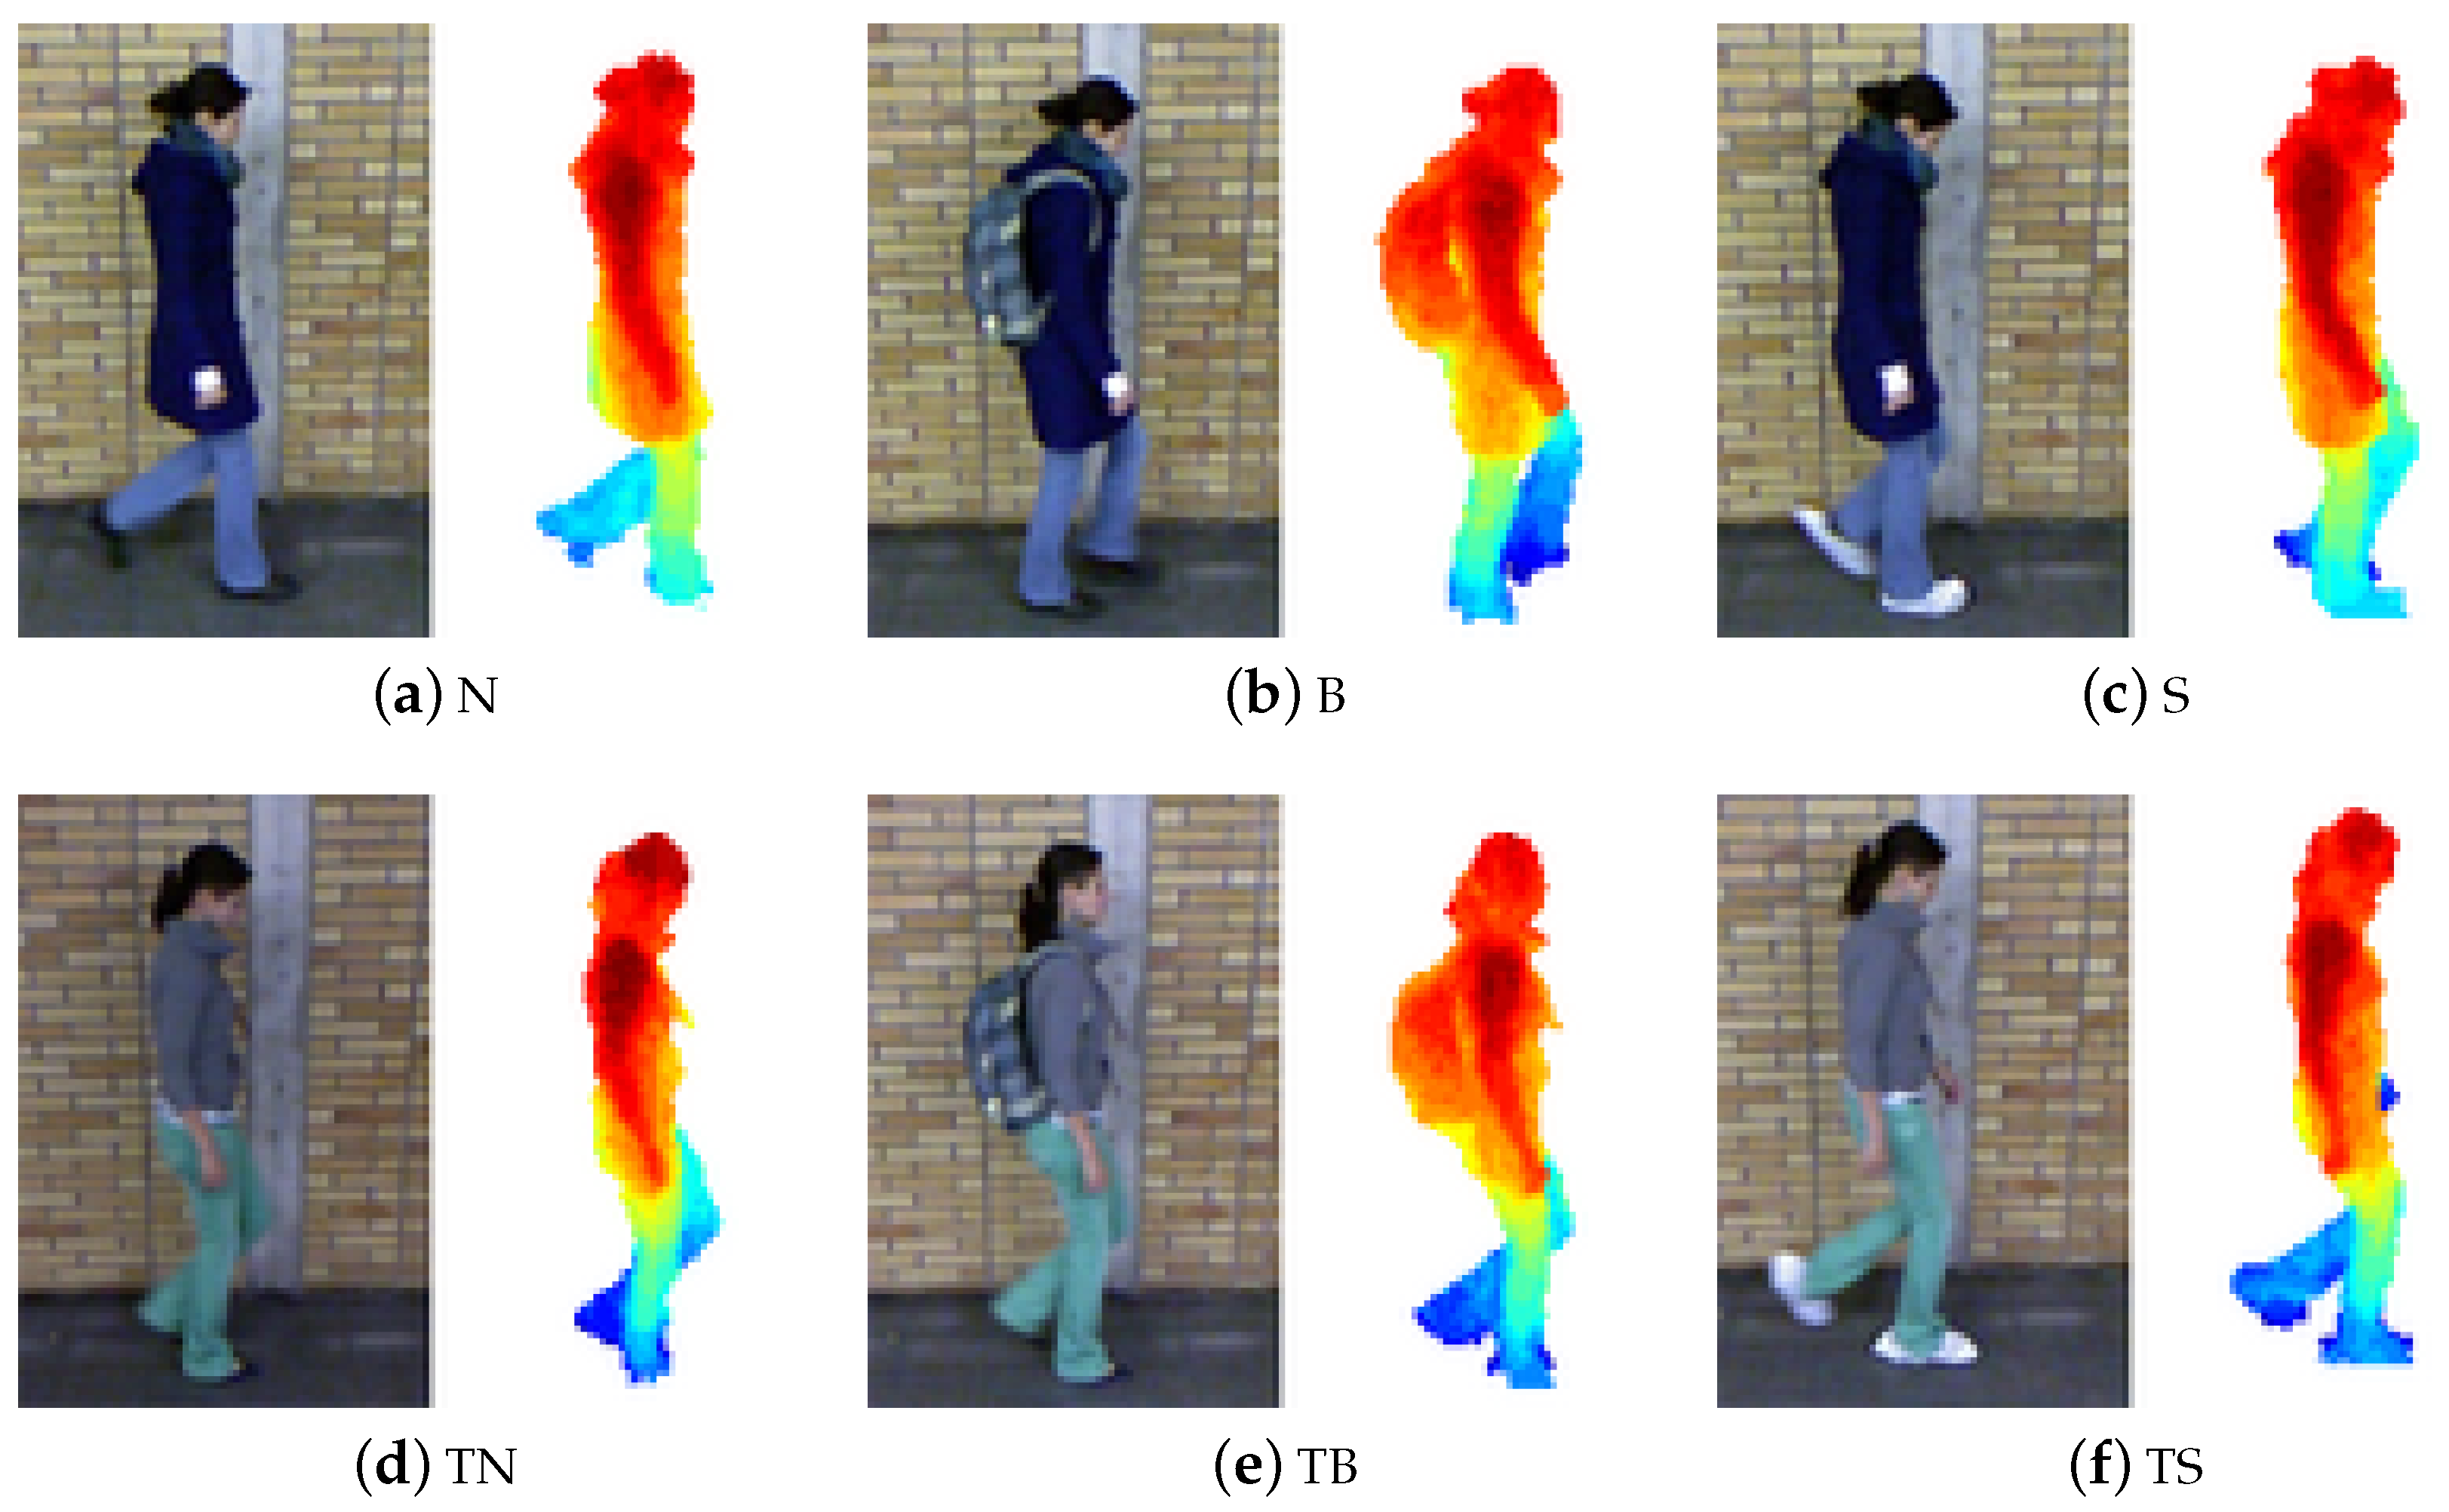
It contains recordings obtained with a Kinect sensor of 305 people in three variations: normal (N,
normal), carrying a backpack (B,
backpack), and with silenced shoes (S,
shoes). The backpack variation is suitable for studying the impact of the degradation of silhouettes on the performance of gait recognition. The variation where the shoes are coated is suitable for studying the performance of recognition methods based on audio stream modality (these methods are not considered in this work). For each person, there are six recordings in
normal, two in
backpack, and two in
shoes variation. To further investigate challenges of time variation where the recording conditions such as lighting, clothing, etc. may change when recorded in another moment (e.g., days or months later), a subset of 32 people was recorded a second time for six additional recordings in a normal variation (TN,
time normal), and two additional recordings for backpack (TB,
time backpack) and with silenced shoes (TS,
time shoes) variations, for a total of 12 recordings in
normal, 4 in
backpack and 4 in
shoes variation (
Figure 8). The images were recorded in
resolution at a frame rate of 30 fps from a fixed camera placed at approximately 4 m distance perpendicularly to walking direction, i.e., the dataset is suitable for testing side view gait recognition.
5.1.2. Extraction of GEI and BGEI Features
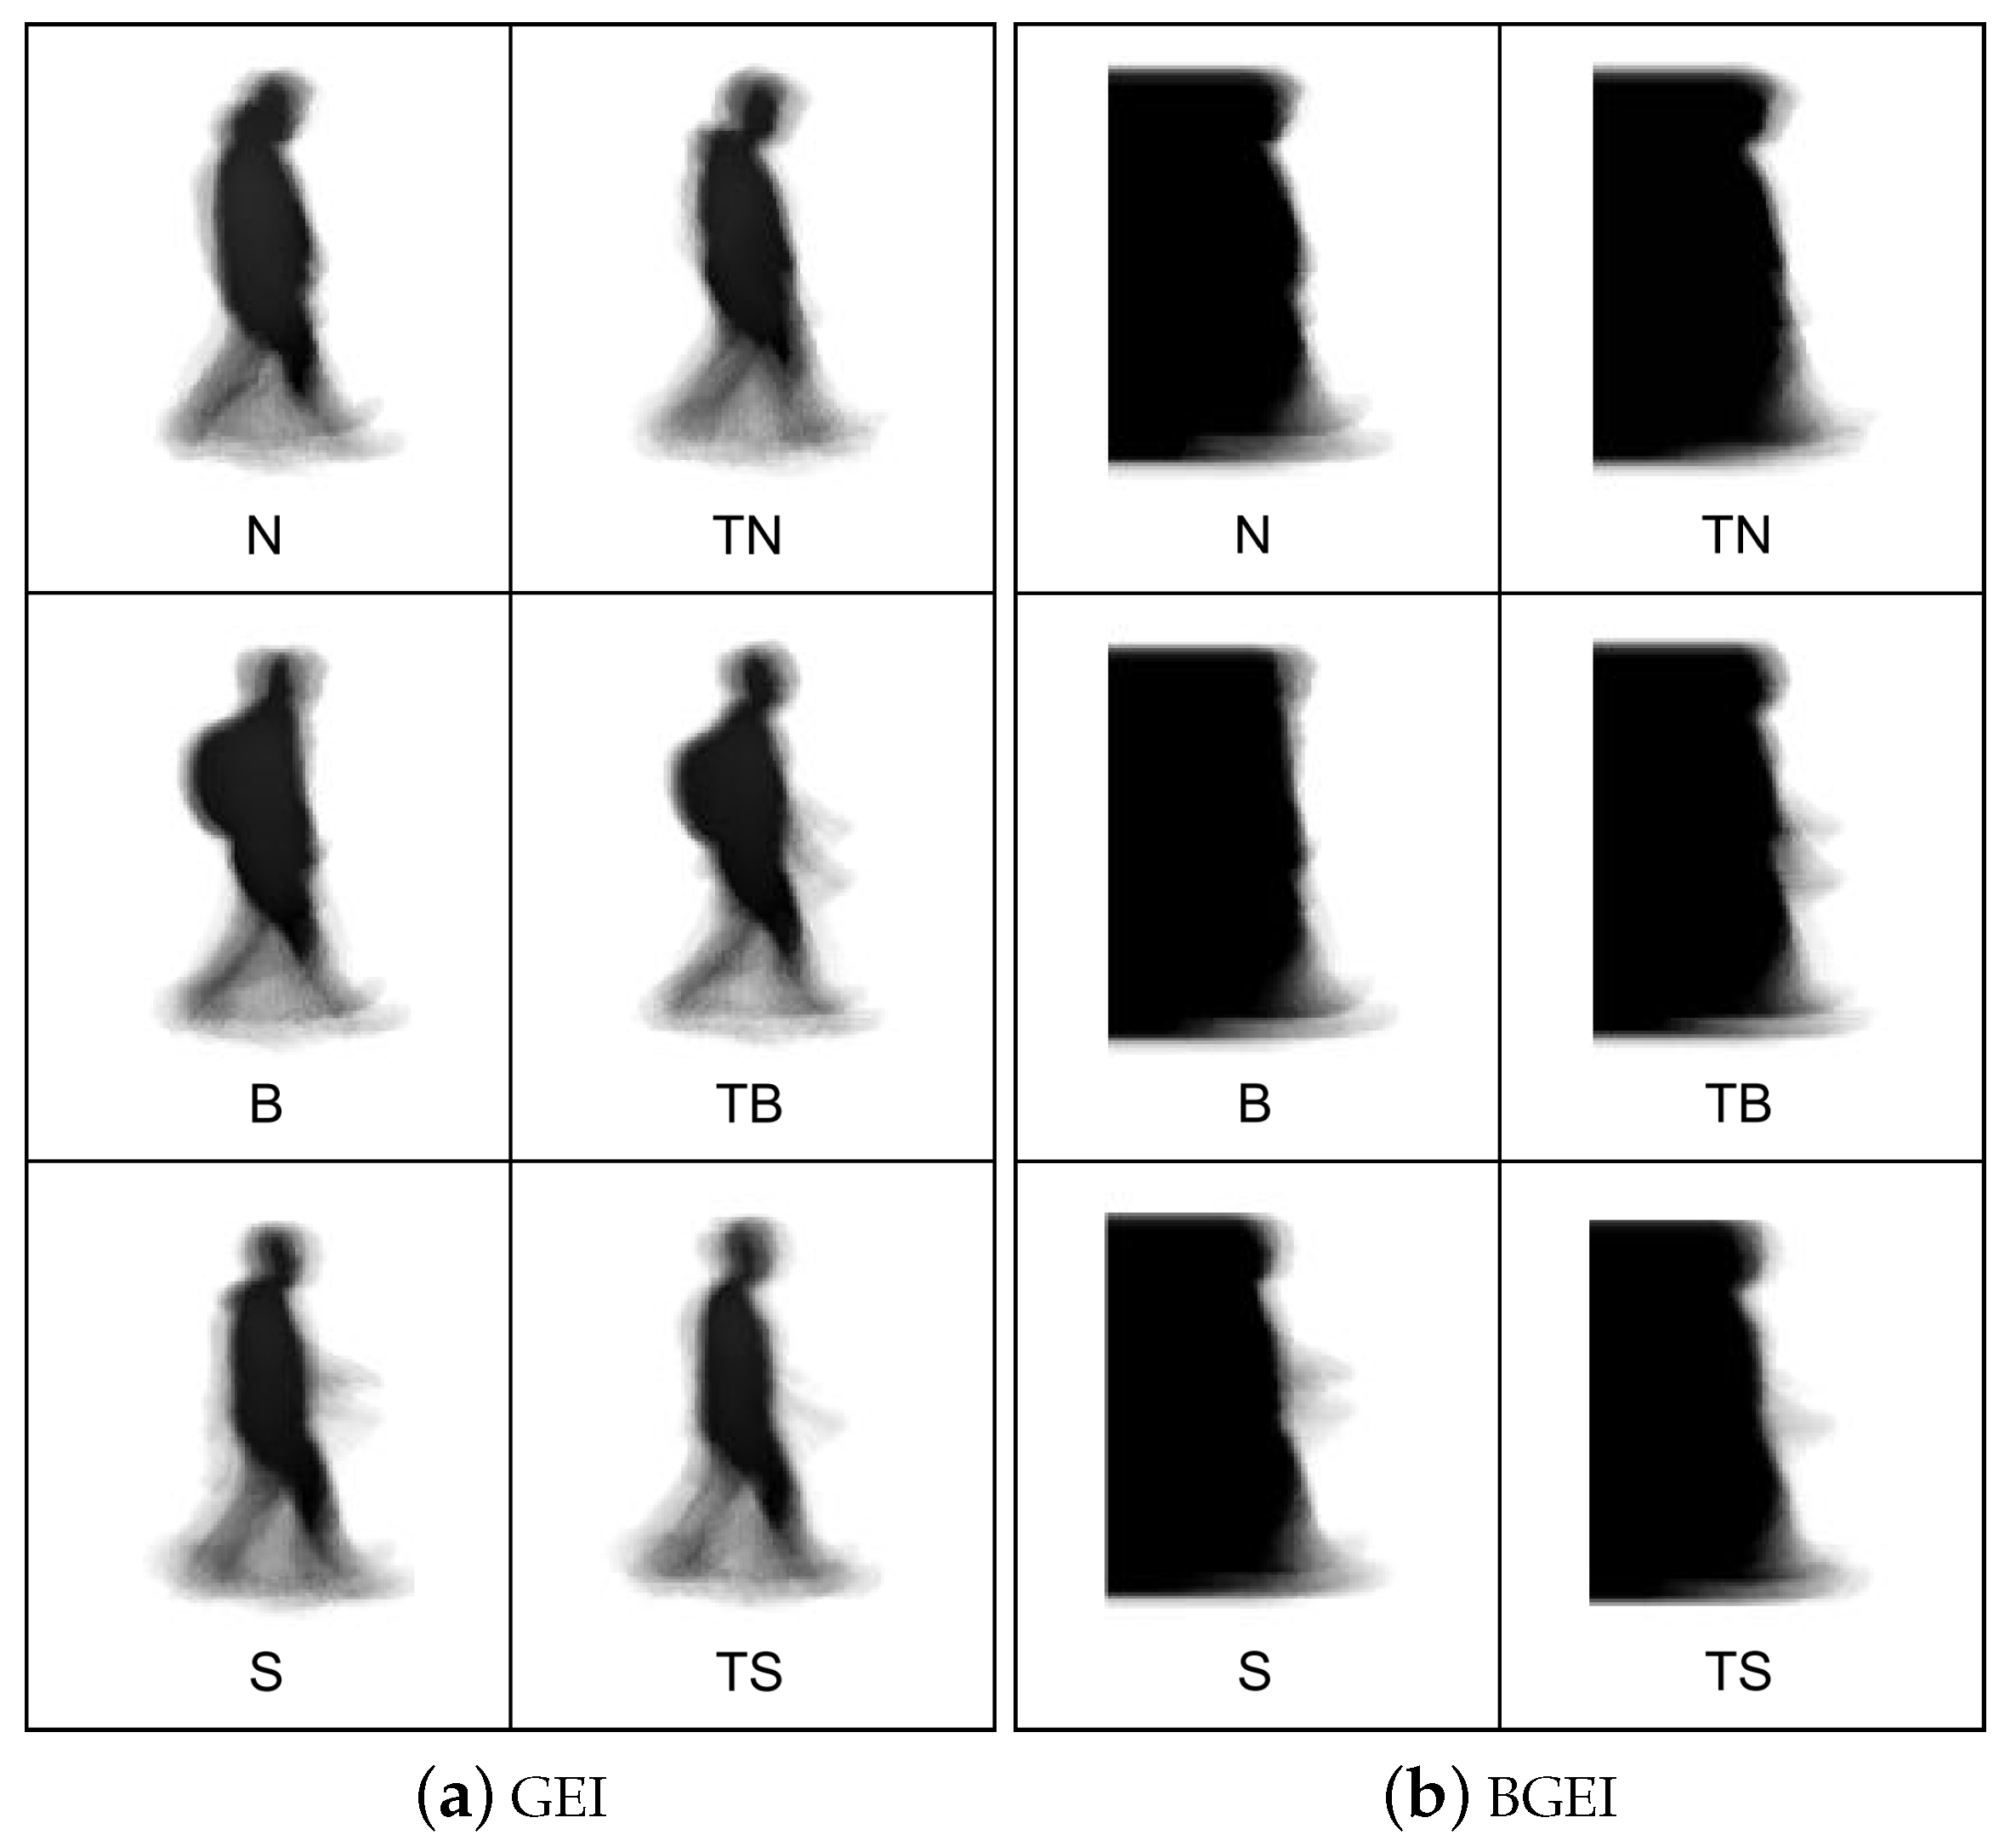
The silhouettes were extracted from cropped and normalized depth images which were provided with the dataset in raw format. From the extracted silhouettes of each recording, one GEI image and one BGEI image were constructed using the processing described before. Examples of resulting GEI and BGEI images of a person are depicted in
Figure 9a,b, respectively.
Overall, 3370 GEI images and the same number of BGEI images were created. The exact number of GEI and BGEI features per variation and type available for the experiments is depicted in
Table 1. The resolution of the GEI and BGEI images used in the experiments is
.
5.1.3. Height Distributions
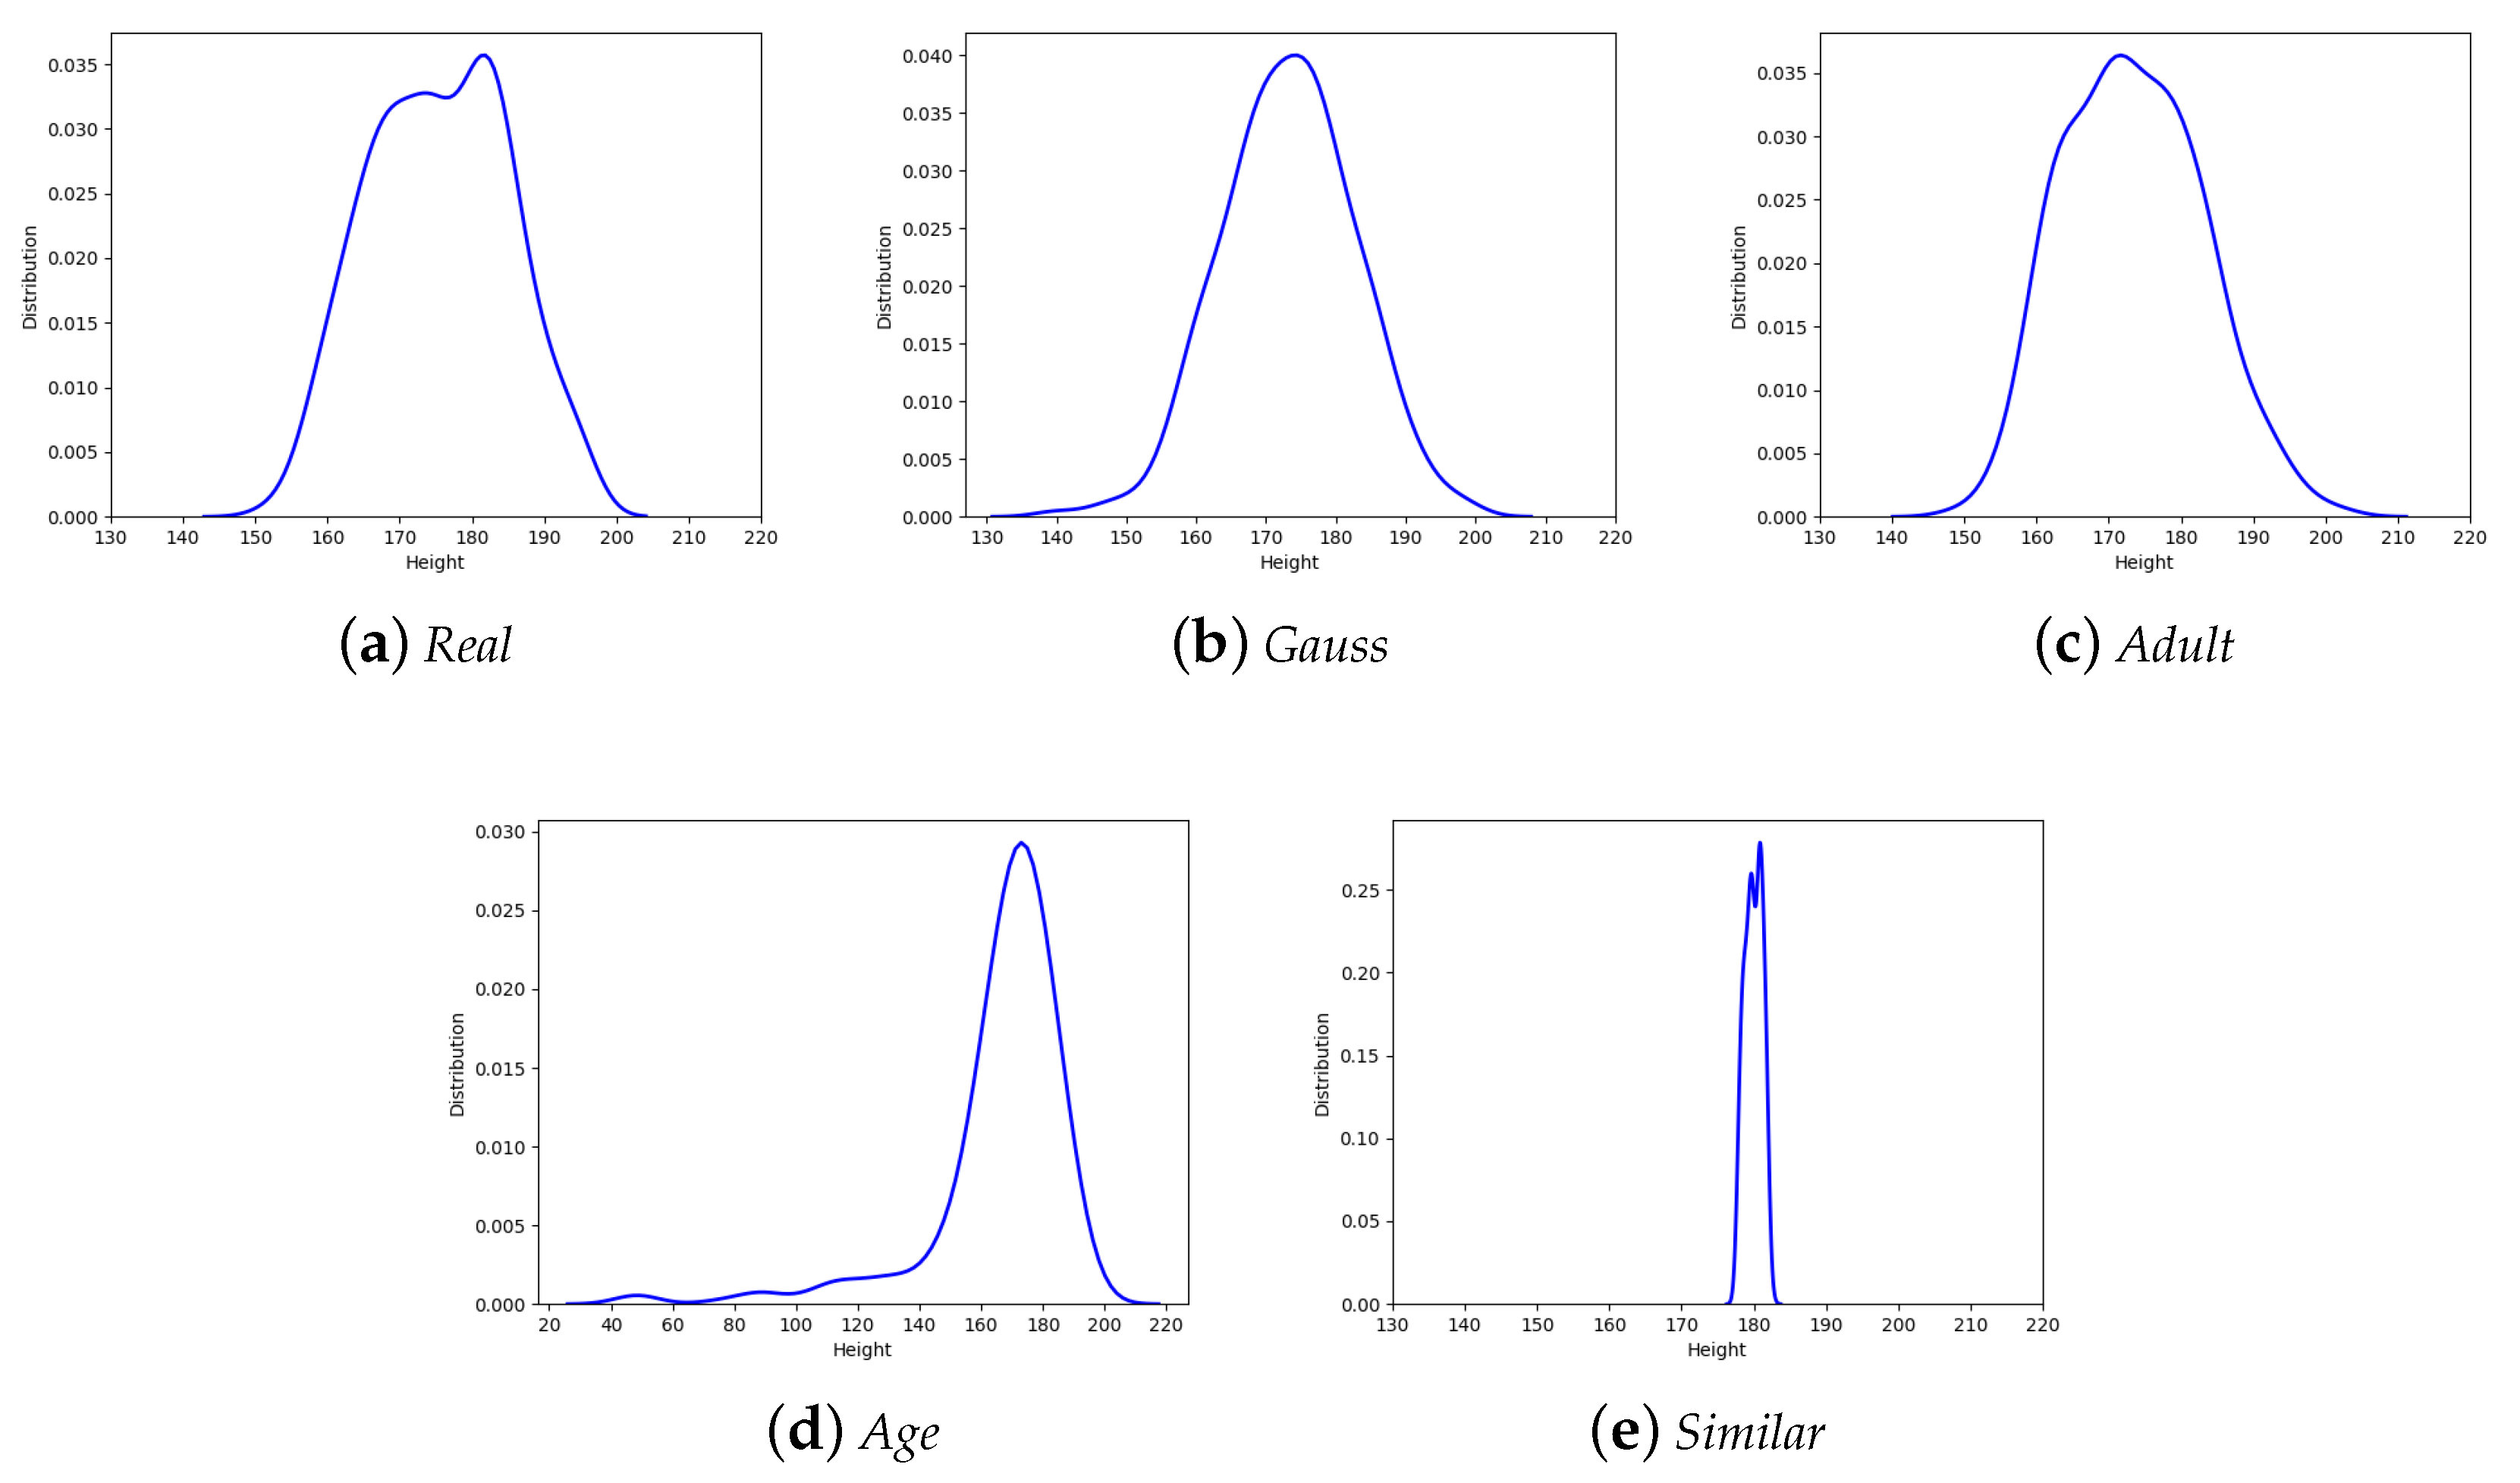
The recognition accuracy of classification methods that use the height feature varies depending on the population size (number of subjects under test) and the height distribution of that population. To study the effect of the height feature on classification, five different height distributions were simulated. The goal was to consider height distributions that might be of interest in typical application scenarios.
The considered height distributions are presented in
Figure 10.
The
Real (
Figure 10a) height distribution corresponds to the actual height distribution of the subjects in the TUM GAID dataset. The
Gauss (
Figure 10b) height distribution is pure Gaussian distribution included for easy testing and comparability. In the experiments, the selected average height and the corresponding standard deviation were 173.2 cm and 9.5 cm. This distribution is also highly representative of the height distribution of same sex adults of a particular demographic. The
Adult (
Figure 10c) height distribution is representative of a population of adult subjects of a particular demographic. The
Age (
Figure 10d) height distribution is representative of a population with individuals of all ages (generic population including adults and children) of a particular demographic. The
Similar (
Figure 10e) height population is representative of individuals with similar heights as is sometimes the case in specific applications such as people recognition in sports, military, schools, etc.
The height estimation error was simulated in accordance with the results reported in [
22]. To the estimated height feature of each sample, a random error
of its value was added across all height distributions.
5.1.4. Classification
All experiments were performed on three different population sizes, a population with 32 subjects, here arbitrarily denoted as
small; a population with 155 subjects, denoted as
medium; and a population with 305 subjects, denoted as
large. The rationale for choosing these particular values was that the number of subjects for the
large population size corresponds to the maximum number of subjects available in the dataset at the moment of writing, while the values for
small and
medium were chosen with comparability with the state-of-the-art [
5] in mind. In the
large population case, the recognition was performed between 305 individuals, making it a 305-class classification task with a chance level of
for all experiments. In the
medium and
small cases, the recognition was performed between 155 and 32 individuals, making it a 155-class and 32-class classification task with chance levels of
and
, respectively, for all experiments.
Following the ideas presented in [
5], a GAID dataset was split into training and test subsets. The training subset was comprised of the first four GEI silhouettes from
normal variation while the test subset contained all remaining GEI silhouettes, two from
normal variation, two from
backpack variation, and two from
shoes variation for each of the 305 subjects in the dataset. Test subset also contained six
time normal, two
time backpack, and two
time shoes variations for each of the 32 subjects in a subset recorded for a second time. The training and testing sets are balanced, i.e., the same number of samples from each class were used in both cases.
Four different classification algorithms were used for classification and independently evaluated: k-nearest neighbors (kNN), Support Vector classification (SVC), Random forest classification (RFC), and Gaussian Naive Bayes (GNB). After training, each of the samples from the test subset was scored and results were split by the variation of the recorded sample (N, B, S, TN, TB, and TS) for each of the methods tested.
Tested methods included a method based only on the height feature (Height), a method based on GEI feature (GEI), a method based on BGEI feature (BGEI), Height-GEI integration (HGEI-i), Height-GEI fusion (HGEI-f), Height-BGEI integration (HBGEI-i), and Height-BGEI fusion (HBGEI-f).
For each sample, the classification based on GEI, BGEI, and Height features was done independently from each other, as well as the classification based on HGEI-i and HBGEI-i. HGEI-f and HBGEI-f methods used the results from GEI and Height classification.
5.2. Results
The classification algorithms k-nearest neighbors (kNN), Support Vector classification (SVC), Random forest classification (RFC), and Gaussian Naive Bayes (GNB) were tested on previously described height and gait features. The heights from the
(
Figure 10) height distribution and gait features after dimensionality reduction (
Figure 4) were used, as well as the integrated features of the HGEI-i method. The performance of the considered classification algorithms with gait features is shown in
Table 2 using the Accuracy, Precision, Recall, F1 Score, and Kappa metrics. The kNN algorithm slightly outperformed the other classification algorithms and was, therefore, selected for the classification step in the methods presented hereafter.
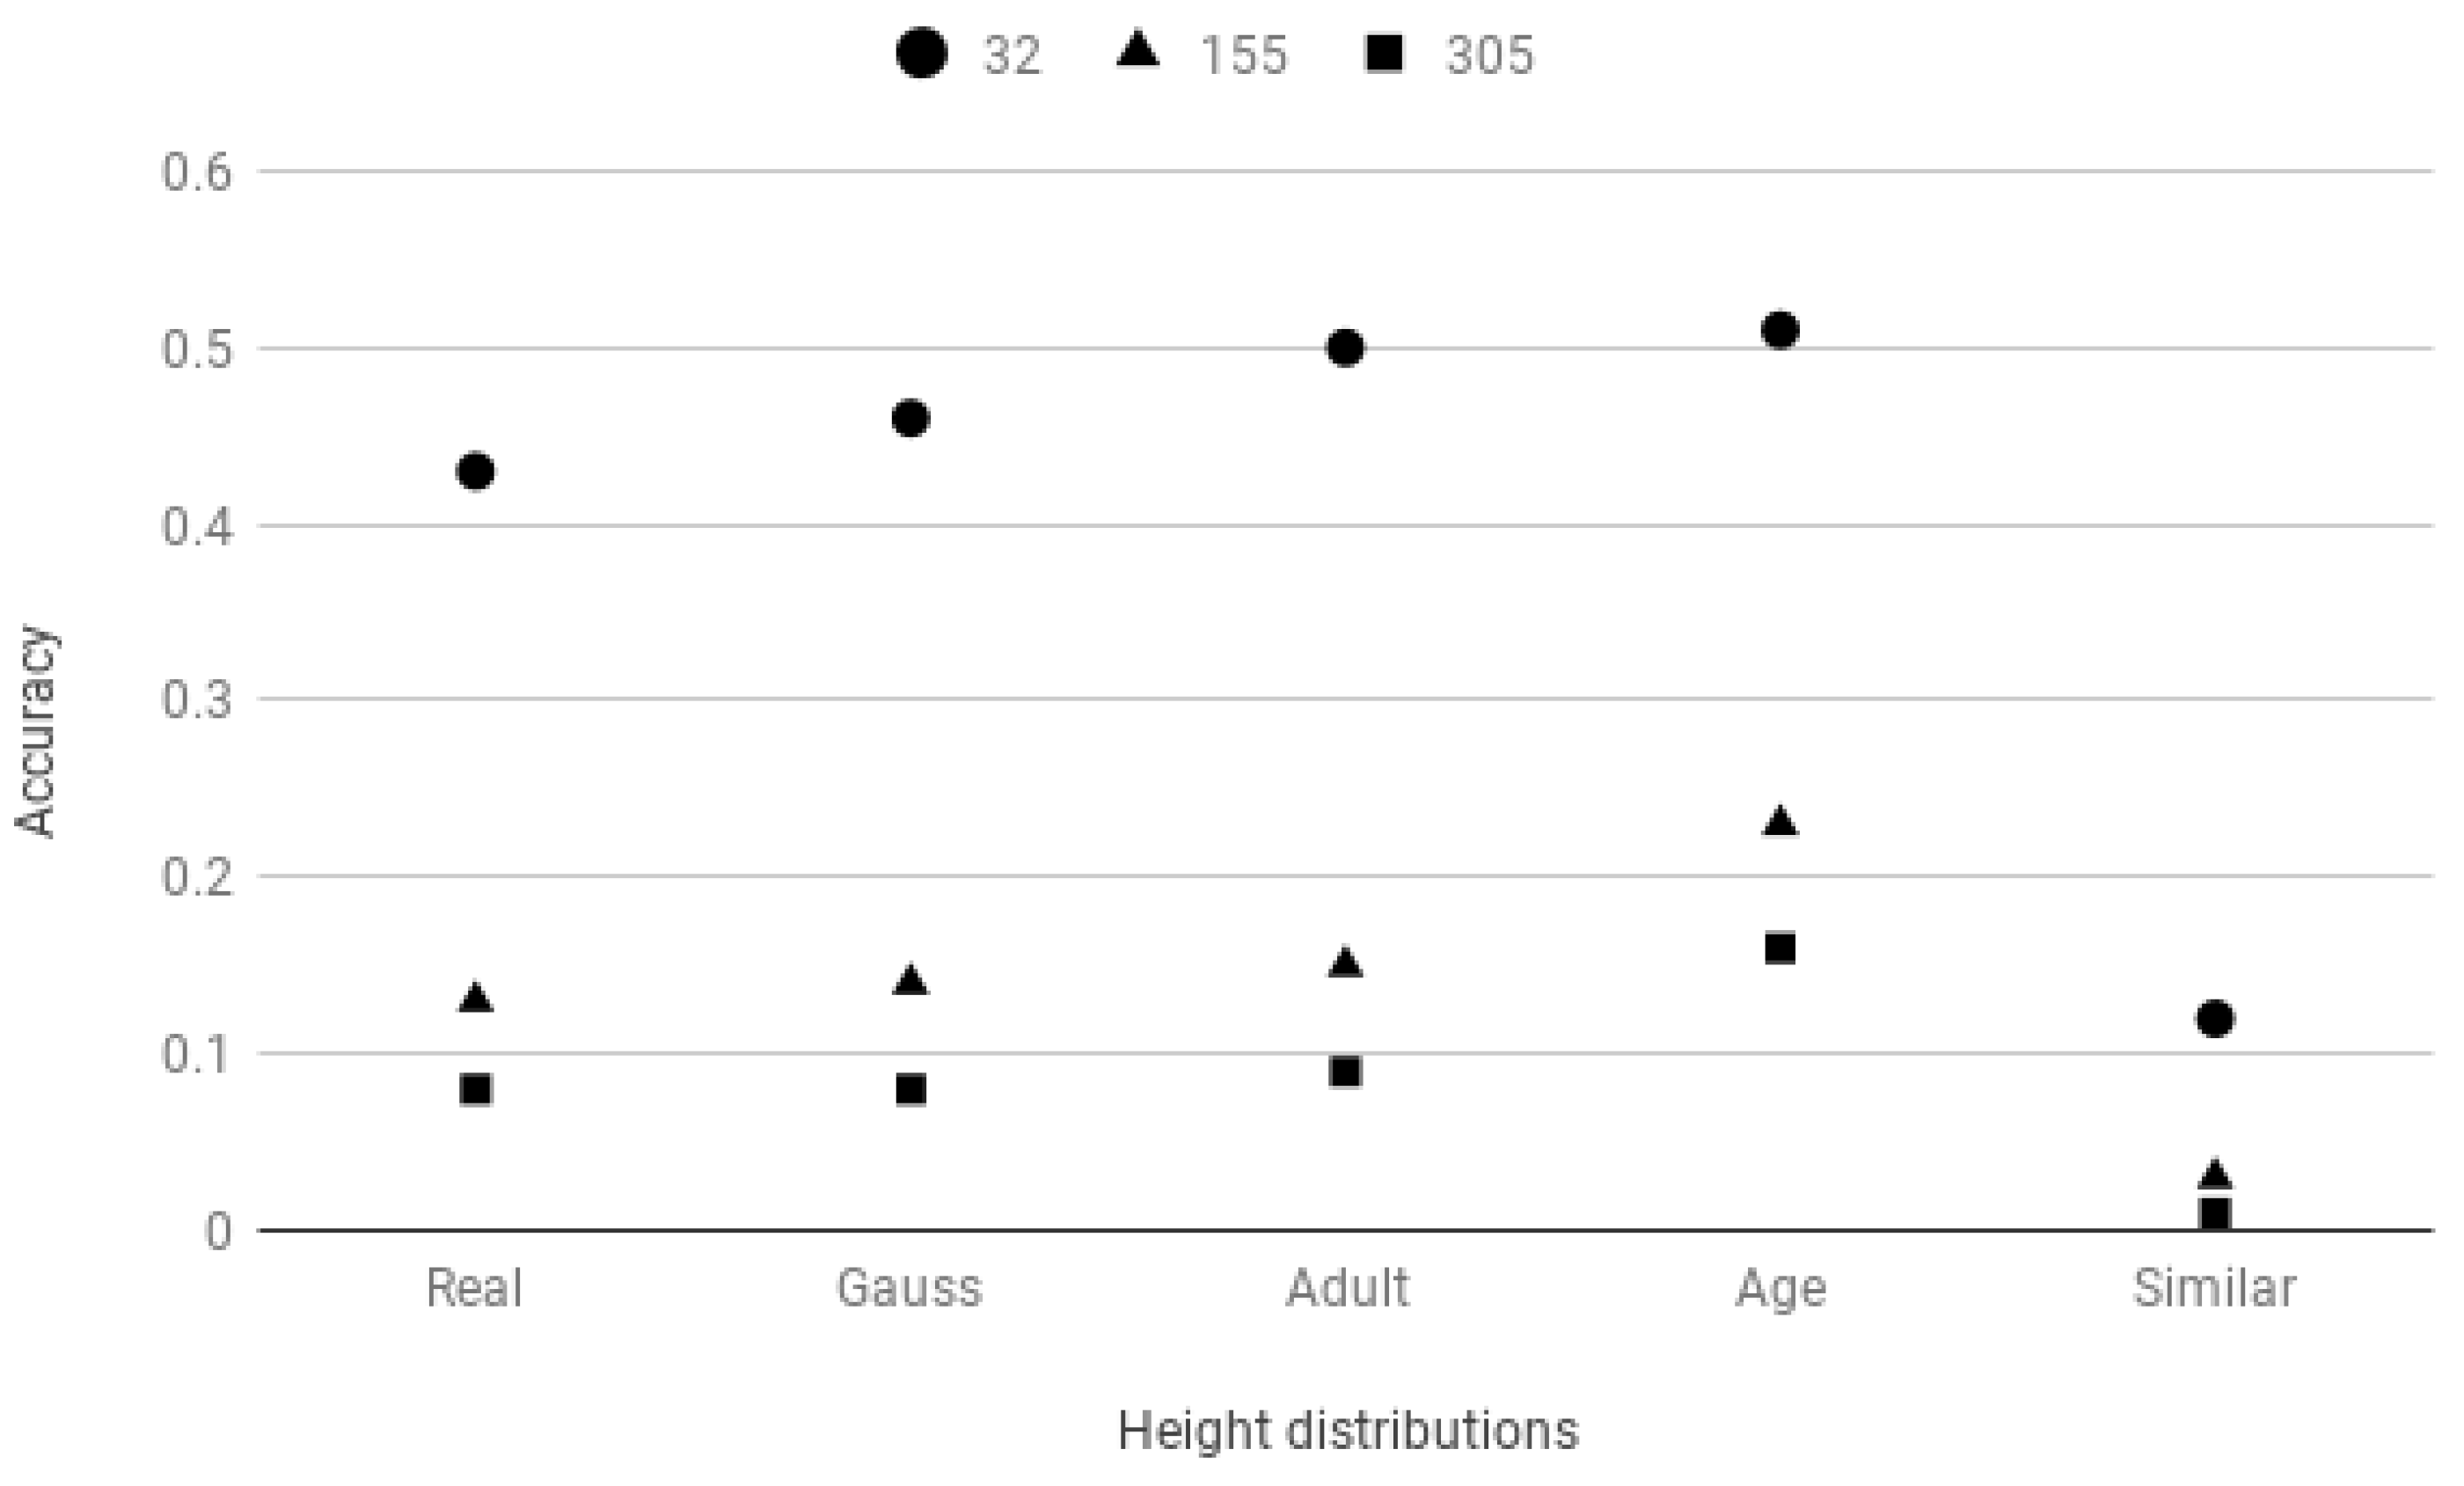
The effects that height distribution and size of a population have on the recognition accuracy of the classification that uses the height feature are visible in
Figure 11. The method performs poorly for medium and large population sizes. As expected, the worst performance for the Height method is for the population with
Similar height distribution, containing individuals with similar heights, while, for larger population sizes, the best is for
Age height distribution, which contains individuals of different ages with a varied height distribution. With average recognition accuracy of
for
small,
for
medium, and
for
large populations, the Height method, using only the height feature for classification, significantly underperforms the other methods, irrespective of the particular population height distribution.
In
Table 3, the Accuracy, F1 score, and Kappa performance indexes for the above mentioned approaches (Height, GEI, HGEI-i, HGEI-f, BGEI, HBGEI-i, and HBGEI-f) evaluated on TUM GAID dataset with kNN classification algorithm using the
normal,
backpack,
shoes,
time normal,
time backpack, and
time shoes variations are presented for
small,
medium, and
large populations, respectively. The
height distribution was used. For comparison,
Table 4 contains the same results in the case of
height distribution.
GEI and BGEI methods have similar recognition performance. Considering the average recognition accuracy for small, medium, and large populations, BGEI consistently slightly underperforms GEI. The performance of GEI and BGEI methods, trained using samples from normal variation, slightly decreases for backpack and shoes variations. The decrease in recognition accuracy is considerable when samples of individuals taken on different occasions (time normal, time backpack, and time shoes) are used. This is true across all the tested scenarios, i.e., for small and large population sizes, and all variations. The average decrease in recognition accuracy is for time normal, for time backpack, and for time shoes variants.
The decrease in performance for time normal, time backpack, and time shoes variations is not so marked for the Height method, which is less susceptible to changes in appearance.
The methods that combine appearance based gait features and the height feature performed best in all cases. HGEI-i shows the best overall accuracy across different populations and different variants with , , and on average for small, medium, and large populations, respectively, followed by HGEI-f with , , and .
5.3. Discussion
The classification based on height feature alone shows poor results if compared to other approaches. This is expected for a large population where many individuals have similar height. This is particularly true considering that the average height of a person over a gait cycle cannot be estimated accurately for a variety of reasons, related to the sensor and method used and environment conditions, as well as variations in the person’s posture, shoes, etc., thus confusion between persons of similar height is to be expected. Comparing the classification results using human height alone for populations with different height distributions between individuals further confirms that height feature is not adequate for cases when multiple individuals have similar heights.
The results from the experiments confirm the expected overall and relative performance of Height, GEI, and BGEI features taken alone. The classification based on gait features using only the appearance based GEI method shows results consistent with those reported in the literature [
5], when a population of similar size is considered (155 [
5] and 176 [
1]). Differently from GEI feature, which is derived from depth information of the entire silhouette, BGEI is constructed using front facing depth information only. This is by design to make the construction of BGEI possible from front and lateral views. With less information available for classification than GEI, and considering that the dataset used in this work contains only side view experiments, view invariant BGEI feature shows slightly less accurate classification results throughout the experiments.
The proposed methods (HGEI-i, HGEI-f, HBGEI-i, and HBGEI-f) that combine height with appearance based features improved recognition accuracy significantly. The average increase in the recognition accuracy of HGEI-i with respect to GEI was for small, for medium, and for large population size. In general, between the two proposed methods, Height-GEI integration (HGEI-i) outperforms the Height-GEI fusion (HGEI-f) and can be the preferred choice. In some cases, for example when the population size is small, the recognition accuracy based on the height feature may be sufficiently high to make the late fusion efficient to a point of outperforming the HGEI-i method.
6. Conclusions
Appearance based gait recognition methods start with the extraction of silhouettes from camera video streams. With the introduction of 3D cameras providing both depth and RGB video streams, silhouettes can be extracted from either, and the information on the size of the subject can also be concurrently estimated in real-time, using the depth information now available. It is therefore straightforward to combine the two different features in order to improve the recognition performance: gait related features and the feature related to the size of the subject, such as the height feature.
In these studies, two approaches were proposed and studied that combine height with appearance based methods such as GEI. An extensive experimental evaluation of the proposed methods was performed and the results were presented, analyzed, and discussed. In addition to the GEI feature, the approaches were also applied and compared to the more recently proposed BGEI feature, which can be constructed using the available 3D information, irrespective of the direction of walk relative to the camera (i.e., from both front and lateral views). Both proposed methods outperformed classic appearance based gait recognition based on GEI, while remaining suitable for real-time execution. The evaluation was performed considering populations with different sizes and height distributions and for different variations of subjects.
In summary, the results from the study confirmed the hypothesis stated in the Introduction and provided clear insights on recognition accuracy gains that can be obtained by combining height and appearance based features for gait recognition.
Future work will study the application of methods based on convolutional neural networks on combined appearance and depth derived features and the extension of the results to multimodal fusion considering additional audio and video modalities.
