You are currently viewing a new version of our website. To view the old version click .
Applied Sciences
  • Article
  • Open Access

14 December 2019

Fatigue Performance of Tunnel Invert in Newly Designed Heavy Haul Railway Tunnel

,
,
,
and
1
School of Civil Engineering, Central South University, Changsha 410075, China
2
School of Civil Engineering, Guizhou University, Guiyang 550025, China
3
Key Laboratory of Engineering Structure of Heavy Haul Railway (Central South University), Changsha 410075, China
*
Author to whom correspondence should be addressed.

Abstract

The Haoji railway in China is the longest heavy haul railway in the world, including 235 tunnels located along the 1837 km railway. With the increasing axle load of the new line and the basal deterioration of the existing heavy haul railway in China, studying the fatigue performance of the newly designed tunnel structure is essential. To study the coupling effect of the surrounding rock pressure and 30 t axle load train, in this study, we combined three-dimensional numerical simulation and three-point bending fatigue tests to investigate the fatigue performance of the basal structures. The results of numerical simulation indicate that the center of the inverted arch secondary lining is the position vulnerable to fatigue in the lower tunnel structures; the surrounding rock pressure performance exerts a stronger influence on the stress state of the vulnerable position than the dynamic train loads. The S–N formula obtained from the experiment showed that the fatigue life of tunnel bottom structures decreases with increasing surrounding rock pressure and dynamic load. In typical grade V surrounding rock and 30 t axle loads, fatigue failure will not occur in the newly designed tunnel bottom structures within 100 years if bedrock defects are lacking and pressure of surrounding rock is not excessive.

1. Introduction

Researchers reported that fatigue would not occur in the tunnel basal structures. Rickstal et al. [1] conducted a series of fatigue tests based on the measured vehicle loads in highway tunnels, and the results revealed that the floor was still intact after 6 million cycles. Through scale model tests, Wang et al. [2] stated that fatigue failure of tunnel bottom structures would not occur under the long-term action of a high-speed train. Han et al. [3] and Qian et al. [4] indicated that segments of the shield tunnel bottom would be stable for the designed service life (100 years) using fatigue tests.
The increase in train axle load can considerably increase the railway’s capacity and efficiency and reduce the transportation cost per unit freight [5]; however, tunnel basal degradation increases with increasing axle load and operation period [6]. For example, the Daqin heavy haul railway has the world’s highest annual freight volume (445 million tons in 2013 [7]). After more than 20 years of operation, basal deterioration is increasing over time in many tunnels, and most basal deterioration is appearing on the side of the full load track [8], which decreases the operational safety. Serious foundation subsidence and base rock voids have been found below the full load track in the Jundushan Tunnel along the Daqin railway [9]. Severe basal deterioration has also emerged along another heavy haul railway, the Shuohuang railway, including basement subsidence and rising soil on the side of the full load track, as observed in the Shuiquanwan and Daping tunnels, where the maximum settlement is 1.5 cm in the Shuiquanwan tunnel [8,10].
To study the mechanism of basal degradation and the fatigue performance of the base structure of heavy haul railway tunnels, through numerical simulation, Xue [11] indicated that a loose basement leads to a significant increase in the maximum tensile stress of the inverted arch filling (IAF) and fatigue damage would occur under the long-term operation of a 30 t/axle load heavy haul train. Based on a fatigue test, Liu et al. [12] also found that the lower the stiffness of the basement, the faster the development of the fatigue damage of tunnel inverted arches. Zhang et al. [13] stated that when a void exists in the base, the displacement and maximum principal stress of the tunnel bottom structure caused by train load increase significantly; then, based on the existing S–N curve of concrete tension fatigue, the calculation suggested that the fatigue life of the tunnel bottom structure is less than 100 years when the basal void is ≥2 m.
The fatigue performance of a structure is not only affected by the dynamic load, but also by the static load [14]. Under the same dynamic load, the fatigue life decreases with increasing static load. Stresses of tunnel bottom structures include the dynamic stress caused by the train load and the static stress caused by surrounding rock pressure. Existing research on fatigue performance of a railway tunnel has mainly focused on the influence of dynamic stress [1,2,3,4]; the influence of surrounding rock pressure on the fatigue performance of the tunnel bottom structure needs further study, especially in shallow buried weak surrounding rock with high surrounding rock pressure.
The Haoji railway in China is newly designed and the longest heavy haul railway in the world, with 235 tunnels located along the 1837 km railway. According to a survey, basal deterioration has appeared in many existing heavy haul railway tunnels, so analyzing the fatigue of the new line’s basal structures that are experiencing higher axle load and freight volume is essential.
In the investigation described in this paper, three-dimensional (3D) numerical simulation and three-point bending fatigue tests were combined to investigate the fatigue performance of tunnel bottom structures along the new line. The stress state of the most unfavorable position of the tunnel invert was determined using numerical simulation, and the static stress caused by the surrounding rock pressure and the dynamic stress caused by the train were identified. The fatigue test condition was then designed according to the stress state of the most unfavorable position to identify the fatigue lives of the specimens under different stress states. This paper studies the fatigue performance of a heavy haul railway tunnel under the action of high surrounding rock pressure and large axle load train and provides a reference for the durability design of heavy haul railway tunnel structures.

2. Mechanical Characteristics of the Heavy Haul Railway Tunnel Base

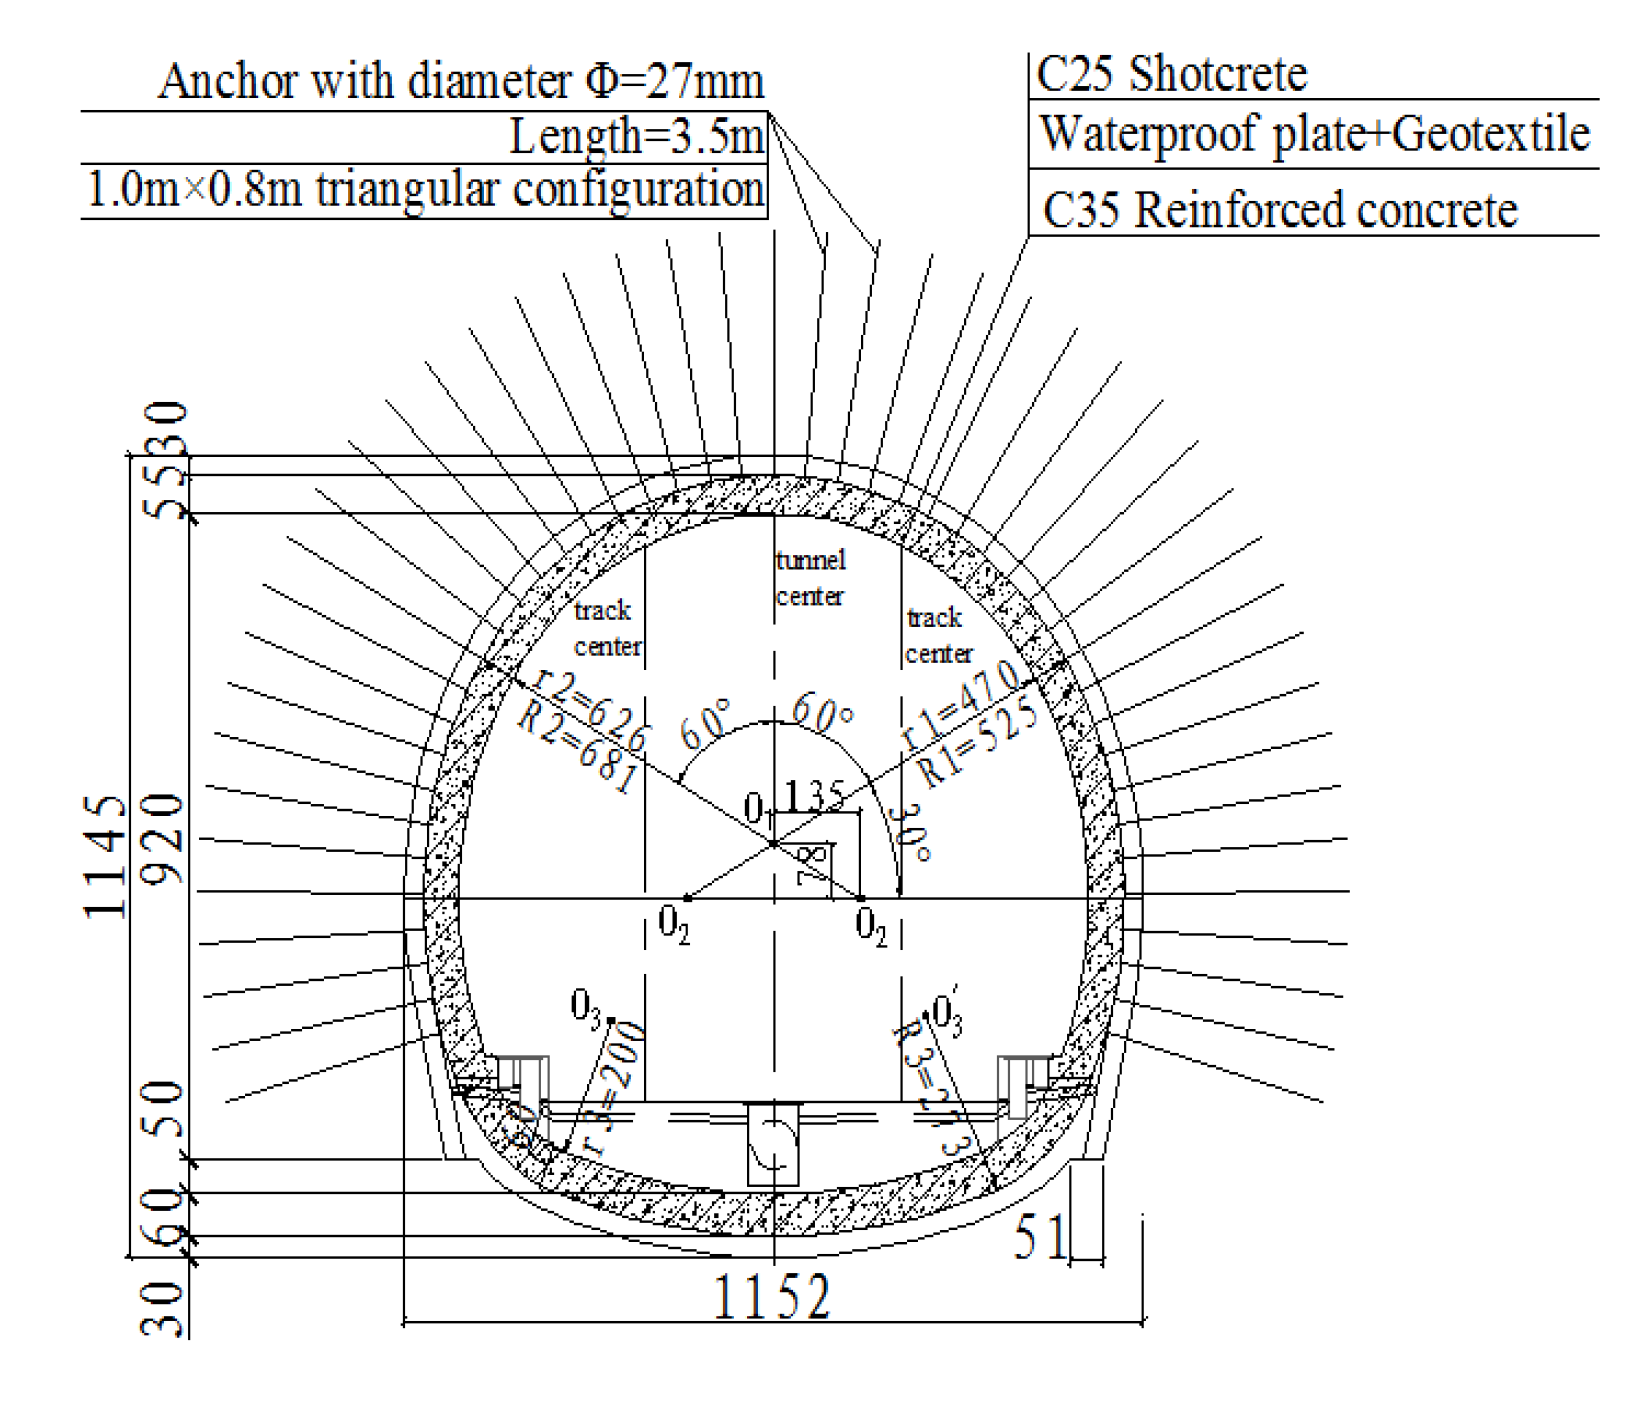
2.1. Engineering Background

The designed axle load of the Haoji heavy haul railway is 30 t and the annual freight volume is 200 million t, so about 2 million trains will travel along the railway in the 100 years of designed service life. The typical section diagram of the Haoji railway tunnel in grade V surrounding rock (Grade I is the best, grade VI is the worst) [15] is shown in Figure 1. The tunnel is 1152 cm high and 1145 cm wide.
Figure 1. Section structure of the heavy haul railway tunnel in grade V surrounding rock (cm).

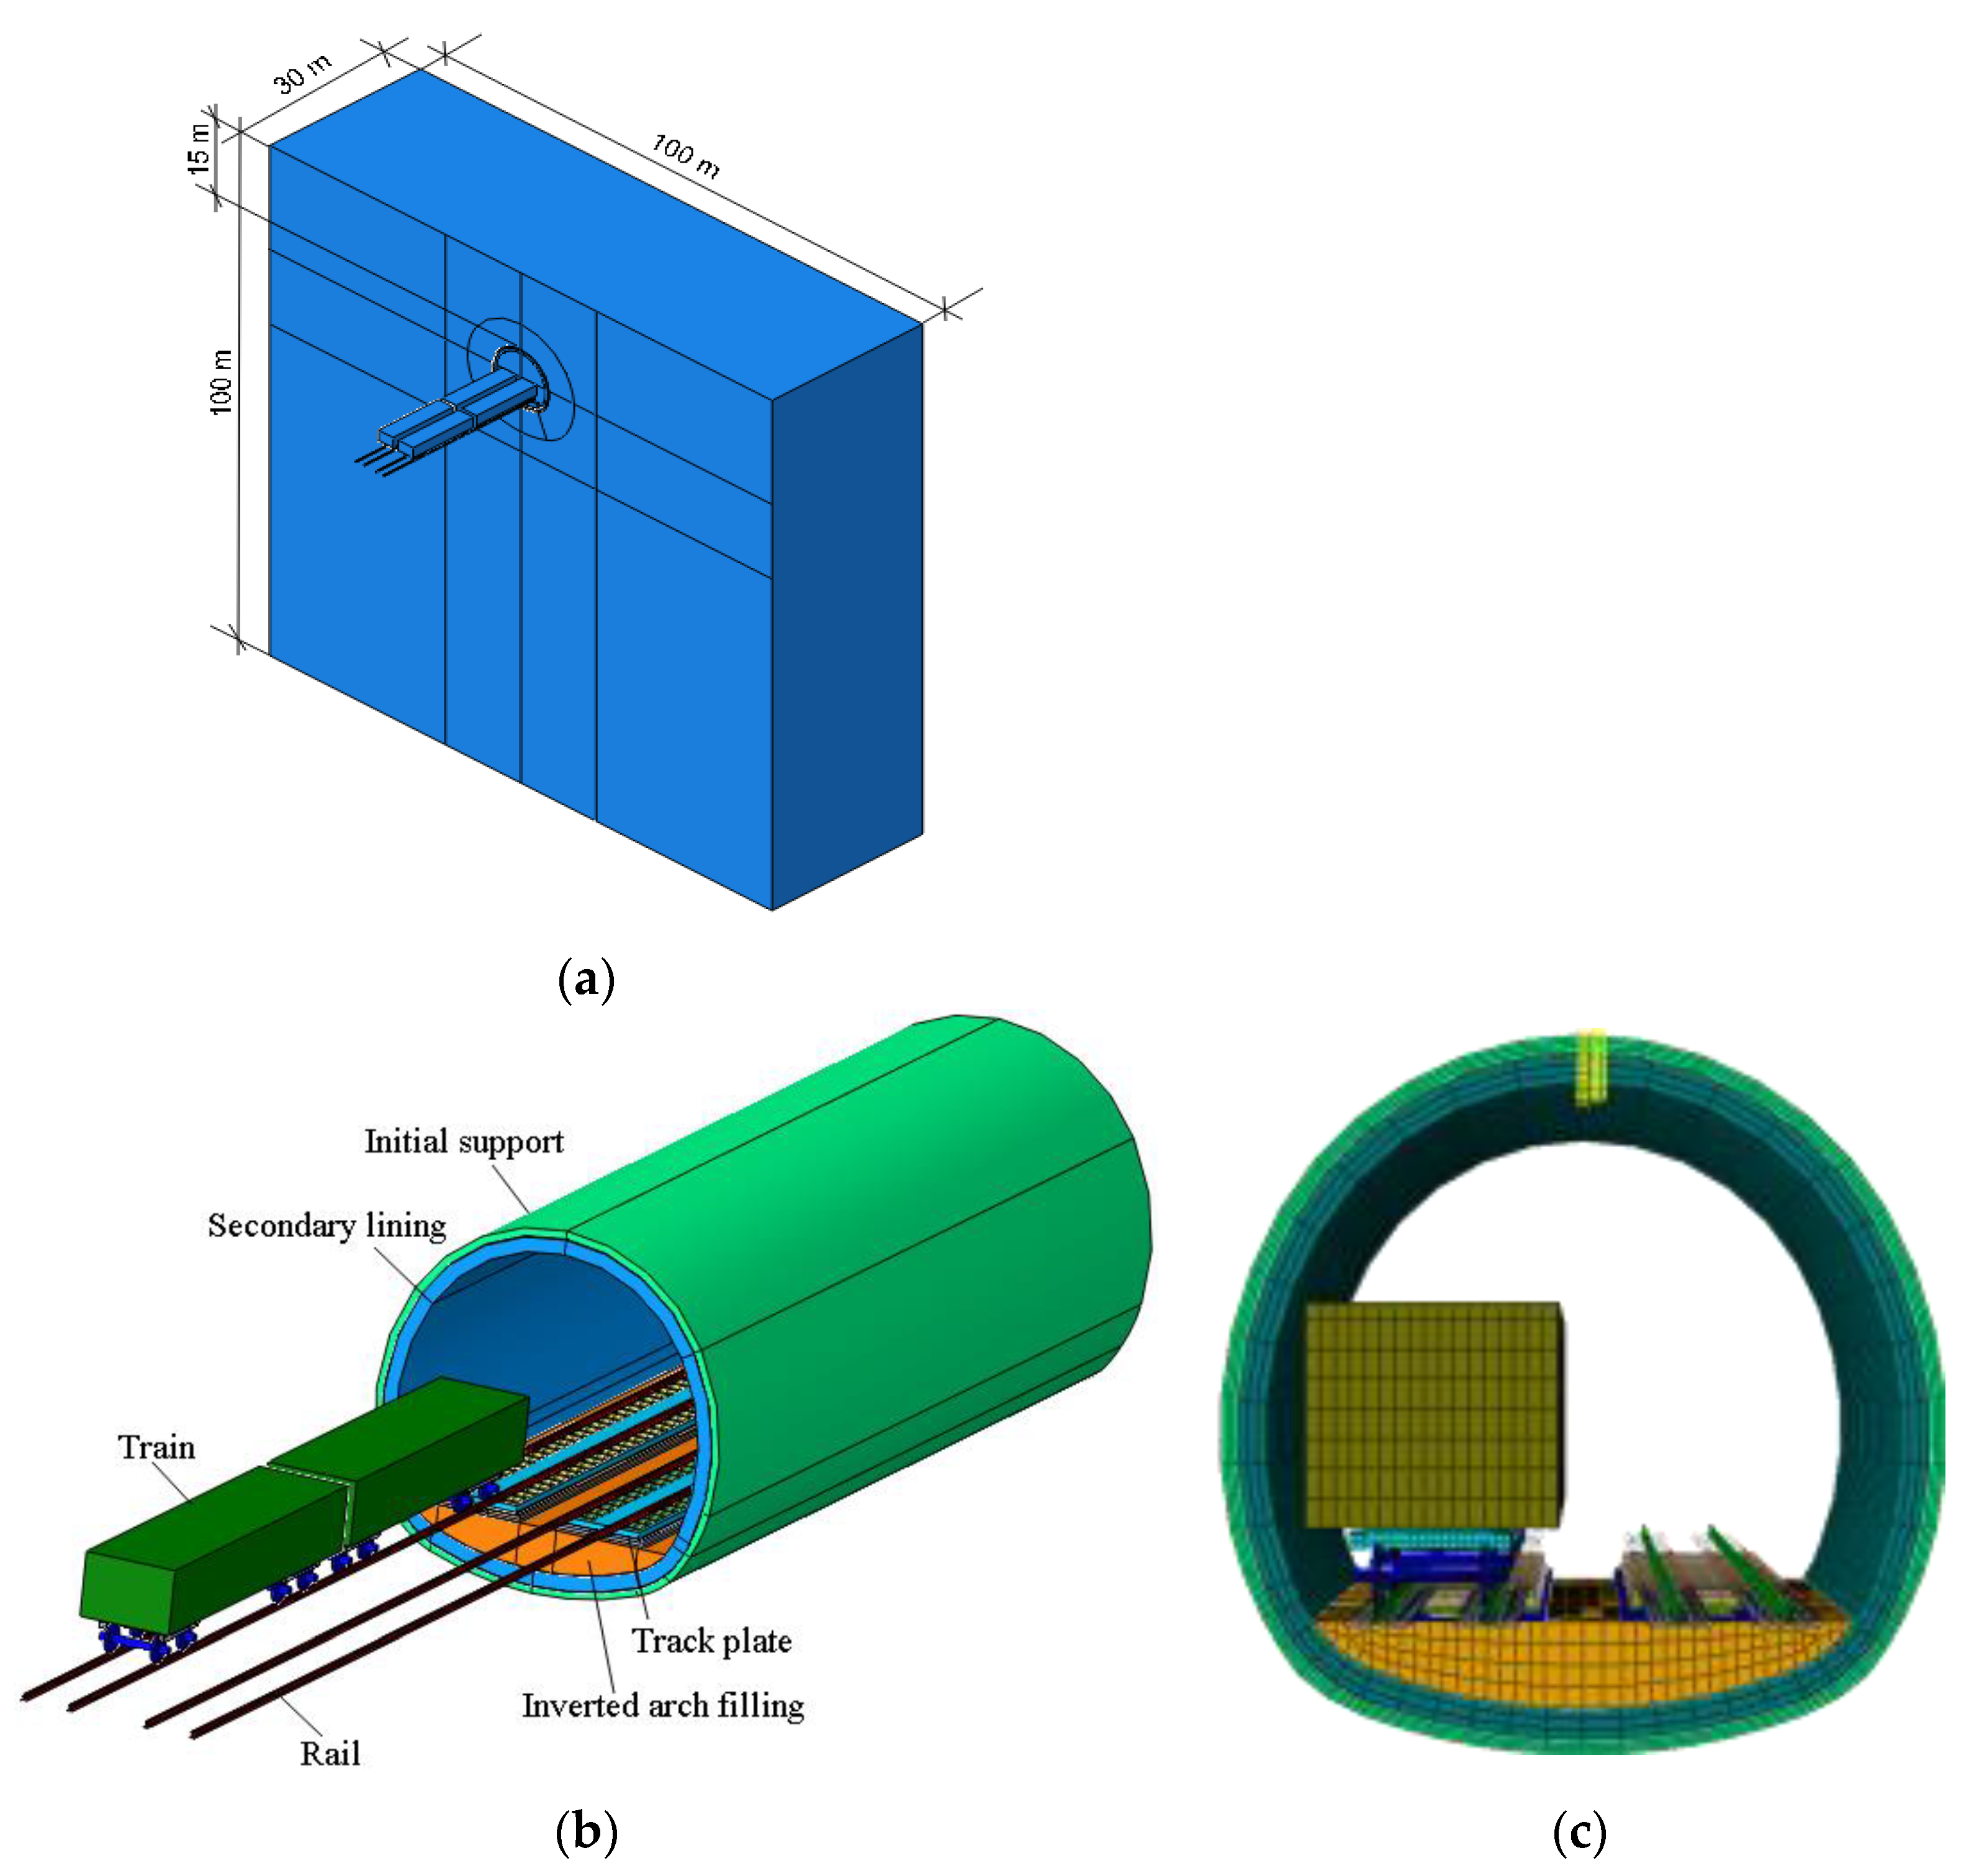
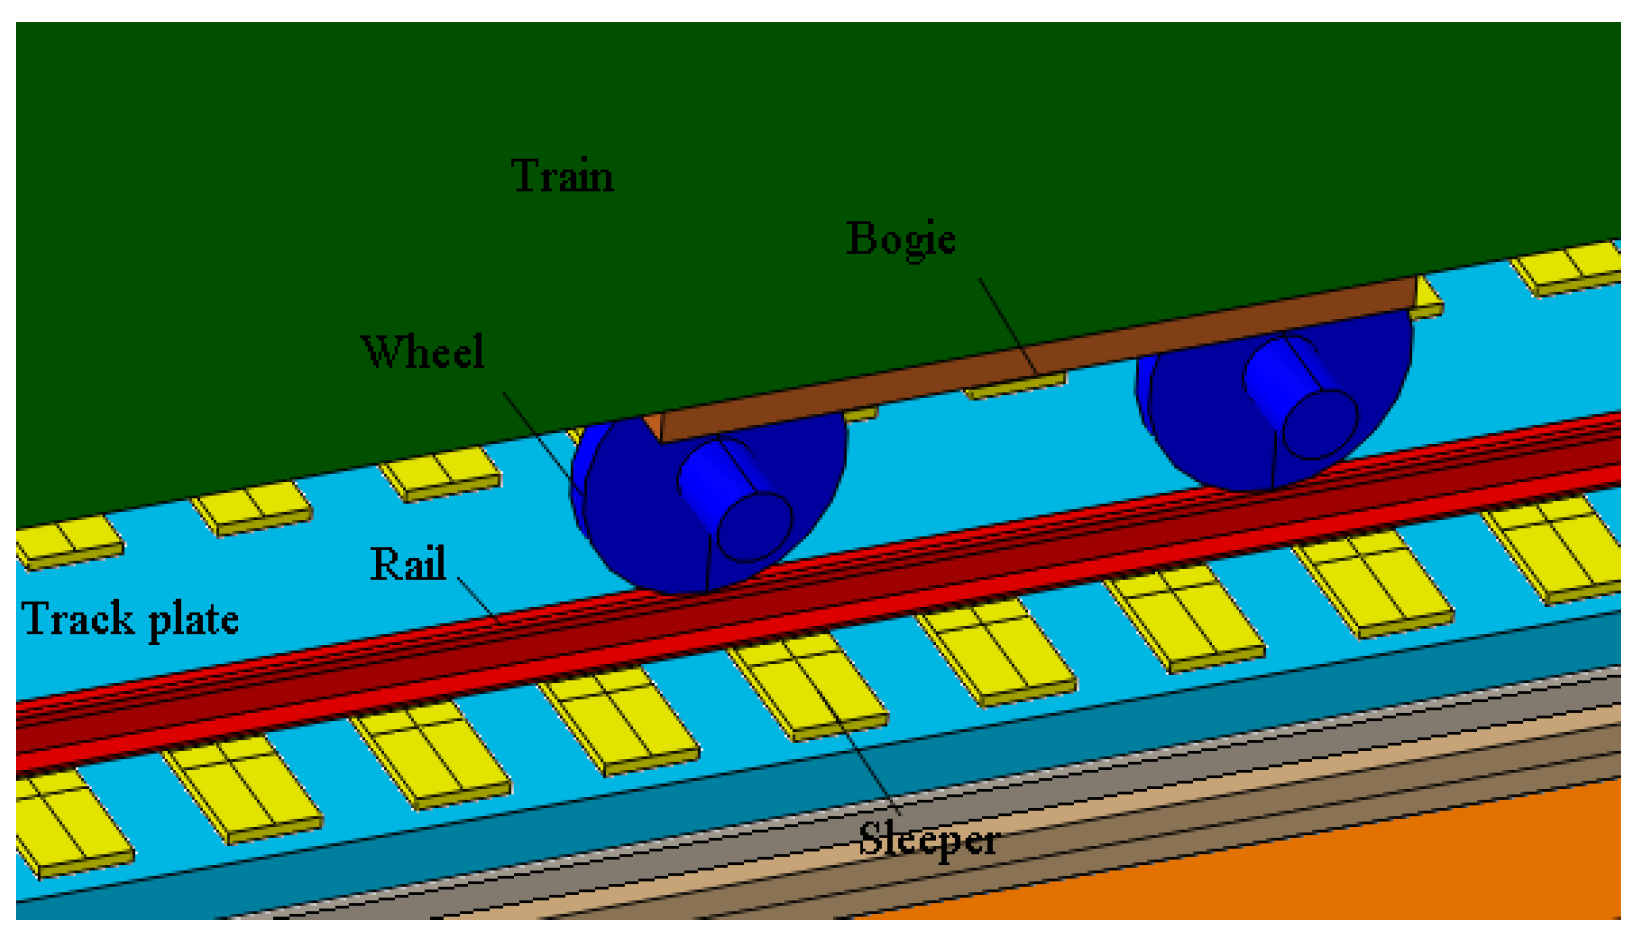
2.2. Numerical Model

Based on Figure 1, a refined numerical train–tracktunnel model was established by using finite element modeling (FEM) software ABAQUS (Dassault Simulia, Providence, RI, USA). The model size was 100 m wide, 100 m tall, and 30 m long. Forming a ground arch in a shallow tunnel is difficult, and, as a result, in general, its structural stress is more unfavorable compared to a deep tunnel [16], so the distance between the tunnel vault and the ground surface was set to 15 m [17]. The system anchor bolt was ignored in this model due to its limited effect in shallow tunnels. The tunnel lining, inverted arch filling, track plate base, flexible cushion, track plate, sleeper, rail wheel, boogie, and train wagon were all elastic materials; the surrounding rock was elastoplastic material; and C3D8R solid elements were adopted to simulate these components. We used a total of 187,822 elements for this mesh. The train–track–tunnel integrated model and its mesh are presented in Figure 2.
Figure 2. Numerical model of train–track–tunnel coupling system: (a) Model size; (b) structure of the model; and (c) mesh of numerical model.
Fixed boundary constraints were adopted on the sides of the model. The normal stiffness of the viscoelastic boundary [18] was 2.5 × 10⁶ N/m, normal damping was 1.29 × 10⁶ kg∙m−2∙s−1, shear stiffness was 5.0 × 10⁶ N/m, and shear damping was 6.35 × 10⁶ kg∙m−2∙s−1.
The mechanical parameters of the model materials were selected from the Chinese standard [19] and are listed in Table 1.
Table 1. Mechanical parameters.
The contact relationships are shown in Figure 3; the constraints between the wheel, bogie, and train wagon are rigid bodies. The tie constraints were used to simulate the relationship between other components of the model, such as rocks and initial support, initial support and secondary lining, filling layer and track plate, and sleeper and track plate.
Figure 3. Wheel–rail contact.
Surface-to-surface contact was adopted to simulate the relationship between wheel and track; the wheel was the predominant surface and the normal force between the wheel and the track was determined using Hertz nonlinear elastic contact theory [20], as shown in Equation (1):
P N ( t ) = [ 1 G δ N ( t ) ] 3 / 2
where P N ( t ) is the wheel/rail normal force (N), δ N ( t ) is the normal elastic compression of the wheel/rail contact point, t is the running time of the model, G is the constant for wheel/rail contact, LM is the wear type tread G = 3.86 R−0.115 × 10⁻³ (m/N2/3), and R is the wheel rolling radius (m).
The train axle load was 30 t, the Cartesian connector was adopted to simulate the relationship between track and sleeper, and the parameters are provided in Table 2.
Table 2. Spring stiffness and damping parameters of the 30 t axle load train.

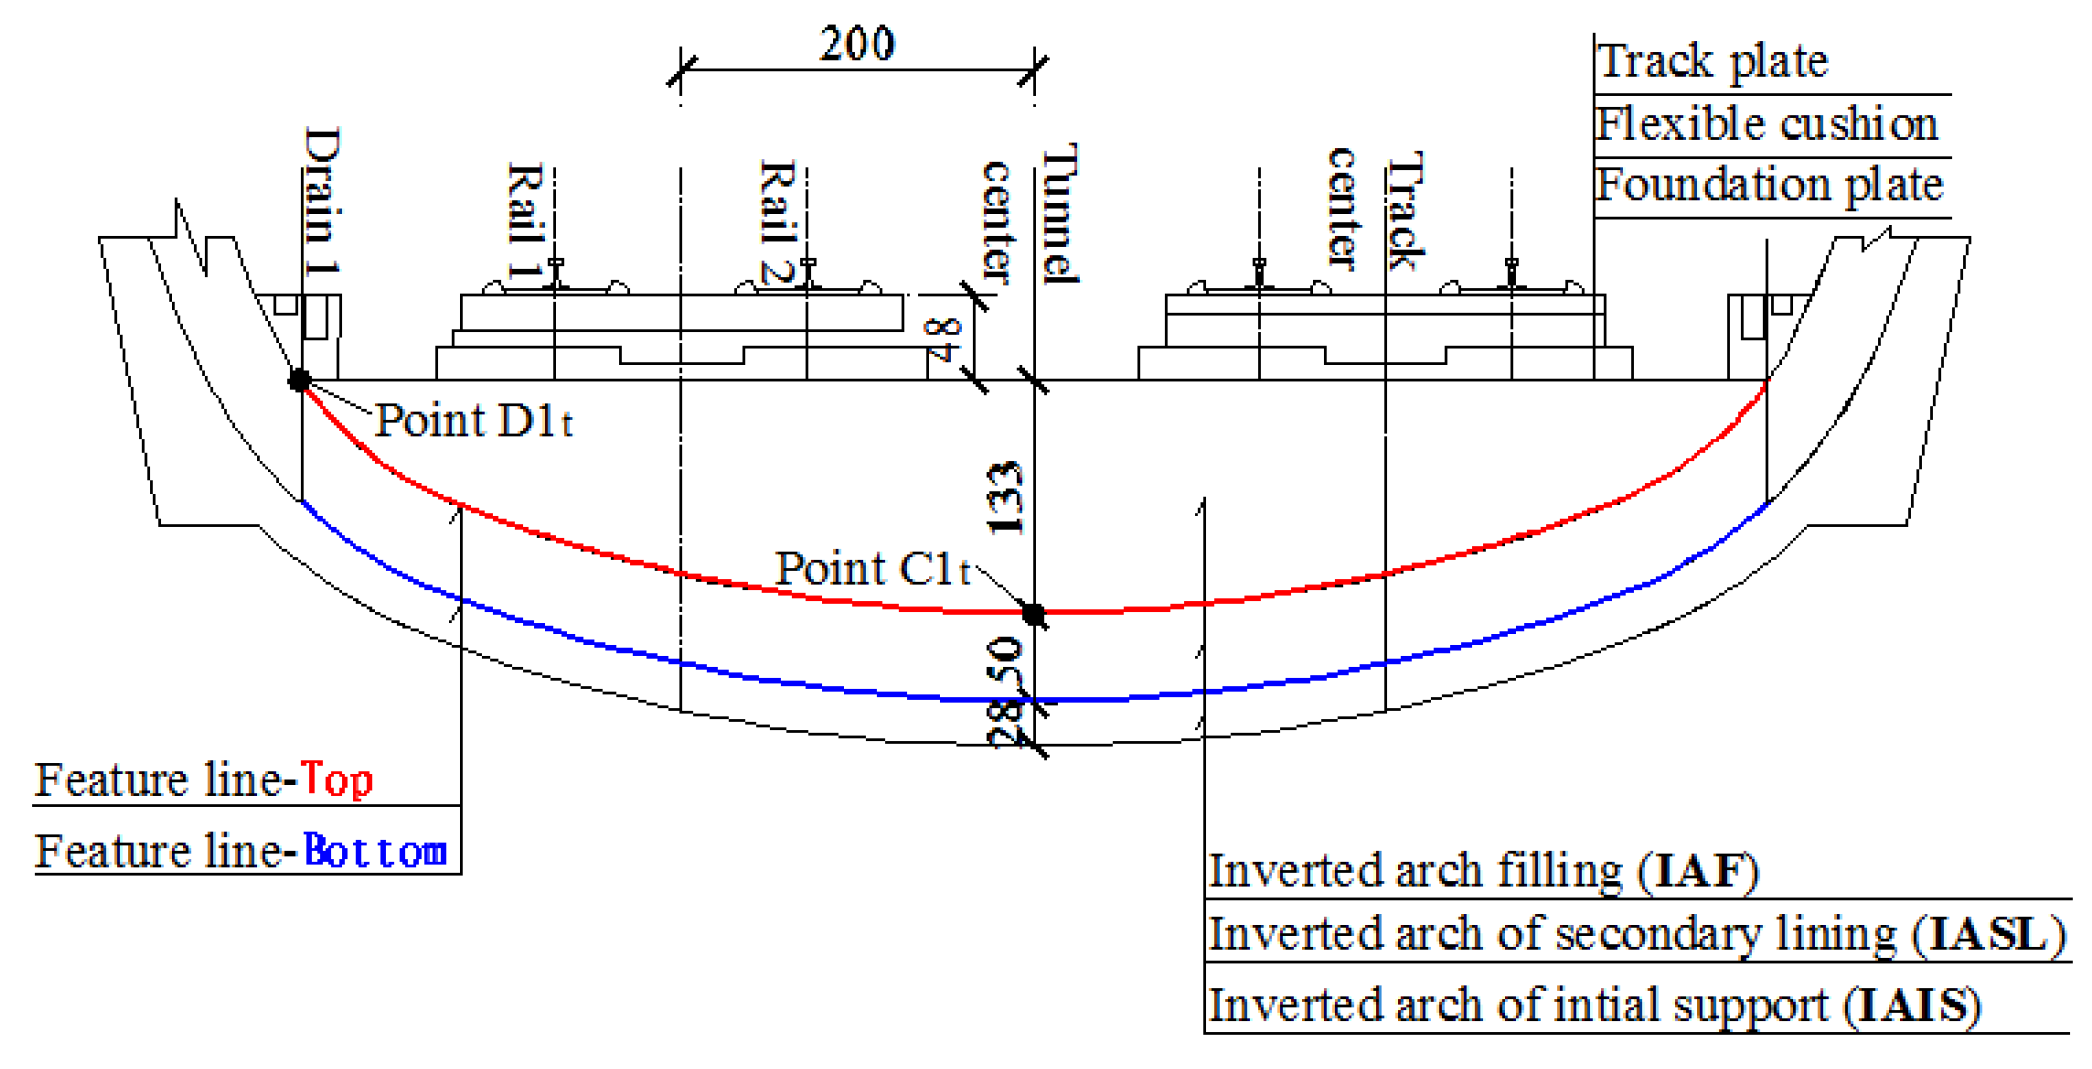
2.3. Feature Points and Feature Lines

For tunnels, the inverted arch secondary lining (IASL) is the most important barrier for the safety of tunnel bottom structures. As long as the IASL does not crack, mud and water will not flow into the tunnel. This paper mainly focuses on the stress state and fatigue performance of the IASL. So, the feature points and feature lines were arranged, as shown in Figure 4.
Figure 4. Layout of feature points and lines (cm).

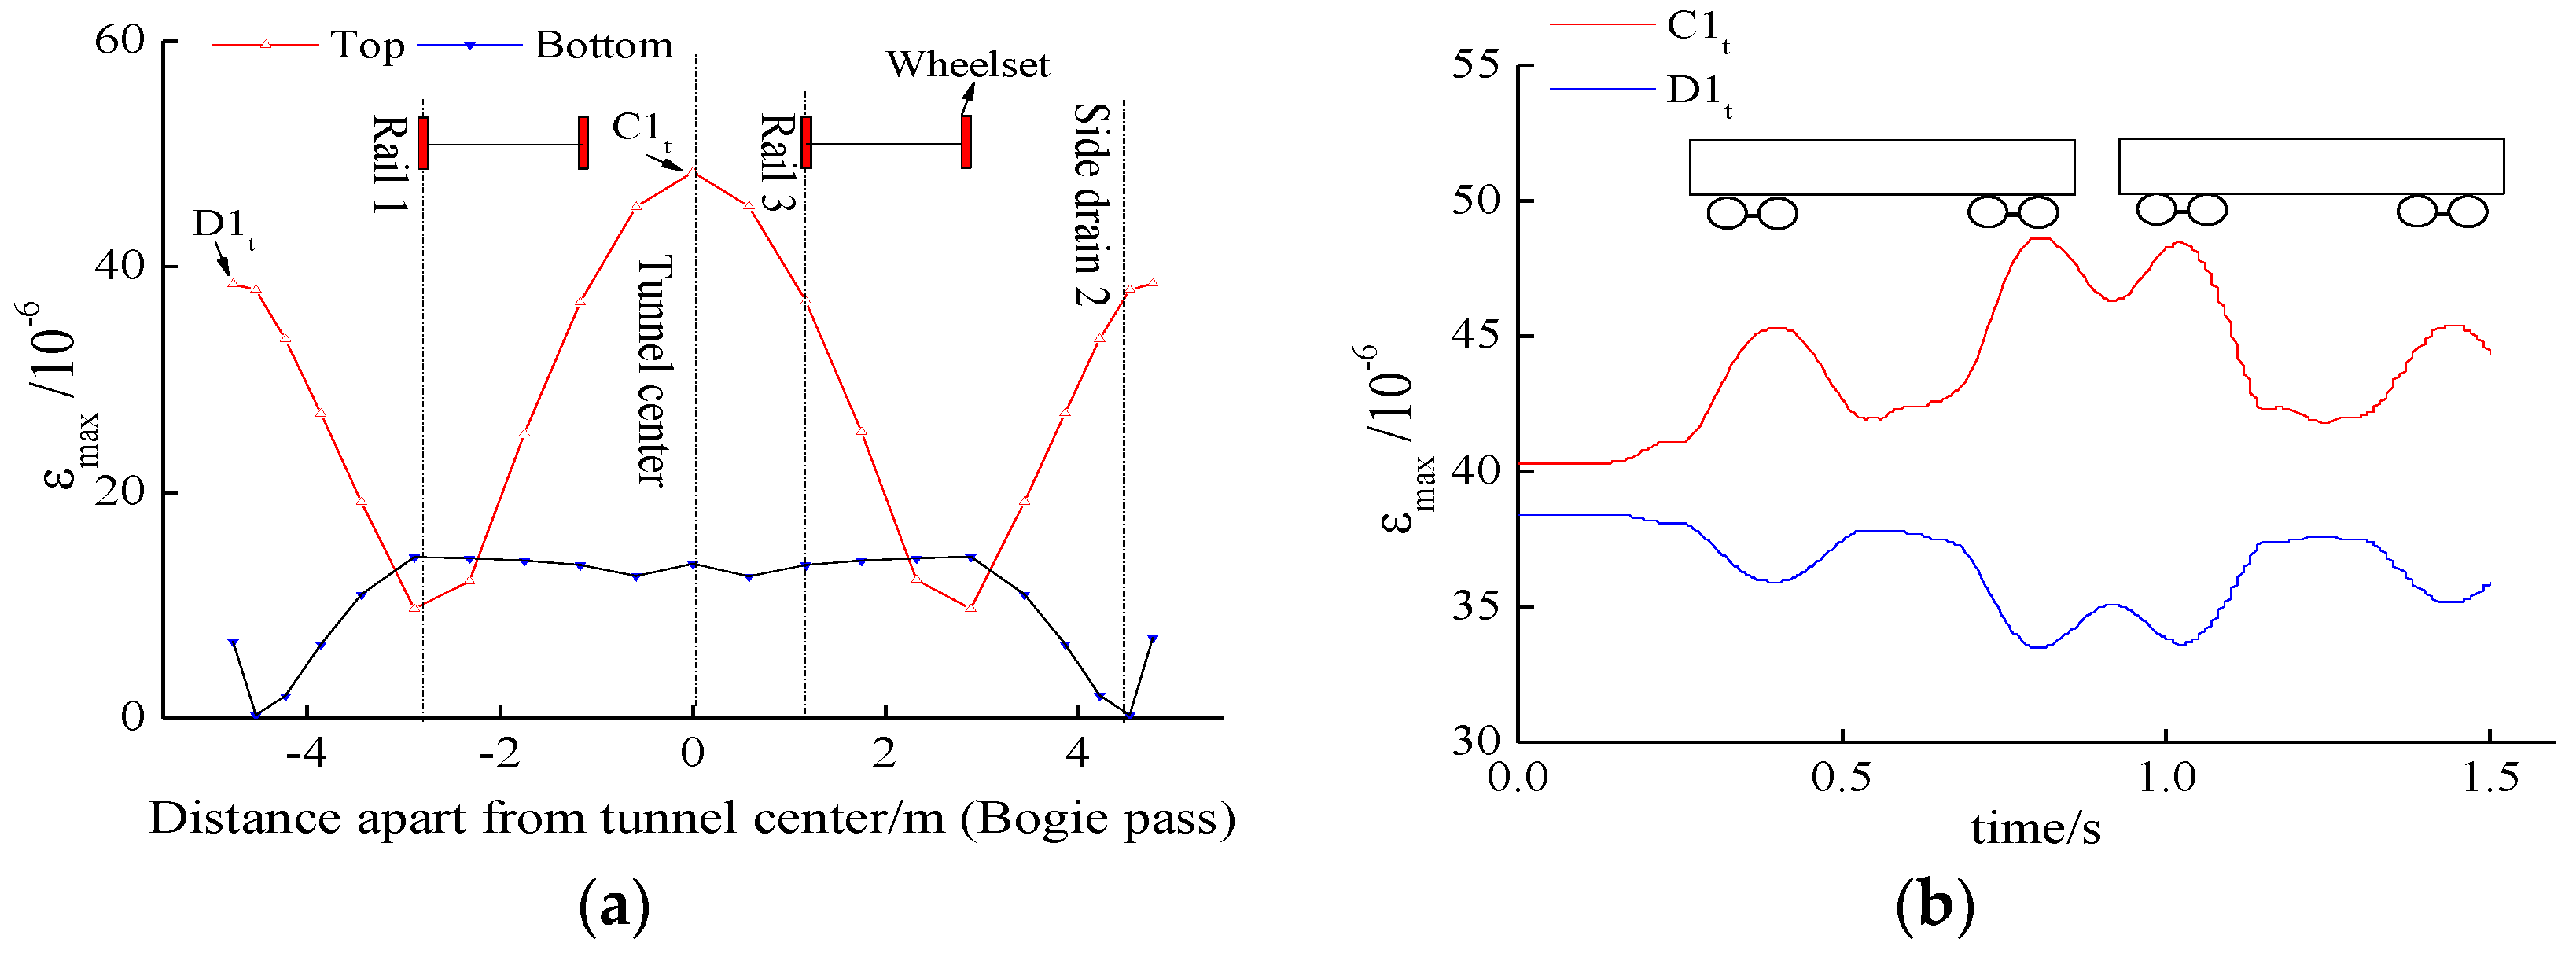
3. Mechanical Characteristics

The maximum principal strain was selected to illustrate the stress state of the IASL (Figure 5) because it was easy to acquire during the fatigue tests, facilitating a results comparison between the calculation and tests.
Figure 5. Maximum principal strain of inverted arch secondary lining: (a) Horizontal distribution and (b) time–history curve.
When two 30 t axle load carriages pass through a tunnel, the tunnel experiences the coupled action of surrounding rock pressure and dynamic train load. Figure 5a shows that the maximum principal strain is located at point C1t, the top center of the IASL. The maximum principal strain of R2t and D1t is also relatively large. Figure 5b indicates that peak strain occurs when a wheel set passes, and the maximum principal strain appears when the bogie passes (0.80 s, 1.02 s). The εmax of point C1t is 48.6 × 10⁻⁶ and that of point C1t is 8.3 × 10⁻⁶. This illustrates that the influence of the surrounding rock pressure is stronger than the dynamic train load on the stress state of IASL; the vulnerable position is under a high static and low dynamic stress state.
The time–history curve reveals that when a train passes through a tunnel, two types of dynamic impact occur: The first and last wheel sets of the train are separate wheel set impacts, while all carriages in the middle are impacted by bogies (two sets of adjacent wheel sets). The maximum stress cycle only occurs once, but hundreds of small stress cycles occur simultaneously.

4. Fatigue Test of Tunnel Base Structures

The results of numerical simulation revealed that under the action of surrounding rock pressure (V), the static strain of the most unfavorable position was 40.3 × 10⁻⁶, and its dynamic strain caused by the train load (30 t) was 8.3 × 10⁻⁶. The strain caused by the surrounding rock pressure was far greater than that caused by the train load. According to the high static and low dynamic stress state, a set of bending fatigue test systems and a series of test conditions were designed to study the fatigue lives of the specimens under different stress states.

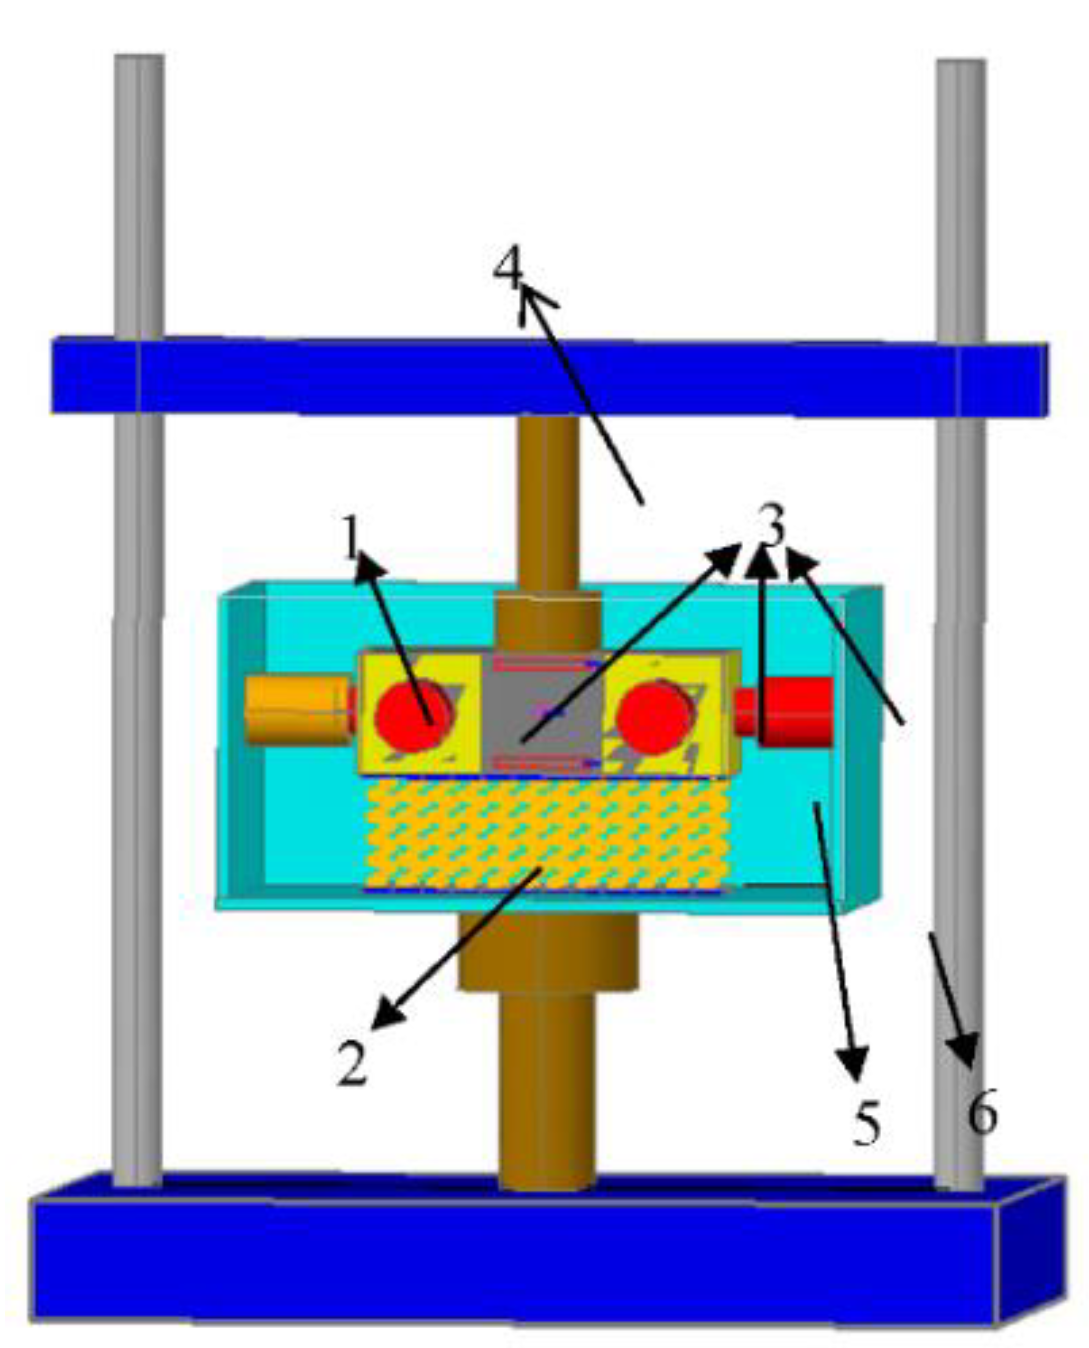
4.1. Fatigue Test System

The top center of the IASL is the most vulnerable position in the tunnel bottom. According to the high static and low dynamic bilateral confinement stress state, a fatigue test system was designed to study the bending fatigue performance of the heavy haul railway tunnel, as shown in Figure 6.
Figure 6. Fatigue test system. 1. Side support; 2. bottom spring; 3. digital hydraulic jack; 4. MTS (Mechanical Testing and Sensing) system; 5. contact steel plate; 6. model box.
The test box size was 400 × 300 × 250 mm. The bedrock was not completely rigid, the elastic resistance coefficient of V-grade surrounding rock was 193.5 MPa/m [15], and the interaction between the bedrock and the inverted arch specimen was simulated using 27 uniformly distributed springs. The equivalent spring stiffness was 215 kN/m. The bilateral horizontal forces of the specimen were applied using digital hydraulic jacks (No. 3 in Figure 6) and the vertical load of the specimen was applied using MTS815 (No. 4 in Figure 6) (MTS system Co., Eden Prairie, MN, USA).
The concrete (C35) composition of the test specimens is provided in Table 3.
Table 3. Concrete composition.
The mechanical parameters of the specimens are shown in Table 4. Cube specimens were used to reflect the static elastic modulus and compressive strength of the C35 concrete, and rectangular specimens were used to reflect its dynamic elastic modulus and bending strength. The ultimate bending strength of the specimens was 2.5 MPa, and the corresponding peak load was 40 kN (mean value) when the specimens cracked.
Table 4. Mechanical parameters of specimens.

4.2. Load Condition

The fatigue performance was influenced by maximum tensile stress, dynamic tensile stress, and ultimate flexural strength. The variable of stress level S was introduced to reduce the parameters of the S–N formula.
The definition equations are presented in Equations (2)(4):
S min = σ min / f t = F min / F t
Δ S = ( σ max σ min ) / f t = ( F max F min ) / F t = Δ F / F t
S max = σ max / f t = F max / F t
where Smin is the minimum stress/load level or static stress/load level, Smax is the maximum stress/load level or static stress/load level, ΔS is the dynamic stress/load level, σmin is the tensile stress caused by the surrounding rock pressure, σmax is the tensile stress caused by the coupling load, Fmin is the minimum value of the fatigue load, Fmax is the maximum value of the fatigue load, ΔF is the dynamic load of the fatigue load, and ft is the ultimate flexural strength of the specimen.
The fatigue load was simplified to a sinusoidal wave, as indicated in Figure 7. We applied 1.5 MPa lateral confining stress using the lateral hydraulic jack.
Figure 7. Sketch map of simplified cyclic loading.
The numerical simulation and the specimen strength test conditions are outlined in Table 5. The test was terminated when a fracture occurred in the specimen; the number of cycles was recorded as the fatigue life of the specimen. If no fracture occurred after 2 million cycles, the test was terminated. The mechanical properties of plain concrete specimens were discrete, so every test condition was conducted in triplicate.
Table 5. Test conditions.
Bilateral loads in all test conditions were 1.5 kN to reflect the horizontal confinement of the tunnel invert specimens. In dynamic load conditions (case 1–4), the static loads were the same and represented that the tunnel was under the same surrounding rock pressure and the dynamic loads were different to investigate the influence of the different axle load train. In static load conditions (case 5–8), the dynamic loads were the same and represented that the tunnel is under the action of the same axle load train and the static loads were different to study the influence of the different pressure of the surrounding rock.

4.3. Sensor Layout

Two strain gauges (length: 80 mm, resistance: 120 Ω) were attached to the side of the specimen, both located on the middle section of the specimen, and the specimen’s failure was controlled by the tensile strain (sensor 2#). The sensor layout is shown in Figure 8. The strain was acquired using an IMC dynamic strain acquisition instrument (Integrated Measurement & Control Co., Berlin, Germany).
Figure 8. Layout of strain gauges: 1. Compression strain gauge (top center); 2. tensile strain gauge (bottom center).

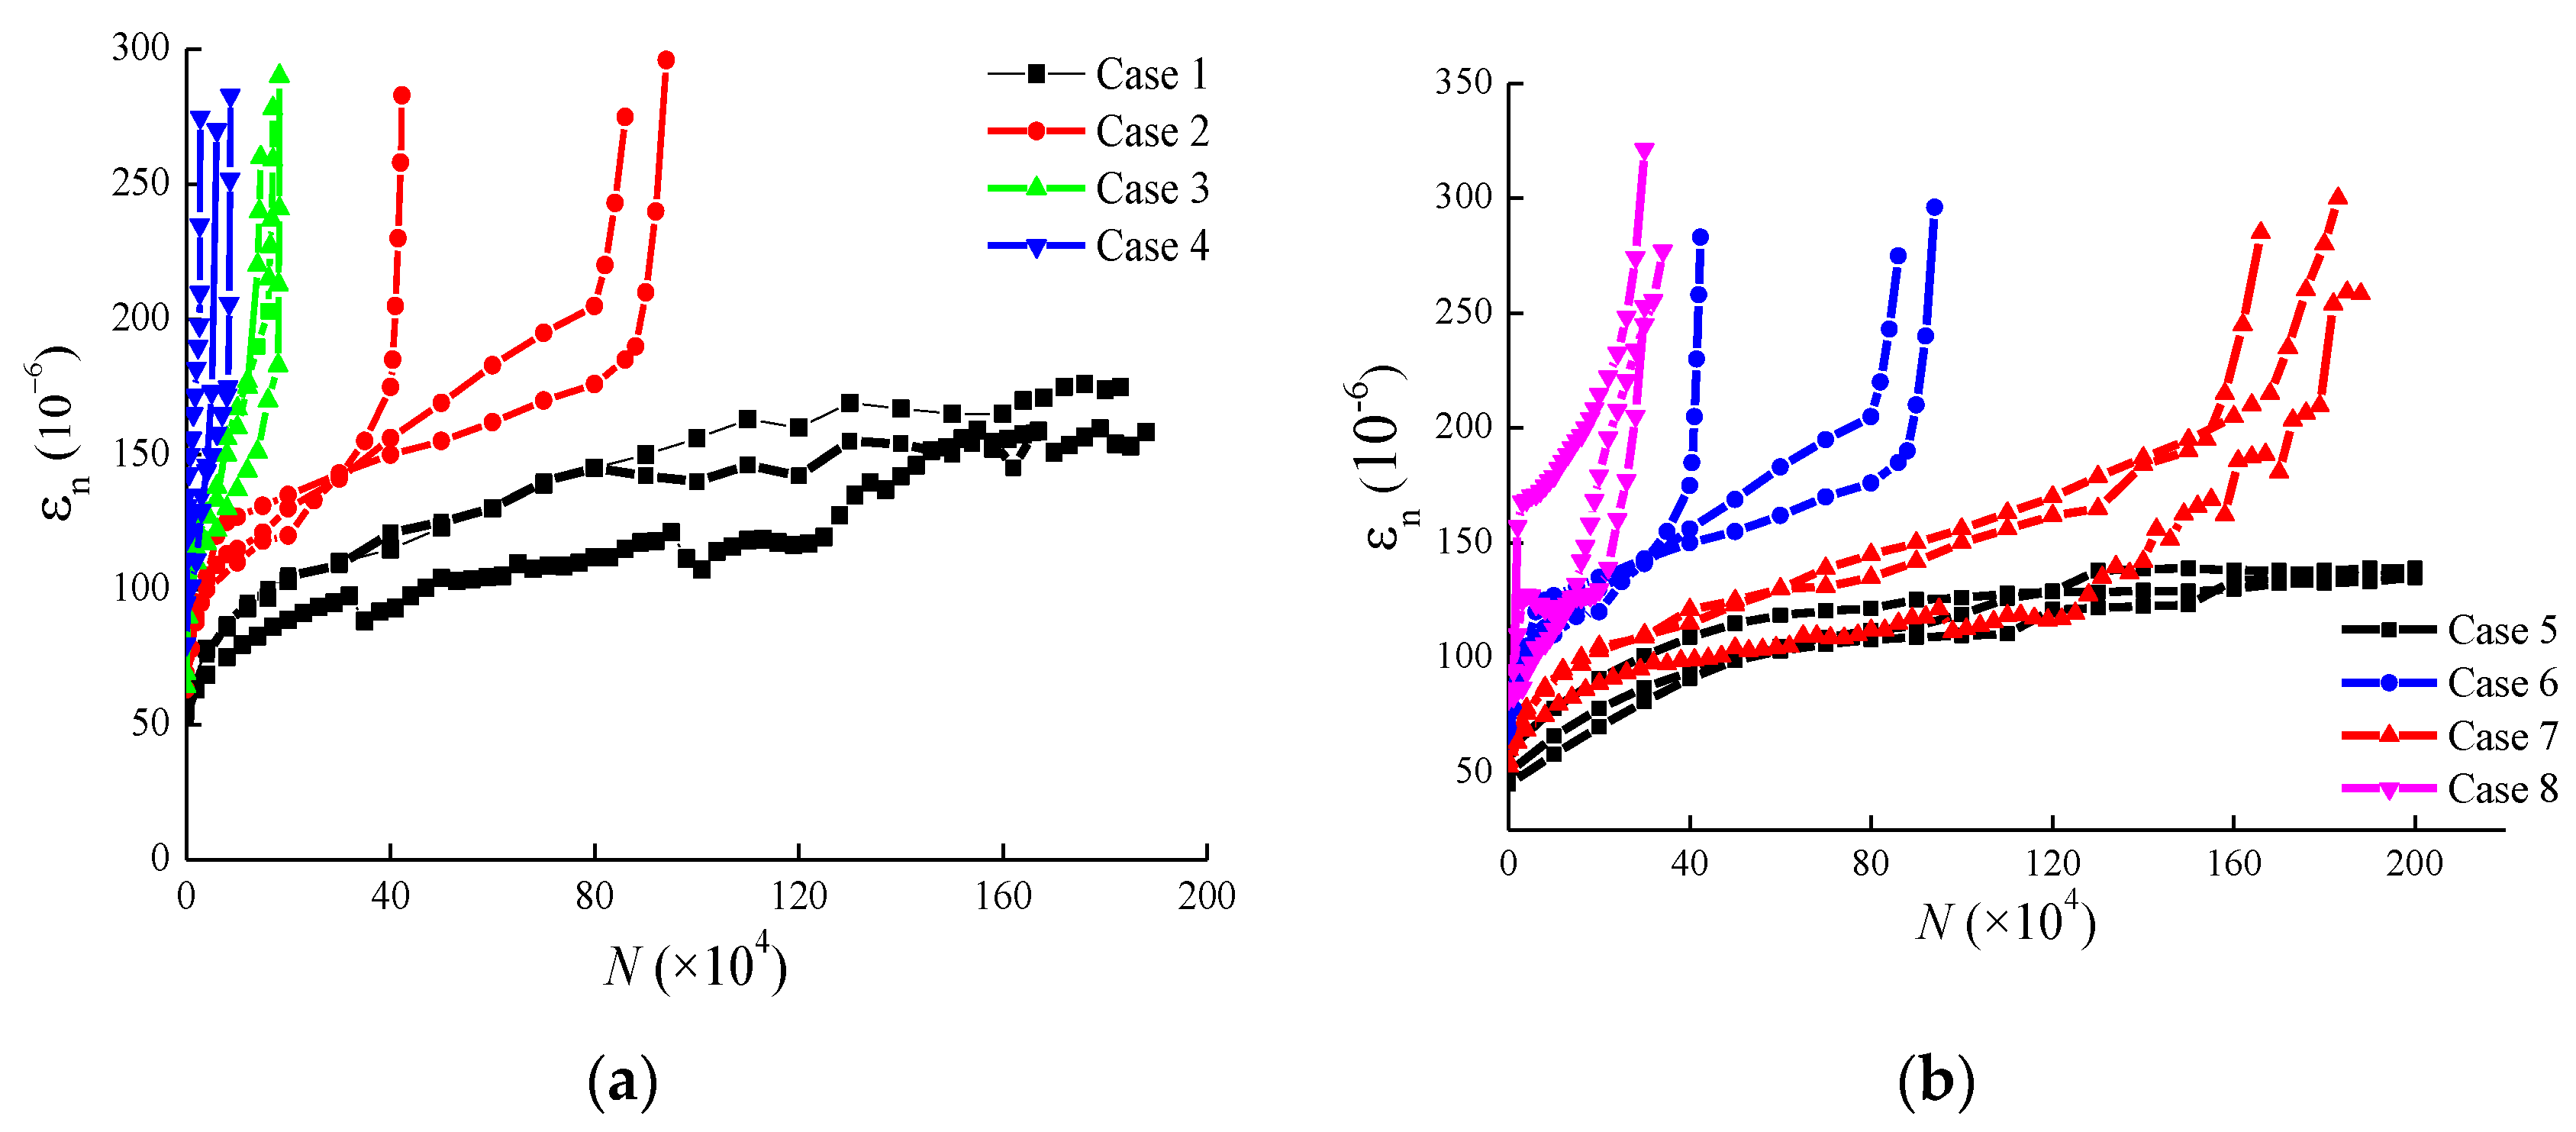
4.4. Strain Evolution

The maximum strain evolutions of the specimens are illustrated in Figure 9. We found that the maximum tensile strain increased with N and the fatigue life decreased as the dynamic load and static load increased. When Smax ≤ 0.65 (εmax ≤ 56 × 10−6, Δε ≤ 16 × 10−6), the specimens were still intact after 2 million cycles and the maximum tensile strains developed in two stages. When Smax ≥ 0.7 (εmax ≥ 68 × 10−6, Δε ≥ 28 × 10−6), the maximum tensile strain of the specimens developed in three stages.
Figure 9. ε n N curves: (a) Dynamic and (b) static cases.
An S-shaped model was introduced to describe the characteristics of the three-stage strain evolution under the abscissa of N/Nf (Figure 10). The model is expressed by Equation (5) and its parameters are listed in Table 6. Figure 10 shows that the maximum tensile strain increased rapidly in stage I due to the increase in microcracks [21]; in stage II, the maximum tensile strain increased steadily and linearly as a result of stable crack growth; in stage III, the maximum tensile strain increased sharply and nonlinearly due to an unstable crack growth. The transition of stages have been specified by different authors in the range of 10 to 20% (first transition) and about 80 to 90% (second transition) of the number of cycles to failure [22].
ε n ε 0 = λ + α ( β β N / N f 1 ) γ
where ε n is the maximum tensile strain of the specimen after N cycles, ε 0 is the maximum tensile strain during the first cycle, and λ , α , β , and γ are the fitting parameters of the curve.
Figure 10. εn/ε0N/Nf curves: (a) Dynamic and (b) static cases.
Table 6. Fitting parameters.

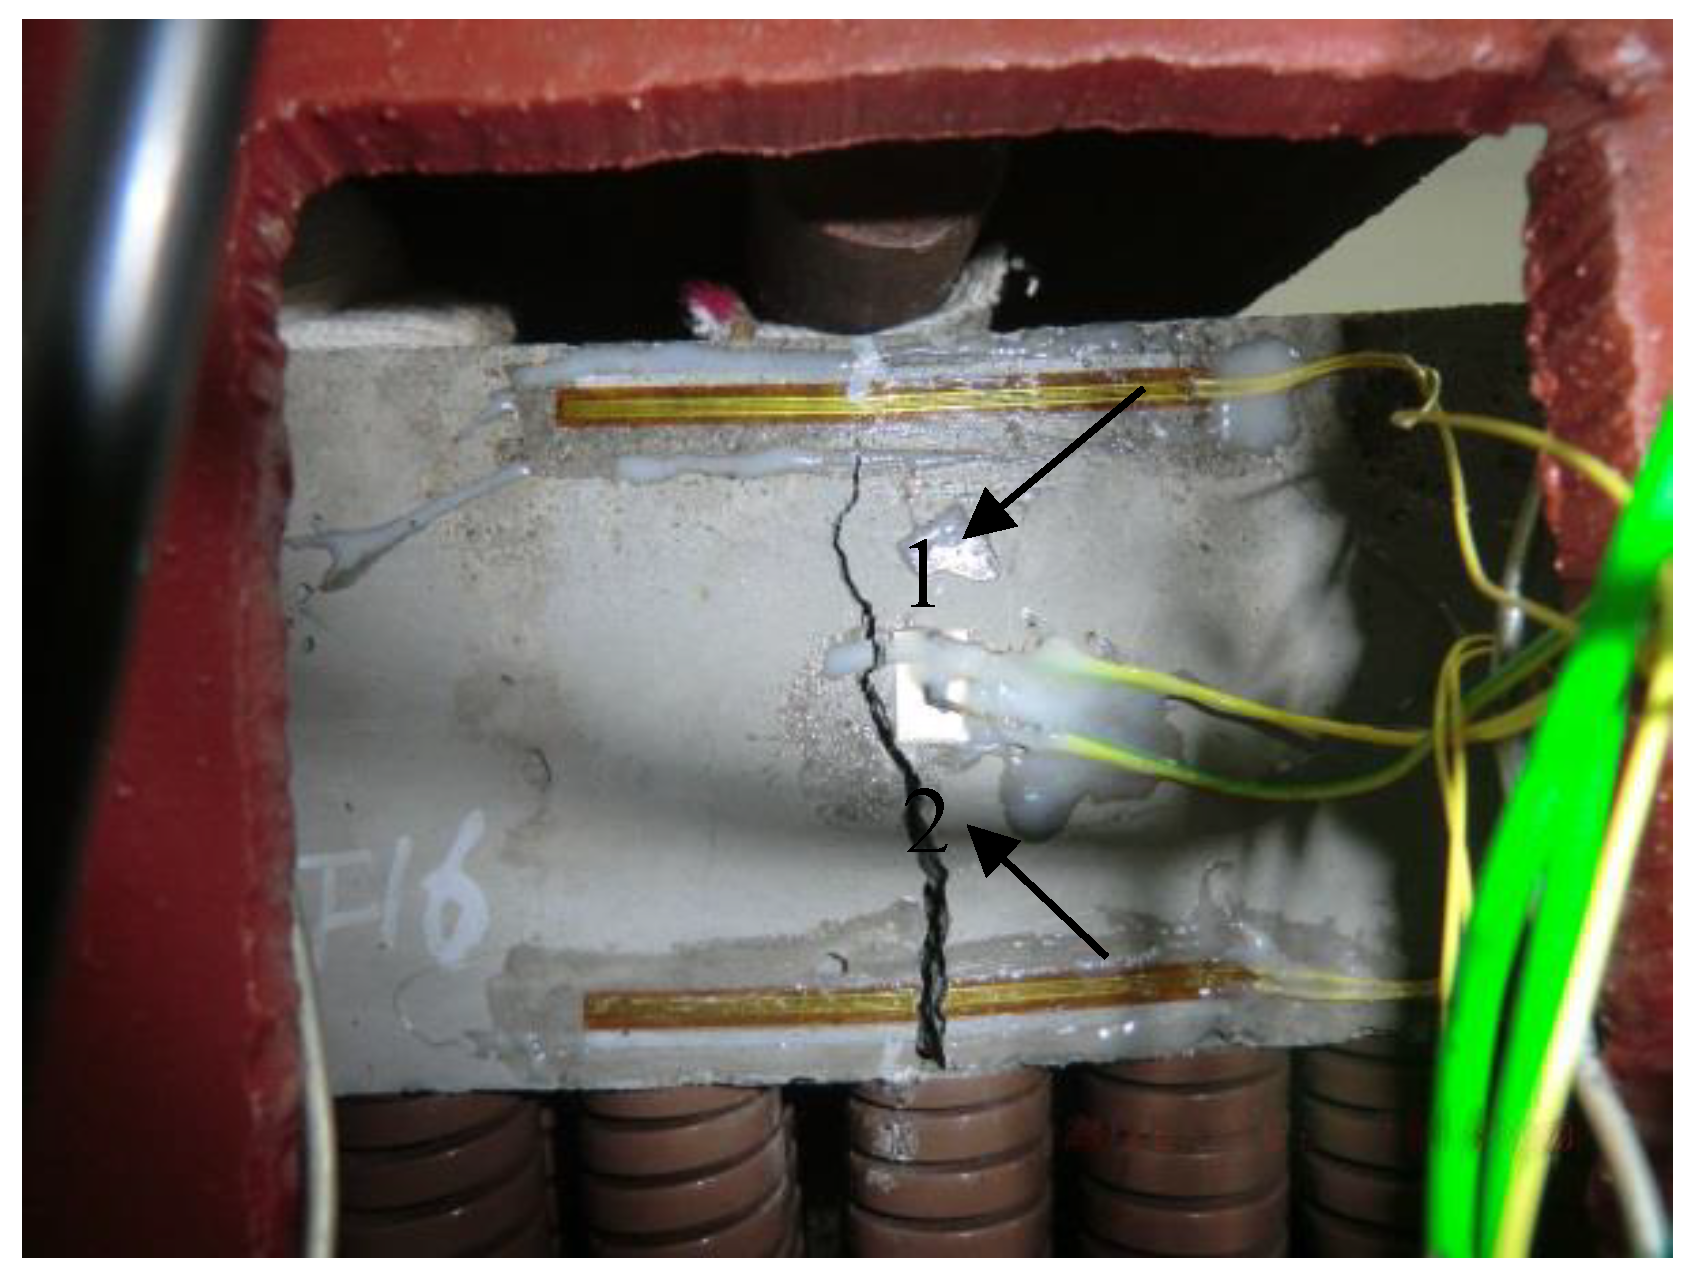
4.5. Fatigue Performance of Tunnel Basal Structures

Based on the fatigue lives of specimens in Table 7, a two-parameter fatigue life (SN) equation of the tunnel bottom structure was obtained, as shown in Equation (6):
lg N = 3.83 S max 13.57 Δ S + 5.68   ( Adjusted   R - square   =   0.92 )
where lg N = 2 indicates that the specimen can bear 1 million cycles without fracture.
Table 7. Fatigue lives of specimens.
Equation (6) is a two-parameter fatigue life equation with no corresponding S–N curve in the two-dimensional (2D) plane graph, so two independent S–N curves are drawn in Figure 11. Due to the lateral and bottom confinement, the fatigue lives of the specimens in this study were far longer than the results of related literature [23,24].
Figure 11. S–N curves (based on a single parameter): a 4-point bending fatigue test in dry condition, span: 450 mm, specimen size: 150 × 150 × 550 mm, fcu = 57.5 MPa. b 3-point bending fatigue test in dry condition, span: 442 mm, R = 0.1, specimen size: 100 × 100 × 515 mm, fcu = 51.7 MPa.
When comparing the fatigue life of cases 1 and 6 and cases 4 and 8, the fatigue lifespan of specimens appeared to be more sensitive to the dynamic stress than static stress, because, under the same maximum stress level, the fatigue life decreased sharply with the increase in dynamic stress.
In typical V-grade surrounding rock, under the impact of a 30 t axle load train, fatigue failure would not occur in the tunnel invert within 2 million cycles, according to results of the tests and numerical simulation. The fatigue life decreased with increasing dynamic (train load) and static (rock pressure) loads.
The results also indicate that under the condition of 30 t axle loads, any break in the inverted arch in the newly designed heavy haul railway tunnel structure could be attributed to the excessive pressure of surrounding rock or the bedrock defects, rather than the dynamic train load.

5. Conclusions

In this study, to examine the coupling effect of the surrounding rock pressure and 30 t axle load trains, 3D numerical simulation and three-point bending fatigue tests were combined to investigate the fatigue performance of the bottom structures of the newly designed heavy haul railway tunnel. We drew the following:
  • The top center was the position vulnerable to fatigue in the tunnel invert of the new line, which experienced high static and low dynamic stresses. Its static maximum principal strain was 40.3 × 10⁻⁶, which was caused by surrounding rock pressure, whereas the dynamic maximum principal strain caused by train load was 8.3 × 10⁻⁶.
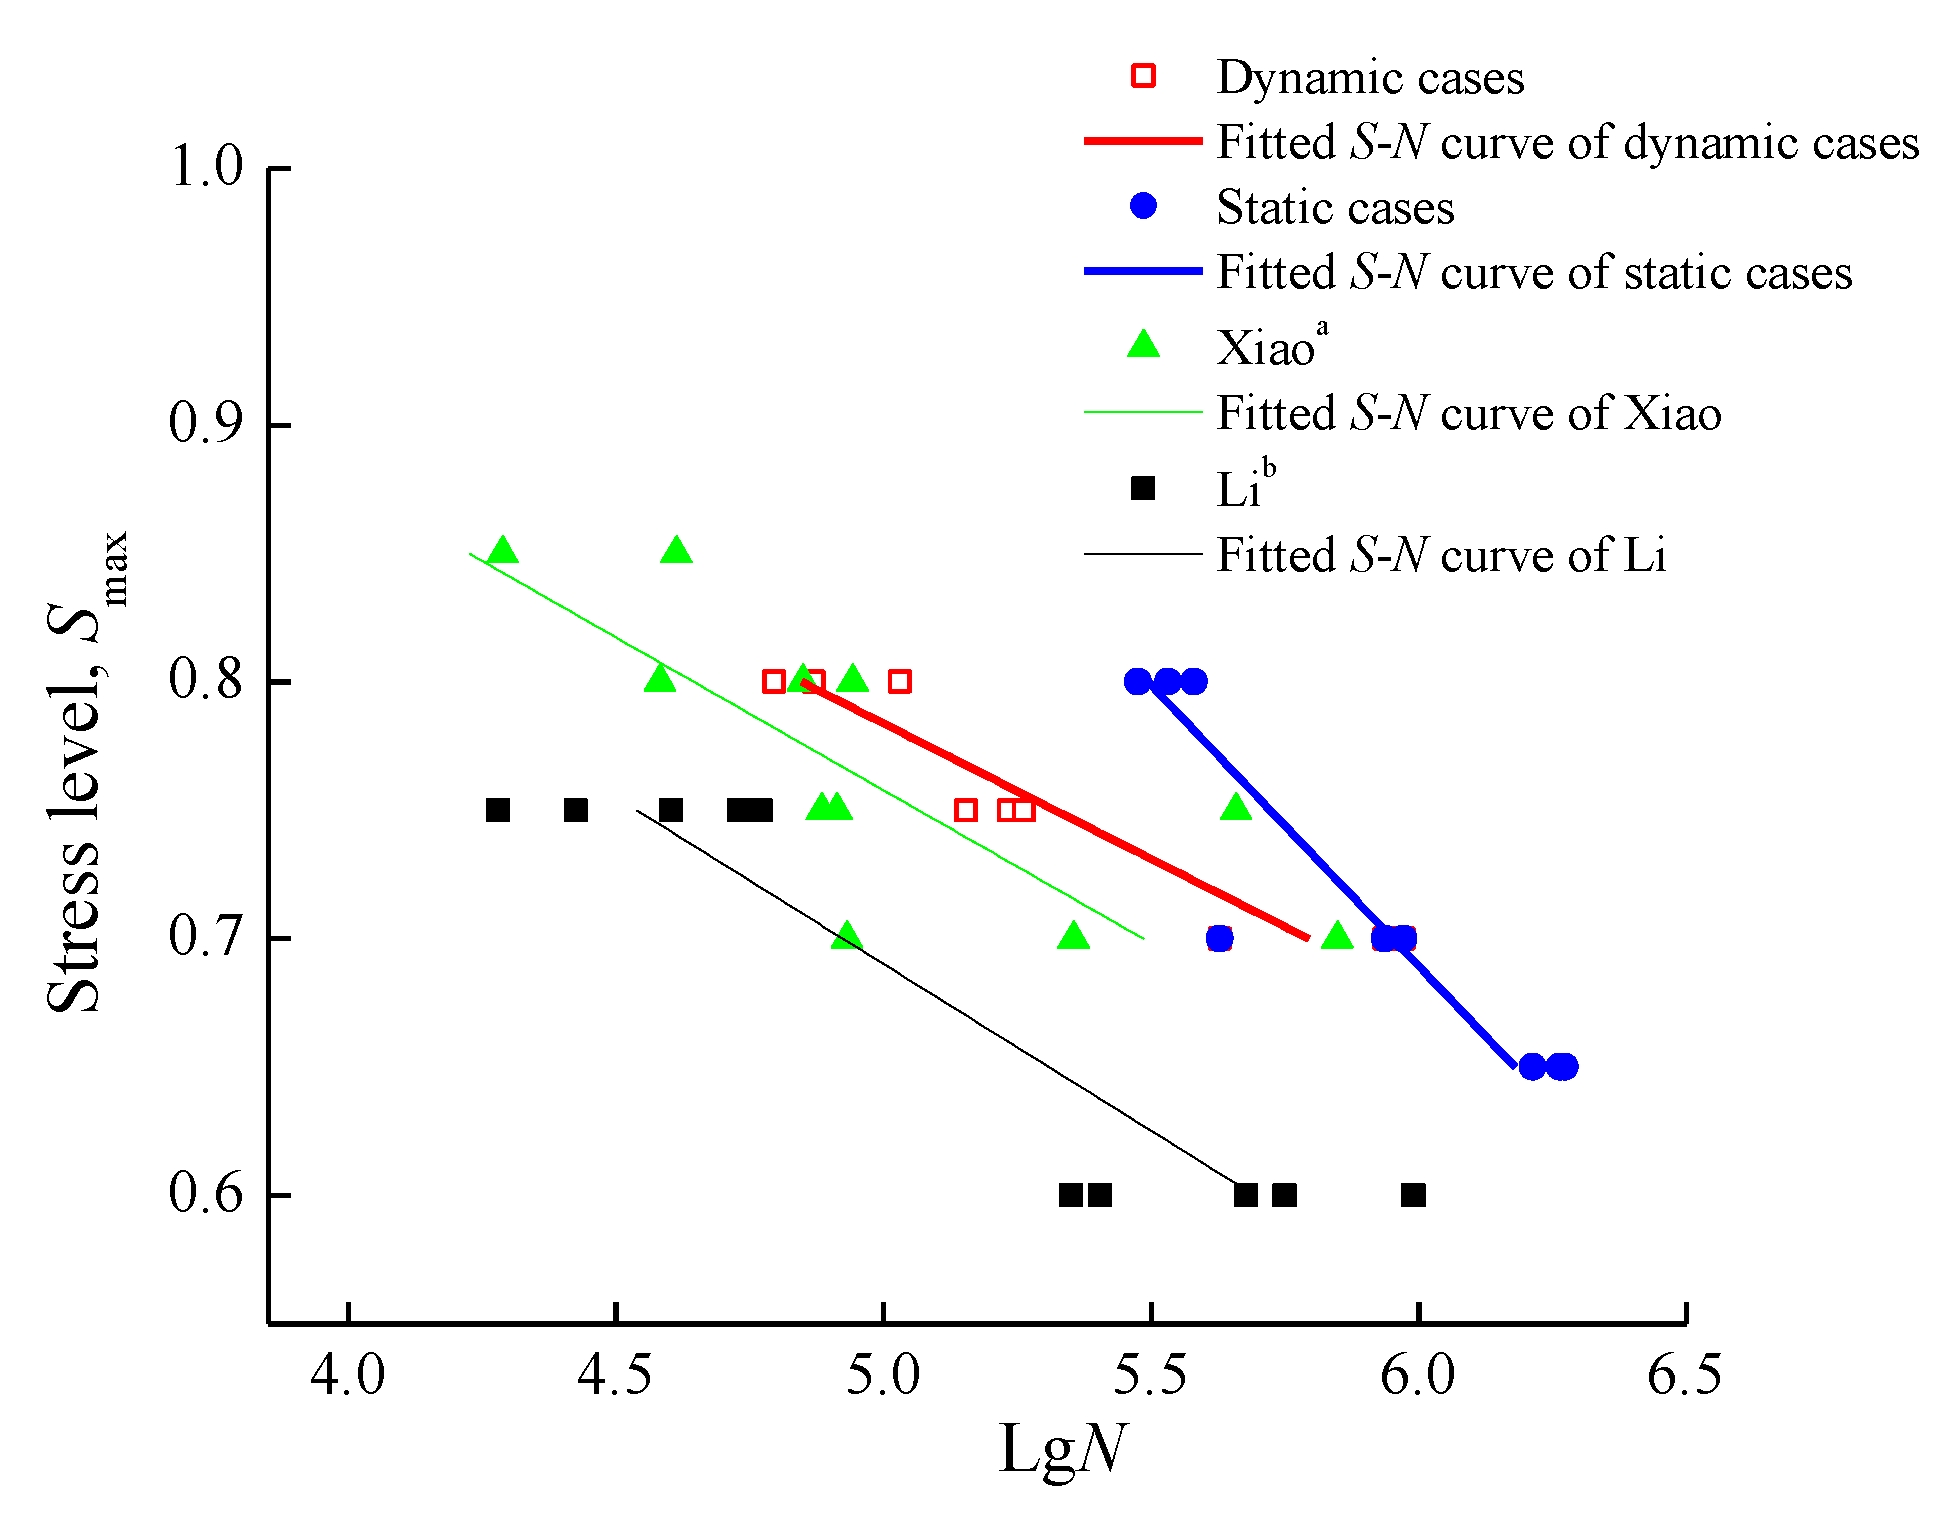
  • The tests results revealed that the fatigue life decreased as dynamic and static loads increased. Combined with the expression of the two-parameter SN curve, an evolution model was proposed to characterize the fatigue behavior of the tunnel invert specimens.
  • For the new line’s tunnel invert structures, fatigue failure would not occur within 2 million cycles. Any invert fracture within the design service life could be attributed to geological reasons or bedrock defects, rather than fatigue failure caused by dynamic train load.

Author Contributions

Conceptualization, C.L.; methodology, C.L.; formal analysis, C.L. and N.L.; writing—original draft preparation, C.L.; writing—review and editing, C.L., L.P., M.L., C.S., and N.L.; supervision, L.P.; funding acquisition, M.L.

Funding

This project was funded by the National Natural Science Foundation of China (No. 51978669, U1734208) and the Natural Science Foundation of Hunan Province, China (No. 2018JJ3657), who are gratefully acknowledged. The experimental work described in this paper was completed in the Key Laboratory of Engineering Structure of Heavy Haul Railway in Central South University, China.

Conflicts of Interest

The authors declare no conflicts of interest.

References

  1. Van Rickstal, F.; Van Gemert, D.; Bonheure, M. Fatigue testing of traffic tunnel panels. J. Perform. Constr. Fac. 1999, 13, 152–156. [Google Scholar] [CrossRef]
  2. Wang, X.; Zhang, H.; Xie, W. Experimental Study of Dynamic Cumulative Damage Model for High Speed Railway Tunnel. Tunn. Constr. 2017, 37, 939–945. (In Chinese) [Google Scholar]
  3. Han, J.; Liu, W.; Wang, S.; Geert, D.S.; Sun, W.; Liang, Y. Carbonation reaction and microstructural changes of metro-tunnel segment concrete coupled with static and fatigue load. J. Mater. Civ. Eng. 2017, 29, 1943–5533. [Google Scholar] [CrossRef]
  4. Qian, W.; Qi, T.; Yi, H.; Liang, X.; Jin, Z.; Lei, B.; Li, Y.; Li, Z. Evaluation of structural fatigue properties of metro tunnel by model test under dynamic load of high-speed railway. Tunn. Undergr. Sp. Tech. 2019, 93, 103099. [Google Scholar] [CrossRef]
  5. Tian, B. Operation and development of railway heavy haul transport technology in the world. Roll. Stock 2015, 12, 10-19+5. [Google Scholar]
  6. Tian, Y. The Base Treatment Process with Grouting Resin in Datong-Qinhuangdao Railway Tunnels. Paper Collection of Heavy Haul Railway Transportation Technical Exchange; China Railway Society: Beijing, China, 2014; pp. 363–367. (In Chinese) [Google Scholar]
  7. Hu, Y. Current Status and Development Trend of Technology System for Railway Heavy Haul Transport in China. China Railw. Sci. 2015, 36, 1–10. (In Chinese) [Google Scholar]
  8. Niu, Y. The Heavy Haul Railway Tunnel Diseases Mechanism and Remediation Technology Research. Master’s Thesis, China Academy of Railway Sciences, Beijing, China, 2013. (In Chinese). [Google Scholar]
  9. Huang, Y. Research on Monitoring System and Reinforcement Treatment of Heavy Haul Railway Long Tunnel’s Bedding Diseases. Master’s Thesis, Southwest Jiaotong University, Chengdu, China, 2015. (In Chinese). [Google Scholar]
  10. Yin, C.; Fu, B.; Ma, W. Analysis on Dynamic Stress of Tunnel Structure under Heavy Haul Train. China Railw. Sci. 2013, 34, 47–52. [Google Scholar]
  11. Xue, J. Analysis of the Influence of Tunnel Bottom Compactness on Structure Stress and Strengthening Measures under 30 t Axle Load Train. China Railw. Sci. 2015, 36, 90–95. (In Chinese) [Google Scholar]
  12. Liu, N.; Peng, L.; Shi, C.; Lei, M. Experimental and model study on dynamic behaviour and fatigue damage of tunnel invert. Constr. Build. Mater. 2016, 126, 777–784. [Google Scholar] [CrossRef]
  13. Zhang, Z.; Zeng, B.; Dai, C.; He, W. Study on Structural Service Performance of Heavy-Haul Railway Tunnel with Voided Base. Adv. Civ. Eng. 2018, 2018, 1–12. [Google Scholar] [CrossRef]
  14. Nicholas, T.; Zuiker, J. On the use of the Goodman diagram for high cycle fatigue design. Int. J. Fract. 1996, 80, 219–235. [Google Scholar] [CrossRef]
  15. TB 10003-2016. Code for Design of Railway Tunnel; China Railway Publishing House: Beijing, China, 2016. (In Chinese) [Google Scholar]
  16. Chappell, B. Deformational response in discontinua. Int. J. Rock Mech. Sci. Geomech. 1979, 4, 377–390. [Google Scholar] [CrossRef]
  17. Hernandez, Y.; Farfan, A.; De Assis, A. Three-dimensional analysis of excavation face stability of shallow tunnels. Tunn. Undergr. Sp. Tech. 2019, 92, 103062. [Google Scholar] [CrossRef]
  18. Gu, Y.; Liu, J.; Du, Y. 3D consistent viscous-spring artificial boundary and viscous-spring boundary element. Gongcheng Lixue/Eng. Mech. 2007, 24, 31–37. [Google Scholar]
  19. GB/T 50081-2002. Standard for Test Method of Mechanical Properties on Ordinary Concrete; China Architecture and Building Press: Beijing, China, 2003. (In Chinese) [Google Scholar]
  20. Zhai, W.; Xia, H. Train-Track-Bridge of Train Track Bridge Dynamic Interaction: Theory and Engineering Application; Science Press: Beijing, China, 2011. [Google Scholar]
  21. Klausen, D. Concrete strength and damage due to frequently repeated loading. Darmstadt 1978. (In German) [Google Scholar]
  22. Oneschkow, N. Fatigue behaviour of high-strength concrete with respect to strain and stiffness. Int. J. Fatigue 2016, 87, 38–49. [Google Scholar] [CrossRef]
  23. Xiao, J.; Li, H.; Yang, Z. Fatigue behavior of recycled aggregate concrete under compression and bending cyclic loadings. Constr. Build. Mater. 2013, 38, 681–688. [Google Scholar] [CrossRef]
  24. Li, Y.; Che, H. A Study on the Cumulative Damage to Plain Concrete due to Flexural Fatigue. China Railw. Sci. 1998, 19, 52–59. (In Chinese) [Google Scholar]

Article Metrics

Citations

Article Access Statistics

Multiple requests from the same IP address are counted as one view.