Article

Energy Market Management for Distribution Network with a Multi-Microgrid System: A Dynamic Game Approach

1
School of Electrical Engineering and Automation, Anhui University, Hefei 230601, China
2
Collaborative Innovation Center of Industrial Energy-saving and Power Quality Control, Anhui University, Hefei 230601, China
3
School of Internet, Anhui University, Hefei 230601, China
4
State grid Anhui dispatching and control center, Hefei 230601, China
5
Faculty of Science, Engineering and Technology, Swinburne University of Technology, Melbourne, VIC 3122, Australia
*
Author to whom correspondence should be addressed.
Appl. Sci. 2019, 9(24), 5436; https://doi.org/10.3390/app9245436
Submission received: 21 October 2019 / Revised: 5 December 2019 / Accepted: 8 December 2019 / Published: 11 December 2019
(This article belongs to the Section Energy Science and Technology)

Abstract

:
This paper proposes an energy market management framework to address the day-ahead optimization of a distribution network (DN) with a multi-microgrid (MMG). In this framework, an economic optimization based on a dynamic game is designed to ensure the reliability and stability of the DN operation while setting the internal transaction price to minimize the operation cost of the distribution network operator (DNO). The DNO, as a leader, sets the power flow constraints and microgrid operators (MGOs), as followers, respond to the internal transaction price and in turn affect the DNO’s price decision. The price incentive mechanism of the DNO is to encourage MGs to participate in energy market management, to promote joint operation of MGs and to reduce the operation cost of MGOs. The differential evolution algorithm and mixed integer programming method are applied to find the equilibrium solution to the dynamic game. Numerical simulations of a modified IEEE 33-bus system show the effectiveness of the proposed energy market management framework.

1. Introduction

As a small scale power generation and distribution network, a microgrid (MG) can realize the effective integration of distributed generators based on renewable energy sources, energy storage and load into conventional power grids. Due to its environmental benefits and sustainability, it has received much attention from the power industry in recent years [1,2,3,4]. When multiple MGs are connected to a local distribution network (DN) of a power grid, they can form a multi-microgrid (MMG) [5,6,7]. The coordination and control of these multiple MGs and the DN are required to improve the economic benefits of MGs and the reliability and stability of power grids, which brings us many challenges.
Studies have been conducted on the reliability and stability of a power grid due to uncertainty of load and the intermittent nature of distributed generators in MGs. Farhad et al. [8] proposed a risk-based bi-level model for optimal planning of MGs considering uncertainties in renewable power generation and load consumption. Zhao et al. [9] took dynamic characteristics of photovoltaic (PV) based MG clusters into consideration to improve the stability of MG clusters. Hans et al. [10] proposed a hierarchical distributed model prediction method based on interconnected MGs to enhance system stability. Farhad et al. [11] proposed a stochastic multi-objective framework using the scenario modeling method to improve system stability. Different modeling methods were proposed in [8,9,10,11] to reduce the impact of uncertainty on the system without considering power flow between the trading MGs. Zhao et al. [12] introduced power flow constrains into energy trading between MGs and the DN to improve the reliability and stability of the system.
Studies have also been conducted on the economic operation of the MMG. Nikmehr et al. [13] used a stochastic and probabilistic method to model energy generation and load demand in an MG to reduce operating costs. Hu et al. [14] proposed a two-stage optimization model based on a dynamic electricity price strategy to reduce a total operation cost of MGs by exchanging power between the MMG and the grid. Kaveh et al. [15] proposed a hierarchical energy management model, in which the optimal solution is obtained through Nash bargaining at the lower level, where the utility company facilitates power exchange between multiple MGs and the wholesale market at the highest level. Stevanoni et al. [16] proposed a tool for long-term planning of the connected industrial MGs, and the long-term investments and short-term decisions are coupled via the game approach. An energy trading framework based on the Stackelberg game theory was proposed to improve economic benefits of the MMG [17,18,19,20,21,22]. Lee et al. [17] proposed a distributed energy trading mechanism among MGs in a competitive market to maximize the payoff of all participating MGs. Belgana et al. [18] developed a bi-level hybrid multi-objective evolutionary algorithm to minimize carbon emissions while maximizing the profit of power grid. Bae et al. [19] studied two systems for energy trading among energy prosumers, a buyer-pricing-system and a seller-pricing-system, by constructing a game mode. In [17,18,19], the amount of electricity purchased by the buyer is equal to that sold by the seller. In the actual operation, it is difficult to achieve a balance between supply and demand. Therefore, it is necessary to consider the joint optimization scheduling of MGs and the DN [20,21,22]. Jadhav et al. [23] took the transaction between the microgrid MG and the DN into consideration, and they proposed a new method for energy sharing among MG clusters; a seller level game and a new pricing mechanism were proposed to increase interest.
The above literature either improves the reliability of the system operation or improves the economy of the system operation, without considering the economy and reliability of the system at the same time. Liu et al. [24] proposed a two-layer optimization strategy where distribution network operator (DNO) takes the operational safety constraints of the DN into account to improve system stability while minimizing operating costs. However, the DNO needs to set several different prices for different MGs, which usually increase the complexity of the calculation. Furthermore, every MG needs to develop a buyer or seller role in advance and give the upper and lower limits of the transaction power, which is difficult to handle during actual operation.
This paper focuses on energy market management of the DN with MMGs taking the economic benefits of MGs and the reliability and stability of the DN into account. The main contributions of this paper are summarized below:
(1)
A novel market energy management framework: A new market management framework for the DN with an MMG is proposed based on a dynamic game. In the game, DNO is the leader and MG operators (MGOs) are the followers; they form a one-leader and many-followers game. They expect to minimize their respective daily operation costs through energy transactions, and they influence each other.
(2)
Simple pricing mechanism: A direct incentive mechanism for electricity price is proposed. The DNO sets a set of day-ahead selling and buying prices, and each MG responds to the price according to its actual situation without having to decide the trading role and having to set the trading range in advance. The simple price strategy encourages MGs to participate in the energy management of the DN and to reduce the operation costs of the system.
(3)
Cost analysis and discussion: The cost components of DNO and MGO are analyzed in detail. It is necessary to increase the penalty function to improve the operation reliability of the distribution network. The extensive numerical analysis shows the practicability of the method.

2. Energy Market Structure

The energy market structure of a DN with an MMG is shown in Figure 1. There are three MGs connected to the DN from different nodes. Each MG consists of a PV system, energy storage and transferable loads. The involved entities are explained as follows:
(1)
DNO: It is mainly responsible for the stable operation of the system and for providing a reliable power supply. It sets the reasonable selling price ( P c s ) and buying price ( P c b ) to encourage an MG to participate in the DN transaction. When there is an internal mismatch between power generation and power demand, the DNO is required to trade with the utility grid.
The price set by the DNO needs to meet the following constraints:
P c s [ P c s 1 , P c s 2 , P c s 3 , P c s T ]
P c b [ P c b 1 , P c b 2 , P c b 3 , P c b T ]
P c s t > P c b t ,   t [ 1 , 2 , 3 , T ]
( P c b t , P c s t ) [ P g b t , P g s t ] , t [ 1 , 2 , 3 , T ]
where P c s t , P c b t are the selling price and buying price of the DNO at time t, respectively, and P g s t , P g b t are the selling price and buying price of the DN at time t, respectively.
(2)
MGO: It is mainly responsible for the local optimization. Each MGO adjusts its own energy storage and transferable load based on the price information of the DNO. When there is an internal mismatch between power generation and power demand, the MGO is required to trade with the DNO to balance supply and demand.
The structure of energy trading is summarized in Figure 2. Both the DNO and the MGO want to minimize daily operation costs, and through the electricity price incentive mechanism, the economic cost and safety of the system are improved.

3. Problem Formulation

3.1. Modeling of MGO

3.1.1. Objective Function: Operation Cost of MGO

The operation cost of the MGO includes three parts: the transaction cost of the DNO, the loss of energy for storage system and the adjustment penalty of transferable load. They can be expressed as:
C M G O , i = t = 1 t = T ( P c s t · n l b , i t P c b t · n l s , i t + k 1 · ( e s s i t ) 2 + k 2 ( Δ l i t ) 2 )
where C M G O , i is the operation cost of the i-th MGO, T is the time period, n l b , i t is the electricity needed to be bought to supply the net load demand, n l s , i t is the electricity sold by the i-th MGO, k 1 is the factor of the loss of energy for the storage system, k 2 is a penalty factor for transferable loads, e s s i t is the charge and discharge energy of the storage system and Δ l i t is the adjustable amount of transferable load.

3.1.2. Constraints

(1) Net load constraint
Since the direction of net load energy flow is unique each time, the net load constraints of the MG can be described as:
n l b , i t n l s , i t = l i t + e s s i t p v i t
n l max d b , i t n l b , i t 0
n l max d s , i t n l s , i t 0
d b , i t + d s , i t 1
where l i t is the load of the i-th MG, p v i t is the PV power generation and n l max , n l min are the maximum and minimum net load of the MG, respectively. d b , i t , d s , i t is a variable of 0,1.
(2) Energy storage constraint
The constraint for the energy storage system [25] can be described as:
e s s i = ( e s s i c h η c h e s s i d i s η d i s ) · Δ t
e s s i max e s s i , t e s s i min
S O C i , t e s s = S O C i , t 1 e s s + e s s i , t
S O C i , t e s s , max S O C i , t e s s S O C i , t e s s , min
S O C i , 0 e s s = S O C i , T e s s
where e s s i c h , e s s i d i s are the charge and discharge energy for the storage system in the i-th MG, respectively; η c h , η d i s are the charge and discharge efficiency of the energy storage system in the i-th MG, respectively; e s s i max , e s s i min are the maximum and minimum charge and discharge energy for the storage system in the i-th MG, respectively; S O C i , t e s s , S O C i , t 1 e s s are the energy stored at time t and time t−1 in the i-th MG, respectively; S O C i , t e s s , max , S O C i , t e s s , min are the maximum and minimum energy stored for the storage system in the i-th MG, respectively; S O C i , 0 e s s , S O C i , T e s s are the energy stored at time 0 and time T in the i-th MG, respectively.
(3) Transferable load constraints
l i t = l o a d i t + Δ l i t
t = 0 t = T Δ l i t = 0
c · l o a d i t Δ l i t c · l o a d i t
where l i t is the transferable value of load in the i-th MG at time t; l o a d i t is the original load in the i-th MG at time t.

3.2. Modeling of DNO

3.2.1. Objective Function: Operation Cost of DNO

The operating costs of the DNO mainly include the transaction costs for the DN, the transaction costs for the MGO and the penalty cost of overvoltage and overcurrent. Its mathematical expression can be described as:
C D N O = t = 0 t = T ( C D N t + C M G t + Π )
C D N t = P n l b t P g s t P n l s t P g b t
C M G t = P c s h · i = 0 i = N ( n l b , i ) + P c b h · i = 0 i = N ( n l s , i )
Π = ( θ 1 · max ( V i V max , 0 ) + max ( V min V i , 0 ) + θ 2 · max ( P i j P max , 0 ) )
where C D N O is the operating cost of the DNO and P n l b t , P n l s t is the electricity needed to be bought for the net load demand and the electricity sold by the DNO, respectively; Π is a penalty function.

3.2.2. Constraints

(1) Power flow constraint
According to the power flow calculation [26], the following constraints need to be satisfied:
{ P i t i i j t ( R i j + j X i j ) = P j t Q j t i i j t ( R i j + j X i j ) = Q j t
v j t = v i t 2 ( R i j P i j t + X i j Q i j t ) + ( R i j 2 + X i j 2 ) i i j t
P i j P max .
(2) Voltage and current constraint
V i min V i t V i max
| I i j t | I i j max
where R i j , X i j are the resistance and reactance of the branch ij; I i j t is the current of the branch ij at time t; P j t , Q j t are the active power and reactive power of j node at time t; P i j t , Q i j t are the active power and reactive power at the head of the branch ij at time t; V 1 t is the voltage of the DN at time t; V b u s t is the bus voltage at time t; V j t is the voltage of node j at time t; V i max is the upper limit of the voltage at the node I; V i min is the lower limit of the voltage at the node i and I i j max is the upper limit of the branch current.

4. Dynamic Game Model

The dynamic game model constructed in this paper can be described as follows: the DNO as a leader sets an electricity price according to its own operation cost; with the known electricity price, the MGO acts as a follower to adjust the transferable load and energy storage to achieve the minimum cost. The DNO and each MGO form a one-leader, multi-follower game model. The DNO uses the internal electricity price to guide each MGO to perform the internal scheduling of the MGs according to their respective optimization goals, which indirectly improves energy sharing levels between MGOs. Mathematically, it can be expressed as:
G = { { I ( D N O ) } , { P B } , { P S } , { E l } , { E e s s } , { C M G O , i } , { C D N O } }
where I ( D N O ) is the two sides of the game, namely the MGO cluster and the DNO; P B is the collection of the buying price of DNO; P S is the collection of the selling price of DNO; E l is the collection of the controllable load; { E e s s } is the collection of energy storage; C M G O , i is the set of operation costs for MGO and C D N O is the collection of operation costs for DNO. { P B } , { P S } , { E l } , { E e s s } are the set of solutions for the dynamic game model. When the operation costs of the MGO ( C M G O , i ) and the operation costs of the DNO ( C D N O ) are the lowest, there is an optimal solution set of G that satisfies:
U i t ( P B t * , P S t * , E l t * , E e s s t * ) U i t ( P B t * , P S t * , E l , i t , E l , i t * , E e s s , i t , E e s s , i t * ) , i I , E l , i t E l t , E e s s , i t E e s s t
P R O s o t ( P B t * , P S t * , E l t * , E e s s t * ) P R O s o t ( P B t , P S t , E l t * , E e s s t * ) , P B t P B t , P S t P S t
E l , i t = { E l , 1 t , E l , 2 t , , E l , i 1 t , E l , i + 1 t , , E l , I t }
E e s s , i t = { E e s s , 1 t , E e s s , 2 t , , E e s s , i 1 t , E e s s , i + 1 t , , E e s s , I t }
where P B t * , P S t * are the equilibrium solution of the buying and selling price of the DNO at the time t; E l t * is the equilibrium solution of the load strategy sets of all MGs; E e s s t * is the equilibrium solution of the energy storage strategy sets of all MGs; E l , i t * is the equilibrium solution of the load strategy sets of all MGs except the i-th MG; E e s s , i t * is the equilibrium solution of the energy storage strategy sets of all MGs except the i-th MG; E l t is a collection of all the load strategies; E e s s t is a collection of all the energy storage strategies and P B t and P S t are a collection of all the price strategies of DNO.

5. Solution Process

A heuristic algorithm, such as the differential evolution (DE) algorithm, is employed to solve the dynamic game model, while a mixed integer programming (MIP) method is used to determine the net load constraint of the MG. The solution process can be decomposed into two layers. The upper layer is responsible for obtaining the solution of the DNO, which optimizes the selling price and buying price. Algorithm 1 shows the solution process executed by the DNO; the lower layer is responsible for obtaining the solution of the MGO, which optimizes the energy storage and transferable load according to the price information of the DNO. Algorithm 2 shows the solution process executed by the MGO.
Algorithm 1 Solution process executed by distribution network operator (DNO)
1: Initialization: p c s h , p c b h , n l b h , n l s h , l o a d , p g s h , p g b h
  G = 0.
2: Group initialization: randomly generate the total population of the father ( P c b 1 , P c s 1 ).
3: Repeat:
4: G = G+1.
5: For Each MG iN
Send the price of DNO to MG iN.
MG i execute Algorithm 2.
Receive the optimized energy storage and transferable load of MG i.
6: End
7: Calculate the running cost of DNO ( C D N O ).
8: The progeny population is obtained through crossover and mutation.
    ( P c b _ G , P c s _ G ).
9: Execute steps 4–8 and calculate the operation cost of DNO.
10: If C D N O _ G C D N O _ G
P c b _ G + 1 = P c b _ G , P c s _ G + 1 = P c s _ G
  Else
P c b _ G + 1 = P c b _ G , P c s _ G + 1 = P c s _ G + 1
11: End if
12: Until the convergence condition is reached.
Algorithm 2 Solution process executed by MGO
1: MG system parameter initialization e s s i , p v i , l o a d , k 1 , k 2 .
2: Obtain population data ( P c b , P c s ) from DNO.
3: Solve energy storage and transferable load in each MG using MIP. Min
   C M G O , i , s.t. Equations (1)–(12).
4: Calculate the optimal net load according to energy storage, transferable
  load and PV power generation.
5: Pass the optimized net load to DNO.

6. Results and Discussions

6.1. Study System

In order to verify the effectiveness of the proposed method, a case study was carried out at the modified IEEE-33 bus system, in which three MGs were located at the nodes 12, 24 and 30, as shown in Figure 1 [27]. The basic data for the PV power generation and load demand in each MG are shown in Figure 3. The control range of the transferable load was 80%–120% of the load demand. The battery was selected as an energy storage device with a total capacity of 200 kWh; the initial state of charge (SOC) was 0.2 and the maximum and minimum allowable SOCs were 0.9 and 0.1, respectively. The maximum power allowed to charge and discharge the battery was 50 kW, the charging efficiency η c h and the discharging efficiency η d i s were 0.9, and k 1 took 0.0004 while k 2 took 0.001. The penalty factor θ 1 and θ 2 took 100. The grid electricity price was taken and the actual time-of-use electricity price is shown in Table 1.

6.2. Numerical Results

6.2.1. Analysis of Internal Prices

The CPLEX tool in MATLAB2017b was used to obtain an equilibrium solution for the dynamic game model. Figure 4 shows the internal buying and selling prices of the DN for every time slot during a day. In the time slots 0–6, the PV power generation was zero and the load demand during this period was low, so the DNO set a low selling price to promote MGs to purchase electricity from the DNO. In the time slots 7–8 and 16–20, there was no sufficient amount of PV power generation, so the DNO set a high buying price to attract MGs to sell more electricity to the DNO. In the time slots 9–15, the amount of PV power generation was excessive, and the DNO reduced the selling price to promote MGs to purchase electricity from the DNO.

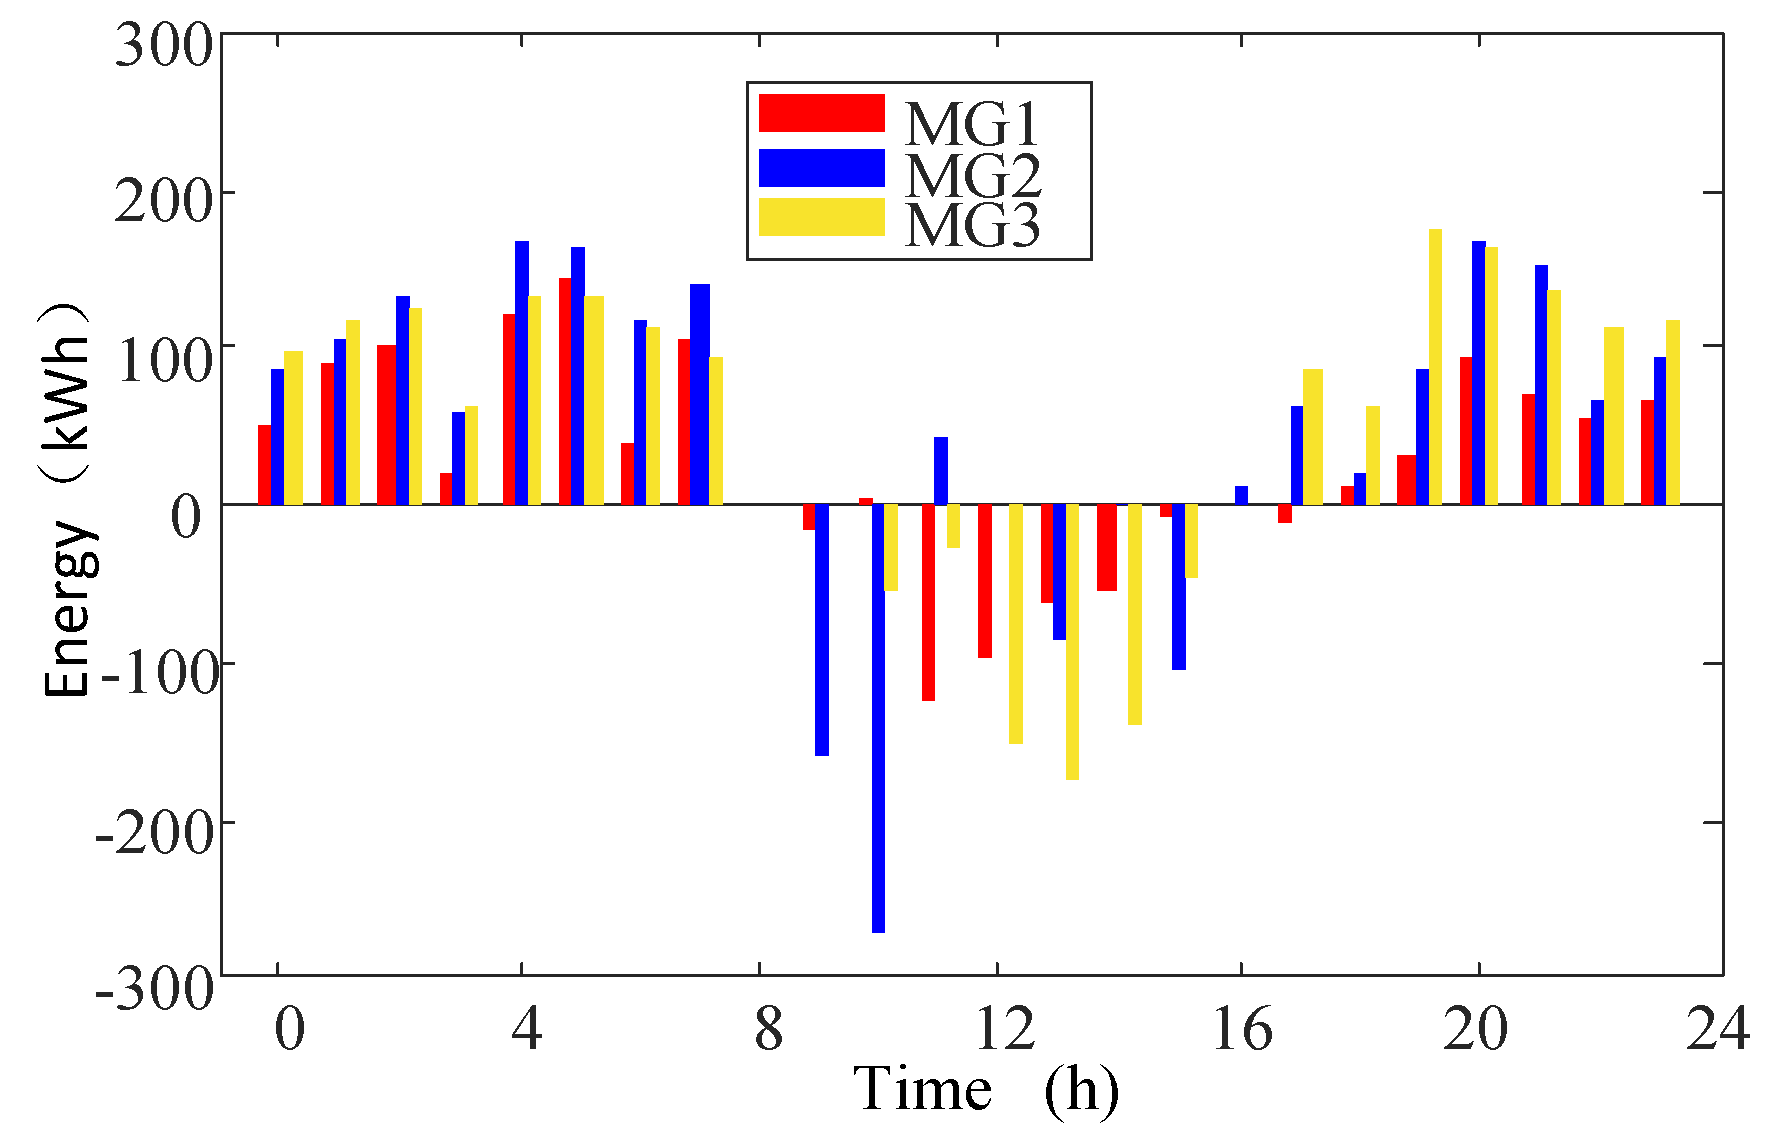
6.2.2. Analysis of Demand Response Based on Electricity Price

The results of the demand response of each MG to the price set by the DNO were obtained. Figure 5 shows the optimized SOCs and the charging and discharging power of the energy storage system in three MGs. In time slots 0–1 and 3–5, the DNO set a low selling price so the energy storage could be charged by cheap electricity to prepare for the daytime load demand. In time slots 6–9 and 16–21, the PV power generation was not sufficient, and the energy storage could choose to discharge. In time slots 8–9, the energy storage in the MG1 discharged too much in the previous hour and reached the boundary value of the capacity, so it was necessary for it to be charged. In the period of 9–15, the PV power generation was excessive, and the energy storage was charged to prepare for the peak of load demand at night. At time slot 24, the energy storage capacity returned to 60 kWh to satisfy the time coupling characteristics of the energy storage.
Figure 6 shows the optimization results of the transferable load of three MGs. In time slots 0–6, the DNO set a low selling price to shift more load demand into this period. In time slots 7 and 8, the PV power generation and energy storage discharge could satisfy the load demand, so the transferable load was reduced. In time slots 9–15, the PV power generation was high, so the DNO set a low selling price to encourage more of the load to consume PV power. In time slots 16–22, the electricity consumption was in the peak period and the PV system did not generate electricity, so the transferable load was reduced. In time slots 23–24, the DNO set a low selling price to encourage the MGO to increase the transferable load to meet the global constraint. The optimization of the transferable load achieved the effect of cutting the peak and filling the valley.

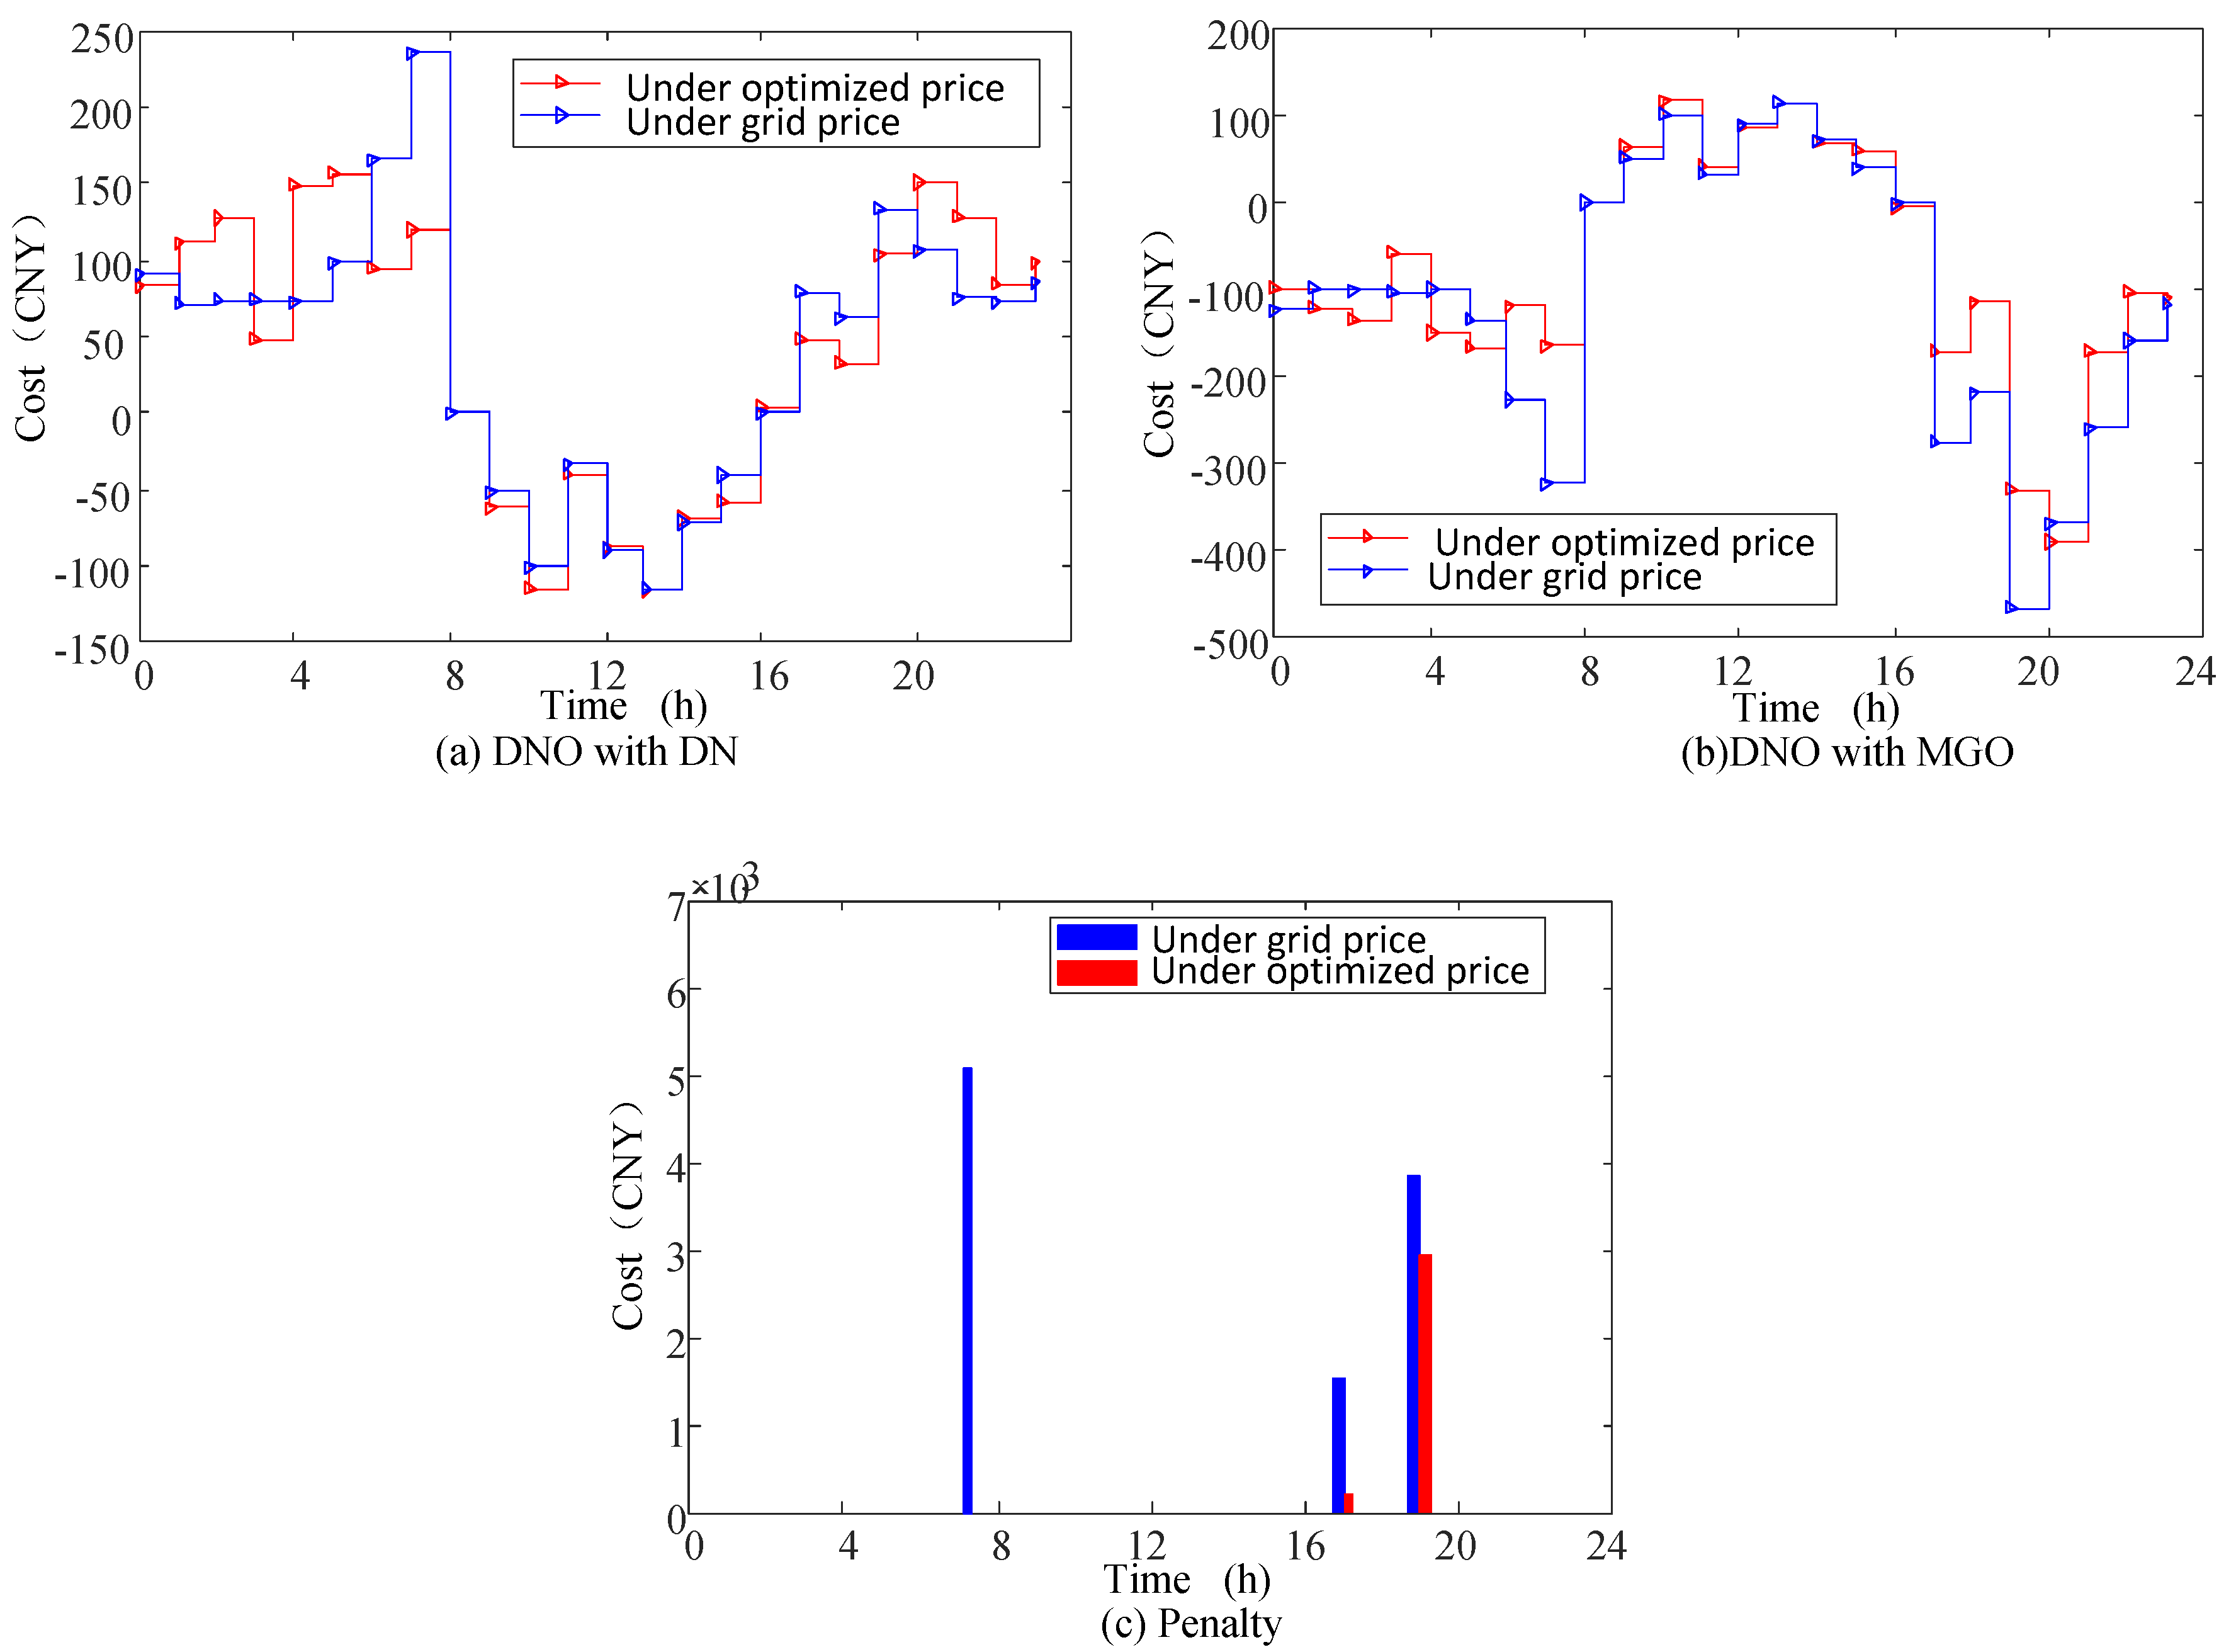
6.2.3. Analysis of Results Under Grid Price and Optimized Price

(a) Reliability and Stability of the System
Figure 7 and Figure 8 show the net load demand of each MG under the grid price and the optimized price, respectively. It can be observed from Figure 7 that some MGs needed to buy electricity from the DNO, and the other MGs needed to sell electricity to the DNO in the time slots 9–10 and 16–17, which indirectly promotes energy sharing between the MGs.
Figure 9 shows the comparison of the total net load demand of the three MGs. In time slots 1–2 and 4–5, the net load demand was higher than the original one due to the low selling price, where the energy storage system was charged and the transferable load was increased. In the other time periods, the optimized net load demand was lower than the original one. Consequently, the peak-to-average ratio of the net load demand was reduced from 5.48 to 3.77. This will improve the reliability and stability of the DN.
Figure 10 shows the voltages of all the nodes in the IEEE-33 bus system at each hour of the day. It can be seen that the bus voltages at all nodes were quite stable, where the minimum node voltage of the DN was 97% of the rated voltage, and the maximum voltage was near the rated voltage. Figure 11 shows the comparison of the maximum powers of all the branches in the IEEE-33 bus system at each hour of the day under the optimized price and grid price, respectively, where the power limit was set to 1000 kW. We can see that the maximum powers of all braches under the grid price exceeded the power limit three times (i.e., in time slots 7, 17 and 19), while those under the optimized price only exceeded the power limit two times (i.e., in time slots 17 and 19). Since almost all of the maximum power flow of the branch was less than 1000 kW, the reliability and stability of the DN was improved.
(b) Economic Benefits of the System
Figure 12 shows the comparison of the transaction costs between the MG and the DNO under the grid price and optimized price. As can be seen from Figure 12, the transaction costs of the MG under the optimized price was lower than those under the grid price in the time slots 0, 3 and 6–24. In the time slots 1–2 and 4–5, the transaction costs under the optimized price were a little higher than those under the grid price because the energy storage was in charge, and the load was increasing. We can see that during most of the time, the transaction cost under the optimized price was lower than that under the grid price. This proves that the proposed electricity price strategy effectively reduces the cost of the MGO.
Figure 13a shows the transaction costs of the DNO and the DN. In time slots 1–2 and 4–5, since the grid price was in the valley period, the DNO purchased more electricity from the DN and sold it to the MGO to meet the load demand and to charge energy into the battery, which increased the transaction cost between the DNO and the DN. In time slots 21–24, the transaction cost was also increased because the amount of electricity transactions between three MGs and the DNO increased (see Figure 7 and Figure 8). Figure 13b shows the transaction cost of the DNO and the MGO. To encourage the MG to participate in the operation of the DN, the buying price of DNO was higher than that of the DN, and the selling price of DNO was lower than that of the DN, so the cost of the DNO under the optimized price was slightly higher than that under the grid price. The penalty cost of the DNO was greatly reduced, as shown in Figure 13c, as the maximum powers of all braches under the grid price greatly exceeded the power limit (see Figure 11).
The operating cost of each unit under the grid price and optimized price is shown in Table 2. It can be seen that the operating costs of the MGOs and the DNO under the grid electricity price were much higher than those under the optimized price. Thus, the optimization method based on the dynamic game strategy significantly reduced the operation costs of the system, which verifies the effectiveness of the proposed strategy.

7. Conclusions

In this paper, an energy market management for a DN and an MMG based on a dynamic game is proposed, and an electricity price incentive mechanism is studied. As a leader, the DNO sets an electricity selling and buying price with the minimum daily operating cost while satisfying the voltage and power constraints of the DN. As a follower, an MGO optimizes the transferable load and energy storage according to the electricity price. The differential evolution algorithm and mixed integer programming method are applied to obtain the equilibrium solution for the game strategy. Numerical simulations of the modified IEEE-33 bus system validate the effectiveness of the proposed strategy. Compared with the grid electricity price, the optimized electricity price can effectively improve energy sharing levels between MGs, reduce the operating cost of the system and ensure the reliability and stability of the system operation. Future work will consider the influence of microgrids with different characteristics and seasonal variations on the energy management of the distribution network using the proposed strategy.

Author Contributions

Formal analysis, C.H., W.S., C.Z. and B.W.; Funding acquisition, C.H.; Methodology, X.T. and T.R.; Writing—original draft, X.T.

Funding

This work was supported by the National Key R&D Program of China (Nos. 2016YFB0900400).

Conflicts of Interest

The authors declare no conflict of interest.

Nomenclature

Abbreviations
DNThe distribution network
DNOThe distribution network operator
MGThe microgrid
MMGThe multi-microgrid
MGOThe microgrid operator
PVThe photovoltaic
Symbols
P c s t The selling price of the DNO at time t
P c b t The buying price of the DNO at time t
P g s t The selling price of the DN at time t
P g b t The buying price of the DN at time t
C M G O , i The operation cost of the i-th MGO
n l b , i t Total net power purchase load
n l s , i t Total net load of electricity sold
e s s i The energy storage of the i-th MGO
l i t The transferable value of load in the i-th MG
C D N O The operating cost of the DNO
C D N t The transaction costs with the DN
C M G t The transaction costs with the MGO
Π The penalty function
v i t The voltage of node i

References

  1. Li, Z.; Xu, Y. Optimal coordinated energy dispatch of a multi-energy microgrid in grid-connected and islanded modes. Appl. Energy 2018, 210, 974–986. [Google Scholar] [CrossRef]
  2. Xu, Y.L.; Shen, X.W. Optimal Control Based Energy Management of Multiple Energy Storage Systems in a Microgrid. IEEE Access 2018, 6, 32925–32934. [Google Scholar] [CrossRef]
  3. Li, M.; Zhang, X.; Li, G.; Jiang, C. A feasibility study of microgrids for reducing energy use and GHG emissions in an industrial application. Appl. Energy 2016, 176, 138–148. [Google Scholar] [CrossRef]
  4. García Vera, Y.E.; Dufo-López, R.; Bernal-Agustín, J.L. Energy Management in Microgrids with Renewable Energy Sources: A Literature Review. Appl. Sci. 2019, 9, 3854. [Google Scholar] [CrossRef] [Green Version]
  5. Che, L.; Zhang, X.; Shahidehpour, M.; Alabdulwahab, A.; Abusorrah, A. Optimal interconnection planning of community microgrids with renewable energy sources. IEEE Trans. Smart Grid 2017, 8, 1054–1063. [Google Scholar] [CrossRef]
  6. Shen, X.; Shahidehpour, M.; Zhu, S.; Han, Y.; Zheng, J. Multi-stage planning of active distribution networks considering the co-optimization of operation strategies. IEEE Trans. Smart Grid 2018, 9, 1425–1433. [Google Scholar] [CrossRef]
  7. Han, Y.; Zhang, K.; Li, H.; Coelho, E.A.A.; Guerrero, J.M. MAS-based distributed coordinated control and optimization in microgrid and microgrid clusters: A comprehensive overview. IEEE Trans. Power Electron. 2018, 33, 6488–6508. [Google Scholar] [CrossRef] [Green Version]
  8. Farhad, S.G.; Salehi, J. Optimal bilevel model for stochastic risk-based planning of microgrids under uncertainty. IEEE Trans. Ind. Inform. 2018, 14, 3054–3064. [Google Scholar]
  9. Zhao, Z.; Yang, P.; Wang, Y.; Xu, Z.; Guerrero, J.M. Dynamic Characteristics Analysis and Stabilization of PV-Based Multiple Microgrid Clusters. IEEE Trans. Smart Grid 2017, 10, 805–818. [Google Scholar] [CrossRef] [Green Version]
  10. Hans, C.A.; Braun, P.; Raisch, J.; Grune, L.; Reincke-Collon, C. Hierarchical Distributed Model Predictive Control of Interconnected Microgrids. IEEE Trans. Sustain. Energy 2018, 10, 407–416. [Google Scholar] [CrossRef] [Green Version]
  11. Farhad, S.G.; Salehi, J. Stochastic multi-objective framework for optimal dynamic planning of interconnected microgrids. IET Renew. Power Gener. 2017, 11, 1749–1759. [Google Scholar]
  12. Zhao, B.; Wang, X.; Lin, D.; Calvin, M.M.; Morgan, J.C.; Qin, R.; Wang, C. Energy management of multiple microgrids based on a system of systems architecture. IEEE Trans. Power Syst. 2018, 33, 6410–6421. [Google Scholar] [CrossRef]
  13. Nikmehr, N.; Najafi Ravadanegh, S. Optimal power dispatch of multi-microgrids at future smart distribution grids. IEEE Trans. Smart Grid 2015, 6, 1648–1657. [Google Scholar] [CrossRef]
  14. HU, X.; LIU, T. Co-optimisation for distribution networks with multi-microgrids based on a two-stage optimisation model with dynamic electricity pricing. IET Gener. Transm. Dis. 2017, 11, 2251–2259. [Google Scholar] [CrossRef]
  15. Kaveh, D.; Hashem, N. An Agent-Based Hierarchical Bargaining Framework for Power Management of Multiple Cooperative Microgrid. IEEE Trans. Smart Grid 2019, 10, 514–522. [Google Scholar]
  16. Stevanoni, C.; Zacharie, D.G.; Francois, V.; Olivier, D. Long-Term Planning of Connected Industrial Microgrids: A Game Theoretical Approach Including Daily Peer-to-Microgrid Exchanges. IEEE Trans. Smart Grid 2019, 10, 2245–2256. [Google Scholar] [CrossRef]
  17. Lee, J.H.; Guo, J.; Choi, J.K.; Zukerman, M. Distributed energy trading in microgrids: A game theoretic model and its equilibrium analysis. IEEE Trans. Ind. Electron. 2015, 62, 3524–3533. [Google Scholar] [CrossRef]
  18. Belgana, A.; Rimal, B.P.; Maier, M. Open energy market strategies in microgrids: A stackelberg game approach based on a hybrid multiobjective evolutionary algorithm. IEEE Trans. Smart Grid 2015, 6, 1243–1252. [Google Scholar] [CrossRef]
  19. Bae, S.; Park, S. Comparison Between Seller and Buyer Pricing Systems for Energy Trading in Microgrids. IEEE Access 2019, 7, 54084–54096. [Google Scholar] [CrossRef]
  20. Tushar, W.; Chai, B.; Yuen, C.; Smith, D.B.; Wood, K.L.; Yang, Z.; Vincent Poor, H. Three-party energy management with distributed energy resources in smart grid. IEEE Trans. Ind. Electron. 2015, 62, 2487–2498. [Google Scholar] [CrossRef] [Green Version]
  21. Liu, N.; Yu, X.; Wang, C.; Wang, J. Energy sharing management for microgrids with PV prosumers: A stackelberg game approach. IEEE Trans. Ind. Inform. 2017, 13, 1088–1098. [Google Scholar] [CrossRef]
  22. Ma, L.; Liu, N.; Zhang, J.; Tushar, W.; Yuen, C. Energy management for joint operation of CHP and PV prosumers inside a grid-connected microgrid: A game theoretic approach. IEEE Trans. Ind. Inform. 2016, 12, 1930–1942. [Google Scholar] [CrossRef]
  23. Jadhav, A.M.; Patne, N.R.; Guerrero, J.M. A Novel Approach to Neighborhood Fair Energy Trading in a Distribution Network of Multiple Microgrid Clusters. IEEE Trans. Ind. Electron. 2019, 66, 1520–1531. [Google Scholar] [CrossRef] [Green Version]
  24. Gil-González, W.; Montoya, O.D.; Holguín, E.; Garces, A.; Grisales-Noreña, L.F. Economic dispatch of energy storage systems in dc microgrids employing a semidefinite programming model. J. Energy Storage 2019, 21, 1–8. [Google Scholar] [CrossRef]
  25. Liu, Y.; Guo, L.; Wang, C. A robust operation-based scheduling optimization for smart distribution networks with multi-microgrids. Appl. Energy 2018, 228, 130–140. [Google Scholar] [CrossRef]
  26. Kim, H.-Y.; Kim, M.-K.; Kim, H.-J. Optimal Operational Scheduling of Distribution Network with Microgrid via Bi-Level Optimization Model with Energy Band. Appl. Sci. 2019, 9, 4219. [Google Scholar] [CrossRef] [Green Version]
  27. Moradi, M.H.; Abedini, M.; Hosseinian, S.M. A combination of evolutionary algorithm and game theory for optimal location and operation of DG from DG owner standpoints. IEEE Trans. Smart Grid 2016, 7, 608–616. [Google Scholar] [CrossRef]
Figure 1. Energy market structure of distribution network (DN) with multi-microgrid (MMG).
Applsci 09 05436 g001
Figure 2. Structure of energy trading.
Applsci 09 05436 g002
Figure 3. Basic data of the study system: (a) Photovoltaic (PV) power generation and (b) load demand.
Applsci 09 05436 g003
Figure 4. Buying and selling electricity prices of DN.
Applsci 09 05436 g004
Figure 5. Optimized state of charge (SOCs)and the charging and discharging power of the energy storage system.
Applsci 09 05436 g005aApplsci 09 05436 g005b
Figure 6. Optimized transferable load demand.
Applsci 09 05436 g006
Figure 7. Net load demand under grid price.
Applsci 09 05436 g007
Figure 8. Net load demand under optimized price.
Applsci 09 05436 g008
Figure 9. Comparison of total net load demand before and after optimization.
Applsci 09 05436 g009
Figure 10. Voltage of all the nodes in the IEEE-33 bus system.
Applsci 09 05436 g010
Figure 11. Comparison of maximum power of all the branches in the IEEE-33 bus system under optimized price and grid price.
Applsci 09 05436 g011
Figure 12. Comparison of transaction costs between microgrid operator (MGO) and DNO.
Applsci 09 05436 g012aApplsci 09 05436 g012b
Figure 13. (a) Operating cost between DNO with DN, (b) Operating cost between DNO with MGO and (c) penalty before and after optimization.
Applsci 09 05436 g013
Table 1. Time-of-use (TOU) price.
TOU TypesHour (h)Selling Price
(CNY/kWh)
Purchasing Price
(CNY/kWh)
Peak10:00–13:00
18:00–23:00
1.24120.3573
Flat09:00–10:00
13:00–18:00
23:00–24:00
0.77930.3573
Valley01:00–09:00
24:00–00:00
0.48800.3573
Table 2. Comparison between operating costs under grid price and those under optimized price.
ClassificationMGO1MGO2MGO3DNO
Cost under grid electricity price/CNY522.4030978.74771145.511,140
Costunder optimized electricity price/CNY348.5904689.1699827.26714417
Reduction rate33.27%29.59%27.78%60.35%

