Article

An Improved Probabilistic Neural Network Model for Directional Prediction of a Stock Market Index

by
Vasana Chandrasekara
1,*,
Chandima Tilakaratne
2 and
Musa Mammadov
3
1
Department of Statistics & Computer Science, University of Kelaniya, Kelaniya 11600, Sri Lanka
2
Department of Statistics, University of Colombo, Colombo 00700, Sri Lanka
3
School of Information Technology, Deakin University, Geelong VIC 3220, Australia
*
Author to whom correspondence should be addressed.
Appl. Sci. 2019, 9(24), 5334; https://doi.org/10.3390/app9245334
Submission received: 7 October 2019 / Revised: 15 November 2019 / Accepted: 27 November 2019 / Published: 6 December 2019
(This article belongs to the Section Computing and Artificial Intelligence)

Abstract

:
Financial market prediction attracts immense interest among researchers nowadays due to rapid increase in the investments of financial markets in the last few decades. The stock market is one of the leading financial markets due to importance and interest of many stakeholders. With the development of machine learning techniques, the financial industry thrived with the enhancement of the forecasting ability. Probabilistic neural network (PNN) is a promising machine learning technique which can be used to forecast financial markets with a higher accuracy. A major limitation of PNN is the assumption of Gaussian distribution as the distribution of input variables which is violated with respect to financial data. The main objective of this study is to improve the standard PNN by incorporating a proper multivariate distribution as the joint distribution of input variables and addressing the multi-class imbalanced problem persisting in the directional prediction of the stock market. This model building process is illustrated and tested with daily close prices of three stock market indices: AORD, GSPC and ASPI and related financial market indices. Results proved that scaled t distribution with location, scale and shape parameters can be used as more suitable distribution for financial return series. Global optimization methods are more appropriate to estimate better parameters of multivariate distributions. The global optimization technique used in this study is capable of estimating parameters with considerably high dimensional multivariate distributions. The proposed PNN model, which considers multivariate scaled t distribution as the joint distribution of input variables, exhibits better performance than the standard PNN model. The ensemble technique: multi-class undersampling based bagging (MCUB) was introduced to handle class imbalanced problem in PNNs is capable enough to resolve multi-class imbalanced problem persisting in both standard and proposed PNNs. Final model proposed in the study with proposed PNN and proposed MCUB technique is competent in forecasting the direction of a given stock market index with higher accuracy, which helps stakeholders of stock markets make accurate decisions.

1. Introduction

Financial Markets play a major role in controlling dynamics of the world economy. Forecasting of financial markets has had great importance recently due to the rapid increase in the investments of financial markets in the past decades. The stock market is one of the leading financial markets in this regard due to the importance and interest of many stakeholders. The profitability of investing in financial markets is directly proportional to its predictability [1,2,3,4]. Efficient market hypothesis indicates that market prices fully reflect all available information, and “beating the market” is very difficult. Researchers found that the weak form of the efficient market hypothesis exists in the real world and suggested that prediction is possible using this weak form with a satisfactory degree of accuracy [5,6,7]. On the other hand, movements of stock market index depend on combined impact factors such as news, civil unrest, natural disasters, psychological factors, inflation, etc. Most of these factors are immeasurable and/or intangible. Therefore, it is very difficult to identify and measure all the factors that affect stock markets. When considering the real world phenomena, it can be seen that all effects reflect on other financial markets and on other indices. Hence, it is worth to use inter-market influences in stock market predictions [1,2].
Different techniques have been used by researchers for financial market predictions, and time series models can be identified as one of the widely used techniques as shown in the literature [8,9,10]. Even though they are capable of forecasting financial markets, the downside of the time series models are the assumptions associated with them such as constant variance, linear relationships and normality where most of the financial time series data do not agree with them. Furthermore, time series models used for financial market predictions exhibit less accuracy [11]. Consequently, linear time series models are not capable enough to capture the non-linear dependencies in financial data. Development of machine learning techniques leads to improve the forecasting ability of financial markets. Machine learning techniques can be identified as apposite techniques to predict financial markets, which exhibit higher accuracy in predictions and can capture non-linear relationships. Many researches recently proved that machine learning techniques can be successfully used for forecasting financial markets with a satisfactory degree of accuracy [2,12,13,14,15,16].
Literature reveals that the directional prediction is more effective and leads to higher profits than the value prediction [17,18,19]. Directional prediction is a classification problem. Probabilistic neural networks (PNN), support vector machines (SVM) and feedforward neural networks (FNN) can be recognized as the common machine learning techniques for the classification of future movements of stock market, and researchers revealed that the PNN is a powerful tool for classification problems as it shows higher accuracy in forecasting [1,18,20,21,22]. Despite the fact that the PNN is a powerful tool in classification, the standard PNN algorithm encompasses some shortcomings such as not considering a joint distribution other than the Gaussian, as the distribution of input variables where, the real world financial data do not always follow Gaussian distribution [23,24,25]. Conversely, a major issue associated with most of the real-world data sets is class imbalanced problem, which leads to reduce performance of classifiers [26,27,28]. The standard PNN algorithm does not facilitate handling the multi-class imbalanced problem in the classification of cost sensitive data which is very frequent in reality [26,27,28,29].
Therefore, the main objective of this study is to improve the standard PNN model by introducing appropriate (multivariate) joint probability distribution for non-Gaussian input variables and embedding a feasible technique to handle multi-class imbalanced problem for cost sensitive data.
It is hard to find published evidences for the availability of a PNN algorithm which facilitates the incorporation of multivariate probability distribution other than the Gaussian distribution and handling multi-class imbalanced problem for cost sensitive data. This study will develop such a model to forecast the direction of a given stock market for any time period. The proposed model is capable of forecasting the direction of a given stock market index with a higher accuracy. The final outcome of this research will lead to provide quick, reliable forecast for a given stock market index, and it will help governments, financial institutes, stockbrokers, agents and investors to utilize their money effectively. Furthermore, findings of this research can be applied to handle classification problems in other research areas such as climate, weather, medical, agriculture, biology and marketing research.
Organization of the paper is as follows: Section 2 contains materials and methods used in the study while all the results obtained are presented in Section 3. Discussion of the study is in Section 4 and Section 5 concludes the paper.

2. Materials and Methods

In order to achieve the objectives of the study, the following steps were followed. As the first step, stock market indices to be predicted were selected by considering different stock market types such as highly volatile markets (US markets), less volatile markets (Australian markets) and emerging markets (Colombo stock exchange) and daily stock price indices of the selected stock markets and potential influential markets were downloaded for a six year period. Then, input features (explanatory variables) for forecasting the direction of each selected stock market indices were identified. After that, the marginal probability distributions of selected stock indices and explanatory variables were estimated, and the joint probability distributions of each selected input set were estimated using parameter optimization. As the next step, estimated joint probability distributions were incorporated to the PNN algorithm. Subsequently, the direction of each selected stock market index was predicted using the modified PNN algorithm as well as the standard PNN algorithm and the performance of the two algorithms were compared by means of prediction accuracy. After that an appropriate ensemble technique was introduced to handle multi-class imbalanced problem and standard PNN algorithm and modified PNN algorithm were incorporated into the introduced ensemble technique. Afterward the direction of each stock market index under the study was predicted and the performances were compared. Then the generalization ability of the final model was tested using a novel data set, and finally a dynamic model for forecasting the direction of a given stock market index with higher accuracy was built.

2.1. Data Collection and Data Pre-Processing

Daily data of six years were downloaded for the following financial indices: Australian stock market index (AORD), United States stock market index (GSPC), Sri Lankan stock market index(ASPI), Amex oil index (XOI), Amex gold index (HUI), world cocoa index, exchange rate of Australian dollar to United States dollar (AUD-USD) and exchange rate of United States dollar to Sri Lankan rupee (USD-LKR) and considered in the study.
Returns of the considered stock markets and potential inter-markets of the study were calculated using the following formula:
R t = P t P t 1 P t 1
where Rt: return of the current day, Pt: close price of the current day and Pt−1: close price of the previous day.

2.2. Cross Correlation

As real world financial time series usually exhibit non-linear relationships, Spearman cross correlation was used to identify the relationships among financial markets under the study. Equations (2) and (3) provided below illustrate the definition of the Spearman correlation coefficient and the cross correlations for different lag k. Pertinent lower and upper confidence levels can be calculated using Fisher’s r to z transformation for Spearman’s correlation [30,31].
ρ = 1 6 i = 1 n ( x i y i ) 2 n ( n 2 1 )
The CCF at Lag k is:
ρ = 1 6 i = 1 n ( x i y i ) 2 n ( n 2 1 ) ,   k = 0 , 1 , 2 , ρ = 1 6 i = 1 n + k ( y i x t + k ) 2 n ( n 2 1 ) ,   k = 1 , 2 ,   3 ,
where k is the lag and n is the number of observations.

2.3. Scaled t Distribution

The scaled t distribution is useful for modeling data distributions with heavier tails. The location parameter, scale parameter and shape parameter are the three parameters associated with this distribution. Smaller values of the shape parameter yield heavier tails. The probability density function (pdf) of the scaled t distribution is as follows:
f   ( x ) =   Γ ( v + 1 2 ) π ( v 2 ) σ 2   Γ ( v 2 ) [ 1 + ( x μ ) 2 ( v 2 ) σ 2 ]   ( v + 1 2 )
where Γ() represents the gamma function, µ is the location parameter, σ is the scale parameter and ν is the shape parameter. The range of µ is −∞ < µ < ∞, σ2 > 0 and ν > 0 [32].

2.4. Multivariate Scaled t Distribution

A random variable following t distribution (say X) is described by its degrees of freedom parameter ν, a mean µ and a symmetric matrix parameter Σ. In general, Σ is not the covariance of X. In the case Σ is positive definite, the probability density function (pdf) of a random vector X (dimension d) is:
S t ( x ; μ , Σ , ν ) = Γ ( υ + d 2 ) Γ ( υ 2 ) 1 ( υ π ) d 2 1 det ( Σ ) ( 1 + 1 υ ( x μ ) T Σ 1 ( x μ ) ) ( d + υ ) 2
where Σ is a real, symmetric and positive definite matrix with dimension p × p, µ is a real vector with dimension p × 1 and ν is a positive scalar where ν > 1 (only if ν > 1 mean = µ, else undefined) and ν > 2 (only if ν > 2 variance = (ν/ν−2) Σ, else undefined) [33,34].
The above mentioned equation is the general pdf of the multivariate scaled t distribution. If the data are independent or uncorrelated, a reduced form of this equation can be used [32]. As the financial markets considered in this study are correlated, the general pdf of the multivariate scaled t distribution was considered in this study.

2.5. Optimization Problem

The following optimization problem is considered to estimate parameters of the relevant distributions. Lower limit of the shape parameter was set to three as it must be greater than 2 to define the scaled t distribution. It is a known factor that the financial return series exhibit fat tails, and smaller values of the shape parameter indicate better fit to fat tails. Hence, upper limit of ν was fixed to 100. As the diagonal elements of the scale parameter cannot be negative values, lower limit of σ i i was set to zero.
Maximize : f ( μ , Σ , ν )   Subject   to :   μ [ 0.01 ,   0.01 ] ,   ν [ 3 ,   100 ]   =   ( σ i j   ) ;   σ i j =   σ j i   [ 10 ,   10 ] ,   i j                               σ i i [ 0 ,   10 ] ,   i = 1 , 2 , n
The objective function f ( μ , Σ , ν ) is defined as follows: f ( μ ,   , ν ) =   i ( S t ( x i ; μ ,   , ν ) ) 2 if d m i n > 0 and f ( μ ,   , ν ) = d m i n 1 if otherwise; here d m i n is the smallest eigenvalue of .  

2.6. Global Optimization

Different global optimization techniques can be used to solve a non-linear optimization problem, and the performances could be quite different. The global optimization algorithm DSO in global and non-smooth optimization (GANSO) library was used as the global optimization technique in this study. Algorithm DSO is designed for solving unconstrained continuous optimization problems. It uses a line search mechanism where the descent direction is defined via a dynamical systems approach. It can be applied to a wide range of functions, requiring only function evaluations to work. In particular, it does not require gradient information and can be used to find minima of non-differentiable functions. The algorithm DSO from GANSO has been proven to be efficient [35,36].

2.7. Probabilistic Neural Network (PNN)

The most common and popular neural network type used by the researchers in different applications is the ordinary feed-forward neural network (FNN). The FNN is more suitable in value prediction, and as this study aimed at directional prediction which leads to classification problem, probabilistic neural network (PNN) is more suitable than ordinary FNN due to the following reasons. If FNN is used for classification, there is no proper way of deciding the threshold or the adjustment, and such a requirement is not involved in PNN. Further, PNN provides global optimal solutions, which leads to more accurate results.
In 1966, Probabilistic Neural Network (PNN) was introduced by D.F. Specht for classification problems. PNN is a feedforward neural network with four layers: input layer, pattern layer, summation layer and output layer, which are illustrated in Figure 1.
Probabilistic neural network is based on the Bayesian method of classification and can classify a sample with the maximum probability of success. The principle of a Bayesian classifier rests on the selection of class C with the largest product term in the Bayesian classification theorem:
M a x c { P c L c f c ( x ) }
where P c is a priori probability for class C, L c is the loss incurred by misclassifying a sample which actually belongs to class C, X = (x1, x2, … , xk), is the input vector to be classified and f c ( x ) is the probability of X given the density function of class C [18,23].
In general, the distribution of the vector X assumed to be Gaussian:
f c ( x ) = 1 ( 2 π ) k / 2 σ c k n c k = 1 n c e x p ( X Y i c ) ( X Y i c ) 2 σ c 2
where k is the number of elements in X, n c is the number of training samples belong to class C, Y i c is the ith training sample in class C, and σ c is the smoothing parameter. However, past studies depict that the distribution of the vector X may take other possible forms of distributions [17,23,37,38,39,40,41].

2.8. Proposed Ensemble Technique

Ensemble techniques use multiple models and then combine them to produce results, which leads to produce more accurate solutions than a single model. In classification, ensemble techniques train different classifiers for the same training data and use voting to find the final answer for a new input which is known as soft ensemble as well [42]. This study proposes a novel ensemble technique to handle multi-class imbalanced problem called multi-class undersampling based bagging (MCUB), which is summarized in Figure 2.

2.9. Performance Measures

The following measures were used to evaluate the performance of the models [43,44]:
c c u r a c y = ( n u m b e r   o f   o b s e r v a t i o n s   c l a s s i f i e d   c o r r e c t l y s i z e   o f   t h e   t e s t   s e t ) × 100
n M i s c l a s s i f i c a t i o n   p e r c e n t a g e = ( n u m b e r   o f   o b s e r v a t i o n s   c l a s s i f i e d   i n c o r r e c t l y s i z e   o f   t h e   t e s t   s e t ) × 100
M i s c l a s s i f i c a t i o n   p e r c e n t a g e   o f   c l a s s   i = ( W r n g i n i ) × 100
M i s c l a s s i f i c a t i o n   p e r c e n t a g e   o f   c l a s s   i   t o   c l a s s   j = ( W r n g i j n i ) × 100
where Wrngi is the number of observations classified incorrectly which originally belongs to class i, Wrngi,j is the number of observations classified incorrectly as class j which originally belongs to class i, and ni is the number of observations belongs to class i in the test set.

3. Results

This section consists of all the results obtained from the study with respective interpretations.

3.1. Potential Inputs Identification

Identifying potential inputs or feature selection is an important task when neural networks are used for classification. Literature provides evidence for intermarket influences on stock markets [1,2,3,4]. Parametric, non-parametric and graphical techniques were used to identify potential intermarket influences as well as the lag relationships of the interested market itself. Table 1 illustrates finally identified potential inputs for the three stock indices considered in the study.

3.2. Distribution Identification

Identification of appropriate distributions is a challenging task with respect to financial market predictions. Invention of proper marginal distributions of potential explanatory variables which are selected as inputs to the PNN models and pertinent multivariate distributions related to three stock market indices under study will be presented in this section.

3.2.1. Marginal Distribution Identification

Based on the information found in the literature, suitability of different marginal distributions, normal distribution, lognormal distribution, inverse Gaussian distribution, levy distribution, Pareto distribution, scaled t distribution to model the return series of potential inputs were assessed. Normal probability plots of all return series provide evidence to say that normal distribution is not suitable to model return series of financial markets under study. Lognormal distribution is widely used for modelling financial time series. This is an appropriate distribution for a continuous random variable whose logarithm is normally distributed and values of the random variable should be positive as log(x) exist only for positive values of x. The return series considered in the study contains not only the positive values but also negative values as well. Hence lognormal distribution is not a suitable distribution to model the return series considered in this study. Inverse Gaussian distribution is capable of modelling non-negative skewed data and is not suitable for the study as the return series consists of negative values. Similarly, levy distribution is used to model non-negative random variables, and hence levy distribution is unsuitable. Researchers have used log return or the absolute return when applying these distributions to model return series of financial data [45,46,47], which is not relevant in this study. Pareto distribution was used to model only the tails of a distribution in the literature and used normal distribution to model whole data series. The goal of marginal distribution identification of the current research is not limited to model tails of the distributions separately. Hence, Pareto distribution is not suitable to model return distributions of financial indices. Further, the suitability of scaled t distribution in modelling return distributions was examined. Scaled t distribution was identified as a more suitable distribution to model marginal return series of financial indices, and Table 2 below illustrates parameters of fitted scaled t distributions for marginal distributions of return series under the study [48,49,50,51].
Adequacy of the fitted scaled t distributions were assessed using two graphical techniques: probability-probability plots (p-p plots) and cumulative plots [52,53]. Cumulative plots illustrate that the empirical cumulative distribution and theoretical cumulative distribution agree with each other with respect to fitted scaled t distributions of all financial index returns. Further, p-p plots exhibit that the points disseminate approximately in a straight line in each graph. Both results provide evidence for that the fitted marginal scaled t distributions with respective parameters are suitable to model the financial index return series.

3.2.2. Multivariate Distribution Identification

Since all the marginal distributions are scaled t distributions, the multivariate distribution associated with each stock market index and its related financial markets should be a multivariate scaled t distribution. Many techniques are available for a parameter estimation of multivariate distributions. Batch approximation algorithm can be identified as a better algorithm for parameter estimation with reference to the literature [54]. Moreover, optimization methods were used to estimate the parameters of multivariate scaled t distribution. To examine the complexity of related optimization problems, both local and global optimization were applied. The “fmincon” function in Matlab software was used as a local optimization technique, and a global optimization algorithm DSO in global and non-smooth optimization (GANSO) library [35,36] was used as the global optimization technique in the study. Comparison of three above mentioned techniques was carried out, and the results provide evidence that the global optimization method is essential for significant improvement of parameter estimates. The conviction is that obtaining a multivariate distribution with high quality is really challenging.
The number of potential input variables and the number of parameters to be estimated with respect to multivariate scaled t distributions associated with three stock indices, AORD, GSPC, ASPI, and their related inter-markets are summarized in Table 3.
Local optimization method and global optimization method were used to estimate the parameters associated with three multivariate distributions of three stock indices under study with their related inter-markets. Only the maximum function values obtained are presented in Table 4 as it is difficult to present all parameter estimates here.
Table 4 illustrates that the global optimization technique provides better parameter estimates for all three multivariate distributions related to three stock indices and their related inter-markets. Therefore, global optimization technique was considered for further analysis.

3.3. Probabilistic Neural Network Models

The multivariate scaled t distribution was identified as the more suitable distribution to model multivariate distribution associated with potential input variables, to be used in modelling stock market return series of interest. This section illustrates the performance of proposed probabilistic neural network (PNN) model, after incorporating the identified multivariate distribution and comparison of performance with the existing PNN model.

3.3.1. Data Pre-Processing for PNN Models

Daily data of AORD, GSPC and ASPI indices which consist of 1713, 1548 and 1561 observations, respectively, were considered for the study. Relative returns as described in Section 2.1 were calculated. Holidays were filled with previous days′ values [1,12,55] in all related indices based on the stock market index to be forecasted, and three matrices were prepared for three stock market indices, which can be used as input variables to the PNN models. All observations were categorized into three classes using the following formula [1,4]:
L e t   P ( t + 1 )   b e   t h e   r e l a t i v e   r e t u r n   o f   t h e   n e x t   d a y : B u y   i f   P ( t + 1 ) 0.005 H o l d   i f 0.005 < P ( t + 1 ) < 0.005 e l l   i f   P ( t + 1 ) 0.005
For easy manipulations, classes were renamed as: Class 1 for Buy, Class 2 for Hold and Class 3 for Sell.

3.3.2. Performance of PNN Models

Standard probabilistic neural network and proposed PNN model (with multivariate scaled t distribution as the multivariate distribution of input variables) were implemented in Matlab software. Twenty percent of most recent data were used for testing, and the rest of the data were used for training the PNN models [19,56], and performance were evaluated using performance measures described in Section 2.9. Table 5 displays accuracy and different types of misclassifications in percentages.
Table 5 reflects that the standard PNN model (without MCUB) is not capable of adequately classifying the direction of a stock market index. In addition, there is a higher variation of misclassification percentages among three classes. Therefore, to attain higher accuracy, an improvement to the standard probabilistic neural network model is essential. Further, Table 5 illustrates that the proposed PNN model (without MCUB) exhibits perceptible accuracy in classification. Both GSPC and ASPI indices exhibit similar overall accuracy while AORD index exhibits slightly lower overall accuracy than that of other two indices. Misclassification percentages of buy signal as sell signal and sell signal as buy signal, which lead to critical losses, are small values in the proposed PNN model while the moderately important losses due to classification of buy signal as hold signal and sell signal as hold signal are considerable in all three markets. Based on the results, a visible difference of misclassification percentages among the three classes can be identified. Table 6 consists of class imbalanced ratio (IR) of three markets, which is useful in the explanation of apparent variation among misclassification percentages of classes.
Preceding table demonstrates that, a greater class imbalanced ratio presents in all three data sets under the study. Imbalance ratio of Class 2 dominates that of other classes in all three markets. A large variation of misclassification percentages can be observed among three classes in each market with reference to Table 5. This may be due to higher imbalance ratio among classes in all data sets. It is prominent that the misclassification percentage of Class 2 is very low compared to those of other two classes in data sets related to AORD, GSPC and ASPI indices. It provides evidence for the prevalent understanding of “classifiers bias towards majority class in classifications” among researchers.

3.4. Handling Multi-Class Imbalanced Problem

The existence of the multi-class imbalanced problem in the considered data sets, which is a common behavior related to the classification of financial data is evident from the above section. This section demonstrates the proposed ensemble technique used to handle multi-class imbalanced problem which was described in Section 2.8 and discusses the performance of probabilistic neural network models after applying the proposed technique.
By referring to the literature, bootstrap aggregating or bagging can be identified as a solution proposed by many researchers to the multi-class imbalanced problem in classifications [57] and moreover, it can be identified that ensemble techniques produce more accurate solutions than a single model [38]. A novel technique called multi-class undersampling based bagging (MCUB) technique is proposed to handle multi-class imbalanced problem in this study and it was implemented in Matlab software and applied to the standard PNN model as well as the proposed PNN model. Table 5 compares performance of both proposed and standard PNN models after and before introducing MCUB technique.With reference to the results obtained from standard PNN in Table 5, it can be observed that the overall accuracy of models has been slightly increased after introducing MCUB technique in GSPC and ASPI series while AORD series exhibits a minor decrease in accuracy. Rather, an increase of overall accuracy can be observed in all the markets after introducing MCUB to proposed PNN in Table 5. However, it is prominent that the misclassification percentages among the three classes have been well adjusted by the introduced ensemble technique MCUB, and similar misclassification percentages are apparent among the classes in all stock market indices under the study when classification was carried out with both standard and proposed PNNs.

3.5. Generalization Ability of the Proposed Model

To assess the generalization ability of the proposed model, data from a new time period was considered, and this period commences just after the ending date of the data set on which the final model was built. Same procedure was carried out to prepare the input sets for the three indices AORD, GSPC and ASPI by assuming the input variables remain unchanged for the next three months. Standard PNN and proposed PNN without MCUB and proposed PNN with MCUB were used to forecast the direction of stock indices and results displayed in Table 7 (see page 14).
By referring to Table 7, it can be seen that the proposed PNN exhibits better performance than the standard PNN before introducing the MCUB technique to both models. The model with MCUB and proposed PNN exhibits higher performance than the other two models for the novel data set. When comparison was done with the performance of same models (proposed PNN with MCUB) for the data set considered in the study and for the data of new time period, a slight decrease in overall accuracy can be observed in AORD and GSPC indices while slight increase of overall accuracy is visible in ASPI index. All the misclassification percentages exhibit similar values when comparing corresponding misclassification percentages of the final proposed PNN model with multivariate scaled t distribution and MCUB technique. Therefore, it can be said that the model proposed by the study is capable of forecasting the direction of a stock market index with an acceptable accuracy.

4. Discussion

The main objective of this study is to improve the standard probabilistic neural network algorithm by introducing an appropriate multivariate distribution for non-Gaussian input variables and incorporating a feasible technique to handle multi-class imbalanced problem. This objective was further elaborated into finding the most suitable marginal distributions of the identified input variables, estimating parameters of multivariate distributions associated with these input variables and introducing a proper method to handle multi-class imbalanced problem. Comparisons of proposed and existing methods were carried out to assess the performance of proposed methods.
Preliminary analysis identified nine variables, lag 4 (i.e., return series four days back) of AORD index, lag 1 of oil index, lag 1 of gold index, lag 14 of cocoa index, lag 1 of GSPC index, lag 0 of exchange rate of Australian dollar to United States dollar (AUD-USD), lag 1 of AUD-USD, lag 8 of AUD-USD and lag 12 of AUD-USD exchange rates; four variables, lag 5 of GSPC index, lag 12 of oil index, lag 13 of gold index, lag 6 of cocoa index, and thirteen variables, lag 1 of ASPI index, lag 3 to lag 5 of ASPI index, lag 1 of oil index, lag 5 of oil index, lag 13 of oil index, lag 14 of oil index, lag 9 of gold index, lag 1 of GSPC index, lag 2 of GSPC index, lag 13 of GSPC index, lag 14 of GSPC index as potential inputs to PNN models with respect to three stock market indices AORD, GSPC and ASPI, respectively.
Different marginal distributions, normal distribution, lognormal distribution, inverse Gaussian distribution, levy distribution and Pareto distribution, were used to model return series of stock market indices and other financial markets under study, and inadequacies of all above mentioned distributions to model return series of considered financial indices were identified. Finally, scaled t distribution was identified as a more suitable distribution to model return series of financial indices and respective parameters are present in Table 2. The shape parameter ν of the scaled t distribution can capture the fat tails of the fitted distributions. Smaller ν parameter estimates between 2 to 5 for all indices in Table 2 indicate that the fat tails of the distributions are well captured by the fitted distributions. All estimated location parameters are small and around zero, which implies that the identified scaled t distributions are symmetric. It can be said that the fitted marginal distributions for return series of considered markets are suitable based on the estimated parameter values.
Adequacy of fitted distributions was assessed using probability-probability plots (p-p plots) and cumulative plots. All results confirm that the fitted scaled t distributions with respective parameters are suitable to model respective financial return series. Therefore, the scaled t distribution can be considered as a more suitable distribution to model return series of AORD, GSPC, ASPI, Amex oil, Amex gold, world cocoa indices and AUD-USD exchange rate.
Identifying most suitable multivariate distribution for input variables is a difficult task as the parameter estimation is associated with heavy mathematical calculations. Three parameter estimation techniques, batch approximation algorithm, local optimization method with matlab “fmincon” function and global optimization method with DSO algorithm, were considered in parameter estimation of multivariate distributions, and results show that the global optimization provides better results than the other two techniques.
The number of parameters to be estimated associated with each multivariate distribution varies with the number of potential input variables associated with them or the dimension of the multivariate distribution. Number of potential input variables\dimensions of considered three multivariate distributions of AORD, GSPC and ASPI and their related other markets are nine, four and thirteen, respectively. Past studies provide evidence for parameter estimation of multivariate distributions only up to four dimensions, and the global optimization technique considered in this study is able to estimate parameters of multivariate distributions with any dimension. The number of parameters to be estimated are ninety-one, twenty-one and one-hundred-and-eighty-three with respect to multivariate distributions associated with AORD, GSPC and ASPI and their related financial markets.
It is evident that the parameter estimates provided by the local optimization technique are ambiguous. This characteristic of the local optimization method is prominent due to its main disadvantage of excessive dependence on the initial parameters provided. As a solution, a global optimization technique, DSO algorithm, was considered, which does not require initial parameters and is a stable algorithm that provides solid solutions.
Results obtained from the global optimization method are much better than the parameters of the multivariate scaled t distributions of return series of AORD, GSPC and ASPI and those of their related financial indices. The discussion below is based on the results obtained from global optimization. The estimates of location parameters are small and around zero, and this implies that the multivariate distribution associated with AORD index and its related financial indices is central. The multivariate scaled t distribution of AORD series and related financial indices is less peaked and have fat tails as the estimated shape parameter is three. The multivariate distribution of GSPC index and related financial indices is symmetric, less peaked and has fat tails as the parameter estimates exhibits similar formation. Furthermore, the multivariate scaled t distribution of ASPI and related indices is central as the location parameters are around zero, less peaked as the shape parameter is three and has fat tails as the shape parameter is closer to unity. The parameter estimates of scale parameter Σ are alike values in each table, and it suggests that the markets have similar influence on the respective multivariate distributions.
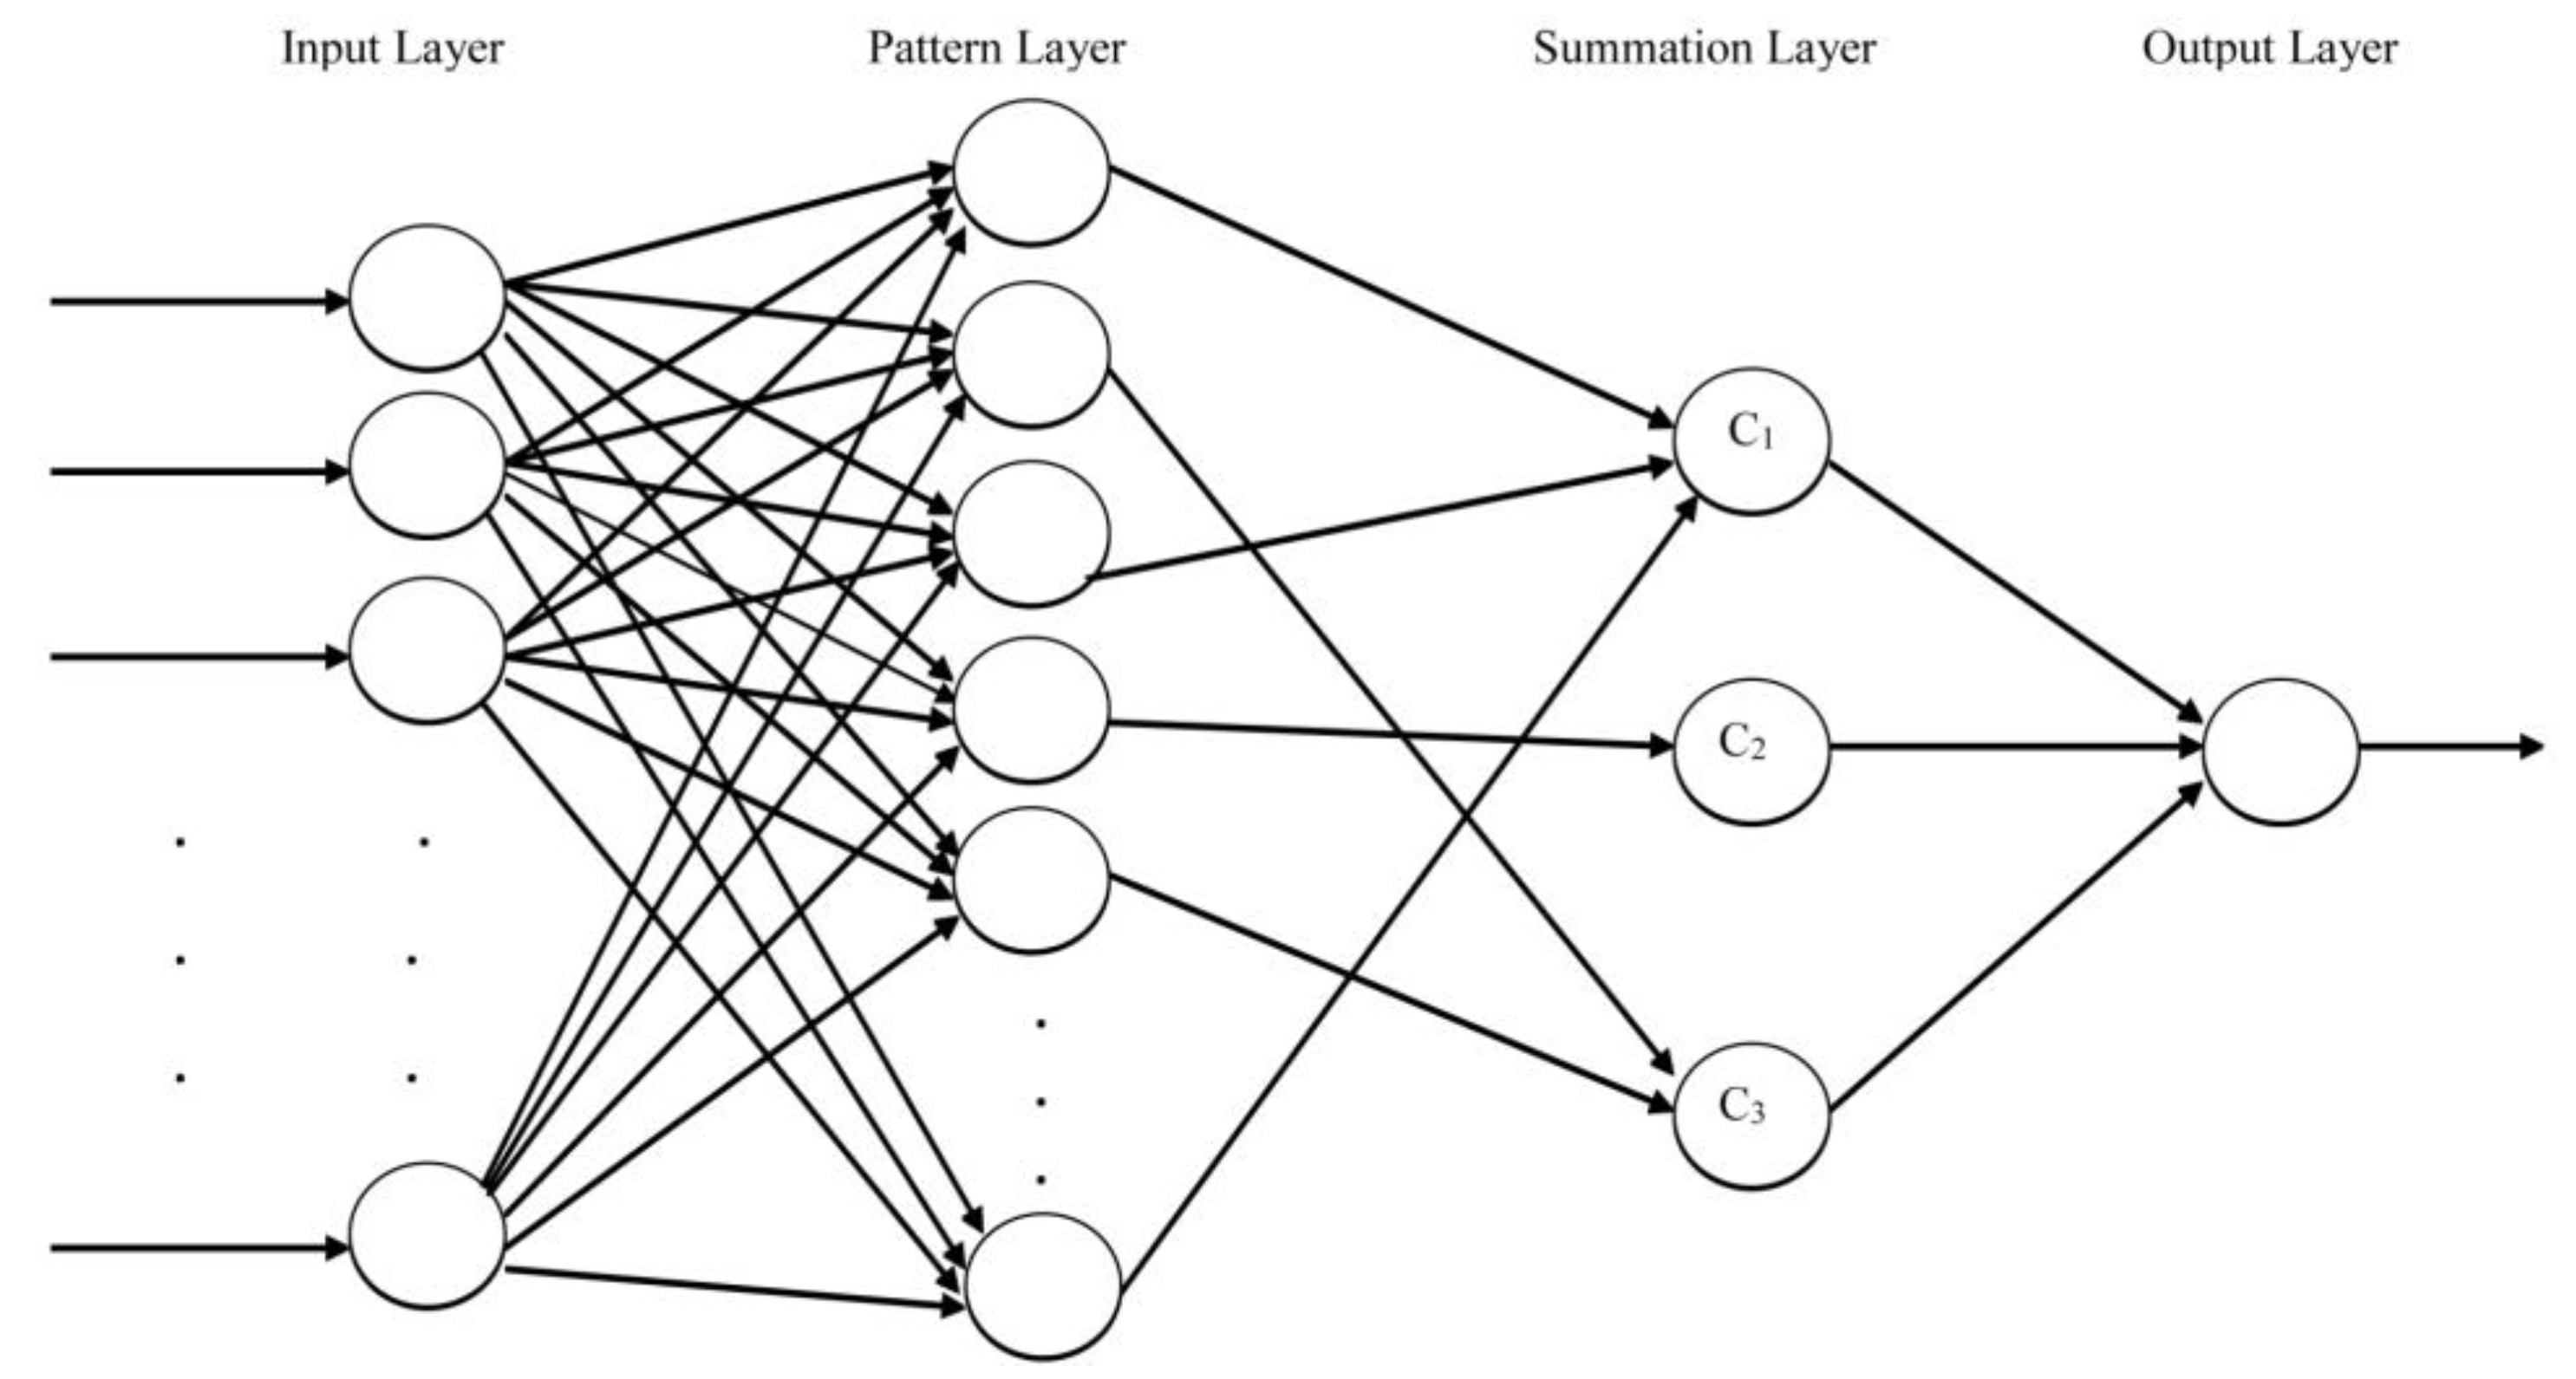
Incorporating an appropriate multivariate distribution other than the Gaussian distribution as the distribution of input variables to the probabilistic neural network is one of the objectives of the study. Therefore, proposed PNN was implemented using matlab software, which facilitates considering the multivariate scaled t distribution as the distribution of input variables. To evaluate the performance of the proposed PNN, comparisons were carried out with the existing standard PNN implemented using matlab software. For budgetary convenience, the implemented matlab codes can be easily converted into an open source programming language like python.
Table 5 illustrates that the overall accuracy levels of standard probabilistic neural network model when forecasting the direction of stock indices AORD, GSPC and ASPI are 54.5%, 53.34% and 55.09%, respectively. Same data sets were used to evaluate the performance of proposed PNN model which consider multivariate scaled t distribution when calculating probabilities in the pattern layer. Overall accuracy of AORD index is 61.56% while GSPC and ASPI indices exhibit 63.04% and 63.47% corresponding accuracy when forecasting the direction using proposed PNN, and this implies an increase in overall accuracy of proposed PNN for all considered stock indices than that of standard PNN. These are acceptable and high percentages of accuracy with respect to financial market forecasting.
By referring Table 5, it is noteworthy that the misclassification percentages when applying standard PNN for AORD series for Class 1, Class 2 and Class 3 are 70.59%, 4.67% and 61.25%. Very high misclassification percentages can be observed in Class 1 and Class 3, while a very low misclassification percentage can be observed in Class 2. Consequently, it is evident that the standard PNN model is biased towards one class against the other two classes in this scenario. Class imbalance ratio (IR) plays a significant role in controlling forecasting ability of PNN models. Table 6 indicates that the IR of Class 1, Class 2 and Class 3 of AORD series are 0.2, 0.6 and 0.2, respectively. By comparing overall misclassification percentage and IR of each class of AORD index, it can be said that the standard PNN model is biased towards the majority class and forecasts most of the test set observations to the majority class. Similar behavior can be observed when comparing misclassification percentages and class imbalance ratios of classes in GSPC and ASPI indices. Results suggest that the performance of the existing probabilistic neural network model heavily depends on the class imbalanced ratio.
Correspondingly, Table 5 indicates that the misclassification percentages among three classes of each index differ significantly when using the proposed PNN. Similar to the results of standard PNN, Class 2 exhibits a lower misclassification percentage than that of Class 1 and Class 3 when forecasting the direction of AORD, GSPC and ASPI indices using proposed PNN. Even though the proposed probabilistic neural network model outperforms the existing PNN model, it still suffers from the class imbalanced problem.
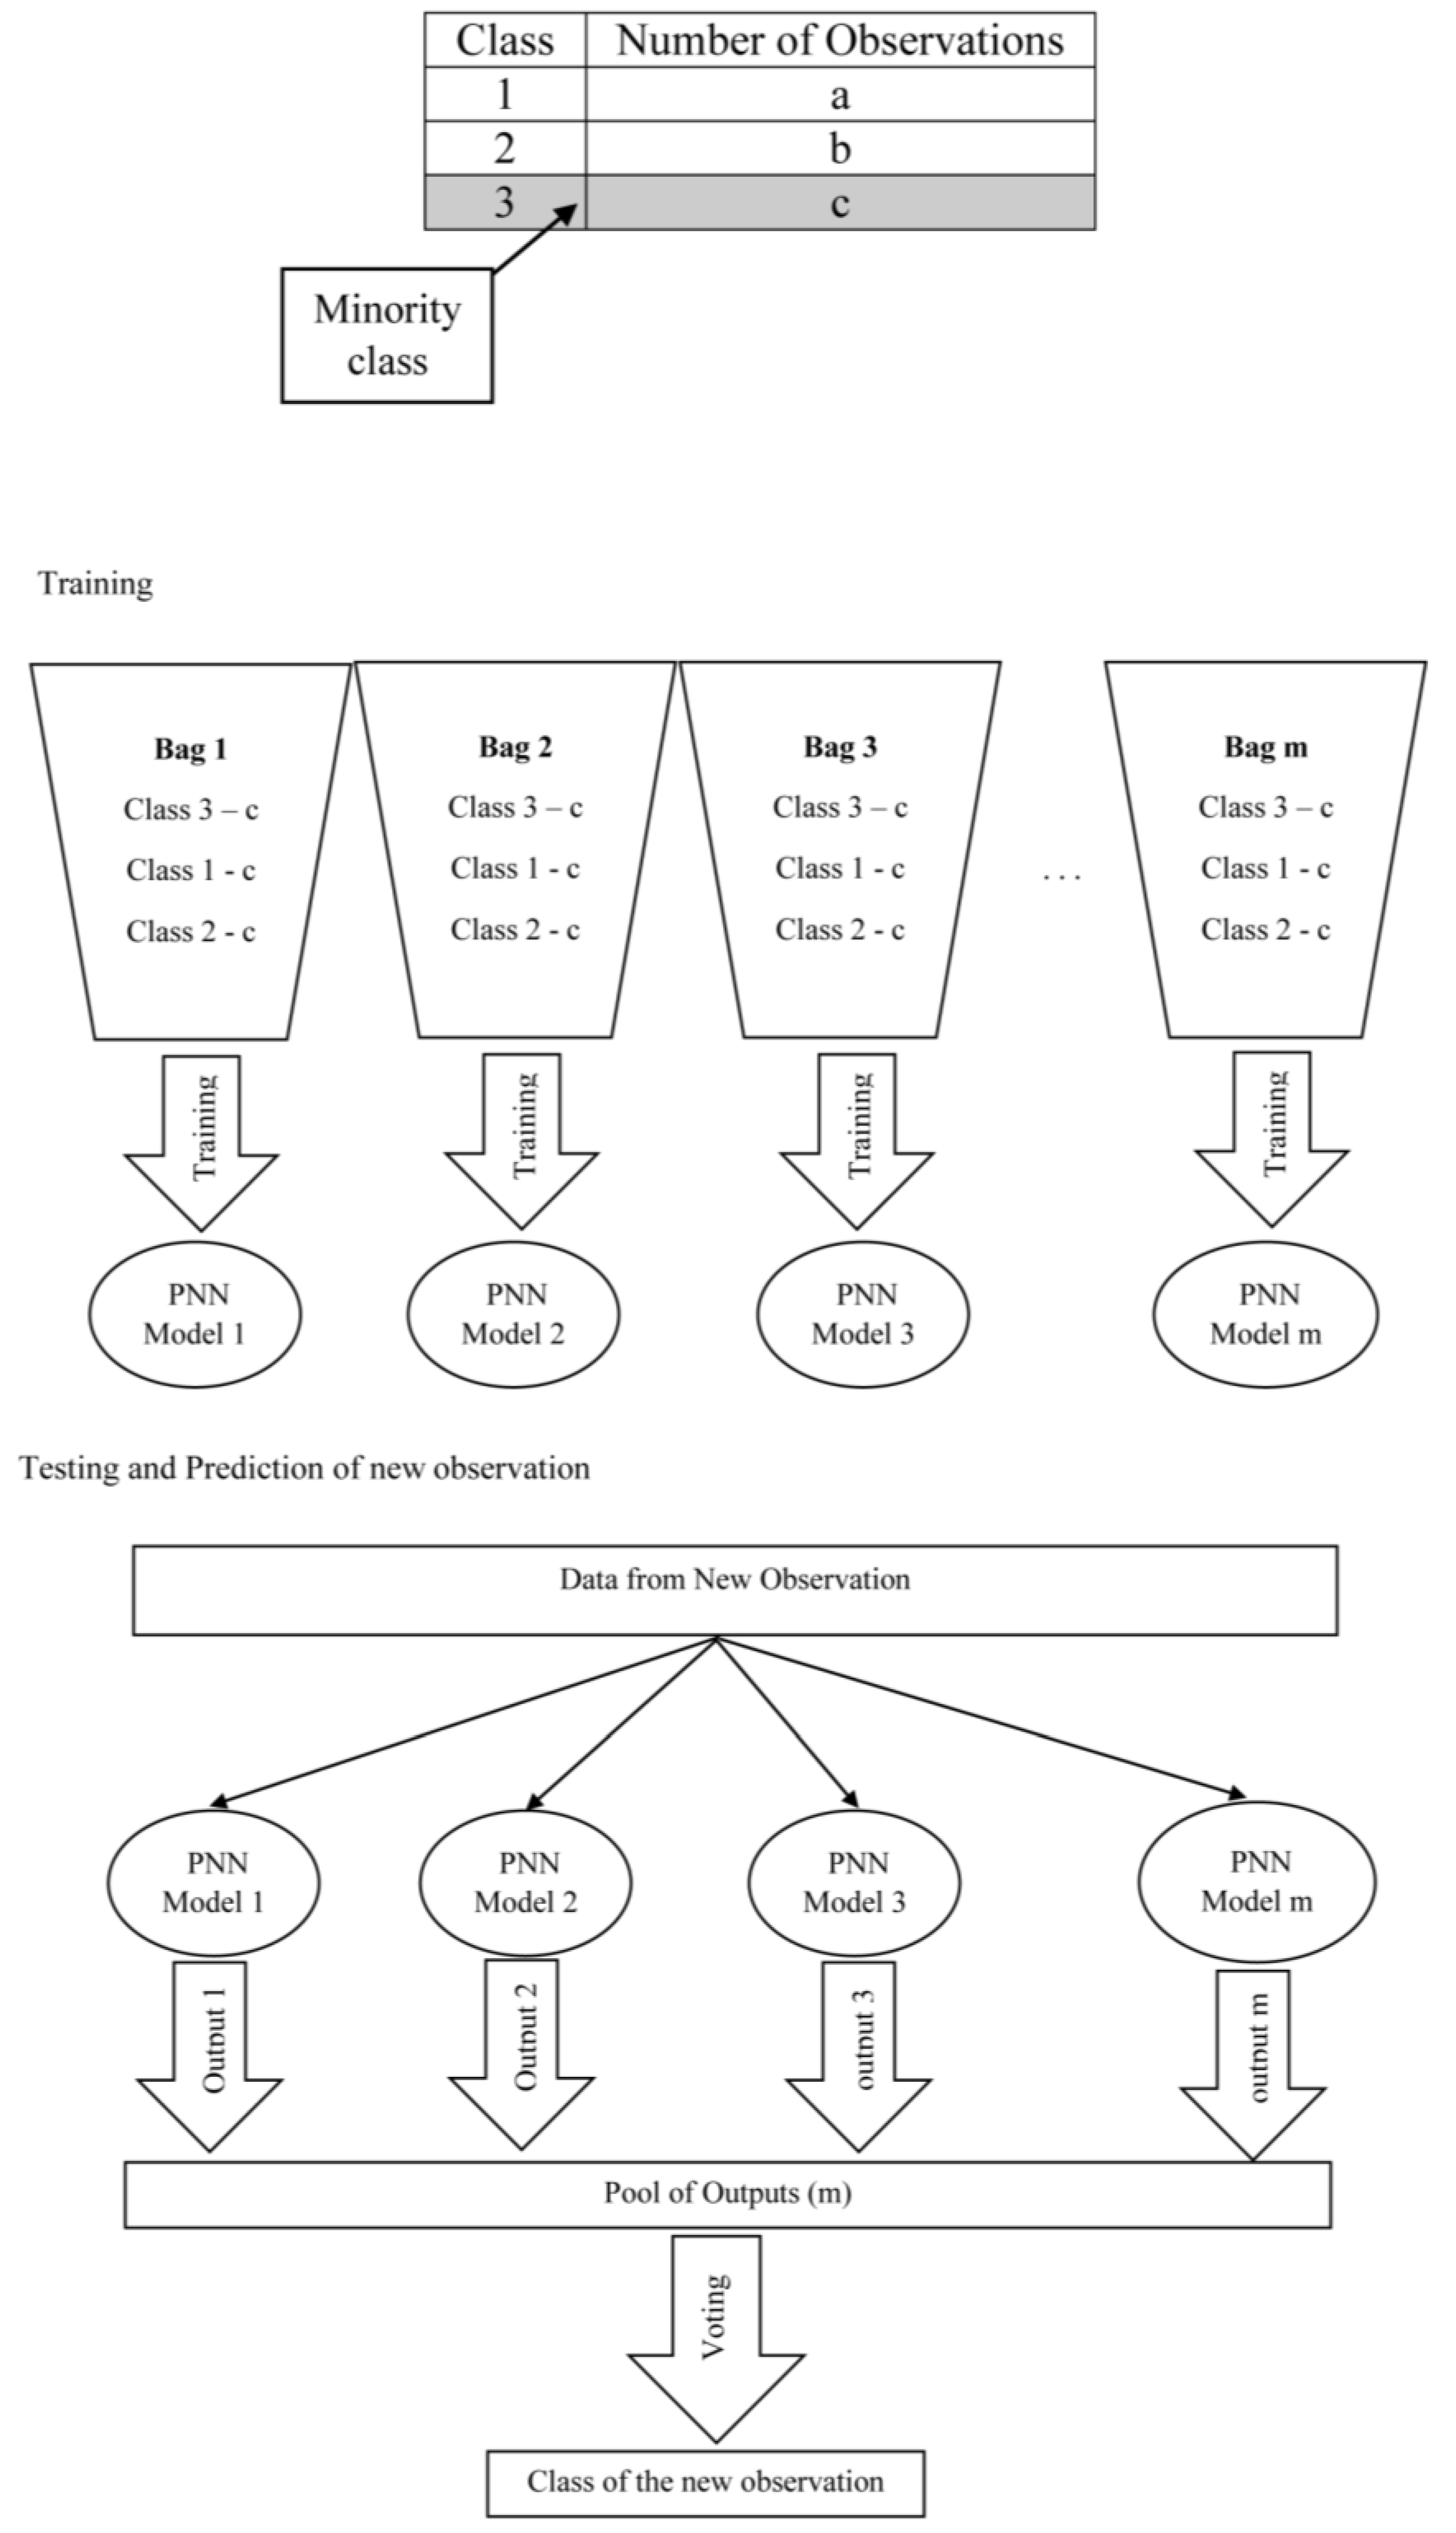
Findings described above highlight the necessity of an appropriate technique to handle class imbalanced problem in data sets. A technique called multi-class undersampling based bagging (MCUB) is proposed to handle the multi-class imbalanced problem persisting in data sets considered in the study. Both standard PNN and proposed PNN were embedded into the proposed MCUB technique separately for further investigations.
Overall accuracy of standard PNN model increases after introducing MCUB technique in forecasting the direction of GSPC and ASPI indices, and AORD index predictions exhibit a slight decrease in the overall performance with reference to Table 5. After ingraining the proposed PNN to the proposed MCUB technique, an increase in overall accuracy can be observed with respect to all indices. Increase of two highly important types of misclassification percentages can be observed after introducing MCUB to standard PNN whereas two types of moderately important misclassification percentages have decreased in all indices. The crucial misclassification types of buy-sell and sell-buy signals have reduced considerably by the introduced ensemble technique in most of the circumstances, and misclassification percentages of buy-hold and sell-hold signals have been reduced in all the cases simultaneously in proposed PNN model. The remarkable fact is that the misclassification percentages among Class 1, Class 2 and Class 3 in forecasting the direction of each stock index when using both standard and proposed PNN models are very much similar. Accordingly, it is indisputable that the proposed ensemble technique, multi-class undersampling based bagging (MCUB), is able to unravel the multi-class imbalanced problem residing in the data sets.
Results in Table 5 prove that the proposed MCUB technique is suitable to handle the multi-class imbalanced problem existing in probabilistic neural networks when classifying data. Hence, it is sensible to compare performance of standard PNN versus proposed PNN with MCUB technique. By referring to Table 5, it can be said that the proposed PNN with multivariate scaled t distribution as the joint distribution of input variables exhibits higher accuracy than that of standard PNN with respect to all considered stock indices. The balance between misclassification percentages among three classes has been enhanced when classifying using the proposed PNN. Misclassification percentages of most important buy-sell and sell-buy signals leading to critical losses have been decreased immensely by the proposed PNN. Slight increase in misclassification percentages of moderately important two misclassification types can be observed. Based on the aforesaid facts, performance improvements can be observed when classification is done using proposed PNN with MCUB in contrast to the standard PNN with MCUB. By considering the improved PNN model with MCUB introduced in the study, 66.37%, 67.02% and 70.12% accuracies can be observed in forecasting the direction of AORD, GSPC and ASPI indices respectively. It is generally accepted that these percentages are high enough to make profit from investments in financial markets.
To understand the generalization ability of the proposed PNN model, performance was evaluated for an updated data set which contains three months’ daily data just after the ending date of the data set used in the study. Table 7 illustrates that the proposed model (proposed PNN with MCUB) is capable of forecasting the direction of all considered stock indices with similar accuracy for the novel data set. All types of misclassification percentages exhibit similar values when comparing corresponding values of the final proposed model. Therefore, it is evident that the proposed dynamic model is proficient to forecast the direction of a given stock market index for any given time period with higher accuracy.
Finally, this study identified an improved PNN model to forecast the direction of a given stock market index by incorporating a suitable non-Gaussian multivariate distribution for calculating probabilities and multi-class undersampling based bagging approach to overcome the class imbalanced problem.
Based on past studies, influences from few inter-market, other financial markets and world major commodities were considered in identifying potential inputs to the probabilistic neural network models. Other stock market indices, other financial markets and other commodities may have significant influence on the considered three stock indices. Even though the gross domestic product (GDP), interest rates, Treasury bill rates, etc., affect the stock market indices, they were not considered as potential inputs to the PNN models because of the non-availability of daily data corresponding to those variables. These facts can be identified as limitations of the study.
As a future study, the proposed dynamic model with multivariate scaled t distribution and multi-class undersampling based bagging technique can be used to build a computer intensive tool, an attractive, user friendly platform to support stakeholders in decision making. The proposed probabilistic neural network model can be used to forecast the direction of other financial indices like exchange rates, interest rates, Treasury bill rates, etc., with higher accuracy. Moreover, the proposed PNN can be used for classification purposes in other applications such as weather, biology, agriculture, medicine, image processing, natural language processing, marketing research, etc.

5. Conclusions

The scaled t distribution with three parameters, location parameter, scale parameter and shape parameter, is introduced as a more suitable distribution to model financial market returns.
Other multivariate distributions than the Gaussian distribution have not considered as the joint distribution of input variables in probabilistic neural networks. The proposed probabilistic neural network model facilitates considering the multivariate scaled t distribution as the distribution associated with input variables.
The proposed probabilistic neural network model outperforms the existing standard PNN model.
The proposed ensemble technique to handle multi-class imbalanced problem, multi-class undersampling based bagging (MCUB), is a novel approach and capable of handling multi-class imbalanced problem in probabilistic neural network models.
The improved PNN model with MCUB technique proposed in the study is competent to forecast the direction of stock market indices AORD, GSPC and ASPI with 66.37%, 67.02% and 70.12% accuracy, respectively, which are acceptable and high percentages of accuracy in financial market forecasting.
Performance evaluation was carried out for an updated data set, verifying the generalization ability of the proposed dynamic model to forecast the direction of a given stock market index for a similar time period with higher accuracy and profitability.
The proposed dynamic model is suitable for use in forecasting the direction of a given stock market index with higher accuracy.

Author Contributions

C.T. provided the research problem and methodological approach for solving the research problem. V.C. carried out the research which leads to the following contributions: identification of input variables for models, identification of suitable marginal distribution to model financial return series, parameter estimation of proper multivariate distribution to model the joint distribution of input variables for the probabilistic neural network (PNN), develop the model using matlab software and identification of best architecture of PNN, propose an ensemble technique to resolve class imbalance problem in PNN, build the final dynamic model which facilitate Scaled t distribution as the multivariate distribution of input variables for the PNN and incorporate multi class undersampling based bagging; newly proposed ensemble technique to overcome class imbalance problem, compare the performance of proposed models with real world data, exhibit the generalization ability of the final proposed model with real world data. Parameter optimization concept and the algorithm to estimate the parameters of multivariate distributions were provided by M.M.

Funding

This research was funded by University research grant of University of Colombo under grant number AP/3/2012/CG/16.

Conflicts of Interest

The authors declare no conflict of interest.

References

  1. Tilakaratne, C.D.; Mammadov, M.A.; Morris, S.A. Predicting Trading Signals of Stock Market Indices Using Neural Networks. In AI 2008: Advances in Artificial Intelligence; Lecture Notes in Computer Science; Wobcke, W., Zhang, M., Eds.; Springer: Berlin/Heidelberg, Germany, 2008; pp. 522–531. [Google Scholar]
  2. Tilakaratne, C.D.; Morris, S.A.; Mammadov, M.A.; Hurst, C.P. Predicting stock market index trading signals using neural networks. In Proceedings of the 14th Annual Global Finance Conference (GFC-07), Melbourne, Victoria, Australia, 1–4 April 2007; pp. 171–179. [Google Scholar]
  3. Tilakaratne, C.D.; Mammadov, M.A.; Morris, S.A. Effectiveness of using quantified intermarket influence for predicting trading signals of stock markets. In Proceedings of the sixth Australasian conference on Data mining and analytics, Australian Computer Society, Inc., Gold Coast, Australia, 3–4 December 2007; pp. 171–179. [Google Scholar]
  4. Tilakaratne, C.D.; Mammadov, M.A.; Morris, S.A. Modified Neural Network Algorithm for Predicting Trading Signals of Stock Market Indices. J. Appl. Math. Decis. Sci. 2009, 2009, 22. [Google Scholar] [CrossRef]
  5. Eom, C.; Choi, S.; Oh, G.; Jung, W.S. Hurst exponent and prediction based on weak-form efficient market hypothesis of stock markets. Phys. A Stat. Mech. Appl. 2008, 387, 4630–4636. [Google Scholar] [CrossRef] [Green Version]
  6. Nisar, S.; Hanif, M. Testing weak form of efficient market hypothesis: Empirical evidence from South-Asia. World Appl. Sci. J. 2012, 17, 414–427. [Google Scholar]
  7. Islam, A.; Khaled, M. Tests of weak-form efficiency of the Dhaka stock exchange. J. Bus. Finance Account. 2005, 32, 1613–1624. [Google Scholar] [CrossRef]
  8. Gupta, A.; Dhingra, B. Stock Market Prediction Using Hidden Markov Models. In Proceedings of the Conference of IEEE Engineering and Systems (SCES), Allahabad, Uttar Pradesh, India, 16–18 March 2012; pp. 1–4. [Google Scholar]
  9. Jarrett, J.E.; Kyper, E. ARIMA Modeling With Intervention to Forecast and Analyze Chinese Stock Prices. Int. J. Eng. Bus. Manag. 2011, 3, 53–58. [Google Scholar] [CrossRef]
  10. Ariyo, A.A.; Adewumi, A.O.; Ayo, C.K. Stock price prediction using the ARIMA model. In Proceedings of the 2014 UKSim-AMSS 16th International Conference on IEEE Computer Modelling and Simulation (UKSim), Cambridge, UK, 26–28 March 2014; pp. 106–112. [Google Scholar]
  11. Chenoweth, T.; Obradovic, Z.; Stephenlee, S. Embedding Technical Analysis into neural Network Based Trading Systems. Appl. Artifi. Intell. 1996, 10, 523–541. [Google Scholar] [CrossRef]
  12. Chandrasekara, N.V.; Tilakaratne, C.D. Forecasting Exchange Rates Using Artificial Neural Networks. Sri Lankan J. Appl. Stat. 2010, 10, 187–201. [Google Scholar]
  13. Gately, E. Neural Networks for Financial Forecasting; John Wiley & Sons, Inc.: New York, NY, USA, 1996. [Google Scholar]
  14. Olson, D.; Mossaman, C. Neural network forecasts of Canadian stock returns using accounting ratios. Int. J. Forecast. 2003, 19, 453–465. [Google Scholar] [CrossRef]
  15. Qi, M. Nonlinear Predictability of Stock Returns Using Financial and Economic variables. J. Bus. Econ. Stat. 1999, 17, 419–429. [Google Scholar]
  16. Safer, A.M. A comparison of two data mining techniques to predict abnormal stock market returns. Intell. Data Anal. 2003, 7, 3–13. [Google Scholar] [CrossRef]
  17. Wu, Y.; Zhang, H. Forward Premiums as Unbiased Predictors of Future Currency Depreciation: A Non-Parametric Analysis. J. Int. Money Finance 1997, 16, 609–623. [Google Scholar]
  18. Chen, A.S.; Leung, M.K.; Daouk, H. Application of neural networks to an emerging financial market: Forecasting and trading the Taiwan Stock Index. Comput. Oper. Res. 2003, 30, 901–923. [Google Scholar] [CrossRef]
  19. Leung, M.T.; Daouk, H.; Chen, A.S. Forecasting stock indices: A comparison of classification and level estimation models. Int. J. Forecast. 2000, 16, 173–190. [Google Scholar] [CrossRef]
  20. Egeli, B.; Ozturan, M.; Badur, B. Stock Market Prediction Using Artificial Neural Networks. In Proceedings of the Hawaii International Conference on Business, Honolulu, HI, USA, 18–21 Jun 2003. [Google Scholar]
  21. Saad, E.W.; Prokhorov, D.V.; Wunsch, D.C. Comparative study of stock trend prediction using time delay, recurrent and probabilistic neural networks. IEEE Trans. Neural Netw. 1998, 9, 1456–1470. [Google Scholar] [CrossRef]
  22. Rangana, D.L.M.; Chandrasekara, N.V.; Tilakaratne, C.D. Comparison of Support Vector Regression and Artificial Neural Network Models to Forecast daily Colombo Stock Change. In Proceedings of the International Statistics Conference, Battaramulla, Sri Lanka, 28–30 December 2011; pp. 151–160. [Google Scholar]
  23. Specht, D. Probabilistic Neural Networks. Neural Netw. 1990, 3, 109–118. [Google Scholar] [CrossRef]
  24. Amaral, L.A.N.; Plerou, V.; Gopikrishnan, P.; Meyer, M.; Stanley, E. The Distribution of Returns of Stock Prices. Int. J. Theor. Appl. Financ. 2000, 3, 365–369. [Google Scholar] [CrossRef]
  25. Rachev, V.; Stoyanov, S.; Biglova, A.; Fabozzi, F. Am Emperical Examination of Daily Stock Returns for U.S. stock. Data Anal. Decis. Support 2005, 269–281. [Google Scholar]
  26. Longadge, R.; Dongre, S.S.; Malik, L. Class Imbalance Problem in Data Mining: Review. Int. J. Comput. Sci. Netw. 2013, 2, 107–111. [Google Scholar]
  27. Sun, Y.; Wong, A.K.; Kamel, M.S. Classification of imbalanced data: A review. Int. J. Pattern Recognit. Artif. Intell. 2009, 23, 687–719. [Google Scholar] [CrossRef]
  28. Lopez, V.; Fernndez, A.; Garcia, S.; Palade, V.; Herrera, F. An Insight into Classification with Imbalanced Data: Empirical Results and Current Trends on Using Data Intrinsic Characteristics. Inf. Sci. 2013, 250, 113–141. [Google Scholar] [CrossRef]
  29. Singh, R.; Raut, R. Review on Class Imbalance Learning: Binary and Multiclass. Int. J. Comput. Appl. 2015, 131, 4–8. [Google Scholar] [CrossRef]
  30. Caruso, J.C.; Cliff, N. Empirical size, coverage, and power of confidence intervals for Spearman’s rho. Educ. Psychol. Meas. 1997, 57, 637–654. [Google Scholar] [CrossRef]
  31. Ruscio, J. Constructing confidence intervals for Spearmans rank correlation with ordinal data: A simulation study comparing analytic and bootstrap methods. J. Mod. Appl. Stat. Methods 2008, 7, 7. [Google Scholar] [CrossRef]
  32. Aparicio, F.; Estrada, J. Empirical Distributions of Stock Market Returns: Scandinavian Securities Markets, 1990–95; Department of Statistics and Econometrics and Department of Business: Madrid, Spain, 1997. [Google Scholar]
  33. Kotz, S.; Nadarajah, S. Multivariate t Distributions and Their Applications; Cambridge University Press: Cambridge, UK, 2004. [Google Scholar]
  34. Kibria, B.M.; Joarder, A.H. A short review of the multivariate t distribution. J. Stat. Res. 2006, 40, 59–72. [Google Scholar]
  35. Mammadov, M.; Rubinov, A.; Yearwood, J. Dynamical systems described by relational elasticities with applications. In Continuous Optimisation: Current Trends and Modern Applications; Jeyakumar, V., Rubinov, A., Eds.; Springer: Berlin, Germany, 2005; pp. 365–385. [Google Scholar]
  36. Global and Non-Smooth Optimization library (GANSO). Federation University Australia. Available online: http://www.ganso.com.au (accessed on 20 September 2014).
  37. Yang, Z.R.; Platt, M.B.; Platt, H.D. Probabilistic neural networks in bankruptcy prediction. J. Bus. Res. 1999, 44, 67–74. [Google Scholar] [CrossRef]
  38. Specht, D.F. Enhancements to probabilistic neural networks. In Proceedings of the International Joint Conference on IEEE Neural Networks, 1992 (IJCNN), Baltimore, MD, USA, 7–11 Jun 1992; pp. 761–768. [Google Scholar]
  39. Washburne, T.P.; Specht, D.F.; Darke, R.M. Identification of unknown categories with probabilistic neural networks. In Proceedings of the IEEE International Conference on Neural Networks, San Francisco, CA, USA, 28 March–1 April 1993; p. 434437. [Google Scholar]
  40. Ibrahiem, M.M.; Emary, E.; Ramakrishnan, S. On the Application of Various Probabilistic Neural Networks in Solving Different Pattern Classification Problems. World Appl. Sci. J. 2008, 4, 772–780. [Google Scholar]
  41. Ramakrishnan, S.; El Emary, I.M. Comparative study between traditional and modified probabilistic neural networks. Telecommun. Syst. 2009, 40, 67–74. [Google Scholar] [CrossRef]
  42. Zhou, Z. Ensemble Methods: Foundations and Algorithms. In Machine Learning & Pattern Recognition Series; CRC Press, Taylor & Francis Group: Boca Raton, FL, USA, 2012. [Google Scholar]
  43. Beleites, C.; Salzer, R.; Sergo, V. Validation of soft classification models using partial class memberships: An extended concept of sensitivity & co. applied to grading of astrocytoma tissues. Chromometr. Intell. Lab. Syst. 2013, 122, 12–22. [Google Scholar]
  44. Garcia, V.; Sanchez, J.S.; Dominguez, H.O.; Cleofas-Sanchez, L. Dissimilarity-Based Learning from Imbalanced Data with Small Disjuncts and Noise. In Iberian Conference on Pattern Recognition and Image Analysis; Springer: Cham, Switzerland, 2015; pp. 370–378. [Google Scholar]
  45. Gopikrishnan, P.; Plerou, V.; Amaral, L.A.N.; Meyer, M.; Stanley, E. Scaling of the distribution of fluctuations of financial market indices. Phys. Rev. E 1999, 60, 5305–5316. [Google Scholar] [CrossRef] [Green Version]
  46. Wang, B.H.; Hui, P.M. The distribution and scaling of fluctuations for Hang Seng index in Hong Kong stock market. Eur. Phys. J. B Condens. Matter Complex Syst. 2001, 20, 573579. [Google Scholar]
  47. Mills, T.C. Stylized facts on the temporal and distributional properties of daily FTSE returns. Appl. Financ. Econ. 1997, 7, 599–604. [Google Scholar] [CrossRef]
  48. Chandrasekara, N.V.; Tilakaratne, C.D. Identifying Return Distribution of Sri Lankan Stock Market Index. Univ. J. Account. Financ. 2014, 2, 53–56. [Google Scholar]
  49. Chandrasekara, N.V.; Tilakaratne, C.D.; Mammadov, M.A. Return Distributions of Oil Index and Gold Index. In Proceedings of the Regional Fundamental Science Congress 2014, Kuala Lumpur, Selangor, Malaysia, 19–20 August 2014; pp. 261–263. [Google Scholar]
  50. Chandrasekara, N.V.; Tilakaratne, C.D.; Mammadov, M.A. Analyzing Return Distribution of World Cocoa Index. In Proceedings of the International Statistics Conference 2014, Colombo, Sri Lanka, 28–30 December 2014; p. 225. [Google Scholar]
  51. Chandrasekara, N.V.; Tilakaratne, C.D.; Mammadov, M.A. Identifying Distributions of Selected Stock Returns. Int. J. Stat. Econ. 2015, 16, 7–22. [Google Scholar]
  52. Doric, D.; Doric, E.N. Return distribution and value at risk estimation for BELEX15. Yugosl. J. Oper. Res. 2011, 21, 103–118. [Google Scholar] [CrossRef]
  53. Nikolic-Djoric, E.; Djoric, D. Dynamic value at risk estimation for BELEX15. Metod. Zv. 2011, 8, 79. [Google Scholar]
  54. Aeschliman, C.; Park, J.; Kak, A.C. A novel parameter estimation algorithm for the multivariate t-distribution and its application to computer vision. In Lecture Notes in Computer Science; Computer Vision ECCV 2010; Daniilidis, K., Maragos, P., Paragios, N., Eds.; Springer: Berlin, Germany, 2010; pp. 594–607. [Google Scholar]
  55. Nanayakkara, K.A.D.S.A.; Chandrasekara, N.V.; Jayasundara, D.D.M. Forecasting Exchange Rates using Time Series and Neural Network Approaches. Eur. Int. J. Sci. Technol. 2014, 3, 65–73. [Google Scholar]
  56. Kim, S.H.; Chun, S.H. Graded forecasting using an array of bipolarpredictions: Application of probabilistic neural networks to a stock market index. Int. J. Forecast. 1998, 14, 323–337. [Google Scholar] [CrossRef]
  57. Breiman, L. Bagging Predictors. Mach. Learn. 1996, 24, 123140. [Google Scholar] [CrossRef] [Green Version]
Figure 1. Architecture of probabilistic neural network.
Applsci 09 05334 g001
Figure 2. Multi-class undersampling based Bagging (MCUB) technique.
Applsci 09 05334 g002
Table 1. Identified potential inputs for the three stock markets under study.
Potential Inputs
AORDGSPCASPI
Lag 4 of AORDLag 5 of GSPCLag 1 of ASPI
Lag 1 of OilLag 12 of OilLag 3 of ASPI
Lag 1 of GoldLag 13 of GoldLag 4 of ASPI
Lag 14 of CocoaLag 6 of CocoaLag 5 of ASPI
Lag 1 of GSPC Lag 1 of Oil
Lag 0 of AUD-USD Lag 5 of Oil
Lag 1 of AUD-USD Lag 13 of Oil
Lag 8 of AUD-USD Lag 14 of Oil
Lag 12 of AUD-USD Lag 9 of Gold
Lag 1 of GSPC
Lag 2 of GSPC
Lag 13 of GSPC
Lag 14 of GSPC
Table 2. Parameter estimates of fitted scaled t distributions.
Financial IndexLocation Parameter (µ)Scale Parameter (σ)Shape Parameter (υ)
AORD0.000355850.00562273.58061
GSPC0.000638190.00535662.87595
ASPI0.000074040.00329342.29447
Oil0.000139710.00770002.65188
Gold−0.000639820.01814073.64656
Cocoa0.000044660.00920063.46337
AUD-USD0.000037630.00477884.48998
Table 3. Number of parameters to be estimated with respect to multivariate distributions of stock market indices.
MarketNumber of Potential InputsNumber of Parameters to Be Estimated
AORD991
GSPC421
ASPI13183
Table 4. Maximum function values obtained from local and global optimization techniques when estimating parameters of multivariate distributions relating to three stock indices with their related inter-markets.
MarketMaximum Function Value (f_max)
Local OptimizationGlobal Optimization
AORD2.3623 × 0−722.13496
GSPC0.038613.1762
ASPI6.2954 × 10−46.0352
Table 5. Performance of Standard PNN model and Proposed PNN model with and without MCUB technique.
PNN ModelMarketProposed Ensemble TechniqueOverall Accuracy (100%)Misclassification Percentage (%)
OverallClassesHighly Important (Critical Loss)Moderately Important (Loss)Less Important (No big impact)
123Buy to SellSell to BuyBuy to HoldSell to HoldHold to BuyHold to Sell
Standard PNNAORDwithout MCUB54.4966 45.5034 70.5909 4.6693 61.2500 2.0000 4.5455 68.5909 56.7045 2.7237 1.9456
with MCUB53.7676 46.2324 44.1481 53.6667 40.8824 16.1290 17.6471 28.0191 23.2353 26.4706 27.1961
GSPCwithout MCUB53.3355 46.6645 46.9412 24.2745 68.7778 23.8824 22.2222 23.0588 46.5556 9.5490 14.7255
with MCUB55.6277 44.3723 42.8571 35.7143 54.5454 28.5714 27.2727 14.2857 27.2727 14.2857 21.4286
ASPIwithout MCUB55.0928 44.9072 41.1112 20.7534 72.8571 5.5556 18.5714 35.5556 54.2857 13.2534 7.5000
with MCUB58.8896 41.1104 39.2857 42.5000 41.5454 17.8571 14.2727 21.4286 27.2727 37.5000 5.0000
Proposed PNNAORDwithout MCUB61.5609 38.4391 56.0000 5.5901 53.7273 2.0000 4.5455 54.0000 49.1818 3.7267 1.8634
with MCUB66.3712 33.6288 35.7727 30.4475 34.6663 2.2727 6.2500 33.5000 28.4163 16.1128 14.3347
GSPCwithout MCUB63.0392 36.9608 52.4815 12.1921 46.2089 3.7037 11.3846 48.7778 34.8243 8.2583 3.9338
with MCUB67.0208 32.9792 35.3333 30.4615 33.1429 3.7037 2.6923 31.6296 30.4506 16.2715 14.1900
ASPIwithout MCUB63.4748 36.5252 44.7778 9.0834 55.7143 5.5556 9.2857 39.2222 46.4286 6.5000 2.5834
with MCUB70.1195 29.8805 30.8485 27.5747 31.2182 4.0606 9.0909 26.7879 22.1273 12.3494 15.2253
Table 6. Class imbalance ration (IR) of three stock market indices.
Market
Imbalanced Ratio (IR)AORDGSPCASPI
Class 10.22830.23580.1352
Class 20.57440.58660.7361
Class 30.19730.17760.1288
Table 7. Performance of models for a novel data set.
MarketModelOverall Accuracy (100%)Misclassification Percentage (%)
OverallClassesHighly Important (Critical Loss)Moderately Important (Loss)Less Important (No big impact)
123Buy to SellSell to BuyBuy to HoldSell to HoldHold to BuyHold to Sell
AORDStandard PNN52.873847.126270.59565.18660.95063.45275.692367.142955.25833.22221.9638
Proposed PNN (without MCUB)60.208939.791154.22537.049252.12102.00005.692352.225346.42874.82702.2222
Proposed PNN with MCUB65.903934.096136.967234.593930.72732.14294.060634.824326.666719.259215.3347
GSPCStandard PNN50.664549.335542.809324.396973.673421.848526.525220.960847.14829.285715.1112
Proposed PNN (without MCUB)61.384638.615449.30115.02247.67413.972414.090945.328633.58326.50378.5183
Proposed PNN with MCUB65.898134.101935.333532.511034.46124.54552.000030.787932.461214.058818.4522
ASPIStandard PNN55.907244.092843.736124.421973.17094.236116.225339.556.945614.149210.2727
Proposed PNN (without MCUB)64.060635.939439.178113.138851.10513.95286.909035.225344.19618.25834.8805
Proposed PNN with MCUB71.779028.221028.313928.817127.53192.27277.315626.041220.216312.562316.2548

