Multivariate Data Envelopment Analysis to Measure Airline Efficiency in European Airspace: A Network-Based Approach


Abstract
1. Introduction
2. Background
3. Methodology
3.1. Data Envelopment Analysis (DEA)
3.2. Bootstrapping DEA Technique
- Calculate the DEA efficiency score with the original data .
- Use Kernel density estimation and the reflection method to generate a random sample with replacement from the original DEA efficiency score .
- Generate using:where is a random draw from a standard normal distribution and h is a control parameter.
- Obtain from
- Generate resampled pseudo-efficiencies using
- Obtain a0 new data sample using .
- Calculate the DEA efficiency score with data, .
- Repeat steps 2 to 7 B times to create a set with B efficiency estimates for each unit:
3.3. Calculating Centrality Measures to Feature DEA
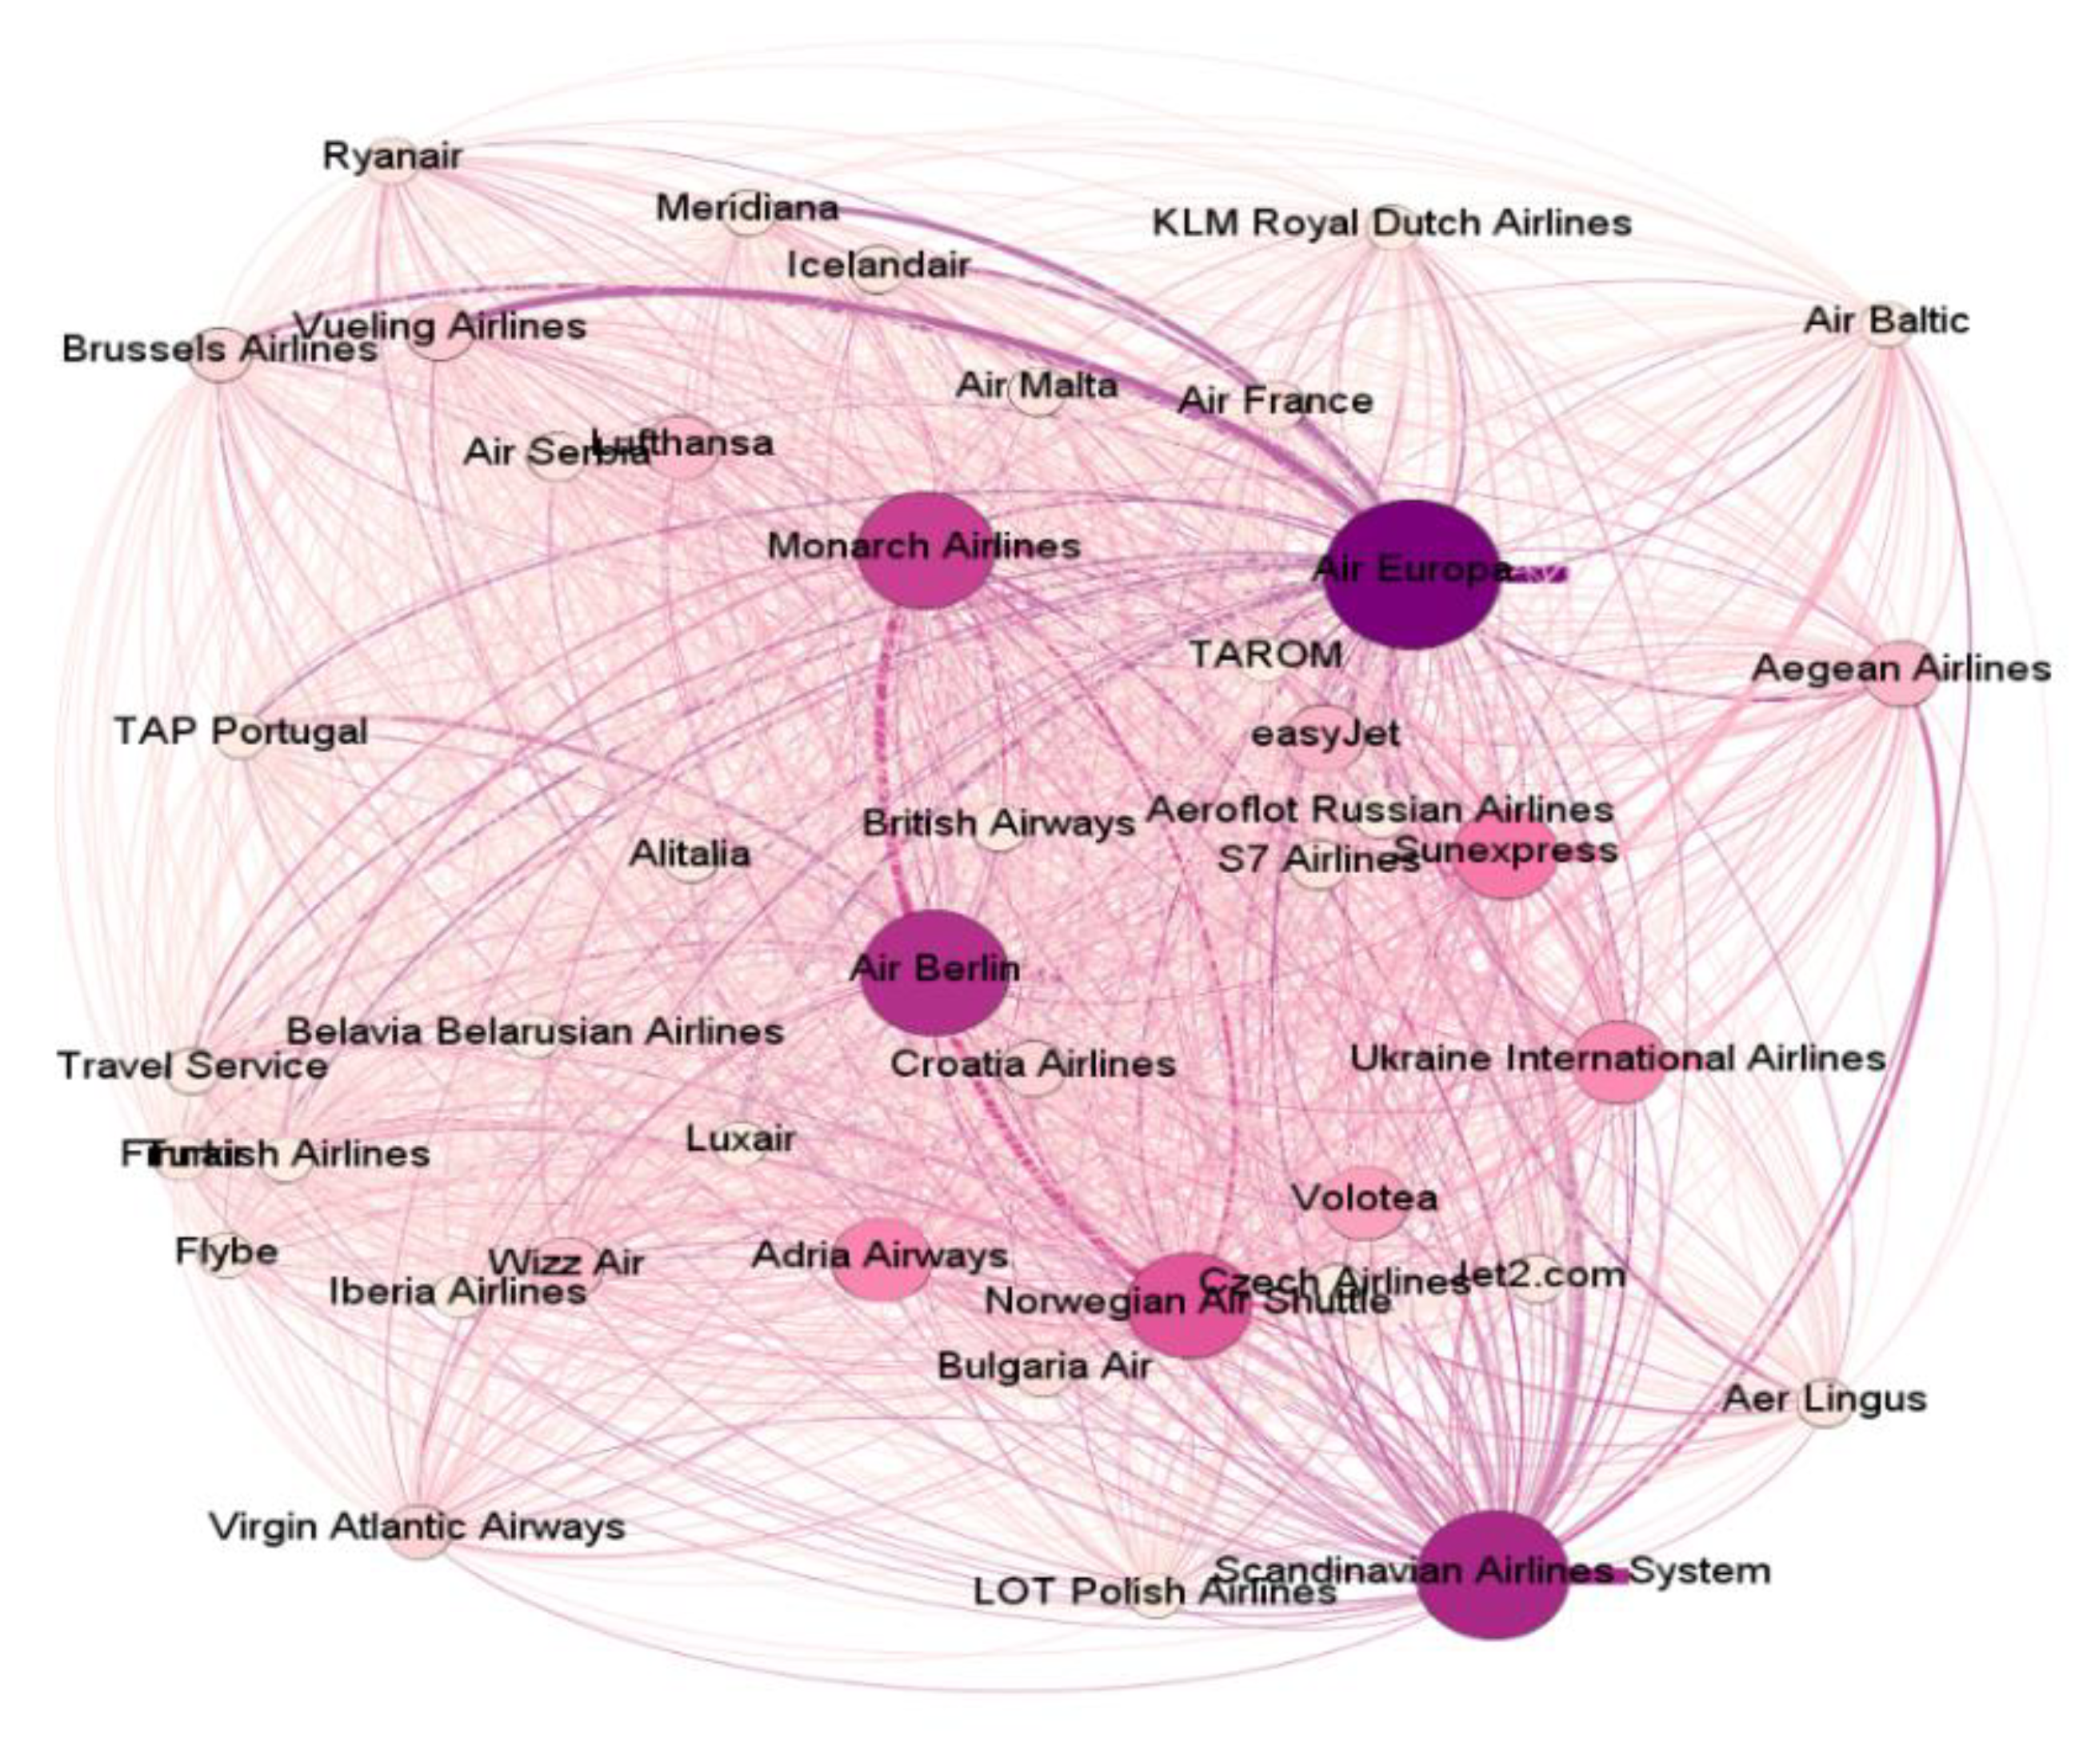
3.3.1. Network Model
3.3.2. Airline Analysis Using Centrality Network Metrics
3.4. A Network-Based Approach to Refine DEA
4. Model Data
4.1. Input–Output Data for Bus-DEA Layer
4.2. Input–Output Data for Net-DEA Layer
4.3. Input–Output Data for SM-DEA (Social Media-DEA) Layer
4.4. Model Summary and Statistical Analysis
5. Results
5.1. DEA Model
5.1.1. Bus-DEA Layer (Business-DEA)
5.1.2. Net-DEA Layer (Network-DEA)
5.1.3. SM-DEA Layer (Social Media-DEA)
5.1.4. Overall Model
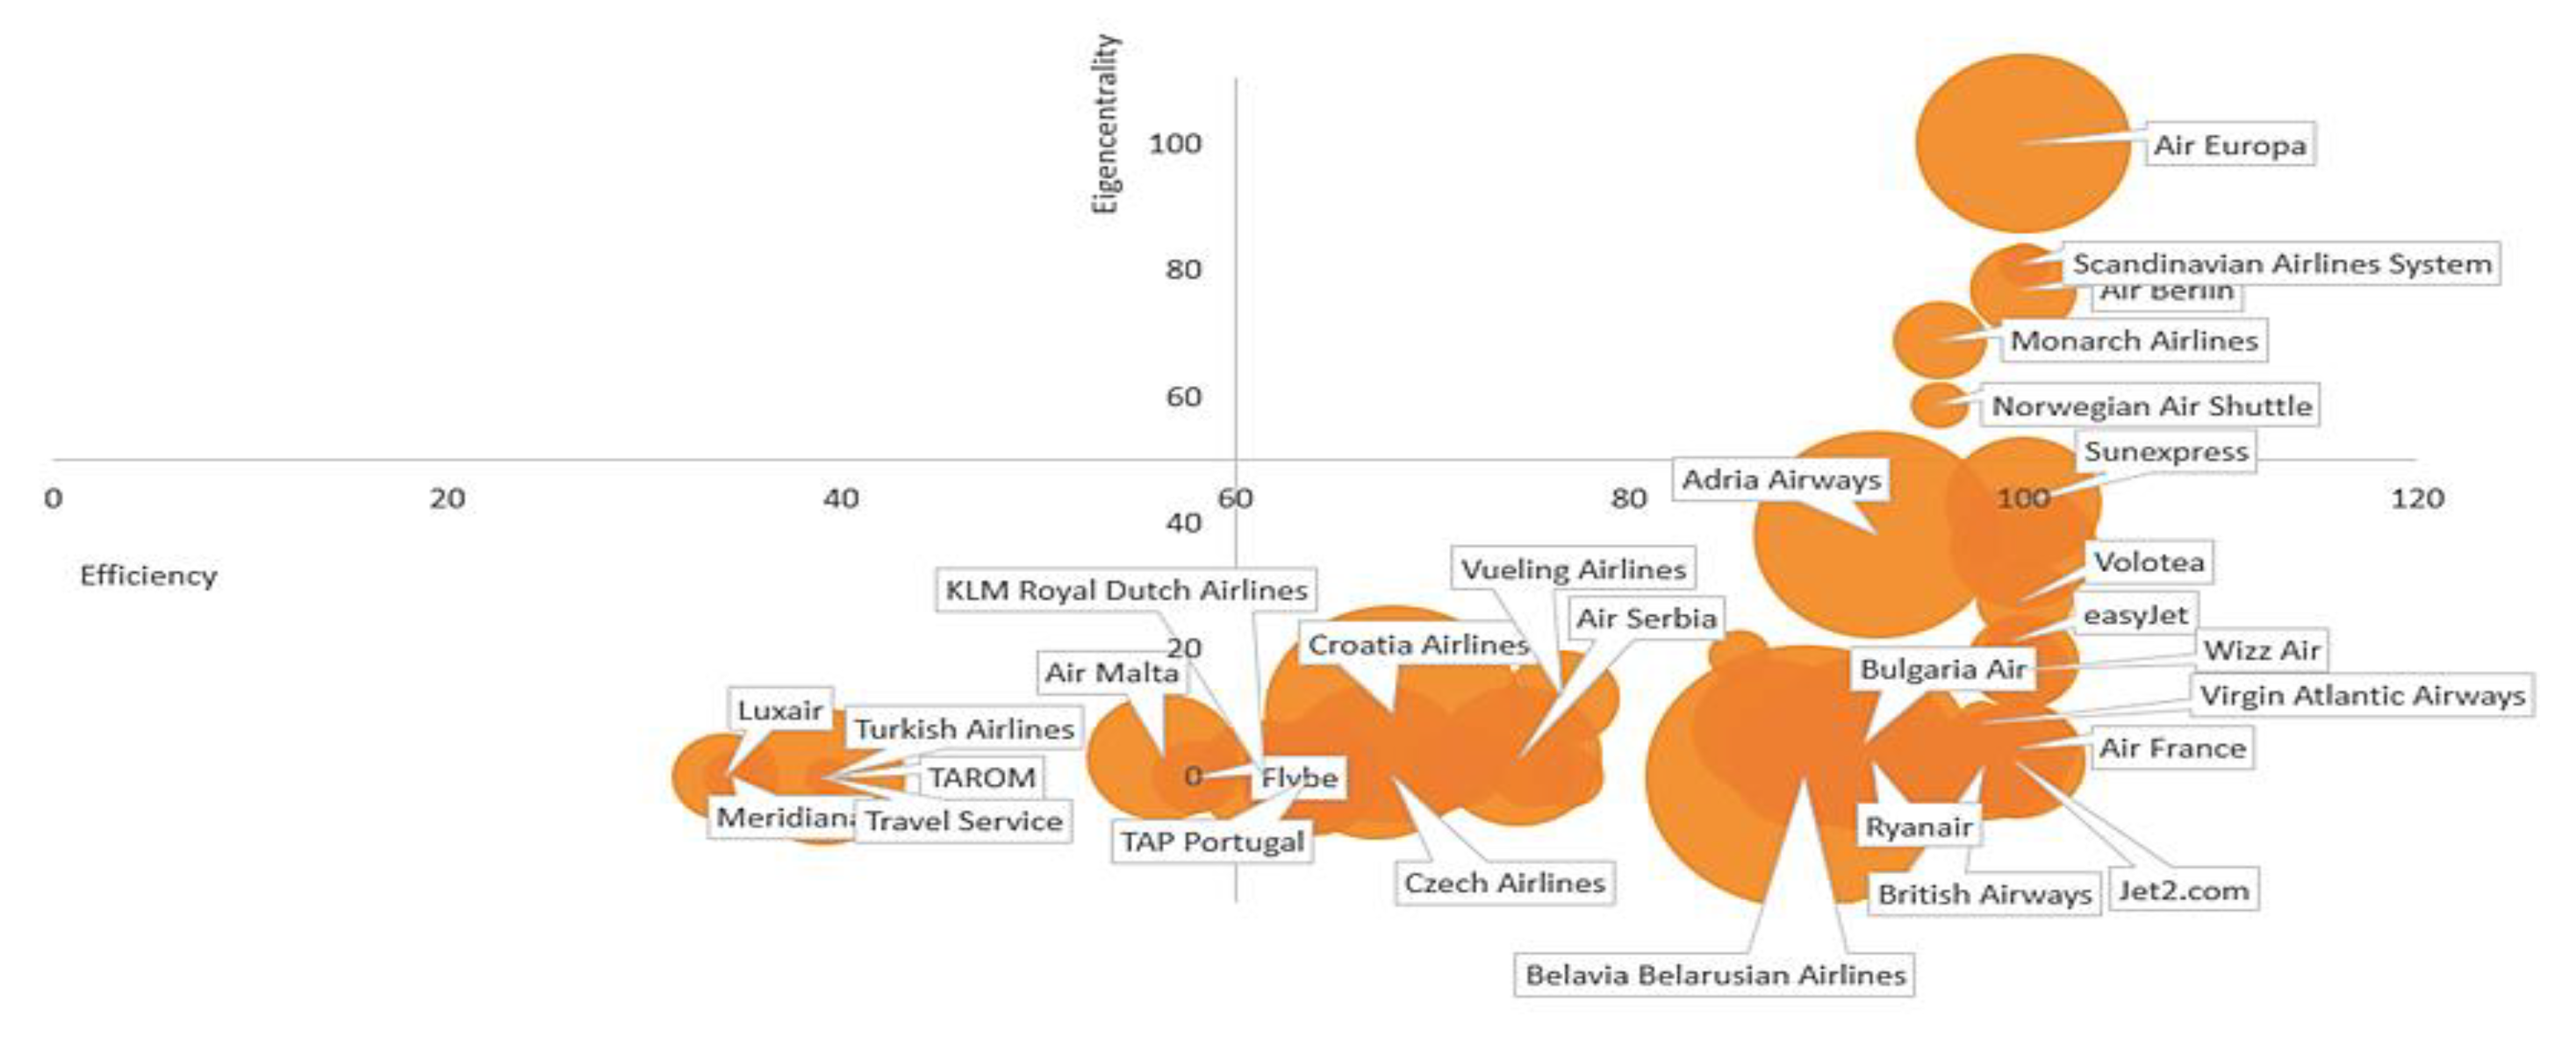
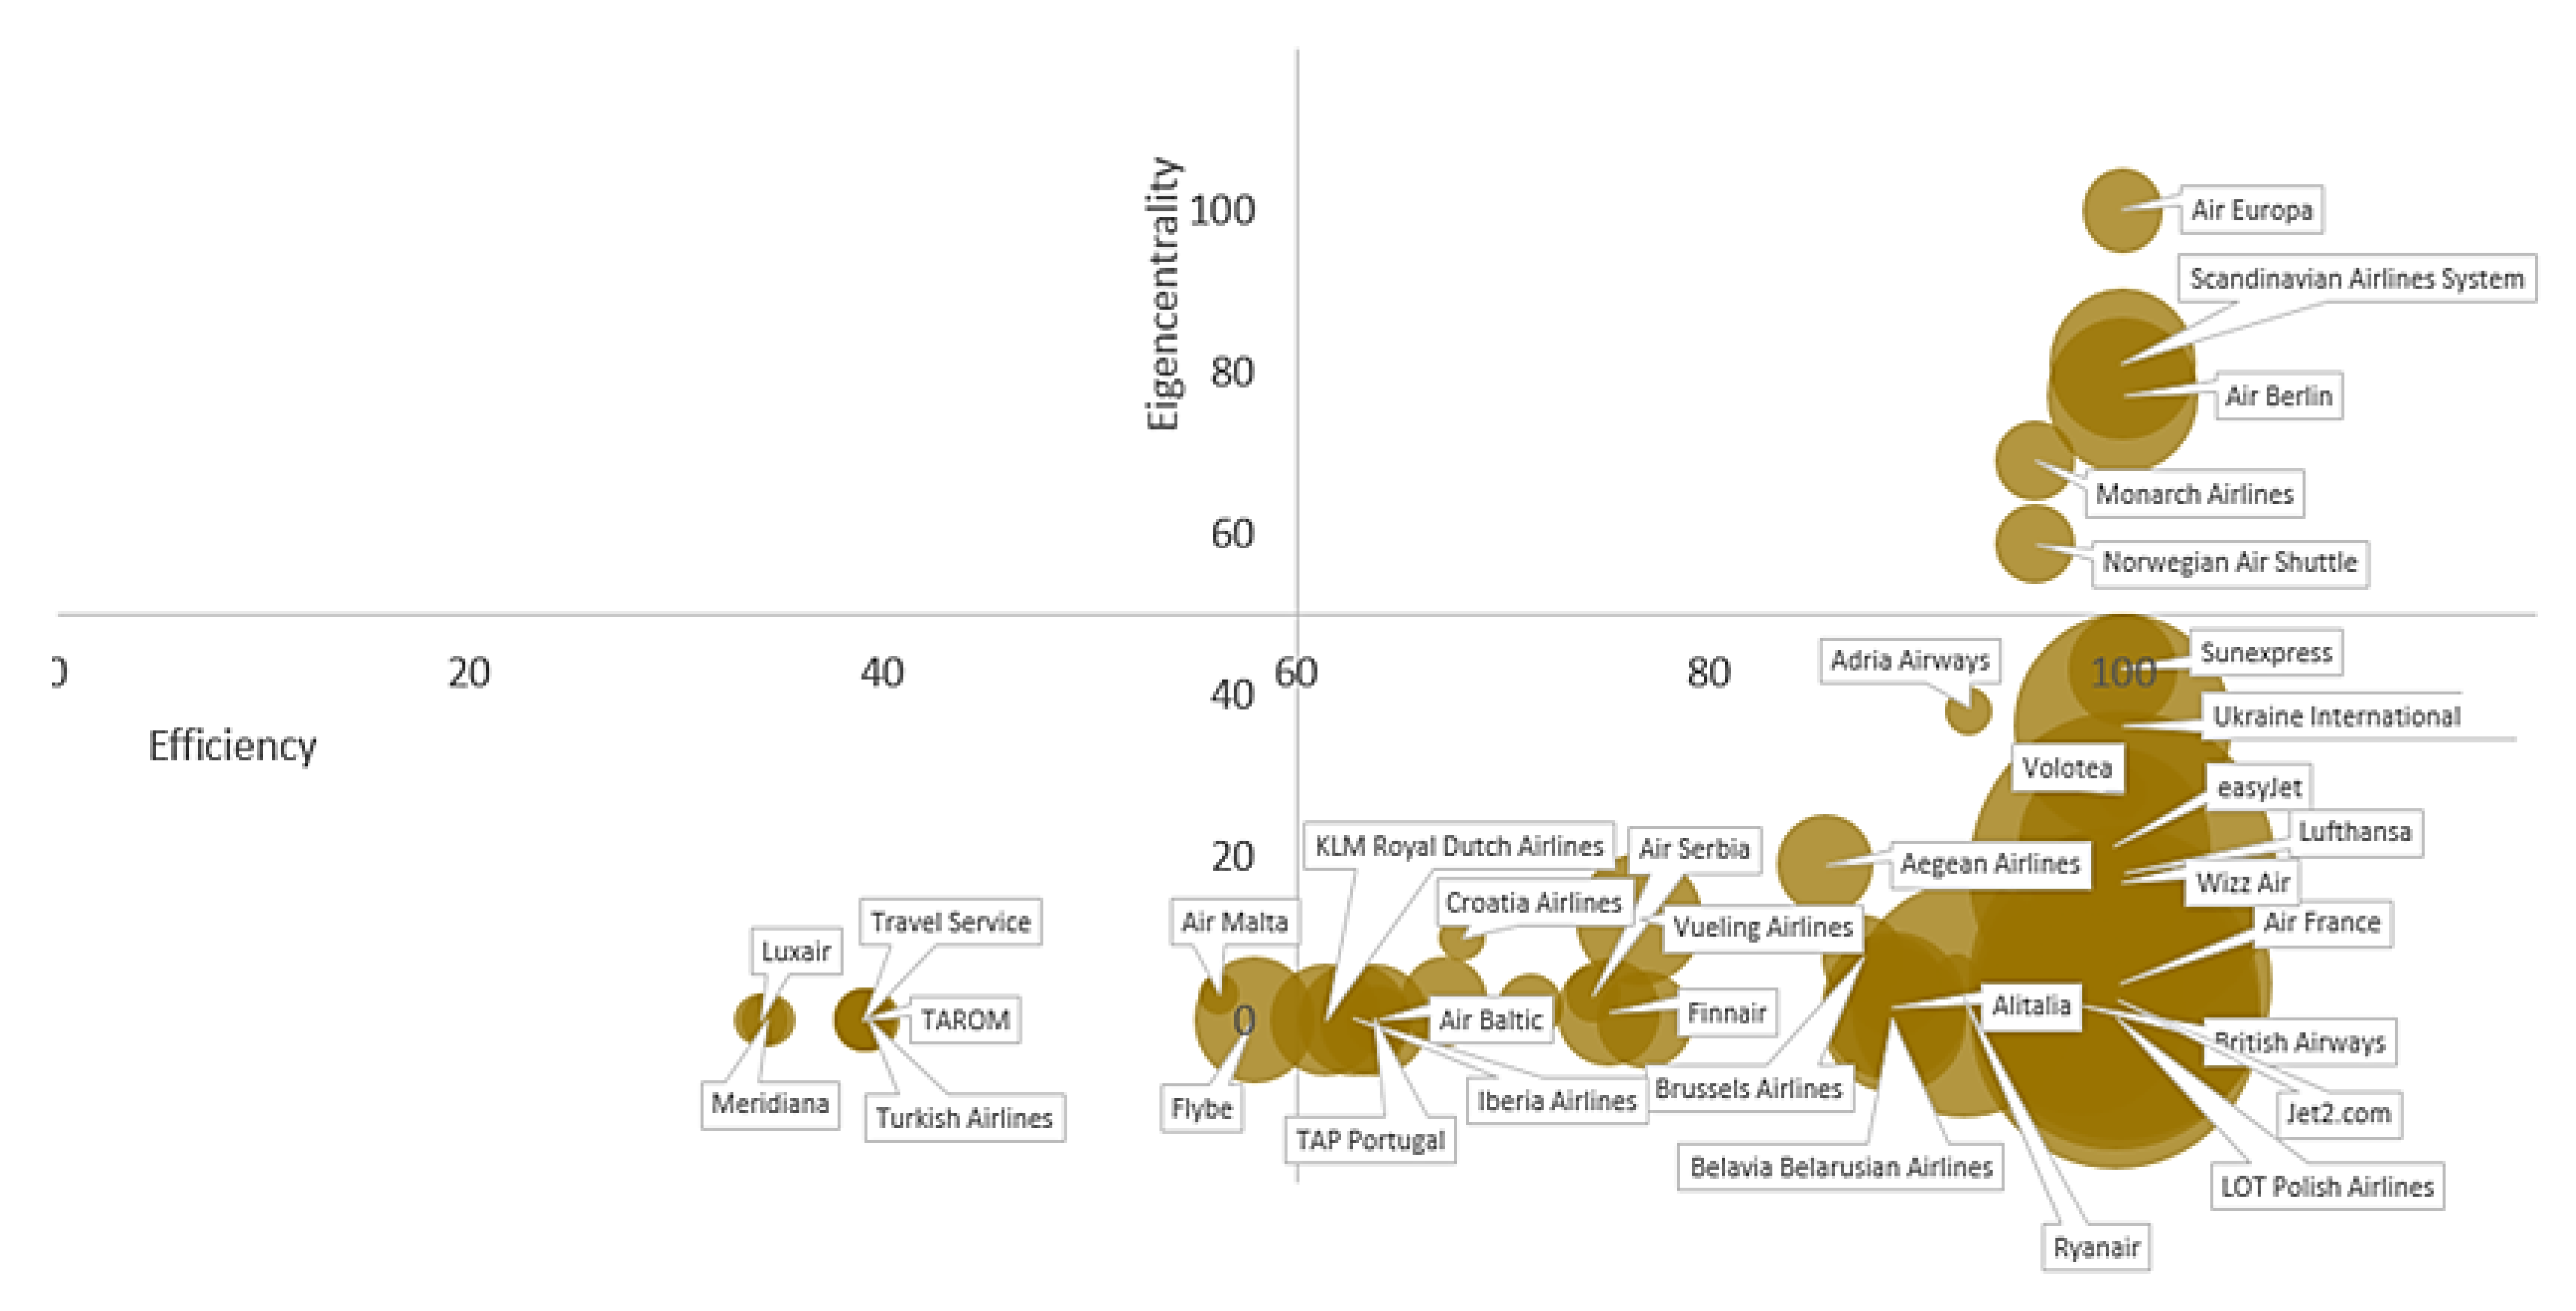
5.2. Discriminating Efficiencies by Ranking Centralities
5.3. Discussion on the Results
6. Conclusions
Author Contributions
Funding
Acknowledgments
Conflicts of Interest
Appendix A

| Air Line Company | Business Management | Network Management | Online Social Network Management | TOTAL | |||||||||||||||
|---|---|---|---|---|---|---|---|---|---|---|---|---|---|---|---|---|---|---|---|
| Model 1 | Model 2 | Model 3 | Model 4 | Model 5 | Model 6 | Model 7 | Model 8 | Model 9 | |||||||||||
| (Basic) | (Air-Line Basic) | (Degree Net) | (Eigencentrality Net) | (Total Net) | (Facebook SM) | (Twitter SM) | (YouTube SM) | (Integral) | |||||||||||
| DMU | Name | Original | Bias- correc | Original | Bias- correc | Original | Bias- correc | Original | Bias- correc | Original | Bias- correc | Original | Bias- correc | Original | Bias- correc | Original | Bias- correc | Original | Bias- correc |
| A01 | Adria Airways | 0.6293 | 0.3313 | 1 | 1 | 1 | 1 | 1 | 1 | 1 | 1 | 1 | 1 | 1 | 1 | 1 | 1 | 1 | 1 |
| A02 | Aegean Airlines | 0.7939 | 0.6152 | 0.7939 | 0.7542 | 0.8222 | 0.7628 | 1 | 1 | 1 | 1 | 0.7982 | 0.7759 | 1 | 1 | 0.8308 | 0.7961 | 1 | 1 |
| A03 | Aer Lingus | 0.5407 | 0.3374 | 0.5502 | 0.5099 | 0.5502 | 0.5096 | 0.6295 | 0.5882 | 0.6295 | 0.5843 | 1 | 1 | 1 | 1 | 0.5502 | 0.515 | 1 | 1 |
| A04 | Aeroflot Russian Airlines | 0.7939 | 0.6152 | 0.7939 | 0.7542 | 0.7939 | 0.7481 | 0.7939 | 0.731 | 0.7939 | 0.7341 | 0.7982 | 0.7759 | 1 | 1 | 0.8308 | 0.7961 | 0.7982 | 0.766 |
| A05 | Air Berlin | 1 | 1 | 1 | 1 | 1 | 1 | 1 | 1 | 1 | 1 | 1 | 1 | 1 | 1 | 1 | 1 | 1 | 1 |
| A06 | Air Europa | 1 | 1 | 1 | 1 | 1 | 1 | 1 | 1 | 1 | 1 | 1 | 1 | 1 | 1 | 1 | 1 | 1 | 1 |
| A07 | Air France | 0.9939 | 0.9877 | 1 | 1 | 1 | 1 | 1 | 1 | 1 | 1 | 1 | 1 | 1 | 1 | 1 | 1 | 1 | 1 |
| A08 | Air Malta | 0.4136 | 0.3028 | 0.4941 | 0.4505 | 0.4941 | 0.4517 | 0.5284 | 0.4884 | 0.5284 | 0.491 | 0.7281 | 0.6894 | 1 | 1 | 0.5056 | 0.4655 | 0.7536 | 0.7265 |
| A09 | Air Serbia | 0.4242 | 0.2407 | 0.6682 | 0.6369 | 0.6682 | 0.637 | 0.7575 | 0.7247 | 0.7575 | 0.726 | 1 | 1 | 1 | 1 | 0.7768 | 0.73 | 1 | 1 |
| A10 | Air Baltic | 0.5672 | 0.3966 | 0.6169 | 0.5747 | 0.6169 | 0.5741 | 0.7905 | 0.7196 | 0.7905 | 0.7243 | 0.6322 | 0.6047 | 0.7919 | 0.7662 | 0.6368 | 0.5987 | 0.8326 | 0.799 |
| A11 | Alitalia | 0.0072 | 0.0009 | 1 | 1 | 1 | 1 | 1 | 1 | 1 | 1 | 1 | 1 | 1 | 1 | 1 | 1 | 1 | 1 |
| A12 | Belavia Belarusian Airlines | 0.0069 | 0.0011 | 1 | 1 | 1 | 1 | 1 | 1 | 1 | 1 | 1 | 1 | 1 | 1 | 1 | 1 | 1 | 1 |
| A13 | British Airways | 0.9072 | 0.816 | 1 | 1 | 1 | 1 | 1 | 1 | 1 | 1 | 1 | 1 | 1 | 1 | 1 | 1 | 1 | 1 |
| A14 | Brussels Airlines | 0.7656 | 0.5788 | 0.7656 | 0.7209 | 0.7802 | 0.7237 | 1 | 1 | 1 | 1 | 1 | 1 | 1 | 1 | 0.8921 | 0.8475 | 1 | 1 |
| A15 | Bulgaria Air | 0.4367 | 0.2757 | 1 | 1 | 1 | 1 | 1 | 1 | 1 | 1 | 1 | 1 | 1 | 1 | 1 | 1 | 1 | 1 |
| A16 | Croatia Airlines | 0.4215 | 0.2832 | 0.546 | 0.5179 | 0.546 | 0.5189 | 0.6086 | 0.5789 | 0.6086 | 0.5803 | 1 | 1 | 1 | 1 | 0.6712 | 0.6414 | 1 | 1 |
| A17 | Czech Airlines | 0.4218 | 0.283 | 0.544 | 0.5329 | 0.561 | 0.5339 | 0.6236 | 0.5939 | 0.6236 | 0.5953 | 1 | 1 | 1 | 1 | 0.6862 | 0.6564 | 1 | 1 |
| A18 | easyJet | 0.9816 | 0.9634 | 1 | 1 | 1 | 1 | 1 | 1 | 1 | 1 | 1 | 1 | 1 | 1 | 1 | 1 | 1 | 1 |
| A19 | Finnair | 0.6985 | 0.4719 | 0.7026 | 0.6423 | 0.7327 | 0.6786 | 0.7432 | 0.6934 | 0.8473 | 0.7897 | 0.8189 | 0.7673 | 1 | 1 | 0.6856 | 0.6438 | 1 | 1 |
| A20 | Flybe | 0.5064 | 0.2466 | 0.5677 | 0.5127 | 0.5677 | 0.5072 | 0.7914 | 0.7307 | 0.7914 | 0.7315 | 0.5677 | 0.5349 | 0.5677 | 0.5427 | 0.6956 | 0.6465 | 0.7914 | 0.7623 |
| A21 | Iberia Airlines | 0.5672 | 0.3255 | 0.6559 | 0.6118 | 0.6665 | 0.5857 | 0.6826 | 0.6225 | 0.7482 | 0.6877 | 0.7188 | 0.6957 | 0.7086 | 0.6932 | 0.6736 | 0.6388 | 0.8261 | 0.7892 |
| A22 | Icelandair | 0.4816 | 0.3144 | 0.5547 | 0.4986 | 0.5547 | 0.4976 | 0.6742 | 0.6161 | 0.7695 | 0.709 | 0.8209 | 0.7842 | 1 | 1 | 1 | 1 | 1 | 1 |
| A23 | Jet2.com | 0.9847 | 0.9696 | 1 | 1 | 1 | 1 | 1 | 1 | 1 | 1 | 1 | 1 | 1 | 1 | 1 | 1 | 1 | 1 |
| A24 | KLM Royal Dutch Airlines | 0.5672 | 0.3255 | 0.6559 | 0.6118 | 0.6559 | 0.6092 | 0.6625 | 0.6222 | 0.6625 | 0.6116 | 0.7188 | 0.6957 | 0.7086 | 0.6932 | 0.6736 | 0.6388 | 0.7489 | 0.7214 |
| A25 | LOT Polish Airlines | 0.9847 | 0.9696 | 1 | 1 | 1 | 1 | 1 | 1 | 1 | 1 | 1 | 1 | 1 | 1 | 1 | 1 | 1 | 1 |
| A26 | Lufthansa | 1 | 1 | 1 | 1 | 1 | 1 | 1 | 1 | 1 | 1 | 1 | 1 | 1 | 1 | 1 | 1 | 1 | 1 |
| A27 | Luxair | 0.3008 | 0.1962 | 0.3008 | 0.2851 | 0.3008 | 0.2824 | 0.3991 | 0.3843 | 0.3991 | 0.3829 | 0.4316 | 0.4225 | 0.4012 | 0.3931 | 0.3008 | 0.2871 | 0.4492 | 0.4385 |
| A28 | Meridiana | 0.3008 | 0.1962 | 0.3008 | 0.2851 | 0.3093 | 0.2883 | 0.4081 | 0.391 | 0.4081 | 0.3848 | 0.4316 | 0.4225 | 0.4012 | 0.3931 | 0.3008 | 0.2871 | 0.4634 | 0.4503 |
| A29 | Monarch Airlines | 0.7965 | 0.6186 | 1 | 1 | 1 | 1 | 1 | 1 | 1 | 1 | 1 | 1 | 1 | 1 | 1 | 1 | 1 | 1 |
| A30 | Norwegian Air Shuttle | 0.7965 | 0.6186 | 1 | 1 | 1 | 1 | 1 | 1 | 1 | 1 | 1 | 1 | 1 | 1 | 1 | 1 | 1 | 1 |
| A31 | Ryanair | 0.6151 | 0.3089 | 1 | 1 | 1 | 1 | 1 | 1 | 1 | 1 | 1 | 1 | 1 | 1 | 1 | 1 | 1 | 1 |
| A32 | S7 Airlines | 0.0758 | 0.009 | 1 | 1 | 1 | 1 | 1 | 1 | 1 | 1 | 1 | 1 | 1 | 1 | 1 | 1 | 1 | 1 |
| A33 | Scandinavian Airlines System | 1 | 1 | 1 | 1 | 1 | 1 | 1 | 1 | 1 | 1 | 1 | 1 | 1 | 1 | 1 | 1 | 1 | 1 |
| A34 | Sunexpress | 1 | 1 | 1 | 1 | 1 | 1 | 1 | 1 | 1 | 1 | 1 | 1 | 1 | 1 | 1 | 1 | 1 | 1 |
| A35 | TAP Portugal | 0.643 | 0.3878 | 0.6838 | 0.6294 | 0.6838 | 0.627 | 0.6838 | 0.6359 | 0.6838 | 0.6347 | 0.717 | 0.6889 | 0.8251 | 0.7959 | 0.6838 | 0.6426 | 0.717 | 0.6961 |
| A36 | TAROM | 0.2526 | 0.1788 | 0.3231 | 0.3095 | 0.3231 | 0.3033 | 0.3231 | 0.3059 | 0.324 | 0.3049 | 0.5342 | 0.5261 | 0.4081 | 0.4023 | 0.681 | 0.6602 | 0.5342 | 0.5258 |
| A37 | Travel Service | 0.2376 | 0.1638 | 0.3081 | 0.2945 | 0.3081 | 0.2883 | 0.3081 | 0.2909 | 0.309 | 0.2899 | 0.5192 | 0.5111 | 0.3931 | 0.3873 | 0.666 | 0.6452 | 0.5192 | 0.5108 |
| A38 | Turkish Airlines | 0.2676 | 0.1938 | 0.3381 | 0.3245 | 0.3381 | 0.3183 | 0.3381 | 0.3209 | 0.339 | 0.3199 | 0.5492 | 0.5411 | 0.4231 | 0.4173 | 0.696 | 0.6752 | 0.5492 | 0.5419 |
| A39 | Ukraine International Airlines | 1 | 1 | 1 | 1 | 1 | 1 | 1 | 1 | 1 | 1 | 1 | 1 | 1 | 1 | 1 | 1 | 1 | 1 |
| A40 | Virgin Atlantic Airways | 0.9057 | 0.814 | 1 | 1 | 1 | 1 | 1 | 1 | 1 | 1 | 1 | 1 | 1 | 1 | 1 | 1 | 1 | 1 |
| A41 | Volotea | 1 | 1 | 1 | 1 | 1 | 1 | 1 | 1 | 1 | 1 | 1 | 1 | 1 | 1 | 1 | 1 | 1 | 1 |
| A42 | Vueling Airlines | 0.7633 | 0.561 | 0.7759 | 0.7108 | 0.7759 | 0.7125 | 0.7759 | 0.706 | 0.7759 | 0.7106 | 0.7884 | 0.7391 | 1 | 1 | 1 | 1 | 0.7884 | 0.7516 |
| A43 | Wizz Air | 1 | 1 | 1 | 1 | 1 | 1 | 1 | 1 | 1 | 1 | 1 | 1 | 1 | 1 | 1 | 1 | 1 | 1 |
Appendix B
| Airline Company | ||||||||||||||||||||||||||||
|---|---|---|---|---|---|---|---|---|---|---|---|---|---|---|---|---|---|---|---|---|---|---|---|---|---|---|---|---|
| DMU | Name | A01 | A02 | A03 | A05 | A06 | A07 | A08 | A09 | A13 | A14 | A15 | A16 | A18 | A22 | A23 | A26 | A29 | A30 | A31 | A32 | A33 | A34 | A39 | A40 | A41 | A42 | A43 |
| A01 | Adria Airways | 8 | 0 | 0 | 0 | 0.03 | 0 | 0 | 0 | 0 | 0 | 0 | 0 | 0 | 0 | 0 | 0 | 0 | 0 | 0 | 0 | 0 | 0.7 | 0 | 0 | 0.27 | 0 | 0 |
| A02 | Aegean Airlines | 0 | 4 | 0 | 0 | 1.89 | 0 | 0 | 0 | 0 | 0 | 0 | 0 | 0 | 0 | 0 | 0 | 0.07 | 0 | 0 | 0 | 2.52 | 0.41 | 0.01 | 0 | 0 | 0 | 0.07 |
| A03 | Aer Lingus | 0.52 | 0 | 2 | 1.43 | 2.63 | 0 | 0 | 0 | 0 | 0 | 0 | 0 | 0.36 | 0 | 0 | 0 | 0.44 | 0.74 | 0 | 0 | 0 | 0 | 0.41 | 0 | 0 | 0 | 0.47 |
| A04 | Aeroflot Russian Airlines | 0 | 1 | 0 | 0 | 3.15 | 0 | 0 | 0 | 0 | 0 | 0 | 0 | 0 | 0 | 0 | 0 | 0 | 0 | 0 | 0 | 4.08 | 0.57 | 0.01 | 0 | 0 | 0 | 0.14 |
| A05 | Air Berlin | 0 | 0 | 0 | 9 | 0 | 0 | 0 | 0 | 0 | 0 | 0 | 0 | 0 | 0 | 0 | 0 | 0 | 0 | 0 | 0 | 0 | 0 | 0 | 0 | 0 | 0 | 0 |
| A06 | Air Europa | 0 | 0 | 0 | 0 | 9 | 0 | 0 | 0 | 0 | 0 | 0 | 0 | 0 | 0 | 0 | 0 | 0 | 0 | 0 | 0 | 0 | 0 | 0 | 0 | 0 | 0 | 0 |
| A07 | Air France | 0 | 0 | 0 | 0.25 | 0 | 8 | 0 | 0 | 0 | 0 | 0 | 0 | 0 | 0 | 0 | 0.75 | 0 | 0 | 0 | 0 | 0 | 0 | 0 | 0 | 0 | 0 | 0 |
| A08 | Air Malta | 4.41 | 0.08 | 0 | 0.02 | 0.97 | 0 | 1 | 0 | 0 | 0.02 | 0 | 1.02 | 0 | 0 | 0 | 0 | 0.14 | 0.17 | 0 | 0 | 0.45 | 0.72 | 0 | 0 | 0 | 0 | 0 |
| A09 | Air Serbia | 3.91 | 0.18 | 0 | 0 | 0.19 | 0 | 0 | 3 | 0 | 0 | 0 | 0 | 0 | 0 | 0 | 0 | 0.24 | 0.14 | 0 | 0 | 0.79 | 0.58 | 0 | 0 | 0 | 0 | 0 |
| A10 | Air Balt ic | 4.4 | 0.87 | 0 | 0 | 0.69 | 0 | 0 | 0 | 0 | 0 | 0 | 0.16 | 0 | 0 | 0 | 0 | 0.19 | 0 | 0 | 0.05 | 1 | 1.36 | 0 | 0 | 0.34 | 0 | 0 |
| A11 | Alitalia | 0 | 0 | 0 | 0 | 0 | 0 | 0 | 0 | 0 | 0 | 0 | 0 | 0 | 0 | 0 | 0 | 0 | 0 | 0 | 0 | 0 | 0 | 1 | 0 | 0 | 0 | 0 |
| A12 | Belavia Belarusian Airlines | 0 | 0 | 0 | 0 | 0 | 0 | 0 | 0 | 0 | 0 | 0 | 0 | 0 | 0 | 0 | 0 | 0 | 0 | 0 | 0 | 0 | 0 | 1 | 0 | 0 | 0 | 0 |
| A13 | Brit ish Airways | 0 | 0 | 0 | 0.1 | 0 | 0 | 0 | 0 | 8 | 0 | 0 | 0 | 0 | 0 | 0 | 0.36 | 0 | 0 | 0 | 0 | 0 | 0 | 0.54 | 0 | 0 | 0 | 0 |
| A14 | Brussels Airlines | 0 | 0 | 0 | 0 | 3.17 | 0 | 0 | 0 | 0 | 5 | 0 | 0 | 0 | 0 | 0 | 0 | 0.05 | 0 | 0 | 0 | 0.23 | 0.23 | 0 | 0 | 0.24 | 0.07 | 0 |
| A15 | Bulgaria Air | 0 | 0 | 0 | 0 | 0.15 | 0 | 0 | 0 | 0 | 0 | 8 | 0 | 0 | 0 | 0 | 0 | 0 | 0 | 0 | 0 | 0 | 0.1 | 0 | 0 | 0.76 | 0 | 0 |
| A16 | Croatia Airlines | 3.96 | 0.16 | 0 | 0 | 0.28 | 0 | 0 | 0 | 0 | 0 | 0 | 3 | 0 | 0 | 0 | 0 | 0.16 | 0.16 | 0 | 0 | 0.52 | 0.74 | 0 | 0 | 0 | 0 | 0 |
| A17 | Czech Airlines | 3.96 | 0.16 | 0 | 0 | 0.28 | 0 | 0 | 0 | 0 | 0 | 0 | 3 | 0 | 0 | 0 | 0 | 0.16 | 0.16 | 0 | 0 | 0.52 | 0.74 | 0 | 0 | 0 | 0 | 0 |
| A18 | easyJet | 0 | 0 | 0 | 0.69 | 0 | 0 | 0 | 0 | 0 | 0 | 0 | 0 | 8 | 0 | 0 | 0.02 | 0 | 0 | 0 | 0 | 0 | 0 | 0.29 | 0 | 0 | 0 | 0 |
| A19 | Finnair | 0.64 | 0 | 0.02 | 2.06 | 1.98 | 0 | 0 | 0 | 0 | 0 | 0 | 0 | 0.49 | 0 | 0 | 0 | 0 | 0.26 | 0 | 0 | 0.37 | 0 | 0.36 | 0.81 | 0 | 0 | 0 |
| A20 | Flybe | 2.63 | 0.87 | 0 | 0.03 | 1.49 | 0 | 0 | 0 | 0 | 0 | 0 | 0 | 0.25 | 0 | 0 | 0 | 0 | 0 | 0 | 0 | 0.42 | 0 | 0.12 | 0 | 0.15 | 0.41 | 2.63 |
| A21 | Iberia Airlines | 0.48 | 0 | 0 | 1.08 | 1.11 | 0.28 | 0 | 0 | 0.12 | 0.43 | 0 | 0 | 3.18 | 0 | 0.04 | 0.35 | 0 | 0.39 | 0.07 | 0 | 0.08 | 0 | 0.03 | 1.38 | 0 | 0 | 0 |
| A22 | Icelandair | 0.68 | 0 | 0 | 0.13 | 2.66 | 0.01 | 0 | 0 | 0 | 0 | 0.8 | 0 | 0.03 | 3 | 0 | 0 | 0 | 1.14 | 0 | 0 | 0.07 | 0 | 0.02 | 0.45 | 0 | 0 | 0 |
| A23 | Jet2.com | 0 | 0 | 0 | 0 | 0 | 0 | 0 | 0 | 0 | 0 | 0 | 0 | 0 | 0 | 8 | 0.5 | 0 | 0 | 0 | 0 | 0 | 0 | 0.5 | 0 | 0 | 0 | 0 |
| A24 | KLM Royal Dutch Airlines | 0 | 0 | 0 | 1.17 | 1.11 | 0.36 | 0 | 0 | 0 | 0.28 | 0 | 0 | 3.08 | 0.05 | 0 | 0.34 | 0 | 0.2 | 0.14 | 0 | 0.08 | 0 | 0.03 | 2.18 | 0 | 0 | 0 |
| A25 | LOT Polish Airlines | 0 | 0 | 0 | 0 | 0 | 0 | 0 | 0 | 0 | 0 | 0 | 0 | 0 | 0 | 8 | 0.5 | 0 | 0 | 0 | 0 | 0 | 0 | 0.5 | 0 | 0 | 0 | 0 |
| A26 | Lufthansa | 0 | 0 | 0 | 0 | 0 | 0 | 0 | 0 | 0 | 0 | 0 | 0 | 0 | 0 | 0 | 9 | 0 | 0 | 0 | 0 | 0 | 0 | 0 | 0 | 0 | 0 | 0 |
| A27 | Luxair | 0.74 | 0 | 0 | 0.4 | 3.9 | 0 | 0 | 0 | 0 | 1.21 | 0 | 1.22 | 0 | 0 | 0 | 0 | 0.57 | 0 | 0 | 0 | 0 | 0.06 | 0.06 | 0.05 | 0.16 | 0.05 | 0.56 |
| A28 | Meridiana | 0.9 | 0 | 0 | 0.45 | 3.76 | 0 | 0 | 0 | 0 | 1.11 | 0 | 1.25 | 0.05 | 0 | 0 | 0 | 0.57 | 0.01 | 0 | 0 | 0 | 0.06 | 0.04 | 0.02 | 0.24 | 0.05 | 0.49 |
| A29 | Monarch Airlines | 0 | 0 | 0 | 0.16 | 0.28 | 0 | 0 | 0 | 0 | 0 | 0 | 0 | 0 | 0 | 0 | 0 | 6 | 2 | 0 | 0 | 0.56 | 0 | 0 | 0 | 0 | 0 | 0 |
| A30 | Norwegian Air Shuttle | 0 | 0 | 0 | 0.16 | 0.28 | 0 | 0 | 0 | 0 | 0 | 0 | 0 | 0 | 0 | 0 | 0 | 5 | 3 | 0 | 0 | 0.56 | 0 | 0 | 0 | 0 | 0 | 0 |
| A31 | Ryanair | 0 | 0 | 0 | 0.37 | 0 | 0 | 0 | 0 | 0 | 0 | 0 | 0 | 0 | 0 | 0 | 0.05 | 0 | 0 | 8 | 0 | 0 | 0 | 0.57 | 0 | 0 | 0 | 0 |
| A32 | S7 Airlines | 0 | 0 | 0 | 0 | 0.02 | 0 | 0 | 0 | 0 | 0 | 0 | 0 | 0 | 0 | 0 | 0 | 0 | 0 | 0 | 8 | 0 | 0 | 0 | 0 | 0.97 | 0 | 0 |
| A33 | Scandinavian Airlines System | 0 | 0 | 0 | 0 | 0 | 0 | 0 | 0 | 0 | 0 | 0 | 0 | 0 | 0 | 0 | 0 | 0 | 0 | 0 | 0 | 9 | 0 | 0 | 0 | 0 | 0 | 0 |
| A34 | Sunexpress | 0 | 0 | 0 | 0 | 0 | 0 | 0 | 0 | 0 | 0 | 0 | 0 | 0 | 0 | 0 | 0 | 0 | 0 | 0 | 0 | 0 | 9 | 0 | 0 | 0 | 0 | 0 |
| A35 | TAP Portugal | 0 | 0 | 0 | 3.38 | 1.12 | 0 | 0 | 0 | 0 | 0 | 0 | 0 | 0 | 0 | 0 | 0.02 | 0.09 | 0 | 0 | 0 | 0.26 | 0 | 0.33 | 3.35 | 0 | 0.45 | 0 |
| A36 | TAROM | 2.4 | 0 | 0 | 0 | 1 | 0 | 0.14 | 0.03 | 0 | 0 | 0.18 | 1.56 | 0.04 | 0 | 0 | 0 | 1.46 | 0.74 | 0 | 0.14 | 0.64 | 0.26 | 0 | 0 | 0.22 | 0.17 | 0 |
| A37 | Travel Service | 2.43 | 0 | 0 | 0.02 | 0.97 | 0 | 0.14 | 0.03 | 0 | 0 | 0.18 | 1.56 | 0.04 | 0 | 0 | 0 | 1.47 | 0.72 | 0 | 0.14 | 0.63 | 0.26 | 0 | 0 | 0.22 | 0.17 | 0 |
| A38 | Turkish Airlines | 2.39 | 0 | 0 | 0 | 1.01 | 0 | 0.14 | 0.03 | 0 | 0 | 0.18 | 1.56 | 0.04 | 0 | 0 | 0 | 1.69 | 0.51 | 0 | 0.14 | 0.64 | 0.26 | 0 | 0 | 0.22 | 0.17 | 0 |
| A39 | Ukraine International Airlines | 0 | 0 | 0 | 0 | 0 | 0 | 0 | 0 | 0 | 0 | 0 | 0 | 0 | 0 | 0 | 0 | 0 | 0 | 0 | 0 | 0 | 0 | 9 | 0 | 0 | 0 | 0 |
| A40 | Virgin Atlantic Airways | 0 | 0 | 0 | 0.84 | 0 | 0 | 0 | 0 | 0 | 0 | 0 | 0 | 0 | 0 | 0 | 0 | 0 | 0 | 0 | 0 | 0.16 | 0 | 0 | 8 | 0 | 0 | 0 |
| A41 | Volotea | 0 | 0 | 0 | 0 | 0 | 0 | 0 | 0 | 0 | 0 | 0 | 0 | 0 | 0 | 0 | 0 | 0 | 0 | 0 | 0 | 0 | 0 | 0 | 0 | 9 | 0 | 0 |
| A42 | Vueling Airlines | 0.02 | 0 | 0 | 0.1 | 5.11 | 0 | 0 | 0 | 0 | 0 | 0 | 0 | 0.32 | 0 | 0 | 0 | 0 | 0 | 0 | 0 | 0.18 | 0 | 0.31 | 0 | 0 | 2 | 0.94 |
| A43 | Wizz Air | 0 | 0 | 0 | 0 | 0 | 0 | 0 | 0 | 0 | 0 | 0 | 0 | 0 | 0 | 0 | 0 | 0 | 0 | 0 | 0 | 0 | 0 | 0 | 0 | 0 | 0 | 9 |
References
- Bauer, P. Decomposing TFP growth in the presence of cost inefficiency, nonconstant returns to scale, and technological progress. J. Product. Anal. 1990, 1, 287–299. [Google Scholar] [CrossRef]
- Good, D.H.; Nadiri, M.I.; Sickles, R.C. Efficiency and productivity growth comparisons of European and US Air carriers: A first look at the data. J. Product. Anal. 1993, 4, 115–125. [Google Scholar] [CrossRef]
- Baltagi, B.; Griffin, J.; Rich, D. Airline deregulation: The cost pieces of the puzzle. Int. Econ. Rev. 1995, 245–258. [Google Scholar] [CrossRef]
- Barbot, C.; Costa, Á.; Sochirca, E. Airlines performance in the new market context: A comparative productivity and efficiency analysis. J. Air Transp. Manag. 2008, 14, 270–274. [Google Scholar] [CrossRef]
- Charnes, A.; Gallegos, A.; Li, H. Robustly efficient parametric frontiers via Multiplicative DEA for domestic and international operations of the Latin American airline industry. Eur. J. Oper. Res. 1996, 88, 525–536. [Google Scholar] [CrossRef]
- Good, D.H.; Röller, L.H.; Sickles, R.C. Airline efficiency differences between Europe and the US: Implications for the pace of EC integration and domestic regulation. Eur. J. Oper. Res. 1995, 80, 508–518. [Google Scholar] [CrossRef]
- Arjomandi, A.; Seufert, J.H. An evaluation of the world’s major airlines’ technical and environmental performance. Econ. Model. 2014, 41, 1–12. [Google Scholar] [CrossRef]
- Tsionas, E.; Assaf, A.G.; Gillen, D.; Mattila, A.S. Modeling technical and service efficiency. Transp. Res. Part B Methodol. 2017, 96, 113–125. [Google Scholar] [CrossRef]
- Cui, Q. Investigating the airlines emission reduction through carbon trading under CNG2020 strategy via a Network Weak Disposability DEA. Energy 2019, 180, 763–771. [Google Scholar] [CrossRef]
- Yu, H.; Zhang, Y.; Zhang, A.; Wang, K.; Cui, Q. A comparative study of airline efficiency in China and India: A dynamic network DEA approach. Res. Transp. Econ. 2019. [Google Scholar] [CrossRef]
- Lozano, S.; Gutiérrez, E. Efficiency Analysis and Target Setting of Spanish Airports. Netw. Spat. Econ. 2011, 11, 139–157. [Google Scholar] [CrossRef]
- Figueiredo, S.; Gomes, J.; Paula, A.; Baptista, C.; de Mello, S.; Angulo, L. Evaluation of Brazilian airlines nonradial efficiencies and targets using an alternative DEA approach. Int. Trans. Oper. Res. 2016, 23, 669–689. [Google Scholar] [CrossRef]
- Choi, K.; Lee, D.; Olson, D.L. Service quality and productivity in the US airline industry: A service quality-adjusted DEA model. Serv. Bus. 2013, 9, 137–160. [Google Scholar] [CrossRef]
- Li, Y.; Wang, Y.; Cui, Q. Has airline efficiency affected by the inclusion of aviation into European Union Emission Trading Scheme? Evidences from 22 airlines during 2008–2012. Energy 2016, 96, 8–22. [Google Scholar] [CrossRef]
- Koka, B.R.; Prescott, J.E. Strategic Alliances as Social Capital: A Multidimensional View. Strateg. Manag. J. 2002, 23, 795–816. [Google Scholar] [CrossRef]
- Barros, C.; Leach, S. Analyzing the performance of the English FA Premier League with an econometric frontier model. J. Sports Econom. 2006, 7, 391–407. [Google Scholar] [CrossRef]
- Sjögren, S.; Söderberg, M. Productivity of airline carriers and its relation to deregulation, privatisation and membership in strategic alliances. Transp. Res. Part E Logist. Transp. Rev. 2011, 47, 228–237. [Google Scholar] [CrossRef]
- Greer, M. Is it the labor unions’ fault? Dissecting the causes of the impaired technical efficiencies of the legacy carriers in the United States. Transp. Res. Part A Policy Pract. 2009, 43, 779–789. [Google Scholar] [CrossRef]
- Merkert, R.; Hensher, D. The Impact of Strategic Management and Fleet Planning on Airline efficiency. Transp. Res. Part A Policy Pract. 2011, 45, 689–695. [Google Scholar] [CrossRef]
- Taymaz, E. Are small firms really less productive? Small Bus. Econ. 2005, 25, 429–445. [Google Scholar] [CrossRef]
- Barney, J. Firm Resources and Sustained Competitive Advantage. J. Manag. 1991, 17, 99–120. [Google Scholar] [CrossRef]
- Barney, J. Resource-based theories of competitive advantage: A ten-year retrospective on the resource-based view. J. Manag. 2001, 27, 643–650. [Google Scholar] [CrossRef]
- Mellroth, P.; Karlsson, J.; Steiner, H. A scavenger function for a Drosophila peptidoglycan recognition protein. J. Biol. Chem. 2003, 278, 7059–7064. [Google Scholar] [CrossRef] [PubMed]
- Barros, C.; Liang, Q.; Peypoch, N. The technical efficiency of US Airlines. Transp. Res. Part A Policy Pract. 2013, 50, 139–148. [Google Scholar] [CrossRef]
- Union, I. Communication from the Commission to the European Parliament, the Council, the European Economic and Social Committee and the Committee of the Regions. A New Skills Agenda for Europe. Brussels, Belgium, 2014. Available online: https://eur-lex.europa.eu/legal-content/EN/ALL/?uri=COM:2015:614:FIN (accessed on 24 September 2017).
- Davis, H.S. The Measurement of Productive Efficiency. Ind. Study Econ. Prog. 2018, 16–35. [Google Scholar] [CrossRef]
- Liu, J.; Lu, L.; Lu, W.; Lin, B. A survey of DEA applications. Omega 2013, 41, 893–902. [Google Scholar] [CrossRef]
- Cui, Q.; Li, Y. Evaluating energy efficiency for airlines: An application of VFB-DEA. J. Air Transp. Manag. 2015, 44, 34–41. [Google Scholar] [CrossRef]
- Greer, M.R. Nothing focuses the mind on productivity quite like the fear of liquidation: Changes in airline productivity in the United States, 2000–2004. Transp. Res. Part A Policy Pract. 2008, 42, 414–426. [Google Scholar] [CrossRef]
- Mallikarjun, S. Efficiency of US airlines: A strategic operating model. J. Air Transp. Manag. 2015, 43, 46–56. [Google Scholar] [CrossRef]
- Oum, T.H.; Pathomsiri, S.; Yoshida, Y. Limitations of DEA-based approach and alternative methods in the measurement and comparison of social efficiency across firms in different transport modes: An empirical study in Japan. Transp. Res. Part E Logist. Transp. Rev. 2013, 57, 16–26. [Google Scholar] [CrossRef]
- Chang, Y.-T.; Park, H.; Jeong, J.; Lee, J. Evaluating economic and environmental efficiency of global airlines: A SBM-DEA approach. Transp. Res. Part D Transp. Environ. 2014, 27, 46–50. [Google Scholar] [CrossRef]
- Duygun, M.; Prior, D.; Shaban, M.; Tortosa-Ausina, E. Disentangling the European airlines efficiency puzzle: A network data envelopment analysis approach. Omega 2015, 60, 2–14. [Google Scholar] [CrossRef]
- Scotti, D.; Volta, N. An empirical assessment of the co2-sensitive productivity of European airlines from 2000 to 2010. Transp. Res. Part D Transp. Environ. 2015, 37, 137–149. [Google Scholar] [CrossRef]
- Barros, C.P.; Peypoch, N. An evaluation of European airlines’ operational performance. Int. J. Prod. Econ. 2009, 122, 525–533. [Google Scholar] [CrossRef]
- Lee, B.L.; Worthington, A.C. Technical efficiency of mainstream airlines and low-cost carriers: New evidence using bootstrap data envelopment analysis truncated regression. J. Air Transp. Manag. 2014, 38, 15–20. [Google Scholar] [CrossRef]
- Merkert, R.; Williams, G. Determinants of European PSO airline efficiency—Evidence from a semi-parametric approach. J. Air Transp. Manag. 2013, 29, 11–16. [Google Scholar] [CrossRef]
- Knoblich, S.; Martin, A.; Nash, R.; Stansbie, P. Keys to Success in Social Media Marketing (SMM)—Prospects for the German Airline Industry. Tour. Hosp. Res. 2015, 1–18. [Google Scholar] [CrossRef]
- Felix, R.; Rauschnabel, P.A.; Hinsch, C. Elements of strategic social media marketing: A holistic framework. J. Bus. Res. 2016. [Google Scholar] [CrossRef]
- Hudson, S.; Roth, M.S.; Madden, T.J.; Hudson, R. The effects of social media on emotions, brand relationship quality, and word of mouth: An empirical study of music festival attendees. Tour. Manag. 2015, 47, 68–76. [Google Scholar] [CrossRef]
- Jucaityt, I.; Mašinskien, J. Peculiarities of social media integration into marketing communication. Procedia-Soc. Behav. Sci. 2014, 156, 490–495. [Google Scholar] [CrossRef][Green Version]
- Lee, Y.-K.; Park, J.-W. Impact of a sustainable brand on improving business performance of airport enterprises: The case of Incheon International Airport. J. Air Transp. Manag. 2016, 53, 46–53. [Google Scholar] [CrossRef]
- Estrada, E.; Gómez-Gardeñes, J. Network bipartivity and the transportation efficiency of European passenger airlines. Phys. D Nonlinear Phenom. 2016, 323, 57–63. [Google Scholar] [CrossRef]
- Brueckner, J.K. Internalization of airport congestion: A network analysis. Int. J. Ind. Organ. 2005, 23, 599–614. [Google Scholar] [CrossRef]
- Bagler, G. Analysis of the airport network of India as a complex weighted network. Phys. A Stat. Mech. Its Appl. 2008, 387, 2972–2980. [Google Scholar] [CrossRef]
- Jain, R.K.; Natarajan, R. A DEA study of airlines in India. Asia Pac. Manag. Rev. 2015, 20, 285–292. [Google Scholar] [CrossRef]
- Wanke, P.; Barros, C.P. Efficiency in Latin American airlines: A two-stage approach combining Virtual Frontier Dynamic DEA and Simplex Regression. J. Air Transp. Manag. 2016, 54, 93–103. [Google Scholar] [CrossRef]
- Omrani, H.; Soltanzadeh, E. Journal of Air Transport Management Dynamic DEA models with network structure: An application for Iranian airlines. J. Air Transp. Manag. 2016, 57, 52–61. [Google Scholar] [CrossRef]
- Charnes, A.; Cooper, W.; Rhodes, E. Measuring the efficiency of decision making units. Eur. J. Oper. Res. 1978, 2, 429–444. [Google Scholar] [CrossRef]
- Banker, R.D.; Charnes, A.; Cooper, W.W. Some Models for Estimating Technical and Scale Inefficiencies in Data Envelopment Analysis. Manag. Sci. 1984, 30, 1078–1092. [Google Scholar] [CrossRef]
- Efron, B. Bootstrap Methods: Another Look at the Jackknife; Springer: New York, NY, USA, 1992. [Google Scholar]
- Simar, L.; Wilson, P. A general methodology for bootstrapping in non-parametric frontier models. J. Appl. Stat. 2000, 27, 779–802. [Google Scholar] [CrossRef]
- Simar, L.; Wilson, P. Sensitivity Analysis of Efficiency Scores: How to Bootstrap in Nonparametric Frontier Models. Manag. Sci. 1998. [Google Scholar] [CrossRef]
- Silverman, B.; Young, G. The bootstrap: To smooth or not to smooth? Biometrika 1987, 74, 469–479. [Google Scholar] [CrossRef]
- Simar, L.; Wilson, P. Statistical inference in nonparametric frontier models: The state of the art. J. Product. Anal. 2000, 13, 49–78. [Google Scholar]
- Martínez-Núñez, M.; Pérez-Aguiar, W.S. Efficiency analysis of information technology and online social networks management: An integrated DEA-model assessment. Inf. Manag. 2014, 51, 712–725. [Google Scholar] [CrossRef]
- Freeman, L.C. A Set of Measures of Centrality Based on Betweenness. Sociometry 1977, 40, 35–41. [Google Scholar] [CrossRef]
- Jackson, M.O. Social and Economic Networks; Princeton University Press: Princeton, NJ, USA, 2008. [Google Scholar]
- Bonacich, P. Power and Centrality: A Family of Measures. Am. J. Sociol. 1987, 92, 1170–1182. [Google Scholar] [CrossRef]
- Liu, J.; Lu, W. A network-based approach for increasing discrimination in data envelopment analysis. J. Oper. Res. Soc. 2009, 60, 1502–1510. [Google Scholar] [CrossRef]
- Sigala, M. The information and communication technologies productivity impact on the UK hotel sector. Int. J. Oper. Prod. Manag. 2003, 23, 1224–1245. [Google Scholar] [CrossRef]
- Banker, R.; Morey, R. Efficiency analysis for exogenously fixed inputs and outputs. Oper. Res. 1986, 34, 513–521. [Google Scholar] [CrossRef]
- Thore, S.; Kozmetsky, G.; Phillips, F. DEA of financial statements data: The US computer industry. J. Product. Anal. 1994, 5, 229–248. [Google Scholar] [CrossRef]
- Groza, M.D.; Pronschinske, M. Attracting Facebook fans: The importance of authenticity and engagement as a social networking strategy for professional sport teams. Sport Mark. Q. 2012, 21, 221–231. [Google Scholar]
- Stavros, C.; Meng, M.D.; Westberg, K.; Farrelly, F. Understanding fan motivation for interacting on social media. Sport Manag. Rev. 2014, 17, 455–469. [Google Scholar] [CrossRef]
- Cooper, W.; Seiford, L.; Tone, K. Introduction to Data Envelopment Analysis and Its Uses: With DEA-Solver Software and References; Springer Science & Business Media: New York, NY, USA, 2006. [Google Scholar]
- Fried, H.; Schmidt, S.; Yaisawarng, S. Incorporating the operating environment into a nonparametric measure of technical efficiency. J. Product. Anal. 1999, 12, 249–267. [Google Scholar] [CrossRef]
- Angulo-Meza, L.; Lins, M. Review of methods for increasing discrimination in data envelopment analysis. Ann. Oper. Res. 2002, 225–242. [Google Scholar] [CrossRef]
- Adler, N.; Friedman, L.; Sinuany-Stern, Z. Review of ranking methods in the data envelopment analysis context. Eur. J. Oper. Res. 2002, 249–265. [Google Scholar] [CrossRef]
- Lu, W.; Lo, S. An interactive benchmark model ranking performers—Application to financial holding companies. Math. Comput. Model. 2009, 49, 172–179. [Google Scholar] [CrossRef]
- Helfat, C.; Peteraf, M. The dynamic resource-based view: Capability lifecycles. Strateg. Manag. J. 2003, 24, 997–1010. [Google Scholar] [CrossRef]
- Faber, M. Social Media bei Airlines, TOUROM-Studie. Kastellaun, Frankfurt, Germany, 2011. [Google Scholar]
- Zarrella, D. The Social Media Marketing Book; O’Reilly Media Inc.: Sebastopol, CA, USA, 2009. [Google Scholar]
- Hoffman, D.; Fodor, M. Can you measure the ROI of your social media marketing? MIT Sloan Manag. Rev. 2010, 52, 41. [Google Scholar]
- Latorre-Martínez, M.P.; Iñíguez-Berrozpe, T.; Plumed-Lasarte, M. Image-focused social media for a market analysis of tourism consumption. Int. J. Technol. Manag. 2014, 64, 17–30. [Google Scholar] [CrossRef]
- Kietzmann, J.; Hermkens, K.; McCarthy, I.; Silvestre, B. Social media? Get serious! Understanding the functional building blocks of social media. Bus. Horiz. 2011, 54, 241–251. [Google Scholar] [CrossRef]


| Article | Method | Units | Inputs | Outputs |
|---|---|---|---|---|
| Barbot et al. [4] | DEA-BCC and TFP index | 14 US airlines | Number of cores | Available seat-kilometers |
| Employees | Passenger service | |||
| Fleet | Revenue | |||
| Greer [29] | DEA-CCR and two-stage regression | 8 US airlines | Labor | Seat-miles |
| Fuel | ||||
| Fleet-wide passenger seating capacity | ||||
| Barros and Peypoch [35] | DEA-CCR and two-stage regression | European airlines | Employees | Revenue per passenger km |
| Operational cost | EBIT | |||
| Planes | (Euros million) | |||
| Merkert and Hensher [19] | Standard DEA and bootstrapped Tobit | 58 international airlines | Available tonne kilometers | Revenue passenger kilometers |
| Regression | Full-time equivalent workers | Revenue tonne kilometers | ||
| Arjomandi and Seufert [7] | Bootstrapped DEA | 48 international airlines | Number of full-time equivalent employees | Tonne kilometers available (TKA) |
| Total number of flying hours divided by average daily revenue hours | CO2-e emission | |||
| Chang et al. [32] | Slacks-based measure (SBM), DEA | 27 international airlines | Revenue ton kilometers RTK | Revenue passenger kilometers |
| The number of employees | Profits | |||
| Lee and Worthington [36] | Bootstrapped DEA and bootstrapped | 42 US and European airlines | The average number of employees | Tonne kilometers available (TKA) |
| Truncated regression | Total assets in US dollars | |||
| Kilometers flown | ||||
| Jain and Natarajan [46] | Variable returns to scale | 12 airlines in India | Total available ton kilometers | Passenger revenue kilometers performed |
| VRS model of DEA | Operating cost | |||
| Cui and Li [28] | Virtual frontier | 11 airlines from Asia, America, Europe, and Oceania | Number of employees | Revenue tonne kilometers |
| Capital stock | Passenger revenue kilometers | |||
| Tons of aviation kerosene | Total business income | |||
| Benevolent DEA cross-efficiency model (VFB-DEA) | CO2 emissions decrease index | |||
| Duygun et al. [33] | Additive efficiency decomposition of the overall DEA efficiency in the two sub-technologies | 87 airlines from 23 European countries | Fleet data | Revenue tonne kilometers |
| Personnel data | ||||
| Traffic | ||||
| Financial data | ||||
| Wanke and Barros [47] | Virtual frontier dynamic range adjusted model | 19 Latin American airlines | Number of employees | Number of domestic, world, and Latin and Caribbean flights |
| Simplex regression | ||||
| Omrani & Sotanzadeh [48] | Relational dynamic Network DEA (DNDEA) | 8 airlines | Number of employees | Passenger-kilometer performed |
| Passenger-kilometer carried | ||||
| Figueiredo [12] | Classical DEA and nonradial efficiency measure based on vector concepts | 20 Brazilian airlines per year (average) | Fleet capacity | Passenger-kilometer carried |
| Tonne kilometers carried | ||||
| Cui [9] | A network weak disposability DEA | 28 airlines | Number of employees (NE) and aviation kerosene (AK) | Available seat kilometers (ASK) |
| Available seat kilometers (ASK) and fleet size (FS) | Revenue passenger kilometers (RPK) | |||
| Revenue passenger kilometers (RPK) and sales costs | Total revenue (TR) | |||
| Wang [10] | Grey model GM (1,1) and data envelopment analysis (DEA) window model | 16 major Asia airlines | Fleet | Revenue passenger kilometers (RPKs) |
| Total assets | ||||
| Operating expenses | Available Seat Kilometers (ASKs) |
| Business Management (Bus-DEA) | Network Management (Net-DEA) | Social Media Network Management (SM-DEA) | Total (Overall Model) | ||||||
|---|---|---|---|---|---|---|---|---|---|
| Step 1 | Step 2 | Step 3 | Step 4 | Step 5 | Step 6 | Step 7 | Step 8 | Step 9 | |
| (Basic) | (Airline Basic) | (Degree Net) | (Eigenc. Net) | (Total Net) | (FB) | (Twitter) | (YouTube) | (Overall) | |
| Inputs | |||||||||
| Number of employees | √ | √ | √ | √ | √ | √ | √ | √ | √ |
| Total assets | √ | √ | √ | √ | √ | √ | √ | √ | √ |
| Destinations | √ | √ | √ | √ | √ | √ | √ | √ | |
| Degree | √ | √ | |||||||
| Eigencentrality | √ | √ | √ | ||||||
| Tweets/day | √ | ||||||||
| Publication/day | √ | √ | |||||||
| Number of videos | √ | ||||||||
| Outputs | |||||||||
| Sales | √ | √ | √ | √ | √ | √ | √ | √ | √ |
| Millions of passengers 2014 | √ | √ | √ | √ | √ | √ | √ | √ | |
| Likes Twitter | √ | ||||||||
| Likes Facebook | √ | √ | |||||||
| Views | √ | ||||||||
| Business Management | ||||
| Average | Total | Std. Devn. | Range | |
| Number Employees | 11,825.95 | 508,516.00 | 25,382.25 | 117,889.00 |
| Total assets | 13,702,935.81 | 589,226,239.77 | 44,264,015.18 | 208,781,412.00 |
| Sales | 114,455.45 | 4,921,584.31 | 296,460.59 | 1,388,115.46 |
| Destinations | 101.49 | 4364.00 | 74.15 | 299.00 |
| Millons passengers’ 14 | 21.19 | 911.06 | 27.55 | 104.80 |
| Network Management | ||||
| Average | Total | Std. Devn. | Range | |
| Degree | 964.86 | 41,489.00 | 509.18 | 2075.00 |
| Eigencentrality | 0.17 | 7.19 | 0.23 | 1.00 |
| Online Social Network Management | ||||
| Average | Total | Std. Devn. | Range | |
| Likes | 1176.12 | 50.573.30 | 1719.78 | 7302.00 |
| Tweets/Days | 35.32 | 1518.95 | 59.08 | 248.71 |
| Average | Total | Std. Devn. | Range | |
| Likes | 22,385.59 | 962,580.30 | 41,101.47 | 226,596.00 |
| Publication/days | 1.68 | 72.13 | 2.37 | 14.86 |
| YouTube | Average | Total | Std. Devn. | Range |
| Number of Videos | 162.68 | 6995.30 | 336.93 | 2149.00 |
| Views | 18,914,748.87 | 813,334,201.30 | 80.961,888.12 | 527,191,826.00 |
| CCR | BBC | Scale | ||||
|---|---|---|---|---|---|---|
| Step 1 | Step 2 | Step 1 | Step 2 | Step 1 | Step 2 | |
| Number efficient DMUs | 4 | 14 | 9 | 22 | 4 | 14 |
| % efficient DMUs | 9.30 | 32.55 | 20.93 | 51.16 | 9.30 | 32.55 |
| Average efficiency | 0.4973 | 0.7413 | 0.6477 | 0.7893 | 0.7679 | 0.9345 |
| Standard deviation | 0.2674 | 0.2636 | 0.3043 | 0.2475 | 0.2657 | 0.1108 |
| Maximum | 1 | 1 | 1 | 1 | 1 | 1 |
| Minimum | 0.0004 | 0.2930 | 0.0072 | 0.3008 | 0.04 | 0.4482 |
| Estimate | Network Model | ||
|---|---|---|---|
| Step 3 | Step 4 | Step 5 | |
| (Degree Net) | (Eigencent. Net) | (Total Net) | |
| Number efficient DMUs | 22 | 24 | 24 |
| % efficient DMUs | 51.16 | 55.81 | 55.81 |
| Original average efficiency score | 0.7918 | 0.8261 | 0.8324 |
| Average bias-corrected efficiency score | 0.7712 | 0.8081 | 0.8141 |
| Bias | 0.0206 | 0.0180 | 0.0184 |
| Standard deviation | 0.0103 | 0.0090 | 0.0092 |
| Average efficiency score of inefficient DMUs corrected | 0.5315 | 0.5657 | 0.5792 |
| Bootstrap median | 0.7779 | 0.8148 | 0.8204 |
| Lower bound | 0.7172 | 0.7589 | 0.7663 |
| Upper bound | 0.7927 | 0.8267 | 0.8331 |
| Estimate | Social Media Network Management | ||
|---|---|---|---|
| Step 6 | Step 7 | Step 8 | |
| (Facebook) | (Twitter) | (YouTube) | |
| Number efficient DMUs | 27 | 33 | 24 |
| % efficient DMUs | 62.79 | 76.74 | 55.81 |
| Original average efficiency score | 0.8738 | 0.8983 | 0.8474 |
| Average bias-corrected efficiency score | 0.8645 | 0.8950 | 0.8328 |
| Bias | 0.0093 | 0.0034 | 0.0145 |
| Standard deviation | 0.0046 | 0.0017 | 0.0073 |
| Average efficiency score of inefficient DMUs corrected | 0.6359 | 0.5484 | 0.6217 |
| Bootstrap median | 0.8690 | 0.8959 | 0.8382 |
| Lower bound | 0.8279 | 0.8849 | 0.7852 |
| Upper bound | 0.8740 | 0.8985 | 0.8478 |
| Estimate | Incremental Model | |||
|---|---|---|---|---|
| Business Step 2 | Network Step 4 | Social Media Step 6 | Overall Step 9 | |
| Number efficient DMUs | 22 | 24 | 27 | 30 |
| % efficient DMUs | 51.16 | 55.81 | 62.79 | 69.77 |
| Original average efficiency score | 0.7893 | 0.8261 | 0.8738 | 0.9017 |
| Average bias-corrected efficiency score | 0.7714 | 0.8081 | 0.8645 | 0.8949 |
| Bias | 0.0179 | 0.0200 | 0.0093 | 0.0068 |
| Standard deviation | 0.0090 | 0.0090 | 0.0046 | 0.0034 |
| Average efficiency score of inefficient DMUs corrected | 0.5318 | 0.5657 | 0.6359 | 0.6523 |
| Bootstrap median | 0.7771 | 0.8148 | 0.8690 | 0.8978 |
| Lower bound | 0.7200 | 0.7589 | 0.8279 | 0.8685 |
| Upper bound | 0.7900 | 0.8267 | 0.8740 | 0.9019 |
| Rank | Airline | Centrality | Rank | Airline | Centrality |
|---|---|---|---|---|---|
| 1 | Air Europa | 1.000 | 23 | Jet2.com | 0.024 |
| 2 | Scandinavian Airlines System | 0.811 | 24 | Ryanair | 0.024 |
| 3 | Air Berlin | 0.770 | 25 | Aer Lingus | 0.023 |
| 4 | Monarch Airlines | 0.690 | 26 | Alitalia | 0.016 |
| 5 | Norwegian Air Shuttle | 0.588 | 27 | British Airways | 0.016 |
| 6 | Sunexpress | 0.433 | 28 | Icelandair | 0.016 |
| 7 | Adria Airways | 0.382 | 29 | Finnair | 0.008 |
| 8 | Ukraine International Airlines | 0.362 | 30 | Aeroflot Russian Airlines | 0 |
| 9 | Volotea | 0.279 | 31 | Air Baltic | 0 |
| 10 | easyJet | 0.215 | 32 | Belavia Belarusian Airlines | 0 |
| 11 | Aegean Airlines | 0.192 | 33 | Czech Airlines | 0 |
| 12 | Lufthansa | 0.182 | 34 | Flybe | 0 |
| 13 | Wizz Air | 0.169 | 35 | Iberia Airlines | 0 |
| 14 | Vueling Airlines | 0.125 | 36 | KLM Royal Dutch Airlines | 0 |
| 15 | Croatia Airlines | 0.100 | 37 | LOT Polish Airlines | 0 |
| 16 | Virgin Atlantic Airways | 0.085 | 38 | Luxair | 0 |
| 17 | Brussels Airlines | 0.076 | 39 | Meridiana | 0 |
| 18 | Bulgaria Air | 0.054 | 40 | TAP Portugal | 0 |
| 19 | Air France | 0.046 | 41 | TAROM | 0 |
| 20 | S7 Airlines | 0.040 | 42 | Travel Service | 0 |
| 21 | Air Malta | 0.032 | 43 | Turkish Airlines | 0 |
| 22 | Air Serbia | 0.032 |
© 2019 by the authors. Licensee MDPI, Basel, Switzerland. This article is an open access article distributed under the terms and conditions of the Creative Commons Attribution (CC BY) license (http://creativecommons.org/licenses/by/4.0/).
Share and Cite
Hermoso, R.; Latorre, M.P.; Martinez-Nuñez, M. Multivariate Data Envelopment Analysis to Measure Airline Efficiency in European Airspace: A Network-Based Approach. Appl. Sci. 2019, 9, 5312. https://doi.org/10.3390/app9245312
Hermoso R, Latorre MP, Martinez-Nuñez M. Multivariate Data Envelopment Analysis to Measure Airline Efficiency in European Airspace: A Network-Based Approach. Applied Sciences. 2019; 9(24):5312. https://doi.org/10.3390/app9245312
Chicago/Turabian StyleHermoso, Ramon, M. Pilar Latorre, and Margarita Martinez-Nuñez. 2019. "Multivariate Data Envelopment Analysis to Measure Airline Efficiency in European Airspace: A Network-Based Approach" Applied Sciences 9, no. 24: 5312. https://doi.org/10.3390/app9245312
APA StyleHermoso, R., Latorre, M. P., & Martinez-Nuñez, M. (2019). Multivariate Data Envelopment Analysis to Measure Airline Efficiency in European Airspace: A Network-Based Approach. Applied Sciences, 9(24), 5312. https://doi.org/10.3390/app9245312