Abstract
In this study, the processes taking place on the surfaces of nanostructured Cu/CuO and Cu/CuO/Pd electrodes at different potential, E, values in the solutions of 0.1 M KOH in HO and DO (heavy water) were probed by surface enhanced Raman spectroscopy (SERS), and the analysis of electrochemical reactions occurring under experimental conditions is presented. The bands of the SERS spectra of the Cu/CuO/Pd electrode observed in the range of E values from +0.3 V to 0 V (standard hydrogen electrode (SHE)) at 1328–1569 cm are consistent with the existence of species that are adsorbed or weakly bound to the surface with the energy of interaction close to 15–21 kJ mol. These bands can be attributed to the ad(ab)sorbed (HO), (H), and (H) ions as intermediates in reversible hydrogen evolution and oxidation reactions (HER/HOR) taking place on the Cu/CuO/Pd electrode. There was no isotopic effect observed; this is consistent with the dipole nature of the electron-ion pair formation of adsorbed (HO) and (H) or (DO) and (D). In accordance with the literature data, SERS bands at 125–146 cm and ∼520–565 cm were assigned to Cu(I) and Cu(II) oxygen species. These findings corroborate the quantitative stepwise mechanism of water reduction.
1. Introduction: Thermodynamics of Hydrogen Evolution Reaction
The mechanisms of electrochemical hydrogen evolution and oxidation reactions (HER and HOR) are becoming a topic of interest again as hydrogen is expected to become the environmentally friendly fuel of the future.
In the recent literature [1,2,3,4,5,6,7,8,9], the interpretations of the mechanism of these processes taking place on the surface of various platinum group electrodes are based on the concept of adsorbed hydrogen atoms as the intermediate. In [1], it was suggested that in the range of low potential values, adsorbed atoms are formed through a dissociative adsorption of rather than the discharge of ions.
It is defined by thermodynamics [10] that under the standard conditions, the processes of HER and HOR are described by the equation:
with the value of standard potential = 0 V vs. the standard hydrogen electrode (SHE). However, it is also well known that the Volmer reaction:
thermodynamically cannot proceed at V (SHE), because the standard potential of Equation (2) is = −2.106 V [10]. As the hydrogen evolution reaction on the Pt surface actually takes place at V (SHE), it is assumed that the binding energy of H atoms in the molecule is compensated by the energy of adsorption of H atoms leading to the formation of on the electrode surface as intermediates of Reaction (1). The energy of interaction between Pt electrode and , , is considered to be about 260 kJ mol [8], i.e., slightly higher than kJ mol [11]; D is the bond energy in H. In accordance with the commonly accepted concept [1,7] formulated about 50 years ago [12,13,14], when the first H atom is adsorbed on the electrode surface in the form of , fully compensating half of the binding energy in the H molecule, the electrochemical discharge of the second H ion and formation of at the equilibrium potential of 0 V (SHE) proceed without any hindrance. In other words, irreversible formation of the molecule according to the summary Equation (1) is possible with the formation of the first adsorbed atom, i.e.,
followed by recombination according to the Heyrovsky or Tafel paths as follows:
If the treated in various HER models exists, thermodynamics requires acknowledging that in the case of Pt, for instance, the energy of interaction between and the electrode surface should be equivalent to the energy of chemical bond, which can amount up to 260 kJ mol [8]. The latter value, however, is obviously incomparable with those corresponding to the energy of adsorption. Moreover, it is well established [10] that the hydrogen atom does not form any stable hydride-type compounds with many metals, including the Pt group ones. It can also be noted that current peaks observed in cyclic voltammograms (CVs) of the Pt electrode at E > cannot be ascribed to the formation of the monolayer of atoms weakly and strongly bonded to the electrode surface, because, from the thermodynamic point of view, in the E range above 0 V (SHE), only oxidation of the H molecule can take place rather than the underpotential discharge of H to . In theory, the region of underpotential discharge of H is confined to the range of potentials between −2.1 V and 0 V.
In our previous study [15] based on quantitative coulometric and micro-gravimetric analysis, it was demonstrated that in the case of the Pt electrode in the solution of 0.5 M HSO, the reversible electrochemical discharge of HO molecules proceeds according to the following reactions (Figure 1):
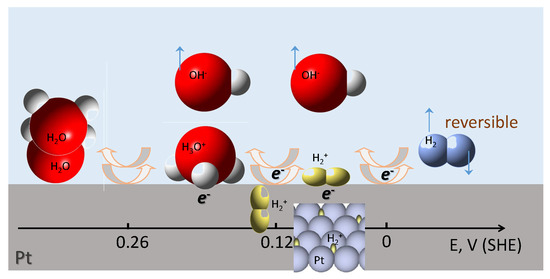
Figure 1.
Mechanism of the reversible stepwise water reduction/hydrogen oxidation via the formation of ionic pairs at different potentials on the Pt electrode [15]. This mechanism accounts quantitatively for the charge and mass changes on the electrode’s surface. SHE, standard hydrogen electrode.
represents the adsorption charge, which is drawn to the electrode surface to compensate the charge of adsorbed or ions. This charge is approximately equivalent to one electron per one or ion, and it does not participate in the overall faradaic HER, as this term cancels upon summing of Equations (6)–(8).
At V (SHE), steps (6) and (7) become fast, and the overall process, which in the case of aqueous solutions, is written as:
corresponds to the general HER/HOR Equation (1). Equation (6) represents the process of HO dissociation and adsorption of the HO ion on the electrode surface and is reflected by the first reversible Langmuir-type adsorption peak in voltammograms of the Pt electrode in sulphuric acid solution [15]. Reaction (7) is the reduction of (HO) leading to the formation of the adsorbed () ion and corresponds to the second reversible Langmuir-type adsorption peak, whereas Equation (8) represents the actual hydrogen evolution step on the Pt electrode, which determines the value of equilibrium potential = 0 V (SHE) and the magnitude of exchange current i. As one can see from Equations (6)–(9), the role of the intermediate in the reversible H evolution process is played by the adsorbed hydrogen molecular ion (H. The existence of such an ion has been corroborated in [16], as well as by a very high energy cost required for H emission [17]. The binding energy between the H ion and H atom within H is 255.7 kJ mol [18], which is tantamount to the energy of adsorption indicated for the atom and is sufficient for Reaction (7), which, in fact, is the reduction of the first H ion, to proceed. Thus, there is no need to invoke H atoms to explain the mechanism of reversible discharge of HO ions. The energy of adsorption in the case of the (H intermediate is just 11.6 kJ mol, as can be derived from the value of the standard potential of Equation (7) according to , whereas the of (HO) (Equation (6)) is 25.1 kJ mol [15]. Such adsorbed intermediates are characteristic of Pt group metals. The maximum coverage of the Pt electrode surface by either (HO) or (H) is just about 1/3 of the monolayer [15].
At V (SHE), the equilibrium surface concentration of (H should be proportional to the bulk concentration of HO and hydrogen pressure , because otherwise, the existence of a reversible hydrogen electrode with would not be possible [10].
In the case of HOR, the surface electrochemical processes described by Equations (6)–(8) proceed in the reverse manner. As the steric dimensions of the molecular hydrogen ion are very small [15,19], absorption of (H during HER becomes possible, and oxidation of the absorbed H species is reflected by a minor anodic peak located between the two main ones [15].
Thus, as is evident from the discussion above, the hydrogen molecular ion H unlocks the understanding of the mechanism of the reversible hydrogen evolution process. In this novel concept, (H replaces H as the intermediate in HER and HOR, and dissociative adsorption of H is replaced by the stepwise dissociative ionization of the hydrogen molecule according to Equations (7) and (8) and was shown to account for mass and charge changes on the Pt electrode [15] (Figure 1). Formally, the HO ion can be considered to contain one OH and two H ions, which can be reduced to the H molecule via intermediate H at E = 0 V (SHE) without violating the above described thermodynamic constraint and formation of H on the electrode surface. Validation of the cascading reduction mechanism (Figure 1) by complimentary techniques, including optical, is highly required in order to get insights into methods to control the efficiency of the overall HER process.
Surface enhanced Raman spectroscopy (SERS) is a sensitive method to elucidate the nature of intermediate compounds participating in the hydrogen evolution and oxidation processes discussed above. In the present study, SERS was applied to investigate the HER and HOR processes on a thin Pd layer sputtered on a nano-structured copper-oxide substrate. Pd was chosen due to its well known ability to absorb significant amounts of hydrogen [20]. Reversible HER and HOR reactions on the Pd surface are expected to follow the same route as on the Pt electrode within the E range from 0 V to 0.3 V (SHE); therefore, the formation of (HO and (H ions should be anticipated. The correlation of the E dependence of the SERS response with the electrochemical processes taking place on the electrode surface is presented and discussed in view of the possible mechanism.
2. Experimental Section
The nanotextured surface of CuO was prepared via the chemical oxidation method. As-prepared and Pd coated electrodes were then used for spectroelectrochemical investigations using surface enhanced Raman spectroscopy (SERS) within various ranges of potential (Figure 2).
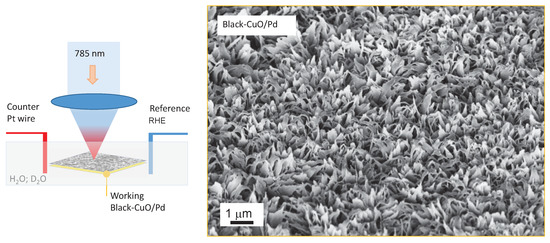
Figure 2.
Setup for SERS measurements (in back-scattering mode) in the electrochemical cell with the Pt wire as the counter electrode (CE), black-CuO or black-CuO/Pd as the working electrode (WE), and the reference electrode (RE) as the reference hydrogen electrode (RHE). SEM image of the WE black-CuO with a 200 nm Pd film.
2.1. Samples for Spectroelectrochemical Measurements
A flat circular copper electrode of ca. 5 mm in diameter, press-fitted into a Teflon rod, was oxidized chemically as described in our previous paper [21] to produce a SERS active nanostructured Cu(II) oxide layer, further in the text referred to as black-CuO because of its black appearance due to its anti-reflective surface texture. Using synchrotron X-ray surface analysis, we confirmed that only CuO was present on the surface of black-CuO [21] prepared by the method used in this study.
Plasma-enhanced chemical vapour deposition (PECVD) equipment (Axxis, JKLesker Ltd., Livermore, USA) was used to sputter an ∼200 nm thick layer of Pd onto the nanotextured surface of black-CuO electrodes. The electrode was placed closer to the sputtering target at the position where the coating rate was approximately 5 times larger than on the standard sample plane (an entire electrode in a tall Teflon mount was placed inside the coating chamber). The coating conditions corresponded to a 40 nm thick layer of Pd on a flat sample. The effective thickness of the coating was smaller than 200 nm due to an approximately 200 times larger surface area of the black-CuO as compared to the initial Cu substrate [22].
2.2. Electrochemical Measurements
Electrochemical investigations were performed using potentiostat/galvanostat AUTOLAB 302. A three-electrode cell was employed to record the voltammetric response of black-CuO, black-CuO/Pd samples, pure Pd, and pure Cu (99.9%) samples, which were used as working electrodes. The Pt plate (1 cm) and reference hydrogen electrode (RHE) in working solution served as the counter and reference electrodes, respectively. All potential values reported below refer to this reference electrode unless noted otherwise. Current density values in the text are normalized with respect to the geometric area of the electrode. The solution of 0.1 M KOH was chosen for experiments in order to ensure the chemical stability of the black-CuO substrate.
2.3. SERS Measurements
Near-infrared Raman spectra were recorded using the Echelle-type spectrometer RamanFlex 400 (PerkinElmer, Inc., Waltham, MA, USA) equipped with a thermoelectrically cooled (C) CCD camera and fibre optic cable for excitation and collection of the Raman spectra. The 785 nm beam of the diode laser was used as the excitation source; at this wavelength, the Cu SERS substrate is active and there is negligible fluorescence. The 180 scattering geometry was employed. The laser power at the sample was restricted to 30 mW for SERS studies, and the beam was focused to a 200m diameter spot on the electrode. The integration time was 10 s. Polarisation of the light incident normally onto the electrode was linear, while the polarization of the detected signal was not discriminated in polarisation.
Each spectrum was recorded by accumulation of 30 or 50 scans, yielding the total integration times of 300 and 500 s. Spectroelectrochemical measurements were carried out in a cylinder shaped three electrode moving cell, arranged with a nanotextured black-CuO or black-CuO/Pd as a working electrode (WE), a platinum wire as a counter electrode (CE), and an RHE reference electrode (RE). The potential of the working electrode was changed stepwise, starting from the open-circuit potential (0.7 V) and going towards more negative E values to 0 V and −0.5 V for the black-CuO/Pd and black-CuO, respectively. During the experiment, the solution was continuously bubbled by pure N gas flow to remove dissolved oxygen. The WE was placed at approximately a 3 mm distance from the cell window. In order to reduce photo and thermal effects, the cell together with the electrodes was moved linearly with respect to the laser beam with a rate of about 15–25 mm/s [23,24]. The Raman frequencies were calibrated using the polystyrene standard (ASTM E 1840) spectrum. Intensities were calibrated by the NIST intensity standard (SRM 2241). Experiments were also carried out in heavy water DO to distinguish ionic hydrogen species by a Raman shift, which is mass dependent; the DO related peaks appeared at smaller wavenumbers in Raman scattering [25].
3. Results and Discussion
3.1. Voltammetric Characterization
Figure 3a shows cyclic voltammograms of the black-CuO and black-CuO/Pd electrodes recorded in 0.1 M KOH solution within the E range between 0 and 1.0 V. The shape of both curves was essentially the same, and the nature of the processes reflected by the voltammetric peaks can be easier understood when compared with the responses of the pure metallic Pd and Cu electrodes presented in Figure 3b. The anodic part of the cycles () in Figure 3a display two peaks at 0.5–0.7 V and 0.75–1.0 V, the position of which corresponds to the thermodynamic potential ranges of CuO and CuO formation, respectively [10]. Such ascription of the peaks is supported by the fact that their positions coincide with those of anodic peaks observed in the voltammogram of the pure Cu electrode in Figure 3b. In the cathodic range of the CVs (), two peaks were observed as well (Figure 3a). The first minor one at V was situated in the range where reduction of CuO to CuO was thermodynamically possible; however, the amount of charge was very low. This peak could be ascribed to the reversible reduction of oxide species formed on the electrode surface in the preceding positive-going scan, whereas the main mass of nanostructured CuO, formed by means of chemical oxidation of the Cu surface, was most likely reduced to CuO in the range of the second cathodic peak within 0.4–0.15 V. The latter peak was shifted towards more negative E values as compared with the first cathodic peak corresponding to transition CuO/CuO in the case of the pure Cu electrode in Figure 3b. This means that reduction proceeded at an overpotential, which could be associated with the thickness of the oxide layer on the black-CuO electrode (it is noteworthy that current density values in Figure 3a are tenfold compared to those in Figure 3b). Reduction of CuO to metallic Cu on the black-CuO electrode proceeded at V (Figure 3a). In the case of the Cu electrode, the sharp peak of CuO reduction was between 0.2 V and 0 V (Figure 3b). The comparison of the CVs of the black-CuO and Cu electrodes within a wide range of potentials, i.e., −0.5 V–1.85 V, encompassing the whole E window between O and H evolution reactions, is shown in Figure 3c. One can see from the voltammogram of black-CuO in Figure 3c that complete reduction of CuO was achieved at potentials as negative as −0.3 V. The voltammetric response of Pd in alkaline medium shown in Figure 3b helped to identify the ranges of potential where one could expect to observe the influence of palladium in the CV of the black-CuO/Pd electrode. The increase in cathodic current at V on the Pd electrode corresponded to HER, whereas the anodic peak within 0.3–0.5 V was related to H oxidation and desorption processes. One can observe higher cathodic and anodic currents in the E ranges described above on black-CuO/Pd electrode as compared to the Pd-free black-CuO sample (see Figure 3a); however, the assignment of these differences to the influence of Pd was ambiguous. Most likely, the effect of Pd on black-CuO could not be discerned in cyclic voltammograms, because the Pd layer deposited by magnetron sputtering was very thin compared to the nanostructured CuO formed by the chemical oxidation of the Cu substrate. The influence of Pd on the SERS response of black-CuO samples was significantly more obvious as described further.
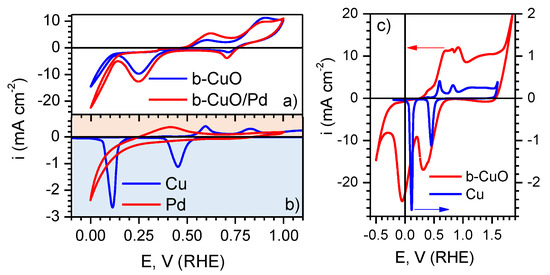
Figure 3.
Cyclic voltammograms of: (a) black-CuO and black-CuO/Pd; (b) metallic Cu and Pd electrodes in 0.1 M KOH solution, potential scan rate 50 mV s. The positive E limit of the CV of metallic Cu in (b) is at 1.6 V, just prior to the beginning of the oxygen evolution reaction; the full range is not shown here for the sake of easier comparison with the curves in (a). (c) CVs within the E range −0.5–1.85 V (RHE).
3.2. Spectroelectrochemical Measurements
Spectra of black-CuO/Pd and black-CuO electrodes recorded in 0.1 M KOH solution in normal and heavy water at fixed E values are shown in Figure 4 and Figure 5, respectively. From the viewpoint of HER, the main difference between Pd and Cu electrodes was that on the palladium surface, this process was reversible and took place at V (RHE), while in the case of copper, the hydrogen evolution reaction was irreversible and proceeded at an overvoltage of about 0.5 V [12]; therefore, a more negative E range was chosen for the investigations. It is evident from the comparison of Figure 4 and Figure 5 that the intensity of spectra in the case of the Pd coated black-CuO electrode was about 10 times less. This, most likely, should be attributed to blocking of the black-CuO surface by Pd, rather than a decrease in electrode surface area, because the evaporated ∼200 nm thick Pd layer could not significantly reduce the true surface area of the electrode, as we found in earlier SERS studies [21].
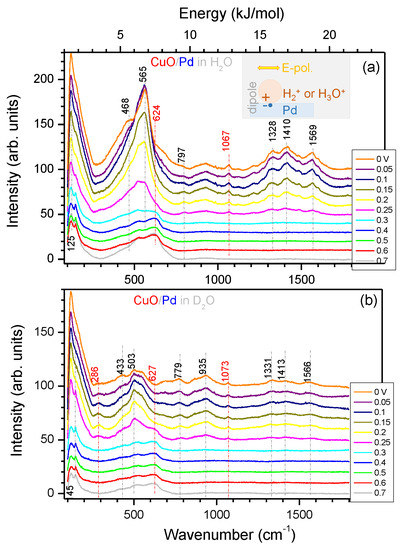
Figure 4.
Dependence of the SERS spectra from the black-CuO/Pd electrode upon the potential in 0.1 M KOH solution in water HO (a) and heavy water DO (b). Measurement conditions: laser excitation 785 nm; laser power at the sample 30 mW; integration time 300 s. The experiment was carried out under N flow. The same electrode was used in both experiments. The spectral positions of the characteristic peaks are shown on vertical markers; red colour markers denote CuO related bands. The main peak at 565 cm in (a) corresponds to 70.1 meV energy or 6.76 kJ mol (see the upper horizontal axis). The inset in (a) shows electric dipole formation (a charge pair) at the interface in the applied E-field of light. The polarisibility of such a dipole is small, and the reduced mass is determined by the electron mass; the same Raman lines were observed in H2O and D2O. Line markers are shown as eye-guides; the ∼1070 cm band was observed also on Pt and could be related to (HO) [26,27,28,29].
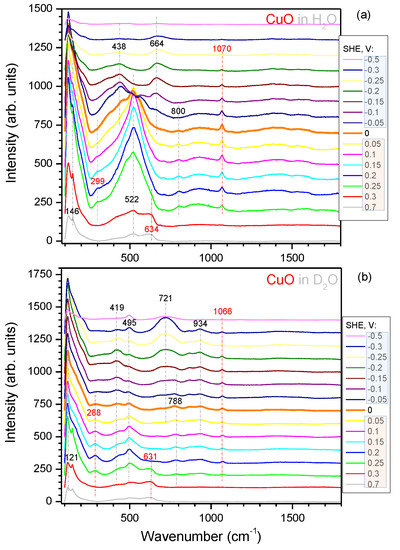
Figure 5.
Dependence of the SERS spectra from the black-CuO electrode upon the potential in 0.1 M KOH solution in water HO (a) and heavy water DO (b). Measurement conditions: laser excitation 785 nm; laser power at the sample 30 mW; integration time 300 s. The experiment was carried out under N flow. The spectral positions of the characteristic peaks are shown with vertical markers; red colour markers denote CuO related bands.
All spectra in Figure 4 and Figure 5 can be conditionally divided into several regions. With respect to wavenumbers, one can make a distinction between the range at 100–800 cm, where the most intensive bands were observed, and the other one at 800–1800 cm with less intensive spectral features. From the viewpoint of electrode potential values, there was a clear distinction between the spectra recorded within 0.7–0.3 V, i.e., in the oxide region, and those obtained at V, i.e., in the region of oxide reduction and hydrogen evolution reactions. The most prominent bands, which appeared in all the spectra at 100–300 cm and 400 and 600 cm at the potentials just below 0.3 V and intensified as the electrode potential turned more negative, should be assigned to cuprous oxide CuO, which was produced by means of the electrochemical reduction of CuO, as reflected by the cathodic reduction peak within 0.15–0.4 V (Figure 3a). At more negative potentials, the reduction of CuO to Cu proceeded, and this was the reason why the intensity of the bands indicated decreased significantly (see the spectra at V in Figure 5a). The assignments of the CuO and CuO bands of the nanotextured surface was done following the earlier study of electrodes prepared by the same method [30], as well as literature data [31,32,33,34,35,36] and are summarized in Table A1; see Appendix A. The reason why the bands attributable to CuO were less prominent in the spectra recorded in the solution of 0.1 M KOH in heavy water was, most likely, related to the fact that these spectra were collected after the experiments in normal water, during which the majority of the CuO phase on the black-CuO substrate was reduced.
The presence of the Pd layer on the black-CuO surface gave rise to the occurrence of distinct bands at 1328, 1410, and 1569 cm observed in SERS spectra measured in the E range between 0.3 V and 0 V (RHE) (Figure 4). These bands correspond to the energy of adsorptive interaction between the particle and electrode surface (see the inset in Figure 4a); in the case of reversible HER, they could be assigned to the adsorption of ionic intermediates (H), (H) (HO) on the Pd surface with an energy of 15–21 kJ mol. Such energy corresponds to the Langmuir-type adsorption process. Moreover, the above indicated values correspond to the energy of H and HO adsorption on the Pt electrode, i.e., 12–26 kJ mol as determined from electrochemical data [15]. The dipole nature (Raman inactive) of an ion-electron pair separated through the interface Pd–electrolyte was expected to have a weak Raman signature. Hence, the use of a nano-rough electrode was essential for detection of inelastic light scattering via SERS. The exact band assignment requires ab initio density functional theory (DFT) calculations [20], which are currently not available. The smaller mass of H ion should have the larger energy (wavenumber) signature as compared with the “electron-HO” ion pair (see the discussion of the isotopic effect below).
It is interesting to note that in the studies [26,27,28,29], devoted to IR spectroscopic investigations of HER/HOR processes on the Pt electrode in 0.5 M HSO, it was presumed that adsorption of (HO) was reflected by the band at 1100 cm, whereas the band within 2080–2095 cm was assigned to the discharging particle, which was H, the overpotential deposited H atom. In terms of the energy of interaction between the particle and the surface, this would correspond to 14–26 kJ mol. Recently, a lack of understanding of HER at the molecular level and the role of the interface had been articulated as the next focus area in HER research [37].
Direct comparison of the Raman spectra of the CuO electrode with and without Pd are replotted in Appendix A, Figure A2 and Figure A3 for HO and DO, respectively, at the potential range of 0.3–0 V preceding to HER. A Pd deposition resulted in the suppression of the most prominent Raman bands related to CuO; however, there was almost no effect at the spectral window of 1700–1300 cm. Especially for the HER at 0 V in HO, there was almost no decrease in Raman intensity.
3.3. Isotopic Effect in SERS
Comparison of spectra collected in the solutions of normal and heavy water (Figure 4a vs. Figure 4b and Figure 5a vs. Figure 5b) did not reveal a clear isotopic effect in vibrational spectra of ions or molecules. In the case of bands attributed to Cu(I) and Cu(II) oxides, such a result was logical as their origin was not dependent on the solvent. This was also the case for weak ionic adsorption of (H, (D, (HO, and (DO on the Pt or Pd electrode surface: replacing water with heavy water did not effect the charge of the adsorbing particle and, consequently, the energy of its interaction with the surface, as elaborated further.
In theory, the difference in vibrational bands between H2O and D2O is defined by a change in the reduced mass of the atoms involved , where denotes the mass of the H or D atoms. The expected shift of the vibrational frequency due to H substitution by D can be estimated from ; one finds . Hence, the bands related to DO will be at smaller wavenumbers as compared to those in HO, correspondingly at of the energy (wavenumber). Such a significant isotopic effect was expected for the interatomic bond in H or D molecules and the OH band at 3000–3600 cm. A certain isotopic effect could be expected if evolution of D went through the formation of a stable chemisorbed compound between D and the electrode surface, whereas for the weakly adsorbed surface species, the energy of adsorption of charged (H) and (D) particles in the potential range investigated was, most likely, almost the same, due to the electrostatic nature of the interaction (a spring constant k of a harmonic oscillator was the same considering mechanical analogy). Due to the same charges and similar size of the adsorbing particles, the isotopic effect was not pronounced.
From the viewpoint of energetic considerations, SERS spectra reflected the energy of interaction between a particle and electrode surface defined by potential constant k and the reduced mass . The oscillator frequency for small k and (in the electron-ion pair, the electron mass dominated ), a small change in vibration energy quanta was expected between H and D as observed in the experiment. Since dipole absorption was not Raman active (a negligible polarisability), it was expected that the formation of electron-ion pairs with strong dipole interaction at the interface investigated here had a weak Raman signature, and the use of SERS was essential. The isotopic effect between H and D due to the difference in the reduced mass of the () ion pair was very small. Indeed, the electron mass in atomic units was ; the H mass was 2.1, and the mass on the neutron . The smallest mass defined and frequency . Reduced mass was only different by 0.014% for H vs. D and even less for the HO. There was no isotopic effect observed in SERS (Figure 4) according to the expectations discussed above. The appearance of Raman bands at the 15–21 kJ/mol or 1320–1570 cm wavenumber window leading to hydrogen evolution was consistent with the stepwise reduction mechanism (Figure 1). Microscopic understanding of the hydrogen behaviour at interfaces was essential for the creation of metamaterials with a fast reaction time and detection of hydrogen [38].
4. Conclusions
The reactions taking place on the surfaces of nanostructured Cu/CuO and Cu/CuO/Pd electrodes at different potential, E, values in the solutions of 0.1 M KOH in normal and heavy water were studied using the surface enhanced Raman spectroscopy technique. The following conclusions can be drawn:
- A clear correlation between the SERS spectra and potential governed surface state of the CuO/Pd electrodes was determined. However, due to the dipole nature of the electron-ion pair, the Raman signatures were expected to be weak.
- The SERS spectra measured at the controlled electrode potential of the black-CuO/Pd electrode were consistent with the existence of weakly adsorbed (HO and (H) ions as intermediate in the reversible HER/HOR processes in the region of E potentials from +0.3 V to 0 V (SHE). Raman signatures at the wavenumber region from 1320 to 1570 cm were caused by inelastic light scattering from weakly bound ionic pairs, which have interaction energy of 15–21 kJ mol. These adsorption compounds cannot be treated as Pd hydrides (see Appendix A for different HER scenarios).
- In accordance with the electrochemical redox behaviour, SERS bands observed at wavenumbers 125–146 cm and 520–565 cm in 0.1 M KOH solution in the range of the potentials between 0.7 and −0.5 V (RHE) corresponded to Cu(I) and Cu(II) oxygen species.
Author Contributions
Conceptualization, J.J. and K.J.; methodology, G.N. and I.M.; SERS experiments, G.N. and I.M.; electrochemical experiments, B.Š. and I.S.; preparation of electrodes, A.B.; writing, original draft, J.J.; visualization, S.J.; discussion and data analysis J.J., K.J., Y.N., G.N., and S.J.; all authors contributed to the final editing of the manuscript.
Funding
This research was partially funded by ARC Grant Number DP190103284.
Conflicts of Interest
The authors declare no conflict of interest.
Appendix A
Comparison of the SERS spectra of Pd coated and uncoated black-CuO electrodes in HO (Figure A2) and DO (Figure A3), respectively. The sputtered film of Pd reduced the major CuO related bands; however, at the 0 V where HER was taking place, there was only a small change observed (Figure A2). It is noteworthy that the absorbance of heavy water was by an order of magnitude smaller at the Vis-IR spectral range used for excitation of Raman scattering. This is related to the smaller Raman intensity in the case of heavy water experiments.
Different Hydrogen Evolution Scenarios
In addition to the above presented mechanism of HO discharge, there are many other mechanisms of hydrogen evolution reaction, which depend on the specific conditions under which the reaction occurs. Various possible scenarios of HER are summarized in Figure A1. When the HO ion present in the solution bulk is reduced on the electrode surface at , the irreversible scenario occurs, which should also proceed via the stage of H, but without the formation of the adsorption layer. The beginning of the irreversible process is also at 0 V (SHE).

Figure A1.
Scenarios of hydrogen evolution reaction (HER) on different materials.
When surface hydrides can form, direct reduction of HO molecules may occur (see the hydride route in Figure A1). The addition of a second H atom to form the H molecule is facile. It proceeds according to the Heyrovsky or Tafel path [10] at overpotential, , the magnitude of which is determined by the energy of the chemisorption of hydride species H. It is noteworthy that the concept of H is not equivalent to that of H, because the former is understood as adsorption of the H atom on the electrode surface with the energy of 260 kJ mol, whereas in H, the hydrogen atom can be chemisorbed on the surface with considerably smaller energy in the E range from 0 V to −2.1 V (SHE). In this case, the energy of discharge of the first H ion is compensated by the energy of MeH formation and the overvoltage, , i.e., + e≈ kJ mol.
In the last case, referred to as the oxide route in Figure A1, when the electrode surface is covered with the oxide of intermediate valence, low values of (e.g., on rhenium) are observed when the O ion is subtracted from the HO molecule and H is formed from two remaining H ions with the simultaneous transition of the oxide back to its former stable state. As is obvious from the above discussion, there are different scenarios of HER, and they should be analysed specifically, taking into consideration possible intermediates forming on the electrode surface, and the H intermediate is neither realistic, nor universal.

Figure A2.
SERS spectra in water. Comparison of the CuO electrode with and without Pd coating. Note the logarithmic scale of the wavenumber axis. The shaded region marks the spectral range where the decrease of the Raman bands due to Pd was minimal. Note the logarithmic scale of the wavenumber axis.

Figure A3.
SERS spectra in heavy water. Comparison of the CuO electrode with and without Pd coating. Note the logarithmic scale of the wavenumber axis.

Table A1.
Band assignments.
Table A1.
Band assignments.
| Wavenumber (cm) | ||
|---|---|---|
| Black-CuO | Black-CuO/Pd | Assignment |
| HO/DO | HO/DO | |
| –/121 | 125/– | CuO; this work |
| 146/– | –/145 | CuO [31,32,36] |
| 299/288 | –/ 286 | CuO A [34,35,36] |
| 438/419 | Cu-OH (426 cm [31,32]) | |
| 468/433 | Cu-OH shifted [31,32] | |
| 522/495 | –/ 503 | CuO, Cu-OH [31,32,36] |
| 560/– | 565/– | CuO [31,32] |
| 624/627 | CuO [31,32] | |
| 634/631 | CuO | |
| 623 [31], 640 [33], 645 cm [36] | ||
| 664/– | this work; Cu-OH shifted * [39] | |
| –/721 | this work | |
* Shift is surface potential/bias dependent.
References
- Mercer, M.P.; Hoster, H.E. Electrochemical Kinetics: A Surface Sciene-Supported Picture of Hydrogen Electrochemistry on Ru(0001) and Pt/Ru(0001). Electrocatalysis 2017, 8, 518–529. [Google Scholar] [CrossRef]
- Fang, Y.H.; Wei, G.F.; Liu, Z.P. Catalytic Role of Minority Species and Minority Sites for Electrochemical Hydrogen Evolution on Metals: Surface Charging, Coverage, and Tafel Kinetics. J. Phys. Chem. C 2013, 117, 7669–7680. [Google Scholar] [CrossRef]
- Shinagawa, T.; Garcia-Esparza, A.; Takanabe, K. Insight on Tafel slopes from a microkinetic analysis of aqueous electrocatalysis for energy conversion. Sci. Rep. 2015, 5, 13801. [Google Scholar] [CrossRef] [PubMed]
- Li, J.; Ghoshal, S.; Bates, M.K.; Miller, T.E.; Davies, V.; Stavitski, E.; Attenkofer, K.; Mukerjee, S.; Ma, Z.F.; Jia, Q. Experimental Proof of the Bifunctional Mechanism for the Hydrogen Oxidation in Alkaline Media. Angew. Chem. Int. Ed. 2017, 56, 15594–15598. [Google Scholar] [CrossRef]
- He, Z.D.; Wei, J.; Chen, Y.X.; Santos, E.; Schmickler, W. Hydrogen evolution at Pt(111)—Activation energy, frequency factor and hydrogen repulsion. Electrochim. Acta 2017, 255, 391–395. [Google Scholar] [CrossRef]
- Angerstein-Kozlowska, H. Comprehensive Treaties of Electrochemistry; Plenum Press: New York, NY, USA, 1984; Volume 9. [Google Scholar]
- Conway, B.E.; Tilak, B.V. Interfacial processes involving electrocatalytic evolution and oxidation of H2, and the role of chemisorbed H. Electrochim. Acta 2002, 47, 3571–3594. [Google Scholar] [CrossRef]
- Jerkiewicz, G. Hydrogen sorption AT/IN electrodes. Prog. Surf. Sci. 1998, 57, 137–186. [Google Scholar] [CrossRef]
- Lasia, A. On the mechanism of the hydrogen absorption reaction. J. Electroanal. Chem. 2006, 593, 159–166. [Google Scholar] [CrossRef]
- Pourbaix, M. Atlas D’Équilibres Électrochimiques; Gauthier-Villars: Paris, France, 1963. [Google Scholar]
- Emsley, J. The Elements, 2nd ed.; Clarendon Press: Oxford, UK, 1991. [Google Scholar]
- Vetter, K.J. Elektrochemische Kinetik; Springer: Berlin-Gottingen, Germany, 1961. [Google Scholar]
- Will, F.G.; Knorr, C.A. Untersuchung von Adsorptionserscheinungen an Rhodium, Iridium, Palladium und Gold mit der potentiostatischen Dreieckmethode. Z. Electrochem. 1960, 64, 270–275. [Google Scholar]
- Biegler, T.; Rand, D.A.J.; Woods, R. Limiting oxygen coverage on platinized platinum; Relevance to determination of real platinum area by hydrogen adsorption. J. Electroanal. Chem. 1971, 29, 269–277. [Google Scholar] [CrossRef]
- Juodkazis, K.; Juodkazytė, J.; Šebeka, B.; Juodkazis, S. Reversible hydrogen evolution and oxidation on Pt electrode mediated by molecular ion. Appl. Surf. Sci. 2014, 290, 13–17. [Google Scholar] [CrossRef]
- Rajgara, F.A.; Dharmadhikari, A.K.; Mathur, D.; Safvan, C.P. Strong fields induce ultrafast rearrangement of H atoms in H2O. J. Chem. Phys. 2009, 130, 231104. [Google Scholar] [CrossRef] [PubMed]
- Xie, X.; Roither, S.; Larimian, S.; Erattupuzha, S.; Zhang, L.; He, F.; Baltuška, A. Zero-energy proton dissociation of H through stimulated Raman scattering. arXiv 2019, arXiv:1901.10743. [Google Scholar] [CrossRef]
- Rabinovich, V.A.; Khavin, Z.Y. Kratkiy Khimicheskiy Spravochnik; Khimiya: Leningrad, Russia, 1977. [Google Scholar]
- Juodkazis, K.; Juodkazytė, J.; Grigucevičienė, A.; Juodkazis, S. Hydrogen species within the metals: Role of molecular hydrogen ion . Appl. Surf. Sci. 2011, 258, 743–747. [Google Scholar] [CrossRef]
- Nishijima, Y.; Shimizu, S.; Kurihara, K.; Hashimoto, Y.; Takahashi, H.; Balcytis, A.; Seniutinas, G.; Okazaki, S.; Juodkazyte, J.; Iwasa, T.; et al. Optical readout of hydrogen storage in films of Au and Pd. Opt. Express 2017, 25, 24081–24092. [Google Scholar] [CrossRef]
- Balčytis, A.; Ryu, M.; Seniutinas, G.; Juodkazytė, J.; Cowie, B.C.C.; Stoddart, P.R.; Morikawa, J.; Juodkazis, S. Black-CuO: Surface-enhanced Raman scattering and infrared properties. Nanoscale 2015, 7, 18299–18304. [Google Scholar] [CrossRef]
- Juodkazytė, J.; Šebeka, B.; Savickaja, I.; Selskis, A.; Jasulaitienė, V.; Kalinauskas, P. Evaluation of electrochemically active surface area of photosensitive copper oxide nanostructures with extremely high surface roughness. Electrochim. Acta 2013, 98, 109–115. [Google Scholar] [CrossRef]
- Niaura, G.; Gaigalas, A.K.; Vilker, L.V. Moving spectroelectrochemical cell for surface Raman spectroscopy. J. Raman Spectrosc. 1997, 28, 1009–1011. [Google Scholar] [CrossRef]
- Bulovas, A.; Dirvianskytė, N.; Talaikytė, Z.; Niaura, G.; Valentukonytė, S.; Butkus, E.; Razumas, V. Electrochemical and structural properties of self-assembled monolayers of 2-methyl-3-(?-mercaptoalkyl)-1,4-naphthoquinones on gold. J. Electroanal. Chem. 2006, 591, 175–188. [Google Scholar] [CrossRef]
- Savinova, E.; Zemlyanov, D.; Pettinger, B.; Scheybal, A.; Schlogl, R.; Doblhofer, K. On the mechanism of Ag(111) sub-monolayer oxidation: A combined electrochemical, in situ SERS and ex situ XPS study. Electrochim. Acta 2000, 46, 175–183. [Google Scholar] [CrossRef]
- Nakamura, M.; Kobayashi, T.; Hoshi, N. Structural dependence of intermediate species for the hydrogen evolution reaction on single crystal electrodes of Pt. Surf. Sci. 2011, 605, 1462–1465. [Google Scholar]
- Kunimatsu, K.; Senzaki, T.; Tsushima, M.; Osawa, M. A combined surface-enhanced infrared and electrochemical kinetics study of hydrogen adsorption and evolution on a Pt electrode. Chem. Phys. Lett. 2005, 401, 451–454. [Google Scholar] [CrossRef]
- Kunimatsu, K.; Uchida, H.; Osawa, M.; Watanabe, M. In situ infrared spectroscopic and electrochemical study of hydrogen electro-oxidation on Pt electrode in sulphuric acid. J. Electroanal. Chem. 2006, 587, 299–307. [Google Scholar] [CrossRef]
- Kunimatsu, K.; Senzaki, T.; Samjeske, G.; Tsushima, M.; Osawa, M. Hydrogen adsorption and hydrogen evolution reaction on a polycrystalline Pt electrode studied by surface-enhanced infrared absorption spectroscopy. Electrochim. Acta 2007, 52, 5715–5724. [Google Scholar] [CrossRef]
- Juodkazytė, J.; Šebeka, B.; Savickaja, I.; Jagminas, A.; Jasulaitienė, V.; Selskis, A.; Kovger, J.; Mack, P. Study on copper oxide stability in photoelectrochemical cell composed of nanostructured TiO2 and CuxO electrodes. Electrochim. Acta 2014, 137, 363–371. [Google Scholar] [CrossRef]
- Niaura, G. Surface-enhanced Raman spectroscopic observation of two kinds of adsorbed OH- ions at copper electrode. Electrochim. Acta 2000, 45, 3507–3519. [Google Scholar] [CrossRef]
- Chan, H.Y.H.; Takoudis, C.G.; Weaver, M.J. Oxide Film Formation and Oxygen Adsorption on Copper in Aqueous Media As Probed by Surface-Enhanced Raman Spectroscopy. J. Phys. Chem. 1999, 103, 357–365. [Google Scholar] [CrossRef]
- Yu, P.; Shen, Y. Resonance Raman studies in Cu2O. I. The phonon-assisted 1s yellow excitation absorption edge. Phys. Rev. B 1975, 12, 1377. [Google Scholar] [CrossRef]
- Maji, S.; Mukherjee, N.; Mondal, A.; Adhikary, B.; Karmakar, B. Chemical synthesis of mosoporous CuO from a single precursor: Structural, optical and electricproperties. J. Solid State Chem. 2010, 183, 1900. [Google Scholar] [CrossRef]
- Wang, W.; Zhou, Q.; Fei, X.; He, Y.; Zhang, P.; Zhang, G.; Peng, L.; Xie, W. Synthesis of CuO nano- and micro-structures and their Raman spectroscopic studies. CrystEngComm 2010, 12, 2232. [Google Scholar] [CrossRef]
- Debbichi, L.; de Lucas, M.M.; Pierson, J.; Krüger, P. Vibrational properties of CuO and Cu4O3 from first-principles calculations and Raman and infrared spectroscopy. J. Phys. Chem. C 2012, 116, 10232. [Google Scholar] [CrossRef]
- Dubouis, N.; Grimaud, A. The hydrogen evolution reaction: From material to interfacial descriptors. Chem. Sci. 2019, 10, 9165–9181. [Google Scholar] [CrossRef]
- Beni, T.; Yamasaku, N.; Kurotsu, T.; To, N.; Okazaki, S.; Arakawa, T.; Balcyis, A.; Seniutinas, G.; Juodkazis, S.; Nishijima, Y. Metamaterial for hydrogen sensing. ACS Sens. 2019, 4, 2389–2394. [Google Scholar] [CrossRef] [PubMed]
- Bodappa, N.; Su, M.; Zhao, Y.; Le, J.B.; Yang, W.M.; Radjenovic, P.; Dong, J.C.; Cheng, J.; Tian, Z.Q.; Li, J.F. Early Stages of Electrochemical Oxidation of Cu(111) and Polycrystalline Cu Surfaces Revealed by in Situ Raman Spectroscopy. J. Am. Chem. Soc. 2019, 141, 12192–12196. [Google Scholar] [CrossRef]
© 2019 by the authors. Licensee MDPI, Basel, Switzerland. This article is an open access article distributed under the terms and conditions of the Creative Commons Attribution (CC BY) license (http://creativecommons.org/licenses/by/4.0/).