Abstract
Biosorptive removal of basic fuchsin (BF) from wastewater samples was achieved using the recycled agro-wastes of pistachio nut shells (PNS). Seven adsorbents were developed; raw shells (RPNS) and the thermally activated biomasses at six different temperatures (250–500 °C). Two measures were implemented to assess the performance of utilized adsorbents; %removal (%R) and adsorption capacity (qe). RPNS proved to be the best among the tested adsorbents. A smart approach, definitive-screening design (DSD) was operated to test the impact of independent variables on the adsorption capacity of RPNS. pH, adsorbent dose (AD), dye concentration (DC), and stirring time (ST), were the tested variables. Analysis of variance (ANOVA), control, and quality charts helped establishing regression model. Characterization was performed using Fourier- transform infrared (FT-IR)/Raman spectroscopies together with thermogravimetric analysis (TGA) and scanning electron microscopy (SEM)/energy-dispersive X-ray spectroscopy (EDX) analyses. The surface area and other textural properties were determined using the Brunauer Emmett-Teller (BET) analysis. Removal of 99.71% of BF with an adsorption capacity of 118.2 mg/g could be achieved using a factorial blend of pH 12, 100 mg/50 mL of RPNS, and 250 ppm BF for 20 min. Equilibrium studies reveal that the adsorption is physisorption with adsorption energy of 7.45 kJ/mol as indicated by Dubinin-Radushkevich (DR) and Langmuir isotherms. Moreover, adsorption follows pseudo-second-order kinetics with respect to BF and is controlled by the adsorption rate.
1. Introduction
With the progress of human life and the escalating anthropogenic activities, pollution of water has become a crucial environmental concern. Various contaminants are intimidating the aquatic system. These contaminants include, but not limited to, drugs and pharmaceuticals, heavy metals and anions, plastics and polymers, dyes and pigments, and pesticides [1].
Industries, particularly, textiles, leather, food, and cosmetics encompass using dyes with diverse chemical structures. Consequently, the discharge of these industries is basically ‘huge’ amounts of intensively colored wastewaters. Release of such an effluent into the receiving water bodies causes a direct mutilation of water quality in terms of the aesthetic properties (color, pH, salinity, total organic carbon (TOC), suspended solids, etc.). Such a change negatively impacts the ecosystem. Just thinking about the capability to restrain the photosynthetic ability of water plants and microorganisms, shows the magnitude of the problem. This effect is worsened by the diverse structure of these dyes and their resistance to biodegradation. The negative impact does only involve the environment but also extends to human health with reported carcinogenic activity [2,3,4,5].
Basic fuchsin (BF), also known as Basic Violet 14, is chemically recognized as benzenamine, 4-[(4-aminophenyl) (4-imino-2,5-cyclohexadien-1-ylidene) methyl]-2-methyl hydrochloride, Figure 1. BF is a mixture of dyes (rosaniline, pararosaniline, new fuchsine, and Magenta II) that is commonly used in gram-staining and in a mixture with phenol for acid-fast staining of mycobacterium (tuberculosis and leprosy) in the procedure known as Ziehl-Neelsen [6,7]. Moreover, BF is widely used in textile and leather industries. Yet, the safety data sheet of BF shows that the dye is inflammable and might cause skin and eye irritations. Moreover, the ingestion of BF might cause internal organs’ impairment and repeated exposure is usually associated with nervous system damage with different symptoms [8,9,10].
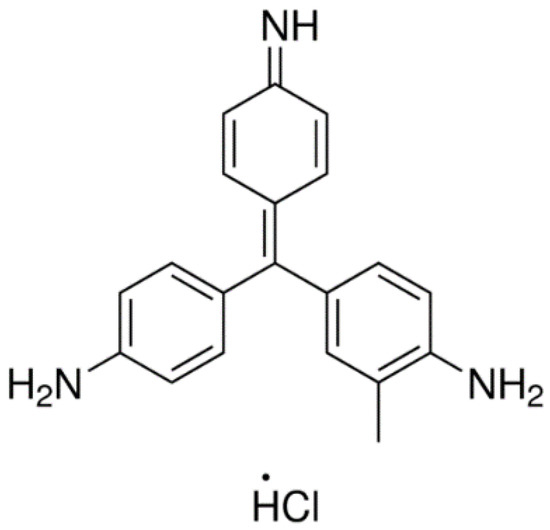
Figure 1.
Chemical structure of basic fuchsin (BF).
Keeping in mind these toxic effects and the associated changes in the eco-system, the inevitability for dyes’ removal and decolorization of water becomes evident. A literature survey shows that several approaches have been reported for the removal of dyes from aquatic bodies. However, insofar as BF removal is concerned, only a few trials were reported in the literature [10,11,12,13]. Reported techniques were mainly based on adsorption (either physisorption or chemisorption) of target dyes on an adsorbent recycled from agricultural/animal waste products [14,15,16,17,18].
A common feature among all the adopted trials is the intimate attempts to develop the model or the ideal adsorbent. Such an adsorbent must have particular criteria such as availability at low-cost and without extensive preceding treatment, liability for regeneration, the possibility for application on a large scale, and be green or in other words does not further contaminate the environment or produce a toxic sludge [19,20,21,22,23,24]. Activated carbons are promising adsorbents, yet, being expensive and with an inability to be revitalized they confine their applications on the large scale [25]. Yet, developing such an adsorbent from a natural source such as recycled agricultural/animal wastes ensures to a high extent the availability of these criteria.
Pistachio nutshells (PNS) are a by-product of pistachios; one of the most known nut trees worldwide that belongs to the cashew family (Anacardiaceae) [26]. As a desert plant, pistachio can tolerate harsh conditions of temperature and salinity but not humidity. The tree origin is mainly Asia (central and western) with Iran being the top producer [26,27]. As is known, pistachio is commonly used as a snack (fresh or roasted) as well as being an ingredient of deserts, ice-creams, sauces, pastes, and butters. Pistachio shells are usually thrown away after eating the kernel with no further use and their fate is either incineration or dumping. As per the Food and Agriculture Organization (FAO) reports, around 30 × 106 tons of PNS are dumped annually, an issue that negatively impacts the environment [28].
Therefore, it is quite interesting to explore PNS as an adsorbent for the remediation of wastewater from dyes. Since the objective of the current approach is to develop a model adsorbent, variables affecting the adsorption process (pH, adsorbent dose (AD), dye concentration (DC), and stirring time (ST)) have been optimized through a novel methodology, definitive screening design (DSD) [29]. This design and to the best of our knowledge, has not been explored before for optimizing the adsorption process. Moreover, most of the reported techniques that employ pistachios’ by-products (hull, shells, etc.) as adsorbents are using the conventional methodology; one-variable-at-a-time (OVAT), for studying the adsorption process [30,31,32,33,34]. Table 1 summarizes most of the efforts that used pistachios by-products as an adsorbent. Moreover, it shows also some of the methods reported in literature for removing BF [10,11].

Table 1.
Evaluation of the performance of pistachio nutshells (PNS) prepared in the current approach in comparison with PNS as reported in literature as well as the other adsorbents used to remove BF.
Application of such a design; (DSD), guarantees the preservation of method greenness where the lowest amount of resources (chemicals, energy, efforts, etc.) are utilized. Moreover, the obtained data can be treated with a high degree of inevitability. The response variable measured in the current investigation is the adsorption capacity (qe). The target is to optimize the adsorption process with a maximum qe and the fewest experimentations. Investigation of the adsorbent surface using Fourier- transform infrared (FT-IR) and Raman spectroscopies, scanning electron microscopy (SEM) will be conducted. The determination of the surface area will be done using Brunauer Emmett-Teller (BET) analysis. Thermogravimetric analysis (TGA) of the adsorbent will be conducted. Kinetics and equilibrium studies will be approached to decide upon the nature of the adsorption process.
2. Materials and Methods
2.1. Materials and Reagents
All reagents and chemicals were of analytical grade and were used as purchased. Sodium hydroxide, sodium tetraborate-10-hydrate (Na2B4O7. 10H2O), and hydrochloric acid were procured from Sigma-Aldrich (Germany). Ultrapure water (18.2 MΩ) was used to prepare and dilute dye solutions. Basic fuchsin was the product of Fluka (Germany). The pH of BF solutions was adjusted using a mixture of (Na2B4O7.10H2O, 50 mM) and 0.1M NaOH or 0.1M HCl. Further adjustments of pH were done using small aliquots of 0.1M NaOH and 0.1M HCl. The color of the dye did not change over the investigated pH range.
2.2. Instrumentation and Software
Absorbance measurements were performed using a UV-Vis spectrophotometer (Agilent diode-array, CA, USA) with 10 mm matched quartz cells. The pH of samples was measured using a Jenway pH meter (Jenway, Staffordshire, UK). Separation of the supernatant was done by the aid of a centrifuge (ST8 Benchtop, Thermo Scientific, Waltham, MA, USA). Scanning electron microscopy (SEM, FEI, Quanta 200, Thermo Scientific, Waltham, MA, USA) and energy-dispersive X-ray spectroscopy (EDX) were utilized to study the surface morphology of PNS derived adsorbents. Fourier transform infrared radiation (FT-IR, Bruker Alpha, MA, USA) was used to recognize the functional groups on the surface of the prepared adsorbent. The Raman spectrum was attained in the range from 50–3500 cm−1 using a DXRTM 2 Raman microscope (Thermo Scientific, Waltham, MA, USA), with a laser beam at 532 nm as excitation source and 10 mW power. Thermal gravimetric analyzer (TGA, PerkinElmer-TGA400) was employed to investigate the thermal stability of the prepared PNS adsorbents at a temperature range of 50–800 °C.
Determination of surface area, pore size and volume were performed using a Micromeritics ASAP2020 Accelerated Surface Area and Porosimetry System. Degassing of samples was initially employed followed by investigating N2 adsorption-desorption. Using the N2 isotherms collected at 77K and employing the Brunauer Emmett-Teller (BET) equation, surface area was determined. Pore volume was established using the t-plots and the Barrett–Joyner–Halenda (BJH) equation.
Minitab®18 software was purchased from Minitab Inc., State College, PA, USA, and was used to construct the selected design.
2.3. Preparation of Adsorbent
Pistachios were purchased from local stores in Doha-Qatar. Purchased samples were selected as non-roasted and non-salted. Collected samples were emptied from the kernel, washed with tap water followed by distilled water several times. Clean shells were dried at 60 °C for five consecutive days, then grinded using an electrical grinder, sieved in a mesh size (1 mm), and then divided into two portions. The first portion was kept in sealed vials in the desiccator and labelled as raw pistachio nutshells (RPNS). The second portion was further divided and thermally treated in the oven at different temperatures (250–500 °C). Thermally treated portions were labelled as PNS250, PNS300, PNS350, PNS400, PNS450, and PNS500, where the number symbolizes the temperature at which the PNS was treated.
2.4. Preparation of Adsorbate
Water samples artificially contaminated with BF were prepared by dissolving the prerequisite amounts of the dye in ultrapure water to final concertation of 100 ppm stock solution. Serial dilutions of the dye were prepared in the same solvent and the pH was adjusted to the desired value. Three calibration curves of BF at the tested pH levels (Table 2, low, mid, and high) were constructed by measuring different concentrations of BF at 547 nm.
Table 2.
Screened factors and their levels as well as the measured response variables.
2.5. Evaluation of The Adsorption Capability of Prepared Adsorbent(s)
Equations (1) and (2) were used to evaluate the performance of the prepared adsorbents in terms of % removal (%R) as well as the adsorption capacity (qe). The experimental setup of the proposed design is shown in Table 3. Two series of 15 mL centrifuge tubes were prepared, and the respective amount of the AD was added, followed by the BF dye solution (pH adjusted as per Table 3). Blanks were similarly prepared but without BF. Tubes were then centrifuged at 4200 rpm for the ST listed in Table 3. The absorbance of the supernatant was measured using spectrophotometry.
where Ce (mg L−1) is the concentration of BF aqueous solution at equilibrium, C0 (mg L−1) is the initial concentration of BF in aqueous solution, V is the volume of the solution in Liter (L), and W is the weight of the adsorbent in (g).
Table 3.
Design matrix together with observed and predicted responses.
2.6. Design of Experiments (DoE)
DSD was the factorial design selected to conduct the current investigation. A single response, adsorption capacity (qe), was optimized as a function of four independent variables, Table 2. Table 3 shows the design matrix that involved 13 basic runs in two replicates totaling 26 runs with two central points. Runs were conducted in two blocks. The full quadratic model was obtained by including blocks in the model.
2.7. Equilibrium and Kinetics Studies
For the equilibrium studies, a stock solution of 1000 ppm BF was prepared. Further dilutions of the stock solution; 40–400 ppm were prepared in the same solvent and the pH was adjusted to pH 12.00 ± 0.20 using borate buffer solution. Equal amounts of RPNS (0.1 g ± 0.005) were added to 13 mL of the previously prepared solutions and then the solution was shaken using the automatic shaker at 150 rpm for 2 h and then filtered. Absorbance of the filtrate was measured at 547 nm. On the other hand, the kinetics study was conducted using 200 mL BF dye solution (200 ppm, pH 12.00 ± 0.20) and ~1.5 g of RPNS with shaking. One sample was taken at a time range around 1 min. for a time span of 18 min.
3. Results
3.1. Evaluation of Adsorption Efficiency of Tested Adsorbents
Results shown in Table 4 show that RPNS followed by PNS250 had the best performance, with RPNS being more efficient in terms of %R and qe. The explanation of these findings will be revealed in the following subsections.
Table 4.
A comparison of the adsorption capabilities of the five as-prepared adsorbents in terms of %R and adsorption capacity (qe) using adsorbent dose (AD) = 200 mg/50 mL, pH = 9, stirring time (ST) = 30 min, and dye concentration (DC) = 30 ppm. Shown responses were calculated using Equations (1) and (2).
3.2. Definitive—Screening Design (DSD)
As indicated earlier, the objective of this treatise is to recycle an agricultural byproduct (pistachio nutshells) into a waste-removal green adsorbent with utmost competency. These objectives could be accomplished using the factorial design as an approach. DSD and the name implies a screening design that does not require a subsequent optimization phase. DSD is a three-level design and the number of runs generated is related to the number of variables (k) by the formula N = 2k + 1 or 2k + 3. Experiments were run following factorial combinations shown by the design matrix and considering the two blocks, Table 3, [29,35,36,37]. As a design, DSD can provide an estimate for the main effects, factorial interactions as well as the quadratic effects with the lowest number of experiments. One response was considered for the current investigation; qe. The target was to maximize the response.
3.2.1. Data Analysis and Modelling
Data modelling for each response was performed using the following quadratic equation, Equation (3).
where Y denotes the measured responses, m0, m1, etc. are the regression coefficients with m0 being a constant, Xi is an independent variable (A, B, C, or D), and XiXk and Xi2 are the interaction and quadratic terms, respectively.
Y = m0 + m1X1 + m2X2 + …. + mnXn + ∑mikXiXk + ∑mii Xi2
The regression equation, (Equation (4)), was obtained following response transformation employing Box-Cox response transformation together with stepwise selection of terms.
ln(qe) = 2.6945 + 0.07433 pH + 0.007701 DC − 0.004120 AD + 0.003658 ST − 0.000132
pH × DC − 0.000385 pH × ST + 0.000004 DC × AD − 0.000003 AD × ST
pH × DC − 0.000385 pH × ST + 0.000004 DC × AD − 0.000003 AD × ST
[R2 = 99.43%, R2 − Adj. = 99.04%, R2 − Pred = 98.31%]
Values of R2, R2 − Adj and R2 − Pred, associated with each regression model are shown following Equation (4). As shown, value of the coefficient of determination (R2) was high implying the goodness-of-fit. Moreover, R2 − Adj value was close to that of R2 − Pred, signifying the capability of the suggested model to expect the response for any new observation. Value of R2 − Pred was not markedly less than that of R2, speculating that the model was not over-fit. The model predicted values for the measured response are shown in Table 3. The percentage of prediction error (%Er) was employed to amount the precision of the prediction of the model. Values of %Er were between 0.20–1.83% [38,39,40,41]. The percentage of prediction errors as shown is relatively small (less than 5%), inferring that the proposed model has reasonable predictive capabilities.
3.2.2. Quality Charts and ANOVA
To attest the statistical significance of tested independent variables, Pareto chart of the standardized effects together with analysis of variance (ANOVA) at 95.0 confidence interval (95.0 CI) were run. Figure 2; Pareto chart, shows that DC and AD were the most influencing main effects, followed by the interaction of pH × CT. The extent and the direction of the effect for each of the tested variables can be perceived from the regression equation, Equation (4). As revealed in Equation (4), and while DC has a positive impact on adsorption capacity, the AD is negatively impacting the response. Yet, and as per the regression model, pH has the highest magnitude (with a plus sign), an issue which is not reflected by the Pareto chart. This can be understood by comprehensively looking at the model where the interactions of pH × DC and pH × ST are negatively influencing the adsorption capacity, an issue that a bit diminishes the impact of pH.
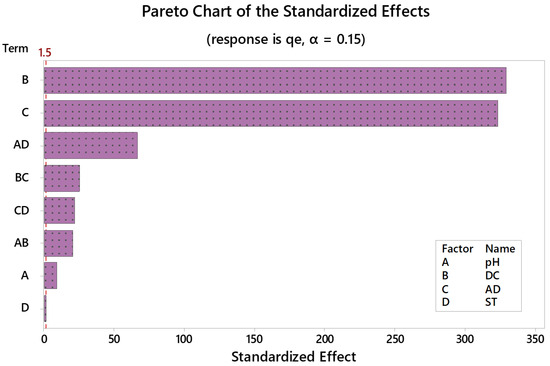
Figure 2.
Pareto chart of standardized effects following response transformation. Adsorption capacity (qe, mg/g) is the measured response. Variables exceeding the reference line (red dashed line) are statistically significant.
Residual plots (normal probability plot of residuals, histogram of residuals, residuals versus fit, and residuals versus order, not shown) were employed to test data (residuals’) distribution, whether residuals are normally distributed with a constant variance, and whether residuals are independent of one another. Similar conclusions were obtained using the ANOVA testing, Table 5. The statistical significance of tested variables at 95.0 CI was confirmed by p-values ˂ 0.05. Table 5 also shows that F-statistic is relatively large for the model, linear, and two-way interactions implying the statistical significance of the tested variables. On the other hand, F-value was small in case of ST and lack-of-fit with a p-value ˃ 0.05, indicating that the suggested model properly describes the relationship between the response and the predictors.
Table 5.
Analysis of variance (ANOVA) for the transformed response.
3.2.3. Response Surface Optimization
Contour plots of the response surface were implemented to articulate the correlation between the measured response and the independent variables. These plots enable measuring the influence of two variables—simultaneously—while the other variables are held constant in two dimensions. Figure 3 shows a 2D plot for adsorption capacity versus the different two factorial combinations. As shown on the graph, qe ˃ 100 mg/g could be attained for example at a DC of 225–250 ppm and an AD not exceeding 130–140 mg/50 mL. Optimum conditions that maximize the response (individual desirability function, d) were obtained employing the Minitab response optimizer facility. Individual response optimization shows that a qe value of 149.82 mg/g could be achieved with a d = 1.0000 using a factorial blend of pH 2, AD = 100 mg/50 mL, DC = 250 ppm, and ST = 240 min.
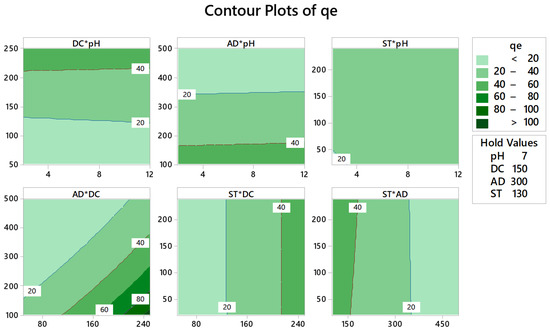
Figure 3.
Response contour plots for the adsorption capacity (qe, mg/g). Dark green regions represent regions where maximum adsorption capacity could be obtained using the described factorial combination.
3.3. Characterization Methods
3.3.1. Carbon, Hydrogen, Nitrogen (CHN) Analysis
Table 6 shows the CHN analysis for RPNS and the thermally activated derived adsorbents (PNS250–PNS500). Obtained results show that the %C, in general, has increased with the thermal treatment implying the conversion of PNS into activated carbon. This could be attributed to thermal destruction of all the organic matter and subsequent conversion into mainly carbonaceous material with the heat treatment. On the other hand, the concentration of hydrogen has decreased from 6% in the RPNs to 3% in PNS500. This would be attributed to the loss of hydrogen with oxygen—water evaporation—as the temperature increases.
Table 6.
CHN analysis of raw pistachio nutshells (RPNS) and thermally treated PNS (250–500 °C).
As will be shown later in TGA/dTGA and FT-IR analyses sections for RPNS, the raw sample was composed mainly of hemicellulose, cellulose, and lignin with some water and probably some protein. Therefore, the presence of N could be attributed to the protein content with some contaminations. On the other hand, the carbon content increases with the temperature of treatment up to 350 °C, then there is a change in the carbon content above this temperature. Yang et al. [42], reported that the yield of gasses (H2O, CO, CO2, H2, CH4, C2H4, and C2H5), as a result of pyrolysis of hemicellulose, cellulose, and lignin materials, differs depending on the temperature and nature of the investigated material. For example, and while hemicellulose produces more CO2 upon pyrolysis, lignin yield is mainly H2 and CH4. Therefore, this could explain the observed change in %C.
3.3.2. TGA Analysis
Thermogravimetric analysis of RPNS was performed under N2 and with a heating rate of 10 °C/min. Data represented in Figure 4 show that the weight loss for the RPNS sample occurs through two main steps;
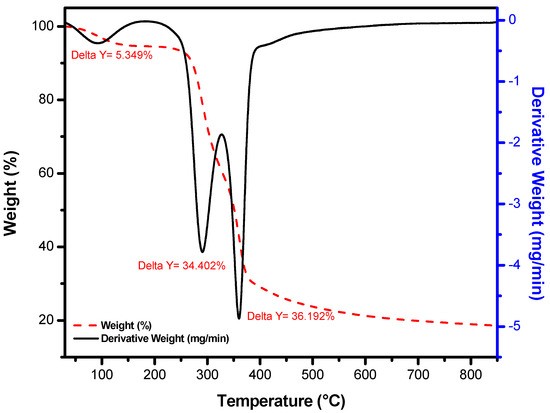
Figure 4.
Thermal gravimetric analyzer (TGA) analysis of the raw pistachio nutshells sample at a temperature range 50–800 °C.
- Step 1: Loss of adsorbed water molecules from the sample at a temperature range of 25–100 °C, followed by the loss of crystalline water at ~200 °C, which represents 5.35% of the sample. In fact, the lost water is relatively lower than what was expected. However, this would be attributed to the probability that and though RPNS was purchased as non-roasted, it might have been exposed to a sort of heat treatment prior to packing and distribution;
- Step 2: In this step, ˃70% of the sample is decomposed between (200–500 °C) and two major peaks at 290.69 °C and 359.62 °C can be observed, which could be attributed to the decomposition of the organic materials present in RPNS and the carbonization of the polymeric material.
3.3.3. Raman Analysis
Raman spectra of RPNS and thermally activated sorbents (200–500 °C) are presented in Figure 5. The spectrum of RPNS and all the thermally activated samples show a clear D- band at 1351 cm−1 and a clear G- band at 1585 cm−1. These two peaks are distinctive in the spectra of all carbonaceous materials and their arrangement is the same as graphene oxide. The presence of these two peaks in the RPNS could be attributed to and as previously mentioned to a prior roasting process at a high temperature which results in the formation of carbonaceous material.
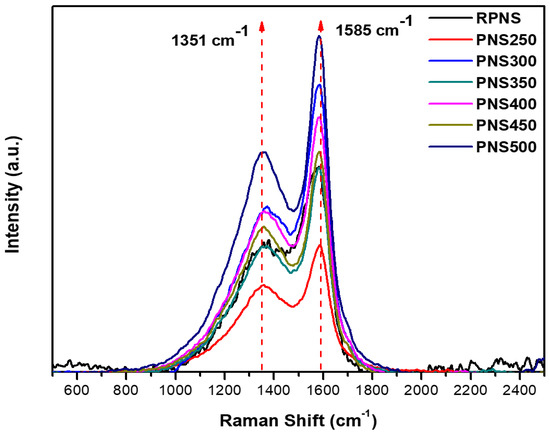
Figure 5.
Raman analysis of raw pistachio nutshells and thermally activated samples at different temperatures range from 250–500 °C (PNS250–PNS500).
As previously reported, the characteristics of the carbon lattice including defects and sizes are presented by the D-band, however, it does not represent the chemical structure of the carbon materials. The wavelength of the laser beam changes the position of the D-band but the G-band identifies the stretching of C-C for the sp2 system. Furthermore, the intensity ratio ID: IG has increased from RPNS (0.61) to PNS500 (0.65). This behavior occurred due to the thermal treatment process which increases the defect states in the sp2 plane of carbon. The obtained data confirm the formation of activated carbon with higher defects after thermal treatment compared to the roasted one.
3.3.4. FT-IR Analysis
FT-IR spectra of RPNS and PNS500 samples is given in Figure 6. Spectrum of RPNS shows the presence of a broad characteristic band at 3327 cm−1 for the stretching vibrations of the (-OH) group [43], a peak at 2909 cm−1 which can be attributed to stretching vibration of aliphatic C-H and a band at 1732 cm−1 which could be attributed to the presence of C=O stretching vibration in carboxylic acids. The presence of these peaks confirms the presence of carbonyl function group on the surface of RPNS. Furthermore, the absorption peak at 1590 cm−1 can be associated with the C=C stretching in unsaturated ketones. The huge peak at 1027 cm−1 is related to the presence of C-O-C, which is characteristic peak in hemicellulose and cellulose [30,34]. This spectrum also confirms the presence of small peaks between 1450–1310 cm−1 which could be related to bending vibrations of O-H and C-H groups.
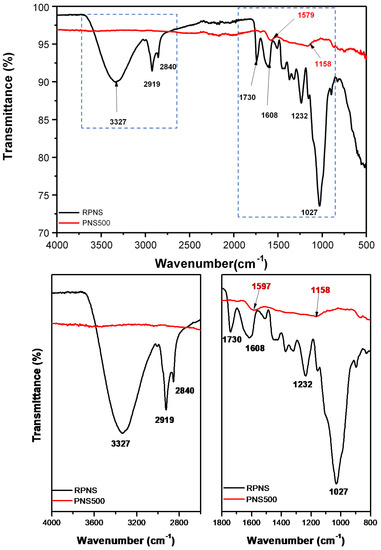
Figure 6.
Fourier- transform infrared (FT-IR) spectra of raw pistachio nutshells and thermally treated sample at 500 °C (PNS500).
On the other hand, the spectrum of the thermally treated sample (PNS500) shows little shifting of the positions of some peaks compared to their analogs in the spectrum of RPNS. For example, the peaks at 1590 and 1732 cm−1 that were attributed to the C=C and C=O groups in RPNS, appear at 1579 and 1740 cm−1 in PNS500. In addition, the spectrum shows the disappearance of some peaks such as the one at 3327 cm−1. Such a behavior might have been caused by the de-hydroxylation that occurs during the thermal treatment process. Depending on the TGA/dTGA thermograph and FT-IR spectrum of RPNS, the nutshell of pistachio is formed mainly of hemicellulose, cellulose, and lignin. Therefore, it can be concluded that the thermal activation leads to the removal of hydroxyl, carboxylic, carbonyl, and esters groups in the form of water, CO, CO2, and small volatile organic compounds [42].
3.3.5. SEM and EDX Analyses
The surface morphology of RPNS and the thermally activated samples were studied using SEM. The SEM micrographs shown in Figure 7A indicate the presence of some pores in RPNS. As the temperature used for thermal treatment increases, the number and size of the pores also increase, Figure 7B–D. The advanced pore structure in the thermally treated samples could be attributed to the decomposition of the three major components (hemicellulose, cellulose, and lignin) of the sample at different temperatures, with significantly different patterns in terms of produced gases. This finding was further confirmed by the TGA/dTGA analysis, Figure 5, and was previously reported [42]. Similarly, these findings are in alignment with the BET surface area and TGA analyses of other thermally treated adsorbents [19,20,21].
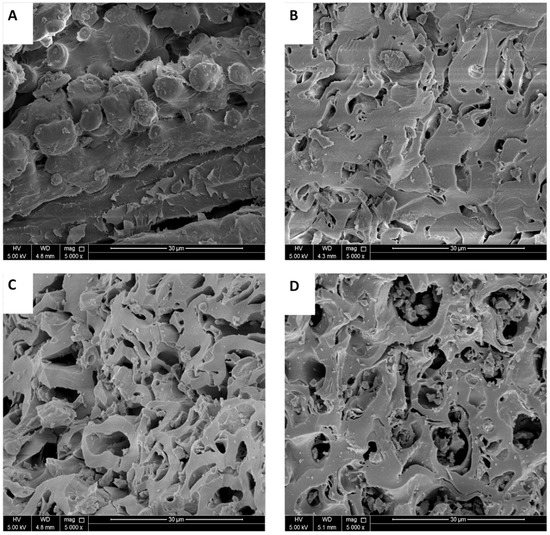
Figure 7.
SEM micrographs of (A) RPNS, (B) PNS300, (C) PNS400, and (D) PNS500.
EDX analysis was used to study the elemental composition of tested adsorbents; RPNS and PNS500. The obtained results confirm that PNS500 was essentially constituted of carbon, 95.21%, compared to 80.57% for RPNS. Other elements like Na, Mg, and Ca exist, however, their concentration was less than 2%. The obtained data confirm the formation of carbonaceous material following the thermal treatment.
3.3.6. BET Analysis
The surface area (SA) of RPNS and thermally treated samples was measured as shown in Table 7. The collected data show that Langmuir SA has increased from 4.24 to 76.94 m2/g. This huge increase in the SA could be attributed to the thermal treatment process. Furthermore, the total pore volume has increased from 0.008174 to 0.07234 cm3/g for RPNS and PNS500 samples, respectively. The average pore radius was found to be 61.7 °A for RPNS and 89.8 °A for RPNS350. The obtained data indicate that the thermal treatment process of PNS samples did not have a great impact on the average pore radius and the total pore volume in contrast to the SA.
Table 7.
Brunauer Emmett-Teller (BET) analysis of RPNS and thermally treated PNS.
3.4. Equilibrium and Kinetics Studies of The Adsorption of BF on RPNS
Table 4 shows that RPNS had the best adsorption efficiency in terms of adsorption capacity(qe) and %R. Therefore, the equilibrium and kinetics studies were conducted using RPNS. These studies are usually used to evaluate the efficiency and validity of any adsorbent. The adsorption isotherms are useful in the determination of the maximum quantity (qm) that can be adsorbed, the pattern of adsorption on the surface of the biomass, the interaction between adsorbate and adsorbent’s surface, and whether it is chemisorption or physisorption. On the other hand, the kinetic studies were used to determine the rate of adsorption, the thickness of the formed layer around the sorbent, and whether the reaction is controlled by diffusion or adsorption mechanisms. The following sections showing studies on the adsorption isotherms as well as the kinetics of the adsorption of BF on RPNS.
3.4.1. Equilibrium Isotherms
Four isotherm models were used to investigate the adsorption process of BF on RPNS. These models include Langmuir, Freundlich, Temkin, and Dubinin-Radushkevich (DR) isotherm.
Langmuir isotherm explains the single-layer homogeneous adsorption on a surface, Figure 8A and Table 6. Langmuir equation is shown in Equation (5),
where qm is monolayer adsorption capacity and KL is the Langmuir equilibrium coefficient. In addition, the Langmuir equation can be stated using the dimensionless formula, Equation (6):
where RL is the separation factor, and C0 (mg/L) is the initial concentration. The adsorption favorability as reported previously is dependent on the value of RL. If RL is ˃1, then the adsorption process is considered as unfavorable and if RL = 1 in this case the adsorption is linear. On the other hand, if the RL value is between zero and one, then the adsorption is favorable (occurs spontaneously) while if it = 0, the adsorption is irreversible [31]. The calculated RL value in the current investigation was found to be ˂1 and higher than 0, implying that the adsorption process was spontaneous, with maximum adsorption (qmax) = 58.82 mg/g and a good fit as revealed by the coefficient of determination, R2 = 0.967.
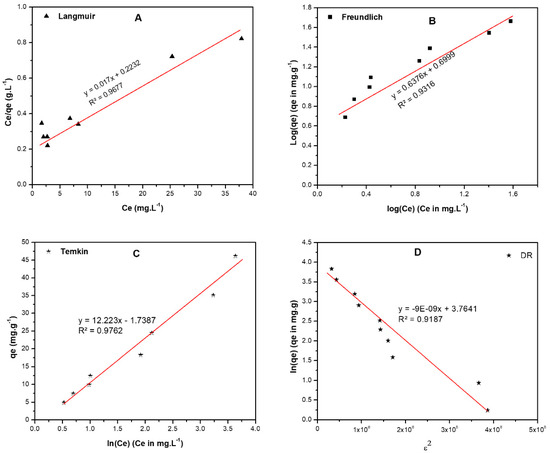
Figure 8.
Adsorption isotherms of BF on raw pistachio nutshells including, (A) Langmuir, (B) Freundlich, (C) Temkin, and (D) Dubinin-Radushkevich (DR). The following conditions were used to obtain the isotherms; DC: 40–400 ppm, AD: 0.100 ± 0.005 g, pH: 12.00 ± 0.20, and ST: 2 h.
The Freundlich isotherm used to describe heterogeneous surface energies and given by the equation:
Here the Ce is the equilibrium concentration of BF (mg L−1); qe is the amount of BF adsorbed/unit mass (mg g−1), KF (mole.g−1)(L.mole−1)1/n, and 1/n, are Freundlich coefficients. The data are shown in Figure 8B and Table 8 illustrates lower R2 value, R2 = 0.932 implying that Freundlich isotherm is not applicable to study the adsorption process of BF on RPNS. On the other hand, the Freundlich coefficient 1/n equals 0.637 and n = 1.569 meaning that the adsorption process is homogeneous, and adsorption is favorable hence 1/n < 1.
Table 8.
General and linearized equation of Langmuir, Freudlich, Temkin, and Dubinin-Radushkevich isotherms, beside their parameters for the adsorption of BF on RPNS.
Temkin isotherm, Figure 8C, gives an idea about the adsorbate/adsorbent interaction by the factor that describes the fact that the heat of adsorption of all the molecules in the layer decreases linearly with the adsorbent-adsorbate interactions. Data shown in Table 8 show that the R2 value = 0.967 signifying that this isotherm is applicable for studying the adsorption of BF on the RPNS.
Finally, the DR isotherm, Figure 8D was applied to differentiate between the adsorption mechanisms on a heterogeneous surface [31]. The physical adsorption occurs when free energy is ˂ 8.0 kJ/mol, while the chemical adsorption occurs when free energy is ˃ 8.0 kJ/mol. The free energy for adsorption of BF on RPNS is physical because the free energy = 7.45 kJ/mol as shown in Table 8. On the other hand, this isotherm is not applicable for the adsorption of BF on RPNS because the R2 value = 0.913.
3.4.2. Kinetics Studies
Four kinetics models; namely pseudo-first-order (PFO), pseudo-second-order (PSO), Elovich, and Weber-Morris (W-M) were applied to simulate the kinetics of the adsorption of BF onto RPNS. Figure 9A,B show the plots of [ln(qe − qt) versus time] and [time/qt versus time] for the PFO and PSO kinetic models, respectively. The calculated parameters of the two models are tabulated in Table 9. Comparing the coefficient of determination values (R2) of the two models, the experimental data were in good agreement with the PSO model (R2 = 0.995) [19,44,45]. Therefore, the reaction can be represented as:
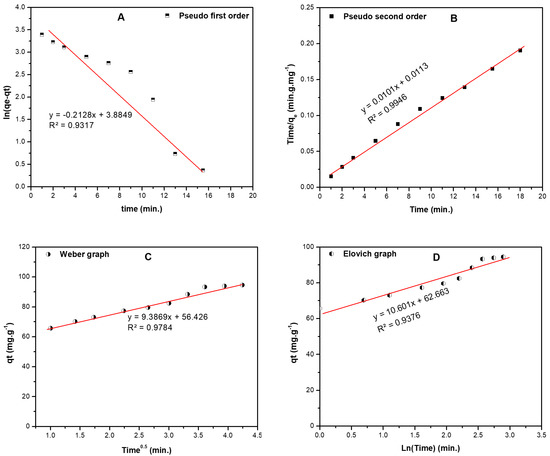
Figure 9.
Kinetic models for the adsorption of BF dye on raw pistachio nutshells including: (A) first order, (B) second order, (C) Elovich, and (D) intra-particle diffusion (Weber-Morris (W-M)) curve. The following conditions were employed to obtain the listed models: DC: 200ppm, AD: 1.500 ± 0.005 g, pH: 12.00 ± 0.20, and ST: 1–18 min.).
Table 9.
The kinetics study results corresponding to Figure 9.
The reaction rate of the adsorption can be given as , while the adsorbent is added in excess so the reaction rate can be written as , and n = 2.
From the W-M intraparticle diffusion model, Figure 9C, the diffusion rate is low and the boundary layer (56.43 mg/g) is close to the qmax calculated by Langmuir isotherm, so the mechanism is controlled by adsorption rate. According to the Elovich model shown in Figure 9D, the R2 values is low (0.938) compared to the other models. The initial sorption rate is three times higher than the desorption rate; therefore, the adsorption capacity could be enhanced by increasing the stirring time (ST), an issue that is confirmed by the output of DSD, Equation (4).
4. Conclusions
Pistachio nutshells leaves could be re-utilized as an adsorbent for basic fuchsin from contaminated water samples. Seven adsorbents could be developed from PNS. Raw pistachio nut shells proved to be a more efficient adsorbent compared to thermally treated samples (PNS250-500). Screening and optimization of the variables impacting the adsorption process was done using a smart approach; definitive screening design. A single response, adsorption capacity (qe) was measured in terms of four variables; pH, adsorbent dose ‘AD’, dye concentration ‘DC’, and stirring time ‘ST’. The target was set to maximize the response. A mathematical model was therefore developed to predict the adsorption capacity. As per the regression model, increasing the concentration of BF enhanced the adsorption capacity, in contrary to the dose of the adsorbent; RPNS.
Results show that the RPNS is formed mainly of hemicellulose, cellulose, and lignin with different percentages as shown by TGA and FT-IR. The thermal treatment of the samples leads to an improvement in the surface area as shown by BET and SEM analyses.
Equilibrium studies reveal that the adsorption is physisorption with adsorption energy of 7.4 kJ, and a maximum capacity of 58.8 mg/g as indicated by Dubinin-Radushkevich and Langmuir isotherms. The kinetics study shows that the adsorption is pseudo-second-order with respect to BF, which is controlled by adsorption rate with boundary layer of 56.4 mg/g. Finally, the initial sorption rate is almost three times the desorption rate.
Author Contributions
Conceptualization, M.E.-A.; Data curation, M.E.-A., A.A.; Formal analysis, M.E.-A., A.S.E.-S. and A.A.I.; Funding acquisition, M.E.-A.; Investigation, M.E.-A., A.A.; Methodology, M.E.-A.; Project administration, M.E.-A.; Resources, A.A.I.; Software, M.E.-A.; Supervision, M.E.-A.; Validation, M.E.-A., A.S.E.-S.; Visualization, M.E.-A.; Writing—original draft, M.E.-A.; Writing—review & editing, M.E.-A., A.S.E.-S. and A.A.I.
Funding
This work was made possible by Qatar University Internal Student Grant [QUST-2-CAS-2019-18] from Qatar University. The statements made herein are solely the responsibility of the authors. The publication of this article was funded by the Qatar National Library.
Acknowledgments
The project members would like to extend their special thanks to the Central Lab Unit (CLU) at the Qatar University.
Conflicts of Interest
The authors declare no conflict of interest.
References
- Owa, F.D. Water Pollution: Sources, effects, control and management. Med. J. Soci. Sci. 2013, 4, 65–68. [Google Scholar] [CrossRef]
- Noroozi, B.; Sorial, G.A. Applicable models for multi-component adsorption of dyes: A review. J. Environ. Sci. 2013, 25, 419–429. [Google Scholar] [CrossRef]
- Forgacs, E.; Cserháti, T.; Oros, G. Removal of synthetic dyes from wastewaters: A review. Environ. Int. 2004, 30, 953–971. [Google Scholar] [CrossRef]
- Banat, I.M.; Nigam, P.; Singh, D.; Marchant, R. Microbial decolorization of textile-dyecontaining effluents: A review. Bioresour. Technol. 1996, 58, 217–227. [Google Scholar] [CrossRef]
- Robinson, T.; McMullan, G.; Marchant, R.; Nigam, P. Remediation of dyes in textile effluent: A critical review on current treatment technologies with a proposed alternative. Bioresour. Technol. 2001, 77, 247–255. [Google Scholar] [CrossRef]
- Horobin, R.W.; Kiernan, J.A. Conn’s Biological Stains, 10th ed.; BIOS: Oxford, UK, 2002; pp. 184–191. [Google Scholar]
- Clark, G. Staining Procedures Used by the Biological Stain Commission, 3rd ed.; Williams & Wilkins: Baltimore, MD, USA, 1973; pp. 252–254. [Google Scholar]
- Fisher, A.A. Irritant and toxic reactions to phenol in topical medications. Cutis 1980, 26, 363–364. [Google Scholar]
- Littlefield, N.A.; Blackwell, B.N.; Hewitt, C.C.; Gaylor, D.W. Chronic toxicity and carcinogenicity studies of gentian violet in mice. Toxicol. Sci. 1985, 5, 902–912. [Google Scholar] [CrossRef]
- Gupta, V.K.; Mittal, A.; Gajbe, V.; Mittal, J. Adsorption of basic fuchsin using waste materials—bottom ash and deoiled soya—as adsorbents. J. Colloid Interface Sci. 2008, 319, 30–39. [Google Scholar] [CrossRef]
- El Haddad, M. Removal of Basic Fuchsin dye from water using mussel shell biomass waste as an adsorbent: Equilibrium, kinetics, and thermodynamics. J. Taibah Univ. Sci. 2016, 10, 664–674. [Google Scholar] [CrossRef]
- Bhole, B.D.; Ganguly, B.; Madhuram, A.; Deshpande, D.; Joshi, J. Biosorption of methyl violet, basic fuchsin et their mixture using dead fungal biomass. Curr. Sci. 2004, 86, 1641–1645. [Google Scholar]
- An, S.Y.; Min, S.K.; Cha, I.H.; Choi, Y.L.; Cho, Y.S.; Kim, C.H.; Lee, Y.C. Decolorization of triphenylmethane and azo dyes by Citrobacter sp. Biotechnol. Lett. 2002, 24, 1037–1040. [Google Scholar] [CrossRef]
- Ramírez-Montoya, L.A.; Hernández-Montoya, V.; Montes-Morán, M.A. Optimizing the preparation of carbonaceous adsorbents for the selective removal of textile dyes by using Taguchi methodology. J. Anal. Appl. Pyrolysis. 2014, 109, 9–20. [Google Scholar] [CrossRef]
- Gómez, V.; Larrechi, M.S.; Callao, M.P. Kinetic and adsorption study of acid dye removal using activated carbon. Chemosphere 2007, 69, 1151–1158. [Google Scholar] [CrossRef]
- Gupta, V.K. Application of low-cost adsorbents for dye removal: A review. J. Environ. Manag. 2009, 90, 2313–2342. [Google Scholar] [CrossRef]
- Duman, O.; Tunc, S.; Polat, T.G. Adsorptive removal of triarylmethane dye (Basic Red 9) from aqueous solution by sepiolite as effective and low-cost adsorbent. Microporous Mesoporous Mater. 2015, 210, 176–184. [Google Scholar] [CrossRef]
- Nayak, A.K.; Pal, A. Green and efficient biosorptive removal of methylene blue by Abelmoschus esculentus seed: Process optimization and multi-variate modelling. J. Environ. Manag. 2017, 200, 145–159. [Google Scholar] [CrossRef]
- El-Azazy, M.; El-Shafie, A.S.; Issa, A.A.; Al-Sulaiti, M.; Al-Yafie, J.; Shomar, B.; Al-Saad, K. Potato peels as an adsorbent for heavy metals from aqueous solutions: Eco-structuring of a green adsorbent operating Plackett-Burman design. J. Chem. 2019, 2019, 1–14. [Google Scholar] [CrossRef]
- El-Azazy, M.; Kalla, R.N.; Issa, A.A.; Al-Sulaiti, M.; El-Shafie, A.S.; Shomar, B.; Al-Saad, K. Pomegranate peels as versatile adsorbents for water purification: Application of Box-Behnken design as a methodological optimization approach. Environ. Prog. Sustain. Energy 2019, 38, 1–12. [Google Scholar] [CrossRef]
- Al-Saad, K.; El-Azazy, M.; Issa, A.A.; Al-Yafei, A.; El-Shafie, A.S.; Al-Sulaiti, M.; Shomar, B. Recycling of date pits into a green adsorbent for removal of heavy metals: A fractional factorial design-based approach. Front. Chem. 2019, 7, 1–16. [Google Scholar] [CrossRef]
- Yıldız, S. Kinetic and isotherm analysis of Cu (II) adsorption onto almond shell (Prunus dulcis). Ecol. Chem. Eng. S 2017, 24, 87–106. [Google Scholar]
- Kłos, A. Determination of sorption properties of heavy metals in various biosorbents. Ecol. Chem. Eng. S 2018, 25, 201–216. [Google Scholar] [CrossRef]
- Makuchowska-Fryc, J. Use of the eggshells in removing heavy metals from wastewater-The Process Kinetics and Efficiency. Ecol. Chem. Eng. S 2019, 26, 165–174. [Google Scholar]
- Tsang, D.C.W.; Hu, J.; Lui, M.Y.; Zang, W.; Lai, K.C.K.; Lo, I.M.C. Activated carbon produced from waste wood pallets: Adsorption of three classes of dyes. Water Air Soil Pollut. 2007, 184, 141–155. [Google Scholar] [CrossRef]
- AL-Saghir, M.G.; Porter, D.M. Taxonomic revision of the genus Pistacia L. (Anacardiaceae). Am. J. Plant Sci. 2012, 3, 12–32. [Google Scholar] [CrossRef]
- UN Food and Agriculture Organization, Corporate Statistical Database (FAOSTAT). Pistachio Production in 2017, Crops/Regions/World List/Production Quantity (Pick Lists). 2017. Available online: http://www.fao.org/faostat/en/#data/QC (accessed on 9 October 2019).
- SOPIB. Pistachios, Facts, Figures, Fertilizer Research. 2010. Available online: http://www.sopib.com/20100309186/news/news/pistachios-facts-figures-fertlizer-research.html/ (accessed on 9 October 2019).
- El-Shafie, A.S.; Khashan, A.W.; Hussein, Y.H.A.; El-Azazy, M.S. Application of a definitive screening design for the synthesis of a charge-transfer complex of sparfloxacin with tetracyanoethylene: Spectroscopic, thermodynamic, kinetics, and DFT computational studies. RSC Adv. 2019, 9, 24722–24732. [Google Scholar] [CrossRef]
- Deniz, F.; Kepekci, R.A. Dye biosorption onto pistachio by-product: A green environmental engineering approach. J. Mol. Liq. 2016, 219, 194–200. [Google Scholar] [CrossRef]
- Moussavi, G.; Barikbin, B. Biosorption of Chromium(VI) from industrial wastewater onto pistachio hull waste biomass. Chem. Eng. J. 2010, 162, 893–900. [Google Scholar] [CrossRef]
- Moussavi, G.; Barikbin, B. The removal of cationic dyes from aqueous solutions by adsorption onto pistachio hull waste. Chem. Eng. Res. Des. 2011, 89, 2182–2189. [Google Scholar] [CrossRef]
- Siddiqui, S.H.; Ahmad, R. Pistachio Shell Carbon (PSC)–an agricultural adsorbent for the removal of Pb (II) from aqueous solution. Groundw. Sustain. Dev. 2017, 4, 42–48. [Google Scholar] [CrossRef]
- Foo, K.Y.; Hameed, B.H. Preparation and characterization of activated carbon from pistachio nut shells via microwave-induced chemical activation. Bioresour. Technol. 2011, 35, 3257–3261. [Google Scholar] [CrossRef]
- Jones, B.; Nachtsheim, C.J. A Class of Three-Level Designs for Definitive Screening in the Presence of Second-Order Effects. J. Qual. Technol. 2011, 43, 1–15. [Google Scholar] [CrossRef]
- Jones, B.; Nachtsheim, C.J. Definitive Screening Designs with Added Two-Level Categorical Factors. J. Qual. Technol. 2013, 45, 121–129. [Google Scholar] [CrossRef]
- Zhang, C.; Chen, W.; Xian, J.; Fu, D. Application of a novel definitive screening design to in situ chemical oxidation of acid orange-II dye by a Co2+/PMS system. RSC Adv. 2018, 8, 3934–3940. [Google Scholar] [CrossRef]
- Box, G.E.P.; Cox, D.R. An Analysis of Transformations. J. R. Stat. Soc. Ser. B 1964, 26, 211–252. [Google Scholar] [CrossRef]
- Antony, J. Design of Experiments for Engineers and Scientists, 1st ed.; Antony, J., Ed.; Elsevier: Amsterdam, The Netherlands, 2003; pp. 6–16. [Google Scholar]
- Bruns, R.E.; Scarminio, I.S.; Neto, B.B. Statistical Design—Chemometrics, 1st ed.; Elsevier: Amsterdam, The Netherlands, 2006; Volume 25. [Google Scholar]
- Elazazy, M.S. Factorial Design and Machine Learning Strategies: Impacts on Pharmaceutical Analysis. In Spectroscopic Analyses-Developments and Applications; Sharmin, E., Zafar, F., Eds.; IntechOpen: London, UK, 2017; Chapter 11; pp. 213–230. [Google Scholar]
- Yang, H.; Yan, R.; Chen, H.; Lee, D.H.; Zheng, C. Characteristics of hemicellulose, cellulose and lignin pyrolysis. Fuel 2007, 86, 1781–1788. [Google Scholar] [CrossRef]
- Tounsadi, H.; Khalidi, A.; Abdennouri, M.; Barka, N. Biosorption potential of Diplotaxis harra and Glebionis coronaria L. biomasses for the removal of Cd(II) and Co(II) from aqueous solutions. J. Environ. Chem. Eng. 2015, 3, 822–830. [Google Scholar] [CrossRef]
- Sarma, G.K.; Khan, A.; El-Toni, A.M.; Rashid, M.H. Shape-tunable CuO-Nd(OH)3 nanocomposites with excellent adsorption capacity in organic dye removal and regeneration of spent adsorbent to reduce secondary waste. J. Hazard. Mater. 2019, 380, 1–10. [Google Scholar] [CrossRef]
- Sun, B.; Yuan, Y.; Li, H.; Li, X.; Zhang, C.; Guo, F.; Liu, X.; Wang, K.; Zhao, X.S. Waste-cellulose-derived porous carbon adsorbents for methyl orange removal. Chem. Eng. J. 2019, 371, 55–63. [Google Scholar] [CrossRef]
© 2019 by the authors. Licensee MDPI, Basel, Switzerland. This article is an open access article distributed under the terms and conditions of the Creative Commons Attribution (CC BY) license (http://creativecommons.org/licenses/by/4.0/).