Article

A Novel Deep Learning Approach for Machinery Prognostics Based on Time Windows

1
State Key Laboratory for Manufacturing Systems Engineering, Xi’an Jiaotong University, Xi’an 710049, China
2
Shaanxi Key Laboratory of Intelligent Robots, Xi’an Jiaotong University, Xi’an 710049, China
*
Author to whom correspondence should be addressed.
Appl. Sci. 2019, 9(22), 4813; https://doi.org/10.3390/app9224813
Submission received: 10 October 2019 / Revised: 1 November 2019 / Accepted: 7 November 2019 / Published: 11 November 2019
(This article belongs to the Section Mechanical Engineering)

Abstract

:
Remaining useful life (RUL) prediction is a challenging research task in prognostics and receives extensive attention from academia to industry. This paper proposes a novel deep convolutional neural network (CNN) for RUL prediction. Unlike health indicator-based methods which require the long-term tracking of sensor data from the initial stage, the proposed network aims to utilize data from consecutive time samples at any time interval for RUL prediction. Additionally, a new kernel module for prognostics is designed where the kernels are selected automatically, which can further enhance the feature extraction ability of the network. The effectiveness of the proposed network is validated using the C-MAPSS dataset for aircraft engines provided by NASA. Compared with the state-of-the-art results on the same dataset, the prediction results demonstrate the superiority of the proposed network.

1. Introduction

As a major task of condition-based maintenance (CBM), health prognostics can predictively maintain equipment, improve the reliability of the machinery and prevent catastrophic consequences [1,2,3,4,5]. The main purpose of health prognostics is to explore the on-going degradation law for the device by feature extraction of the device-related data, and then predict the remaining useful life (RUL) [6]. Consequently, RUL prediction has received more and more attention from academia and industry.
RUL prediction methods can be classified into two categories: model-driven methods and data-driven methods. The model-driven methods aim to derive the degradation process of a machine by setting up mathematical or physical models [7]. With the commonly used models such as the Markov process model, the Winner process model and the Gaussian mixture model, the RUL can be predicted [8]. However, such methods rely on robust physical or mathematical models, which are difficult to obtain owing to the complex environment [9]. Data-driven methods establish the relationship between the acquired data and RUL through data mining, which can be more accurate with the real-time monitoring data. In recent years, a number of effective data-driven algorithms have been proposed and achieved good results, mainly including: neural networks [10], support vector regression (SVR) [11] and gaussian process regression (GPR) [12].
Generally, data-driven methods consist of three stages: data acquisition, health indicator (HI) construction and RUL prediction [13,14,15,16]. By learning the deterioration curve of HIs, the time it takes for the current HI to reach the pre-set failure threshold (i.e., RUL) is estimated. Louen et al. [17] proposed a new health indicator creation approach using binary support vector machine classifier and calculated the RUL through an identified Weibull function. Guo et al. [6,18] applied neural networks to the construction of health indicators and the RUL was obtained by the particle filter. Malhotra et al. [19] constructed a long short-term memory-based encoder-decoder (LSTM-ED) scheme to obtain an unsupervised health indicator (HI).
Generally, the prediction accuracy of RUL is seriously affected by the quality of the constructed HIs [20,21]. The current HI construction methods are perplexed by different amplitude ranges of statistical features, which leads to unifying the failure threshold difficultly under different working conditions [9,18]. In addition, as shown in Figure 1a, prediction methods based on HIs depend on long-term tracking of equipment from the initial to the current time, which is impractical in some cases.
Hence, some scholars have paid attention to the time window (TW)-based RUL prediction method and have begun to directly establish the correlation between the sensor signals and RUL. Lim et al. [22] developed a machine learning framework with a moving time window to determine the RUL of aircraft engines. Zhang et al. [23] used a fixed time window to predict the RUL of aircraft engines. As depicted in Figure 1b, this method can start sampling at any time when the equipment is running, obtain the data from t q to t p , and the RUL at t p can be predicted directly according to these data. The key issue of these methods is to establish the mapping between the original signal and the RUL.
Recently, deep learning has made remarkable achievements in the fields of image recognition, speech recognition and unmanned driving [24,25]. Deep learning is characterized by the deep network architecture where multiple layers are stacked in the network to fully capture the representative information from the raw input data [26]. Therefore, as a powerful tool, deep learning shows its great potential in establishing the correlation between the original signals and the RUL. Lim et al. [22] created a multilayer neural network as the deep learning algorithm to build the correlation between signal characteristics and RUL. Zhang et al. [23] proposed a multi-objective deep belief networks ensemble (MODBNE) method for RUL prediction, which employs a multi-objective evolutionary algorithm integrated with the traditional deep belief networks (DBN) training technique to evolve multiple DBNs simultaneously subject to accuracy and diversity as two conflicting objectives. Within the deep learning architecture, convolutional neural network (CNN) is further applied in this study because of its excellent feature extraction ability in the face of variable and complex signals [27]. Babu et al. [28] firstly applied CNNs to the field of RUL prediction and incorporated automated feature learning from the raw sensor signals in a systematic way. Li et al. [27] established a deep CNN model and conducted a preliminary exploration of the depth of the networks on RUL prediction. While CNNs have shown great potential in prognostics, there are still few applications of CNN in RUL prediction.
In this paper, a novel CNN is presented. The kernel module composed of multiple convolutional kernels was proposed for feature extraction. This module was derived from the inception network proposed by Szegedy et al. [25]. Compared with the module used in the inception network, the feature extraction of the convolution kernel was in the time dimension, which reduced the parameters of the module and transfers the application in the image field to prognostics. The relationship between the raw signals and the RUL could be established through the learning process. The RUL was calculated according to the new vector of input signals.
In this study, we used the C-MAPSS dataset provided by NASA for the RUL prediction of aircraft engines [29]. The engine is the key component of the aircraft and there is always a pressing need to develop new approaches to better evaluate the engine performance degradation and estimate the remaining useful life [30]. The proposed network showed its superiority compared with the state-of-art methods on the same dataset. Our attempt was a useful exploration for implementing the RUL prediction on the unexpected events and provides the possibility to transfer the proposed method in a simpler scenario.
This remainder of the paper is organized as follows. The proposed CNN is given in Section 2, which illustrates the proposed architecture and the main scheme of the kernel module used in the convolution layers. The experimental results of the proposed model compared with different depths, time windows, optimization algorithms and other state-of-the-art methods are given in Section 3. Section 4 summarizes the conclusions of this work.

2. The Proposed Deep CNN Architecture

As presented in Figure 2, the deep learning architecture proposed consisted of the convolution layers, pooling layers and the fully-connected layer. Firstly, the normalized sensor data with the time window was directly used as input to the CNN, and then the feature maps were increased. Secondly, the convolution layer which was characterized by the kernel module was utilized for feature extraction and the down sampling scheme was operated by the pooling layer. Thirdly, the dimension reduction was performed before the fully connected layer, and then the feature mapping was implemented at the fully connected layer.

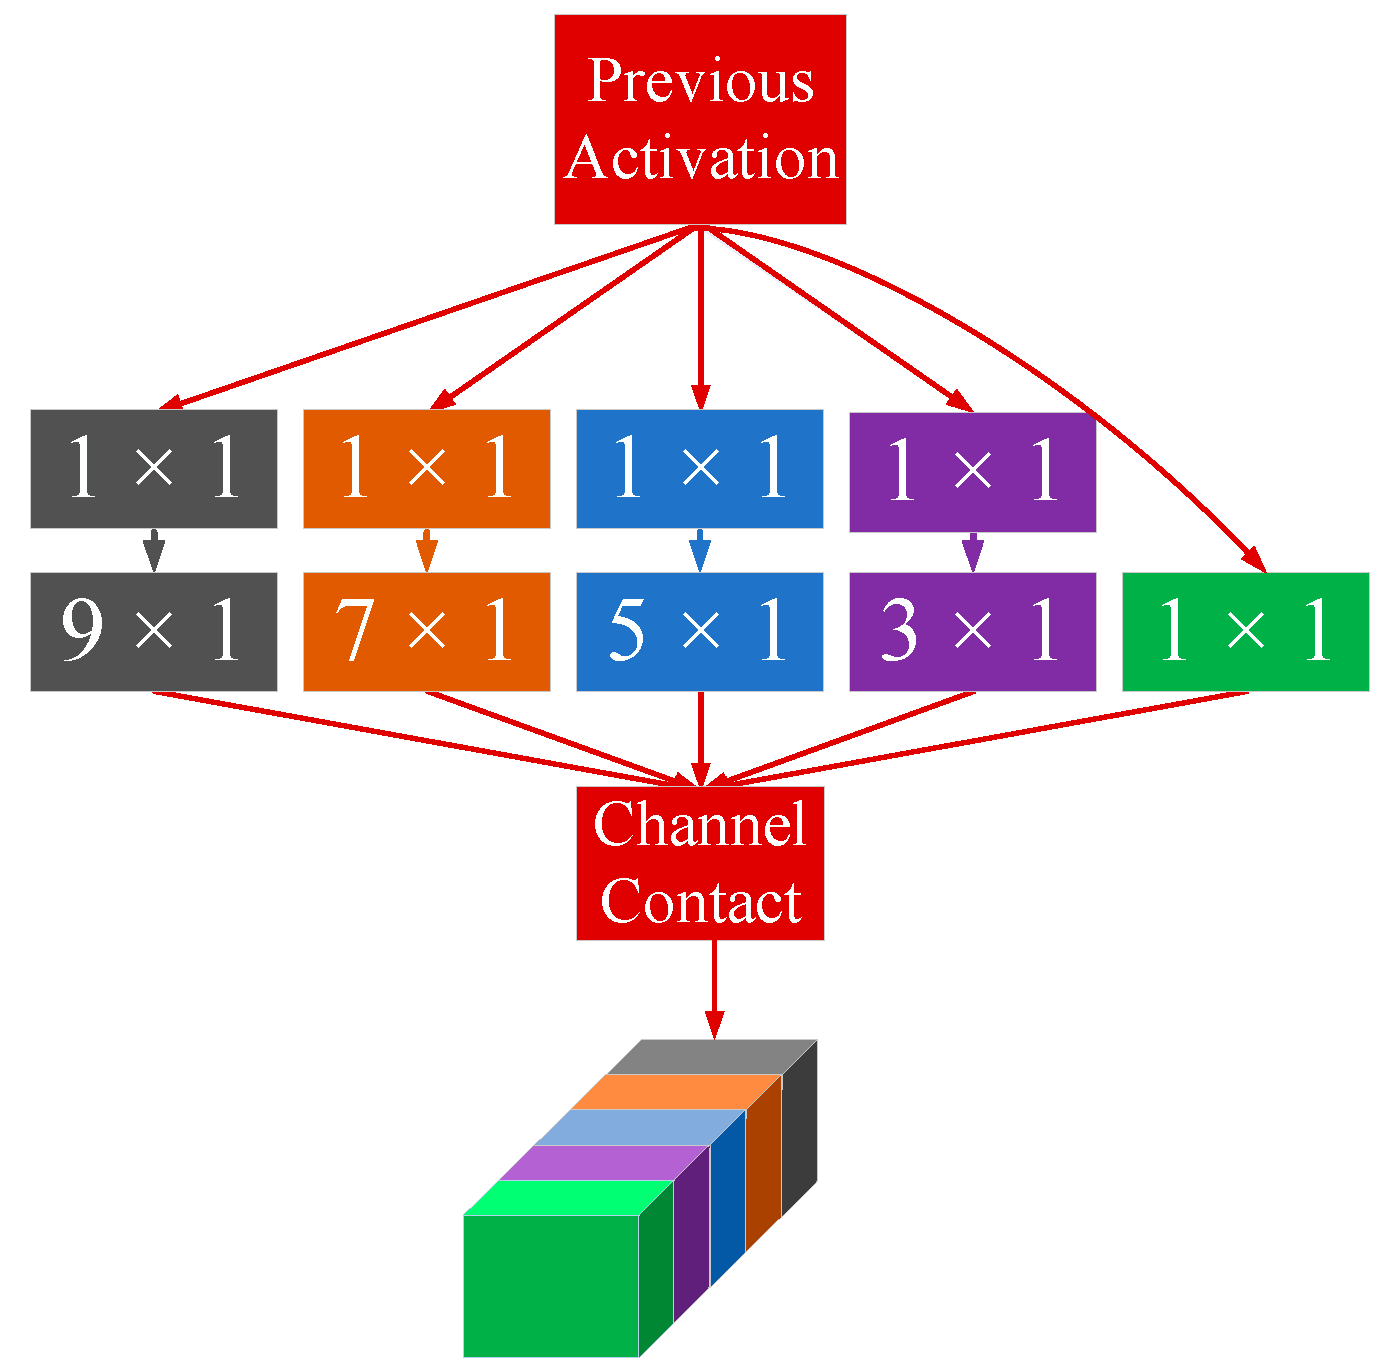
2.1. The Kernel Module

The CNN previously used in prognostics contains only convolution kernels of the same size. However, the field of vision extracted by a small-sized kernel could be smaller, and a larger-sized kernel may ignore the details. Hence, different sizes of kernels can be used in each convolution layer to let the CNN automatically learn to select the size of the kernel. The selected kernels are one-dimensional because feature extraction is mainly performed in the time dimension. The size of the kernel in the module should be adjusted according to the size of the input data, which means the size of the kernel cannot be larger than the size of the input data for the module in the time dimension. Each convolution layer is characterized by the kernel module which is composed of kernels with different sizes. The padding method was “SAME”. The kernel module is illustrated in Figure 3.
The Lth layer is assumed to be the convolution layer which can be denoted as:
x j L = f ( i M L 1 x i L 1 × f j L + b j L ) ,
where x j L is the jth feature map of the output on the Lth layer, x i L 1 is the ith feature map of the output on the L-1th layer, M L 1 is all the feature maps of the output on the L-1th layer, f j L is the jth kernel on the Lth layer, b j L is the jth bias on the Lth layer.
The 1 × 1 convolution kernel can be used in front of the other kernels as the bottleneck to directly reduce the computational burden of the convolution layer, which is explained in the next subsection.

2.2. The 1 × 1 Kernels

The 1 × 1 convolution kernel was proposed firstly by Szegedy et al. [25], which has two functions. Firstly, by adding the 1 × 1 kernels in front of other kernels in the kernel module, the computational cost can be reduced. The total number of multipliers is the number of multipliers that need to be calculated for each of output values times the number of output values. As illustrated in Figure 4, two techniques are given for inputting n 1 × n 2 × f 1 and outputting n 1 × n 2 × m 1 , the first method is to use only s × 1 convolution kernels, and an alternative architecture is to use the 1 × 1 convolution kernels and then the s × 1 convolution kernels.
The total number of multipliers for the first technique t m 1 and the second technique t m 2 can be calculated by
t m 1 = n 1 × n 2 × m 1 × s × f 1 , t m 2 = n 1 × n 2 × m 2 × f 1 + n 1 × n 2 × m 1 × s × m 2 ,
where m 2 represents the number of feature maps after the 1 × 1 kernels.
If t m 1 > t m 2 , then
( m 1 / m 2 m 1 / f 1 ) > 1 / s ,
hence, the computational load can be reduced.
The second function of the 1 × 1 kernel is to change the number of feature maps and implement linear combination of multiple feature maps. The input data is processed by the 1 × 1 kernel, and then the number of the feature maps is increased, providing the convolution layer with the data for feature extraction. In addition, the 1 × 1 convolution kernel is used for dimension reduction before the fully-connected layer, which can further enhance the correlation between the extracted features and RUL.

2.3. The Proposed Network

The proposed deep convolution neural network is shown in Figure 5. The depth of the network is determined by the convolution-pooling layer or convolution layer. The pooling layer is used to reduce the dimensions and does not need to perform complex matrix operations or learn any parameters. The size of the kernel in the pooling layer is 2 × 1, and the stride is 2 × 1. The pooling method is ‘VALID’ max pooling and the size of input data will be halved in the time dimension through the pooling layer. Finally, the fully-connected layer maps the features learned by the CNN to the output through converting three-dimensional data into one-dimensional.
The input data is three-dimensional and is expressed by T × S × F, where T is the length of the TW, S is the sensor data and F is the number of feature map (the input data contains only one feature map). The normalized data for T consecutive time cycles is directly used as input to the CNN. As the depth of the model increases, the number of convolution kernels after the 1 × 1 kernels in each layer is doubled until the input of the Lth layer is less than six in the time dimension, and the pooling layer will no longer be included in the layer and subsequent layers. If the pooling layer for the input data less than six is used again, only the 1 × 1 convolution kernel can be used in the next layer, which is only an increase in the number of feature maps rather than feature extraction. The number and size of the convolution kernels in the subsequent layers will be the same as the Lth layer. Before other kernels, the number of 1 × 1 kernels is half that of other kernels to satisfy Equation (3), while the first layer is different. This is because the number of the initial 1 × 1 kernels before the first convolution-pooling layer is half of other kernels in the first layer, so the number of the 1 × 1 kernels before other kernels is set to one quarter of other kernels in the first layer as the bottleneck to reduce the parameters. Note that, the maximum size of the kernel in each layer should be less than or equal to the time dimension of the input data in that layer.
Here is a concrete example, when the TW size was set to 30, the number of different kernels is presented in Table 1. Due to the dimensionality reduction of the pooling layer, the input size of the third layer was 7 × S × 160, so the kernel module in this layer removed the 9 × 1 kernels. Similarly, only 1 × 1 and 3 × 1 convolution kernels were used in the fourth and subsequent last layers, and no pooling layers were added.

3. Experiment and Analysis

3.1. Experimental System

NASA C-MAPSS dataset generated by the aircraft engine simulation models is often used for comparison of different approaches [29]. The C-MAPSS dataset contains four sub-datasets that correspond to different simulation conditions and engine failure modes. Each sub-dataset has one training set and one testing set. The training set contains temporal data of 21 outputs of the aircraft engine simulation model from the unknown state of the model to the stage of failure. These 21 outputs include diverse types of data such as temperature data, speed data and pressure data at different positions of the engines, etc. The information of the C-MAPSS dataset is given in Table 2. The failure modes of FD001 and FD002 are only high-pressure compressor (HPC) degradation, while the failure modes of FD003 and FD004 include high-pressure compressor degradation and fan degradation.
As shown in Table 3, only 14 sets among the 21 outputs were selected for the study, the others were constant during the life of the engines from health to failure and did not provide any valuable information for RUL prediction [23]. Therefore, as shown in Table 3, 14 sets of time-varying variables with indices 2, 3, 4, 7, 8, 9, 11, 12, 13, 14, 15, 17, 20 and 21 were selected in the study. The state of the aircraft engine was healthy during the early operation period. In the initial stage, it was assumed that the RUL of the aircraft engine was a constant value. Based on the degradation mechanism of aircraft engines in this dataset [23], the constant value of RUL in the early stage was set to 125 in this paper.

3.2. Experimental Setup

3.2.1. Data Pre-Processing

In the CNN, the characteristics of relatively smaller values will be weakened, and the characteristics of relatively larger values will be amplified. To eliminate the problems caused by different numerical ranges, the data need to be standardized. The zero-mean normalization method was used in this paper, which is denoted as:
T R A I N j i = t r a i n j i μ t r a i n i σ t r a i n i ,
where   T R A I N i j represents the normalized value of the jth data point from the ith sensor in a training sample, t r a i n i j represents the true value of the jth data point from the ith sensor, μ t r a i n i represents the mean of the ith sensor and σ t r a i n i represents the standard deviation.
At the same time, the standardization of data in the testing set should be based on the mean and standard deviation of the training set, so that the impact of future data on the current model can be avoided.

3.2.2. Time Window Processing

Many multivariate temporal data-based prediction models take as an input a multivariate data point sampled at a single time stamp, which neglects some useful temporal information that may much improve prediction performance [23]. Therefore, the TW is introduced to solve this problem. Specifically, at any particular timestamp, TW covers the data of the current timestamp and its several preceding timestamps, which is then fed as an input into the prediction model [23]. In this study, the effect of the TW size on the prediction results was considered.

3.2.3. Training Process

The models were trained ten times to reduce the fluctuations in the training process. The constant value of RUL in the early stage was 125, the number of 1 × 1 kernels after the input layer was 8, the number of 1 × 1 kernels before the fully-connected layer and the number of neurons in the fully-connected layer was 64 and 800, respectively. The dropout rate was set to 0.5 and the activation function was ReLU. The training parameters are presented in Table 4.
The relationship between batch size, iteration and epoch can be expressed as
one   epoch = number   of   iterations = total   samples / batch   size
The loss function is defined as follows
L o s s = 1 N b i = 1 N b h i 2 ,
where N b is the number of the batch size and h i = R U L p r e d i c t e d R U L t r u e .
The loss function was minimized during the training process using the Adam optimization algorithm and the parameters of the model were saved. Experiments were run on a personal computer with Intel Core i7-8700 CPU, 16GB memory and GTX 1080 Ti GPU. The programming language was Python 3.6 with scientific computing library numpy and deep learning library tensorflow-gpu.

3.2.4. Evaluation Functions

There are mainly two kinds of evaluation functions for this dataset. One evaluation function gives different weights to the late predictions and early predictions, and the other is that the weights for both conditions are the same.
The first type of evaluation function [29] is shown in Equation (7), where N represents the number of aircraft engines in the testing set.
S = { i = 1 N ( e h i 13 1 ) h i < 0 i = 1 N ( e h i 10 1 ) h i 0 .
The scoring function is asymmetric, which penalizes late prediction (i.e., the estimated RUL value is larger than the actual RUL value) more heavily than early prediction (i.e., the estimated RUL value is smaller than the actual RUL value) since late prediction may result in more severe consequences [23]. The second type of evaluation function can be expressed as
R M S E = 1 N i = 1 N h i 2 .
Root mean square error (RMSE) has the same weight for early predictions and lag predictions.

3.3. Performance Analysis

In this section, the performance of the proposed deep learning architecture for prognostics is presented. In addition, extensive experiments were performed to investigate the impact of key factors on the results, including the depth of the model and the size of the time window, as well as different optimization algorithms. Compared with the state-of-the-art results on the C-MAPSS dataset, the prediction results demonstrated the superiority of the proposed network.

3.3.1. Performance of the Results

The trained model was used to predict the RUL of different aeroengines in the testing set. The testing set FD001, FD002, FD003 and FD004 contain 100, 259, 100 and 248 sets of aircraft engine simulation data from the unknown state of t 1 to the unknown state of t 2 respectively, and each set of simulation data is truncated to obtain T consecutive cycles data of the aeroengine. The testing set also gives the actual RUL of aeroengines at t 2 to verify the effectiveness of the algorithm. Then, the testing data of T consecutive time cycles is used to predict the RUL of the aeroengine in the unknown state of t 2 .
Overall, the models achieved accurate results for the prediction of the RUL of aircraft engines in the testing set. Based on the two evaluation functions, Table 5 presents the performance of the trained models on the testing set. The model was trained ten times. Using RMSE as the evaluation function, the model performed best in the FD001 testing set, with a mean score of 12.18, while the model performed the worst in FD004 with a mean score of 22.12. It can be seen from Figure 6 that the prediction results of the FD001 and FD003 were better than those of the FD002 and FD004 due to the multiple simulation conditions of FD002 and FD004. At the same time, the prediction result of the algorithm for FD001 was better than that of FD003, because the failure mode of FD003 included high-pressure compressor degradation and fan degradation, while the failure mode of FD001 was only high-pressure compressor degradation.
Figure 7 shows the prediction results of the model. For FD001, the model used had seven layers and the size of the time window was selected as 30. For FD002, the model used had three layers and the size of the time window was selected as 20. For FD003, the model used had three layers and the size of the time window was chosen to be 30. For FD004, the model used had two layers and the size of the time window was selected as 15.
Since the testing set gives the actual RUL of the aeroengines in the unknown state of t 2 , the RUL of aeroengines from t 1 to t 2 can be obtained from this value, e.g., the RUL at time t 1 is the actual RUL at time t 2 plus t 2 t 1 . The function to calculate the RUL from t 2 to t 1 can be expressed as
a c t u a l R U L   a t   t = ( a c t u a l R U L   a t   t 2 ) + (   t 2 t ) ,
where t 1 + N t < t 2 .
When the time window is selected as N, the RUL of aircraft engines from t 1 + N to t 2 can be predicted. Figure 8 shows the predicted results from t1 + 30 to t2 of two randomly selected aeroengines in the FD001 testing set. The RUL prediction values for the No. 17 and No. 24 aeroengines at time t 2 corresponding to the predicted results in Figure 7. In Figure 8, the yellow dashed box represents that the RUL of the aeroengine was a constant value of 125 at the initial stage of aeroengine operation. The predicted result of the No. 17 aeroengine was slightly lower than the actual value at the beginning, but the error was small. With the increasement of the time cycle, the result was more accurate. The predicted result of RUL of the No. 24 aeroengine had slight fluctuations at the initial stage. As the time cycle increased, the predicted and actual values became very close and eventually the more accurate result was obtained.

3.3.2. Effects of the Depth and Time Window

As for the models applied to the FD001 dataset, the depth of the network would be gradually increased from one to eight while other parameters remained unchanged to explore the influence of the depth of the CNN on the results. At the same time, the effect of the size of the TW on the results is also discussed.
With the evaluation function RMSE as a criterion, Figure 9a depicts the prediction results of models with different time windows and depths. When the size of the TW was selected as 10, the value of RMSE grew gradually to 17.64 at the five layers, after which it fluctuated between 17.55 and 17.92. For the algorithm with the TW of 20, the value of RMSE fluctuated between 15.61 and 16.48 from one layer to eight layers, ending at 16.32. Regardless of the TW of 10 or 20, the prediction accuracy of the model did not get better as the depth of the neural network increased. However, when the TW was set to 30, the performance of the model became better as the depth of the layer increased. The increase in the depth of the model after seven layers could not lead to the improvement of the result and would have increased the burden on the network. In this experiment, the seven-layer model with the TW 30 achieved the best result in the FD001 testing set.
Figure 9a shows that the increase of the TW could improve the prediction result because the larger time window meant that more raw information could be covered, which could better reflect the degradation of the aircraft engines [27]. However, the TW could not be increased indefinitely, the maximum allowable TW was determined by the smallest operating cycles present in the testing set. For example, for an engine with an operating history of 20 cycles, it was impossible to create a time window of 30 cycles [22]. Therefore, the TWs selected for FD001, FD002, FD003, and FD004 were 30, 20, 30 and 15, respectively.
As shown in Figure 9b, for the FD002 dataset, as the depth of the model increased from one to three, the prediction accuracy was improved, but if the depth of the model further increased, the prediction result would fluctuate. For the FD003 and FD004 datasets, as the depth of the corresponding model increased, the optimal prediction results were obtained when the third layer and the second layer were respectively reached. If the model depth was continuously increased, the prediction result of the model would fluctuate and increase computational costs.

3.3.3. The Effect of the Optimization Algorithms

An appropriate optimization algorithm is crucial for the prediction results, which can further improve the prediction accuracy. The optimization algorithm has the effects of damping out the oscillations in the gradient descent. In the field of deep learning, optimization algorithms such as Adagrad, Adadelta, RMSprop and Adam are often used for gradient descent. This paper studied the effect of these algorithms on the prediction results. In this set of comparative experiments, the size of the TW was set to 30, and the depth of the deep CNN was seven for the FD001 dataset.
Table 6 presents that Adam had the lowest score with the best performance, while the other algorithms spent more computational costs with higher score. The RMSE of Adam and Adagrad were almost the same, and RMSprop had the largest standard deviation. The learning rate of 0.001 was appropriate to Adam, Adagrad and RMSprop. The reduction of the learning rate will cause the training time to increase, and the larger value of the learning rate will cause the result to oscillate. However, the learning rate of 0.001 was too slow for Adadelta algorithm to converge, so the learning rate of the Adadelta was set to 0.01. According to the time spent in the training process, Adam algorithm ran on the GPU for the shortest time, with the average running time of 72.56s. While the learning rate was increased, the Adadelta algorithm took the longest time on the GPU and cost 621.15s. Adam combines the advantages of Adagrad and RMSprop, having the ability to handle sparse gradients and deal with non-stationary targets. Therefore, from the results of the computational cost and the evaluation function, Adam was the optimal gradient descent algorithm.

3.3.4. Comparing with Related Works

This paper used all the sub-datasets in the NASA C-MAPSS dataset. Some literature has only reported results on the FD001 dataset in terms of RMSE, but in order to fully evaluate the effectiveness of the model, the results of all four sub-datasets were given. In this section, the performance of the proposed method is compared to other state-of-the-art methods reported in the literature.
As shown in Table 7, the proposed models outperformed the existing prediction models in the datasets except for FD003. There are two failure models of FD003, therefore the network proposed in this paper had relatively weak learning ability in this sub-dataset, but it was still better than the results in References [23,28]. FD002 and FD004 correspond to complex simulation conditions, and have more practical significance. The method proposed in this paper achieved better results than the previous methods on these two datasets. The RUL prediction was based on health indicators in References [17,19], and these two methods were only validated on FD001. Compared with these two methods, the proposed network reduced the score on FD001 by 17.64 and 0.63, respectively. A similar study, which was published in Reference [27] and achieved the best results on the C-MAPSS dataset in published papers, were selected to be compared with our method. However, the shortage of this method was that it selected a specific kernel artificially. Therefore, the performance of this method was worse than the proposed method in terms of FD001, FD002 and FD004 datasets. In addition, the proposed network showed its superiority over the other time window-based methods in References [22,23,28].

4. Conclusions

The traditional health indicator-based methods need the long-term tracking of the signals, which are laborious and time-consuming. A novel CNN based on the time window was proposed to tackle this issue. Additionally, the kernel module was constructed, which can let the network learn to select the kernels automatically. The effectiveness of the proposed network was demonstrated using the C-MAPSS dataset. The main contributions of this paper are as follows:
(1) The raw industrial sensor signals were standardized and transmitted to the network for RUL prediction without long-term tracking and constructing HIs that relied on signal processing expertise.
(2) A novel kernel module composed of one-dimensional convolutional kernels of different sizes was proposed for feature extraction in time series.
(3) The 1×1 convolutional kernel was introduced to handle the multiple channels in the kernel module.
However, some limitations still existed in the presented methods. For example, the networks for each sub-dataset were trained and evaluated separately. Besides, the C-MAPSS dataset was created by simulation models in controlled environments. The real world has many uncontrollable events, which should be considered further.

Author Contributions

Methodology, H.Y., Z.S., G.J., F.Z. and X.M.; validation: H.Y., G.J. and Z.S.; writing—original draft preparation, H.Y., Z.S., G.J., F.Z. and X.M.; funding acquisition, F.Z.

Funding

This research was funded by the National Key Research and Development Program of China, grant number 2018AAA0101800.

Conflicts of Interest

The authors declare no conflict of interest.

References

  1. Si, X.S.; Wang, W.; Hu, C.-H.; Zhou, D.-H. Remaining useful life estimation—A review on the statistical data driven approaches. Eur. J. Oper. Res. 2011, 213, 1–14. [Google Scholar] [CrossRef]
  2. Lei, Y.; Lin, J.; He, Z.; Zuo, M.J. A review on empirical mode decomposition in fault diagnosis of rotating machinery. Mech. Syst. Signal Process. 2013, 35, 108–126. [Google Scholar] [CrossRef]
  3. Yin, S.; Li, X.; Gao, H.; Kaynak, O. Data-Based Techniques Focused on Modern Industry: An Overview. IEEE Trans. Ind. Electron. 2015, 62, 657–667. [Google Scholar] [CrossRef]
  4. Lee, J.; Wu, F.; Zhao, W.; Ghaffari, M.; Liao, L.; Siegel, D. Prognostics and health management design for rotary machinery systems—Reviews, methodology and applications. Mech. Syst. Signal Process. 2014, 42, 314–334. [Google Scholar] [CrossRef]
  5. Lei, Y.; Li, N.; Guo, L.; Li, N.; Yan, T.; Lin, J. Machinery health prognostics: A systematic review from data acquisition to RUL prediction. Mech. Syst. Signal Process. 2018, 104, 799–836. [Google Scholar] [CrossRef]
  6. Heng, A.; Zhang, S.; Tan, A.C.C.; Mathew, J. Rotating machinery prognostics: State of the art, challenges and opportunities. Mech. Syst. Signal Process. 2009, 23, 724–739. [Google Scholar] [CrossRef]
  7. Li, N.; Lei, Y.; Lin, J.; Ding, S. An improved exponential model for predicting remaining useful life of rolling element bearings. IEEE Trans. Ind. Electron. 2015, 62, 7762–7773. [Google Scholar] [CrossRef]
  8. Lei, Y.; Li, N.; Gontarz, S.; Lin, J.; Radkowski, S.; Dybala, J. A Model-Based Method for Remaining Useful Life Prediction of Machinery. IEEE Trans. Reliab. 2016, 65, 1314–1326. [Google Scholar] [CrossRef]
  9. Yoo, Y.; Baek, J.-G. A Novel Image Feature for the Remaining Useful Lifetime Prediction of Bearings Based on Continuous Wavelet Transform and CNN. Appl. Sci. 2018, 8, 1102. [Google Scholar] [CrossRef]
  10. Tian, Z. An artificial neural network method for remaining useful life prediction of equipment subject to condition monitoring. J. Intell. Manuf. 2012, 23, 227–237. [Google Scholar] [CrossRef]
  11. Benkedjouh, T.; Medjaher, K.; Zerhouni, N.; Rechak, S. Health Assessment and Life Prediction of cutting tools based on support vector regression. J. Intell. Manuf. 2015, 26, 213–223. [Google Scholar] [CrossRef]
  12. Hong, S.; Zhou, Z.; Zio, E.; Hong, K. Condition assessment for the performance degradation of bearing based on a combinatorial feature extraction method. Digit. Signal Process. 2014, 27, 159–166. [Google Scholar] [CrossRef]
  13. Huang, Z.; Xu, Z.; Wang, W.; Sun, Y. Remaining Useful Life Prediction for a Nonlinear Heterogeneous Wiener Process Model with an Adaptive Drift. IEEE Trans. Reliab. 2015, 64, 687–700. [Google Scholar] [CrossRef]
  14. Gebraeel, N.; Lawley, M.; Liu, R.; Parmeshwaran, V. Residual life predictions from vibration-based degradation signals: A neural network approach. IEEE Trans. Ind. Electron. 2004, 51, 694–700. [Google Scholar] [CrossRef]
  15. Hanachi, H.; Jie, L.; Banerjee, A.; Ying, C.; Koul, A. A Physics-Based Modeling Approach for Performance Monitoring in Gas Turbine Engines. IEEE Trans. Reliab. 2015, 64, 197–205. [Google Scholar] [CrossRef]
  16. Lu, C.; Tao, L.; Fan, H. An intelligent approach to machine component health prognostics by utilizing only truncated histories. Mech. Syst. Signal Process. 2014, 42, 300–313. [Google Scholar] [CrossRef]
  17. Louen, C.; Ding, S.X.; Kandler, C. A new framework for remaining useful life estimation using Support Vector Machine classifier. In Proceedings of the Control & Fault-tolerant Systems, Nice, France, 9–11 October 2013. [Google Scholar]
  18. Guo, L.; Li, N.; Jia, F.; Lei, Y.; Lin, J. A recurrent neural network based health indicator for remaining useful life prediction of bearings. Neurocomputing 2017, 240, 98–109. [Google Scholar] [CrossRef]
  19. Malhotra, P.; Tv, V.; Ramakrishnan, A.; Anand, G.; Vig, L.; Agarwal, P.; Shroff, G. Multi-Sensor Prognostics using an Unsupervised Health Index based on LSTM Encoder-Decoder. arXiv 2016, arXiv:1608.06154. [Google Scholar]
  20. Guo, L.; Lei, Y.; Li, N.; Yan, T.; Li, N. Machinery HI construction based on convolutional neural networks considering trend burr. Neurocomputing 2018, 292, 142–150. [Google Scholar] [CrossRef]
  21. Lei, Y.; Li, N.; Lin, J. A New Method Based on Stochastic Process Models for Machine Remaining Useful Life Prediction. IEEE Trans. Instrum. Meas. 2016, 65, 2671–2684. [Google Scholar] [CrossRef]
  22. Lim, P.; Chi, K.G.; Tan, K.C. A time window neural network based framework for Remaining Useful Life estimation. In Proceedings of the International Joint Conference on Neural Networks, Vancouver, BC, Canada, 24–29 July 2016. [Google Scholar]
  23. Zhang, C.; Lim, P.; Qin, A.K.; Tan, K.C. Multiobjective Deep Belief Networks Ensemble for Remaining Useful Life Estimation in Prognostics. IEEE Trans. Neura. Netw. Learn. Syst. 2017, 28, 2306–2318. [Google Scholar] [CrossRef] [PubMed]
  24. Schmidhuber, J. Deep learning in neural networks: An overview. Neural Netw. 2015, 61, 85–117. [Google Scholar] [CrossRef] [PubMed] [Green Version]
  25. Szegedy, C.; Liu, W.; Jia, Y.; Sermanet, P.; Reed, S.; Anguelov, D.; Erhan, D.; Vanhoucke, V.; Rabinovich, A. Going Deeper with Convolutions. In Proceedings of the IEEE Conference on Computer Vision and Pattern Recognition (CVPR), Boston, MA, USA, 7–12 June 2015. [Google Scholar]
  26. Hinton, G.E.; Salakhutdinov, R.R. Reducing the Dimensionality of Data with Neural Networks. Science 2006, 313, 504–507. [Google Scholar] [CrossRef] [PubMed] [Green Version]
  27. Li, X.; Ding, Q.; Sun, J.-Q. Remaining useful life estimation in prognostics using deep convolution neural networks. Reliab. Eng. Syst. Saf. 2018, 172, 1–11. [Google Scholar] [CrossRef] [Green Version]
  28. Babu, G.S.; Zhao, P.; Li, X.L. Deep CNN Based Regression Approach for Estimation of Remaining Useful Life. In Proceedings of the International Conference on Database Systems for Advanced Applications, Dallas, TX, USA, 16–19 April 2016. [Google Scholar]
  29. Saxena, A.; Kai, G.; Simon, D.; Eklund, N. Damage propagation modeling for aircraft engine run-to-failure simulation. In Proceedings of the International Conference on Prognostics & Health Management, Denver, CO, USA, 6–9 October 2008. [Google Scholar]
  30. Xu, J.; Wang, Y.; Xu, L. PHM-Oriented Integrated Fusion Prognostics for Aircraft Engines Based on Sensor Data. IEEE Sens. J. 2014, 14, 1124–1132. [Google Scholar] [CrossRef]
Figure 1. Remaining useful life (RUL) prediction: (a) Based on health indicator (HI); (b) based on time window.
Applsci 09 04813 g001
Figure 2. The flowchart of the proposed architecture.
Applsci 09 04813 g002
Figure 3. The kernel module.
Applsci 09 04813 g003
Figure 4. Convolution operation: (a) Based on HI; (b) using 1 × 1 convolution.
Applsci 09 04813 g004
Figure 5. The proposed network.
Applsci 09 04813 g005
Figure 6. Comparison between the score of the first evaluation function (S) and root mean square error (RMSE) when the number of aircraft engines (N) is set to 1.
Applsci 09 04813 g006
Figure 7. Prediction results on the testing dataset.
Applsci 09 04813 g007
Figure 8. Part of prediction results on FD001 testing set: (a) Aircraft engine No. 17; (b) aircraft engine No. 24.
Applsci 09 04813 g008
Figure 9. Prediction results: (a) FD001;(b) FD002, FD003 and FD004.
Applsci 09 04813 g009
Table 1. The number of different kernels in each layer (time window 30).
LayersInputOutputThe Number of the Different Kernels
-1 × 11 × 11 × 11 × 1Sum
1 × 13 × 15 × 17 × 19 × 1
First convolution–pooling layer30 × S × 815 × S × 80-4444
161616161680
Second convolution–pooling layer15 × S × 807 × S × 160-16161616
3232323232160
Third convolution–pooling layer7 × S× 1603 × S × 256-323232-
64646464-256
Fourth convolution layer3 × S × 2563 × S × 256-64---
128128---256
Subsequent layers3 × S × 2563 × S × 256-64---
128128---256
Table 2. Information of NASA C-MAPSS dataset.
Sub-DatasetFD001FD002FD003FD004
Engine models for training100260100249
Engine models for testing100259100248
Simulation conditions1616
Fault modes1122
Table 3. The selected time-varying variables.
The Selected Time-Varying VariablesUnits
Total temperature at LPC outlet°R
Total temperature at HPC outlet°R
Total temperature at LPT outlet°R
Total pressure at HPC outletpsia
Physical fan speedrpm
Physical core speedrpm
Static pressure at HPC outletpsia
Ratio of fuel flow to Ps30pps/psi
Corrected fan speedrpm
Corrected core speedrpm
Bypass ratio--
Bleed enthalpy--
HPT coolant bleedl bm/s
LPT coolant bleedl bm/s
Table 4. Training parameters.
Sub-DatasetFD001FD002FD003FD004
Length of the TW10/20/30203015
Training samples19731/18731/1773148,81921,82057,763
Batch size760/721/68222208091992
Epoch number40403050
Table 5. The performance of the model (std: standard deviation).
Sub-DatasetFD001FD002FD003FD004
RMSE (mean)12.1819.5815.6722.12
RMSE (std)0.310.270.460.47
RMSE (best)11.7719.2414.9721.32
RMSE (worst)12.6720.2916.1622.74
S (mean)224.162494.351279.854523.32
S (std)23.08264.54245.31809.26
S (best)200.552118.57865.063268.99
S (worst)261.693012.731620.356163.57
Table 6. Computational cost and result.
Optimization AlgorithmsLearning RateEpoch NumberRMSE (Mean)RMSE (Std)GPU Time (s)
Adam0.0014012.180.3172.56
Adagrad0.00115012.220.24303.49
Adadelta0.0130012.340.12621.15
RMSpro0.0015013.890.69102.16
Table 7. Performance of various methods on the C-MAPSS dataset (RMSE).
ApproachFD001FD002FD003FD004Constant Value of RUL in the Early Stage
Support vector machine [17]29.82N/AN/AN/ANot applied
First attempt of CNN [28]18.4530.2919.8229.16130
Random forest [23]17.9129.5920.2731.12Not applied
Gradient boosting [23]15.6729.0916.8429.01Not applied
ANN [22]15.16N/AN/AN/ANot provided
MODBNE method [23]15.0425.0512.5128.66Not applied
LSTM [19]12.81N/AN/AN/A125
CNN with time window [27]12.6122.3612.6423.31125
Proposed method12.1819.5815.6722.12125

