Abstract
Nanoscale CMOS technology has encountered severe reliability issues especially in on-chip memory. Conventional word-level error resilience techniques such as Error Correcting Codes (ECC) suffer from high physical overhead and inability to correct increasingly reported multiple bit flip errors. On the other hands, state-of-the-art applications such as image processing and machine learning loosen the requirement on the levels of data protection, which result in dedicated techniques of approximated fault tolerance. In this work, we introduce a novel error protection scheme for memory, based on feature extraction through Principal Component Analysis and the modular-wise technique to segment the data before PCA. The extracted features can be protected by replacing the fault vector with the averaged confinement vectors. This approach confines the errors with either single or multi-bit flips for generic data blocks, whilst achieving significant savings on execution time and memory usage compared to traditional ECC techniques. Experimental results of image processing demonstrate that the proposed technique results in a reconstructed image with PSNR over 30 dB, while robust against both single bit and multiple bit flip errors, with reduced memory storage to just 22.4% compared to the conventional ECC-based technique.
1. Introduction
During the last few decades, the semiconductor industry has experienced continuous scaling of CMOS technology, guided by Moore’s Law [1], to design and fabricate devices with higher speed, less area and power consumption. Such scaling is inarguably questioned by the constraint of quantum physics, where the state-of-the-art technology nodes are already approaching the thickness of a single atom. The current nanoscale CMOS technology is already facing several challenges, resulting in serious reliability issues. The International Technology Roadmap for Semiconductors (ITRS) has announced that reliability and resilience across all design layers as a long-term grand challenge [2].
The aggressive shrinking of transistors has made circuits and especially memory cells more prone to parametric variations and soft errors that are expected to double for every technology generation [3], thus threatening their correct functionality. The increasing demand for larger on-chip memory capacity which has exceeded 70% of the die area is expected to worsen the failure rates [4] further, thus indicating the need for immediate adoption of effective fault-tolerant techniques.
Techniques such as Error Correcting Codes (ECC) [5] and Check pointing [6] may have helped in correcting memory failures. However, they incur a large area, performance and power overheads ending up wasting resources and contracting with the high memory density requirements. With an effort to limit such costs, recent approaches exploit the tolerance to faults/approximations of many applications [7] and relax the condition of 100% correctness. The main idea of such methods is the restricted use of robust but power-hungry bit-cells and techniques such as ECC to protect only the bits that play a more significant role in shaping the output quality [8,9]. Another group of approaches extend general instruction sets with approximation features and specialized hardware units [10,11,12]. These methods are still based on redundancy and neglect some fundamental characteristics of the application data.
In the aspect of fault tolerance techniques of exploring application characteristics, the error resilient system architecture (ERSA) [13] introduces probability-based error resilience techniques for recognition, data mining, and synthesis (RMS) applications. For instance, low-cost boundary checkers are adopted for memory access and timeout errors. Our previous work in [14] proposed the concept of statistical error confinement, instead of adding circuit level redundancy to correct memory errors tries, to limit the impact of those errors in the output quality by replacing any erroneous data with the best available estimate of those data.
However, the limitation of the above techniques is evident where the statistical behaviors need to be either discovered through the broad set of simulation or involve expert knowledge, before adjusting the corresponding boundary checkers or estimations. In this work, we enhance the error confinement technique as a generic fault tolerance approach. By applying the well-known compression algorithm Principle Component Analysis (PCA) to the original data, the features of generic data blocks are extracted with low-cost error confinement. We present the trade-off between quality of reconstructed data and the amount of extracted principal components. While PCA suffers from high computing cost for the massive data block, the modular-wise technique is utilized to segment the data before PCA is applied. Combined with low-cost parity-based error detection, the approach confines the errors, both single and multi-bit flips, for generic data blocks while achieves significant savings in execution time and memory usage than ECC techniques.
2. Background
2.1. Principal Component Analysis
Principal component analysis (PCA) was first proposed in 1901 [15], and was later developed in several different works during the last decades. It was popularized in computer vision by the eigen faces method [16], a face recognition model still relevant and used in current days.
Given a set of samples, PCA yields a set of orthonormal vectors that can be used to linearly project the samples into a new space. This space maximizes the variance of projected samples and minimizes their least mean square error, that is, it minimizes the difference between the projected sample and its reconstruction back to the original space [17]. This characteristic makes PCA suitable for reduction of dimensionality. The data comes from many kinds of sources, such as images [18].
The process of dimensionality reduction is as follows [19]. The dataset matrix X of dimension m × n, is given with real entries. The column vectors of matrix X are indexed as [x1,x2,...,xn] and contain m real scalars in each column vector.
The input dataset must be centered to make the mean equal to 0 for all the column vectors of the input data matrix X. The centering of the data is advantageous as it minimizes the sum of squared errors and removes undesirable fluctuations. The mean centering process is accomplished by subtracting the mean of each individual column vector for i = 1, 2, ..., n from each element of the individual column vector.
The mean centering process can be shown for i-th column vector as:
subtracting the mean from column vector ,
where the column vector is now a zero-mean centered vector.
The matrix X is transformed to have zero mean centered column vectors,
After the process of mean centering, matrix X is used to calculate the covariance matrix S and normalize the covariance matrix S:
where the covariance matrix S has the dimension of n * n and is a symmetric matrix. There are two features about the covariance matrix S, for i, j = 1, 2, ..., m [20]:
All the main diagonal entries of the covariance matrix S, such as are the variance of the i-th diagonal element of the matrix X.
All off-diagonal entries of the covariance matrix S, such as where i ≠ j, are the covariance between the i-th and j-th entries of the matrix X.
Analysis of the multivariate dataset can be simplified when most or all the elements in the covariance matrix S are uncorrelated. It indicates the covariance matrix should be diagonal or nearly diagonal. The similar simplification can be applied to PCA, with an orthogonal square matrix of size n * n. If the covariance matrix S with eigenvalues of λ1, λ2, ..., λn and diagonal matrix ∧ has equal entries arranged as λ1 ≥ λ2 ≥ ... ≥ λn in its diagonal, and there is an orthogonal matrix V, whose columns are the corresponding unit eigenvectors v1, v2, ..., vn, then and [21]. The diagonalization process of the covariance matrix can be accomplished using Eigen decomposition.
After the Eigen decomposition is completed, PCA keeps k eigenvectors () corresponding to the k largest eigenvalues. These eigenvectors are so-called principal components (PCs) of S. It is proven that a projection onto the space defined by these eigenvectors provides the optimal reduced representation of the data [22].
Let VK be the matrix whose columns are the first k principal components of S. The projection Y of the data X of mean centering into this eigen space is given by
The more principal components are used in the projection, the less information loss there is.
2.2. Fault Tolerance Techniques for Memory
There are a variety of ways to improve the reliability of a memory system. Basic single bit error detection without correction can be accomplished using parity checking. More sophisticated error detection exploits check summing techniques such as CRCs or MD5 signatures. When error correction is desired, different error-correcting codes (ECC) such as Hamming or Reed–Solomon codes can correct single and multiple bit errors. Another way to implement a fault tolerant memory subsystem is to make multiple copies of the data. These techniques are also orthogonal and can be used together [23].
One way is to implement the memory as a Redundant Array of Independent Disks (RAID) array [24,25], which implements redundancy by distributing a piece of data across multiple disks (or in this case, FPGA memories) in such a way that any one (or two, in the case of RAID level 6) disks (or memories) could fail without corrupting the stored data. These fault tolerance techniques can be used with FPGA external memory or with the FPGA’s internal Block RAM (BRAM).
However, the above method incurs large area and power overheads with high memory density requirements. Power hungry bit-cells management only protecting the crucial data is used [12,13,14]. Other approaches that extend generic instruction sets with approximation features and specialized hardware units exist [15,16,17]. However, these methods are still based on redundancy which yields nontrivial area and power overheads.
3. PCA-Based Error Confinement Technique
In this section, we propose a PCA-based error confinement technique for data blocks in memory. As shown in Figure 1, upon data storing, the technique first performs modularization to the original data to reduce processing overhead. Afterwards, PCA is applied to individual data blocks to extract the data features. The Error Confinement Vectors (ECVs) are further calculated according to the extracted features to implement low-cost error confinement. During data read, errors in eigenvectors and projection data are detected, followed by ECV assisted error confinement method during data reconstruction. This section introduces the steps of proposed technique.
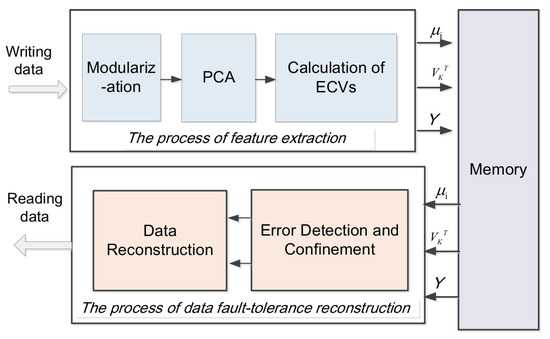
Figure 1.
The overall block diagram of error confinement technique based on PCA.
3.1. Modularization for Reducing Computation and Extracting Local Features
The computational cost of PCA heavily depends on the size of covariance matrix calculation and the dimension of Eigen vectors. For generic data, it is beneficial to preprocess the original data by dividing them into sub data blocks. Such procedure is named as modularization in data compression. Furthermore, data modularization assists in the extraction of local features of the original data. Consequently, modularization before PCA is applied offers less lost in data quality upon reconstruction and achieves significant speedup in both PCA and data reconstruction. The method of Feature extraction and reconstruction of original data with modular PCA is shown in Figure 2. For the data X to store, we first divide it into multiple sub-blocks Xi ( i from 1 to Nsub, and Nsub is the total number of sub data blocks), then we respectively extract the features of those sub-blocks based on PCA. Finally, each sub block data is reconstructed from the corresponding feature. After getting the reconstructed data of each sub block, the reconstructed data of the original data X is reassembled with the reconstruction data of sub-block according to the original data block structure.
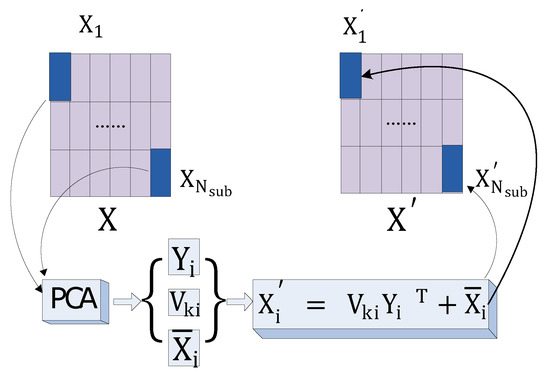
Figure 2.
Feature extraction and reconstruction of original data with modular PCA.
It is important to analyse how modularization strategies affect the execution time of PCA. Besides, the analysis on the effect of modularization to the quality of reconstructed images is discussed in detail in Section 3.2. The main operations of PCA are matrix multiplication and Eigen decomposition. The modularization strategy needs to be analysed from two dimensions: horizontal and vertical. Assume the dimension of matrix X is , and the size of sub block is , then the row can be divided into groups, and the column can be divided into groups. This gives the total number of sub-blocks as = . According to the operational steps of PCA, the time complexity is analysed as follows:
- Subtracting the mean from the element of matrix X as shown in Equation (4). The time complexity for each sub-block is , then the total time complexity of this step for all sub-blocks T1 is:
- Calculating the covariance matrix S and normalizing the covariance as shown in Equation (5). We can get a covariance matrix of dimension for each sub block. The time complexity for each sub-block is , then the total time complexity of this step for all sub-blocks T2 is:
- Computing eigenvalues and eigenvectors by Eigen decomposition. According to [26], The time complexity of calculating eigenvectors for a matrix need , so the total time complexity of this step for all sub-blocks T3 is:
- Projecting the data X to the orthogonal space defined by the matrix composed of eigenvectors according to Equation (6). If the largest k principal elements are retained, the dimension of the matrix composed of eigenvectors is . The time complexity of projecting the sub data blocks Xi is , and k can be expressed as , then the total time complexity of this step for all sub-blocks T4 is:
To sum up, for modularization operation, the total time complexity from step 1) to step 4) is:
It can be clearly seen from Equation (11) that the total time complexity decreases with the increment of the longitudinal dimension a of the sub-block and decreases with the decrement of the transverse dimension b of the sub-block, so the modularization strategy with vertical rectangle sub-blocks can promote the performance of calculation.
3.2. Applying PCA to Memory Elements
This section we explain the procedures of applying PCA for dimension reduction of the data under protection. The block diagram is shown in Figure 3. The specific steps are as follows:
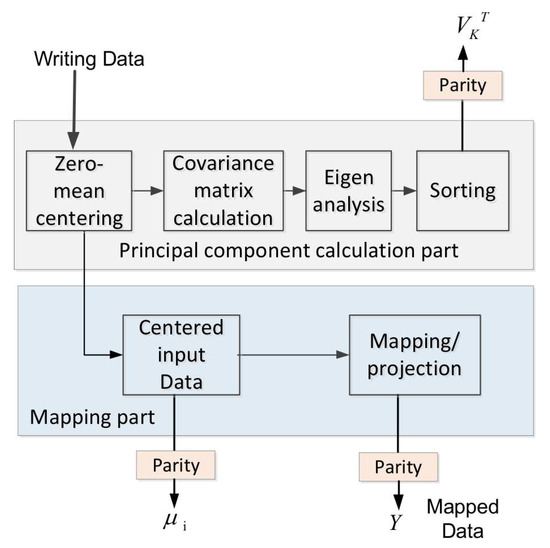
Figure 3.
Extraction of principal components and reduction of dimensions to memory data with PCA.
- Prepare the data to be stored as as Equation (1).
- Calculate the covariance matrix S according to Equation (5).
- Obtain the eigenvalues and corresponding eigenvectors of S by the Eigen decomposition: , where V is the orthogonal matrix, and its columns are the corresponding unit eigenvectors V = (v1, v2, ⋯, vn). ∧ is the diagonal matrix consisting of the eigenvalues λ1, λ2, ..., λn of the covariance matrix. Sort the eigenvalues in descending order (λ1 ≥ λ2 ≥ ... ≥ λn) as well as reorder their corresponding eigenvectors. The reordered eigenvectors are called the principal components (PCs) of the data X.
- Project the data X to the orthogonal space defined by the matrix V according to Equation (6). VK is the first k columns of V, and k is the number of PCs reserved. The dimension of projection data Y is k × m (k << n). The contribution rate (CR) of PCs to the original data is expressed as:High contribution rate leads to accurate reconstructed data, however increase extra storage and computational efforts. We explore the tradeoff between CR and physical overhead in the experiment section and generalize the empirical suggestions.
- Encode each element of the projection data Y, mean vector , and eigenvectors with a single parity for error detection (refer to III.D.1 for details).
- Write , and as well as their parity encodings into the memory. The dimension of such extracted features is far smaller than the original data, which dramatically reduces the storage space.
Noted that PCA is not the only candidate to realize the error confinement technique. We illustrate the flow by using PCA since it is more straightforward and generic than other candidates, such as Singular Value Decomposition (SVD).
3.3. Calculation of Error Confinement Vectors (ECVs)
The establishment of error confinement vector by averaging each dimensional value separately is inspired by the operation of mean pooling in convolutional neural networks. The mean pooling layers merges feature points in a small spatial neighborhood at one layer into new features in the next layer [27,28]. Its function is to progressively reduce the spatial size of the representation to reduce the number of parameters and computation in the network, and hence to also control over-fitting.
In this paper, we consider sub-blocks to be an adjacent local area and have similar features, and use the idea of mean-pooling to consider the features of the same latitude of the projection data and the eigenvectors as a neighborhood and then average the different features within the neighborhood. When there is an error in projection data or the eigenvectors , the error data can be replaced by the value of the corresponding dimension of the average vector respectively.
From the process of data dimension reduction and reconstruction, we know that the projection data and the eigenvectors contain the information of the principal components, and these main components are presented in the form of k-dimensional vectors corresponding to descending order of eigenvalues. In this paper, we use the idea of mean-pooling to consider the features of the same latitude of the projection data and the eigenvectors as neighborhood and then average the different features within the those. By averaging each dimensional eigenvalue separately, an k-dimensional average vector is obtained, which is used to represent the average eigenvector of the projection data and the eigenvectors .
Specifically, for the eigenvectors matrix , as shown in Figure 4a, the first column of eigenvectors of corresponds to the largest eigenvalue, and the k-th column of corresponds to the smallest eigenvalue. Referring to the idea of mean-pooling, we obtain the average vector of sub-block by averaging each dimensional features of the eigenvectors, to represent the average eigenvector of the different eigenvectors. The method of calculating the column average vector is as follows:
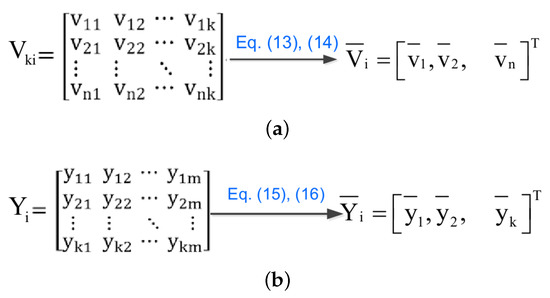
Figure 4.
The overall block diagram of error confinement technique based on PCA. (a) Generating a column average vector of , (b) Generating a column average vector of .
And the i-th element (i from 1 to n) can be expressed as:
Similarly, for the projection data , as shown in Figure 4b, column vectors represent the m samples in k major dimensions. Referring to the idea of mean-pooling, we obtain the average vector by averaging each dimensional features of the column vectors, which can be used to approximate any columns of the projection data . The method of calculating the column average vector is as follows:
And the i-th element (i from 1 to k) can be expressed as:
3.4. Error Detection and Confinement Method
The approximate data is restructured by the projection data , mean matrix , and the eigenvectors . Potential errors in the unprotected compressed data will result in significant loss in the quality of reconstructed data, which implies the need for a fault tolerance technique with high insurance for , and . The traditional ECC-based method suffers from the ability for multi-bits error detection while incurs significant physical overheads. On the other hand, the proposed error confinement method uses the mean pooling-based confinement vectors to approximate the correct values, which saved the computational cost and extra storage.
3.4.1. Error Detection
For error detection, we encoded each of the 32-bit data of the compressed matrix data with a single parity bit which is sufficient for detecting a single fault. Single parity bit, used as an illustrative example in this work, is sufficient to detect all odd number of bit-flip errors the protected data element. The method of parity encoding for is shown in Figure 5, while parity encoding for follows the same method.
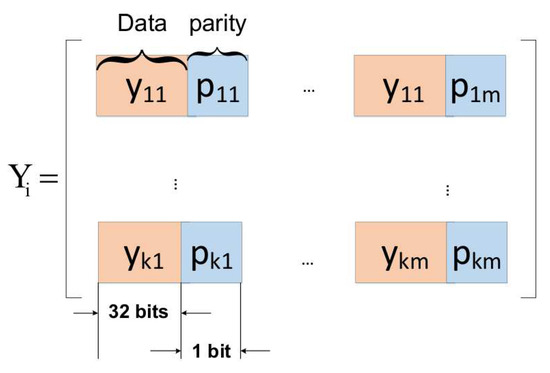
Figure 5.
Adding parity bits to projection data .
3.4.2. Error Confinement
When there is an error in (i from 1 to n, and j from 1 to k) of the eigenvectors matrix VKi, the error bit can be replaced by the corresponding data (i from 1 to n) of the average vector . The method of correcting error data of the eigenvectors VKi with the average vector is shown in Figure 6a. When an error is detected in element of the projection matrix data , the scale of the error is confined by replacing the erroneous data with the corresponding element in the confinement vector . Such procedure is shown in Figure 6b.
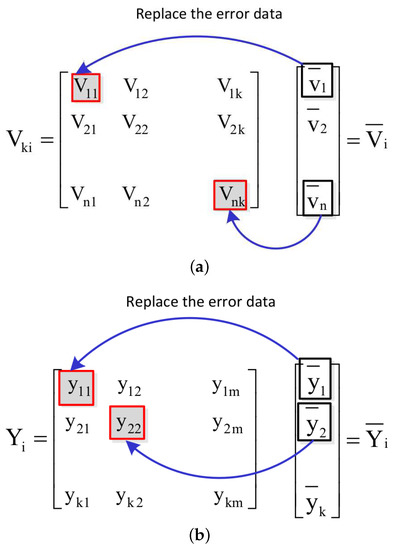
Figure 6.
Correcting erroneous data with the average vectors. (a) Correcting error in the eigenvectors VKi with average vector , (b) Correcting error in the projection data with average vector .
3.5. Data Reconstruction
As known by Section 2, the projection process for each sub-block can be expressed as:
where i is from 1 to Nsub and Nsub is the total number of sub blocks. Therefore, the data reconstruction of each sub-block can be expressed as:
After getting the reconstructed data of each sub-block, a large matrix data is reassembled with the reconstruction data of sub-block according to the original data block structure, which is the result of fault-tolerant reconstruction of the original data.
4. Case Study
4.1. Experimental Setup
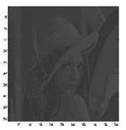
To demonstrate the efficacy of the proposed error confinement technique, we adopt image encoding and decoding as case study of error confinement, which can better visualize the quality of protection under fault injection. As shown in Figure 7, six typical images are chosen to verify the feasibility of proposed method for images with various features. The quality of the output image compared to the original one is evaluated using the peak signal to noise ratio (PSNR) [29]. A typical PSNR value for an acceptable lossy image is 30 dB.
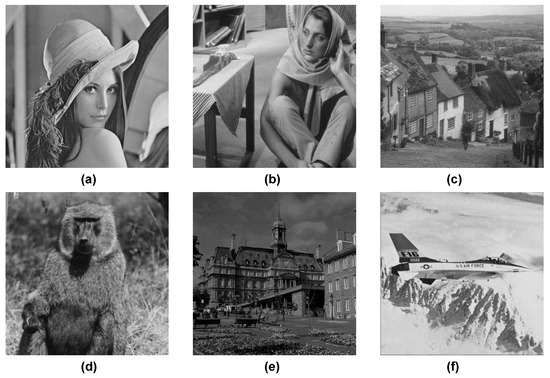
Figure 7.
Six images to test feasibility of proposed method for memory protection.
Our experimental platform is based on Ubuntu 16.04.1 LTS, and software tools are GCC 5.4.0 and QMake 2.01a. The PCA-based error confinement is implemented in C++, where the flow of experiment is presented in Figure 8.
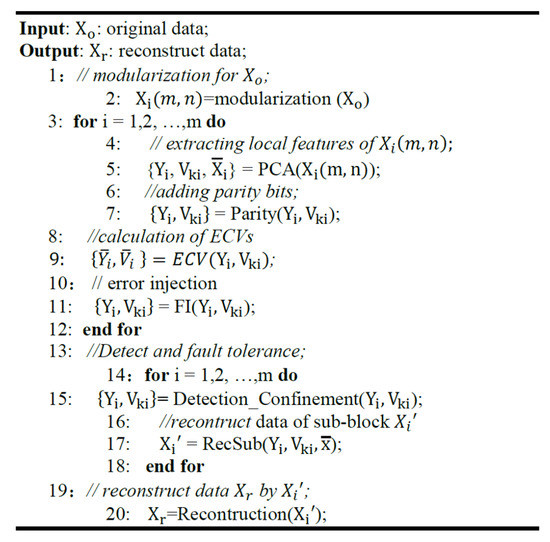
Figure 8.
Pseudo code: error confinement for memory based on PCA.
The storage space occupied by is much smaller than the one occupied by the projection data Yi or the eigenvectors VKi, so we can roughly treat that the probability of an error occurring in is extremely low and can even be ignored. The following experiments address the fault tolerant reconstruction of the original data when errors occur in the projection data Yi or the eigenvectors VKi.
To demonstrate the validity of the proposed error confinement technique, we first use random functions to generate random numbers which determine the location of the errors, then we force the bit flipped errors in those location, which can be used to simulate real random errors.
For comparison, we replicated a similar infrastructure by adopting conventional single error correction double error detection (SECDED) ECC of Hamming coding format H(38, 32), which requires six parity bits for encoding each 32 bit memory word.
4.2. Experimental Results
4.2.1. Exploration of Modularization
According to [30,31], partitioning the image first before applying PCA to partitioned sub-blocks can not only effectively extract the local characteristics of the image, but also speed up the dimensionality reduction and reconstruction of the image. Given this, in this experiment, we cut the images of 512 × 512 into several sub-blocks, then extract principal components and reduce dimensions on sub-blocks with PCA. Afterwards, the reconstruction results of the sub-blocks can be combined to get the reconstruction result of the original image.
Figure 9 compares the reconstruction time and quality of image (a) in Figure 7 of different size sub-blocks in the case of retaining only 50% numbers of PCs. As can be seen from Figure 9, cutting into 256 × 8 sub-blocks ensures less running time and better reconstruction quality.
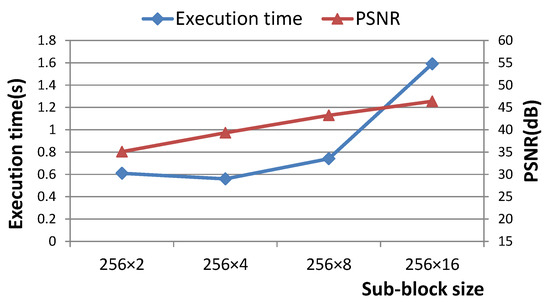
Figure 9.
Comparison of execution time and quality of the reconstructed image (a) in Figure 7 under different cutting dimensions with 50% remaining principle components.
For an input image of size 512 × 512, we divide it into 128 sub-blocks, and the size of each sub-block is 256 × 8. The results of dimensionality reduction and image reconstruction with PCA are shown in Table 1. The relevant parameters are defined as follows:

Table 1.
Results of dimension reduction and image reconstruction with proposed method for image (a) in Figure 7.
K: The number of principal components.
Size: The size of the projection data Y and eigenvectors Vk.
Rate: The ratio between the size of compressed data (Y and Vk) and the size of original image (512 × 512).
As can be seen from Table 1, when the reserved the number of principal components (PCs) is equal to 2, 3, or 4, the quality of the reconstructed image is guaranteed (the PSNR of image is 31.1) and the size of the projection data Y and the eigenvectors VK is also significantly reduced. It’s obvious that more reserved PCs leads to better quality of reconstructed images, while also increases the physical overheads of execution time and memory usage. Practically, it is wise to strike a balance between quality and overhead by reserving appropriate number of PCs on the premise of satisfying the quality of the image.
Beyond the developing trend between PSNR, sub-block dimension, K and execution time for a single image, it is interesting to explore how different images affect optimal choice of sub-block size, giving a demanded PSNR value. As shown in Figure 10, six images in Figure 7 are analysed in terms of PSNR and execution time subjecting to different sub-block sizes. While execution time among images in Figure 10b show very small differences, it is observed in Figure 10a that for all images, the trends of PSNR increase with increased sub-block size. However, the absolute PSNR values and the slope of its increasing vary among images.
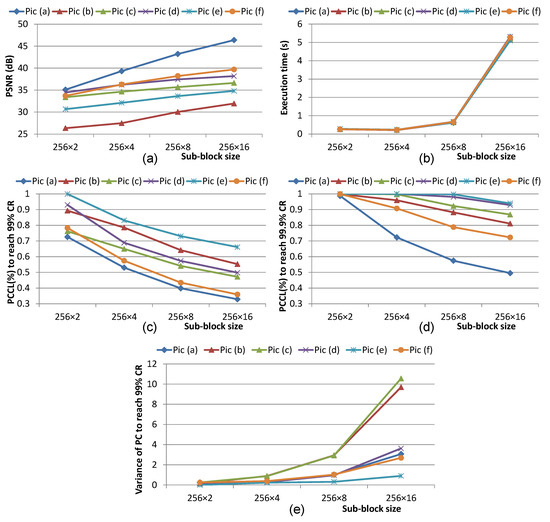
Figure 10.
Results of six images under four sub-block sizes on (a) PSNR with half retaining PC (b) execution time (c) PC concentration level (PCCL) for 99% CR (d) PCCL for 99.9% CR (e) variance of PC for 99% CR.
To explain the achieving difference in PSNR among images, PC concentration level (PCCL) is introduced as the percentage of remaining principle components in order to achieve a specified contribution rate (CR) averaged across all sub-blocks. A smaller PCCL value implies that the targeting image is more effective to be projected onto the space of fewer uncorrelated vectors. Figure 10c,d shows the PCCL levels to reach 99% CR and 99.9% CR for six images, respectively. The statistics infer a strong correlation between PCCL of original images and PSNR of reconstructed images. As the size of sub-block increases, the PCs of subblocks tend to concentrate for all images. Concentrated PCs show that removing high orders of PC results in fewer information loss which gives a higher PSNR of reconstructed image.
Viewing across multiple images, it is discovered that different images show various PCCL under the same sub-block size. For instance, image (a) and (e) have the smallest and highest PCCL. By carefully viewing the images, it is shown that image (e) has significantly complex textures in majority of sub-blocks, other than the sub-blocks for sky, while image (a) has simpler textures in most sub-blocks, other than the hairs of Lena. Consequently, PCA on image (a) gives higher PSNR than image (e), which shows proves again how PCCL affects PSNR.
However, despite the correlated trend, detailed observation implies that PCCL on a specified CR level does not result in a 1-to-1 correspondence with PSNR. For instance, image (b), which gives the lowest PSNR value, does not show the highest PCCL for all sub-block sizes. When the CR level of PCCL is increased to 99.9% as shown in Figure 10d, the PCCL of image (b) even improves to the third best. To investigate on such issue, we find out that PCCL of an image is the mean PCCL values of its sub-blocks, which does not reflect the differences of PC concentration for individual sub-blocks. Therefore, variance of PC to achieve 99% CR across individual sub-blocks is calculated for six images, which is plotted in Figure 10e. It is observed that image (b) has almost the largest variance, which leads to a disastrous deterioration to the PSNR, even though its PCCL is not the largest one.
The key insights from the above analysis is that the features of images (PCCL, sub-block variance and even further features) have strong influence on the optimal strategy of PCA modularization to achieve a certain PSNR with minimal cost of execution time. Statistical methods such as machine learning can be used to form such strategy finding as a regression or classification problem, which will be explored in the future work.
4.2.2. Evaluation of Protection Quality
Table 2 visualizes the images under protection, qualities in terms of PSNR values, and ratio of injected single bit-flip errors which is evaluated by error rate (ER). ER is calculated as the total amount of injected errors divided by the total amount of pixels of the image. For proposed technique, two principal components are reserved during PCA. It is observed that when the ER value reaches 0.0019, it leads to significant degradation in PSNR compared to the error-free case. However, the quality of the picture is significantly improved (PSNR > 30) after adopting proposed error confinement method in the process of data reconstruction proposed in this paper. Compared with our proposed method, the quality of the image under ECC protection is obviously worsened when the error rate is large.
Table 2.
Output images under different error injection rate and protection methods.
We quantify the PSNR achieved by our approach with a SECDED ECC for all images in Figure 7. Figure 11a shows the obtained results in case of protecting the projection data Y and eigenvectors Vk with different techniques under various error rate of single bitflips. We observed that as the error rate of the injected single bitflips increases, the output quality achieved by the proposed method is slightly reduced. When the error rate of the injected single bitflips is small, the two techniques can both achieve good fault tolerance. But when the error rate is larger than 0.003, the quality of the image by using ECC technique has decreased rapidly. In contrast, the qualities of the images are only slightly reduced by the proposed method. For the error rate of 0.004 and beyond, the proposed method achieves better PSNR than the ECC method. For various images, the proposed technique achieves similar effect of protection with differences of absolute PSNR values due to the differences of features in the original images. In case of ECC and no protection, only averaged PSNR curves for six images are compared for simplicity.
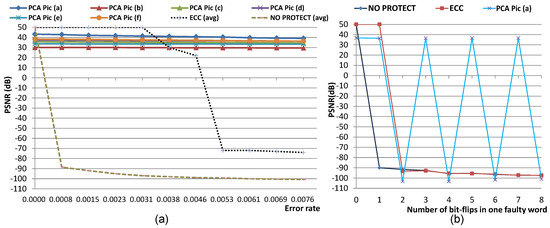
Figure 11.
Single-bit (a) and multiple-bit (b) error rates versus PSNR under no protection, ECC and proposed PCA technique.
The slight degradation of PSNR by our approach can be attributed to the fact that in some cases, the value of the erroneous data VK or Y that is being substituted by the corresponding value of the average vector V* or Y*. In these cases the replacement will not be as accurate and thus the quality achieved by our approach is not perfect. As discussed, our approach tries to confine the impact of memory errors by essentially approximating erroneous data with their average vector. However, note that the proposed method still achieves to provide output images with PSNR above 30 dB even under the error rate of 0.007 (which is equivalent to about 600 bitflips), closely approximating the PSNR of error free image.
In contrast, the ECC method uses six parity bits for encoding each 32-bit code word, therefore, when the error rate is large, the error probability in both code word and its encoded parity bits increases, which can cause the failure of error detection, and the correct bit will be mistaken for false detected error, which will eventually make the quality of the image dropping rapidly.
Regarding multi-bitflip error, we evaluate the effect of protection under a fixed error rate of 0.01, but different amount of bit-flips for each injected error. Figure 11b quantifies the PSNR versus the amount of bit-flips per error for image (a), while experiments on other images show similar trends and, hence, are removed here for simplicity. It is observed that proposed method achieves a high PSNR for odd number of bit-flips per error while fails in protection under even number. This is due to the limitation of the error detection mechanism by a single parity bit, which can be strengthened with enhanced error detection techniques. However, when error is able to be detected, PCA based correction technique achieves high PSNR far beyond the Hamming ECC-based approach.
Consequently, the proposed method adequately addresses the cases of any odd number of bitflips in a single word with the single parity bit. The essential conclusion is that the replacement of erroneous data with the corresponding value of the average vector extracted by PCA suffices to confine the impact of single and multiple bitflip errors.
4.2.3. Evaluation of Performance
Note that ECC techniques have been widely integrated with standard SRAM and DRAM devices using customized circuits, while the physical implementation of PCA is not the focus of this work. For a fair comparison of performance, software emulated ECC encoder/decoder and PCA techniques are adopted to quantify the difference in amount of computation.
Figure 12a depicts the overall emulated execution time of proposed error confinement technique on images with different sizes from 256 × 256 to 1024 × 1024 with the ECC technique. In the proposed method, sub-block size of 256 × 8 is chosen with two remaining principal components according to Table 1, in order to achieve sufficient PSNR with relatively small execution overhead and memory footprint.
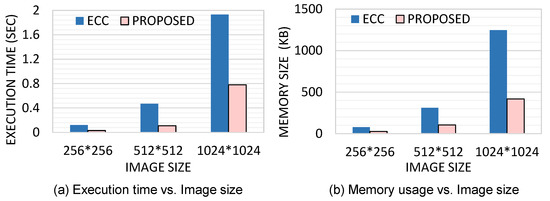
Figure 12.
Emulated execution time (a) and memory usage (b) with proposed method and ECC.
For small images, those techniques take similar execution time, but with the increment in image size, the proposed technique takes significantly less time compared to SECDED ECC. Such speed-up is caused by the faster block-level processing of our approach compared with the relatively slower word-level encoding and decoding in ECC. When the size of the image is large, the proposed technique is even more efficient. The overhead of execution time caused by fault injection is reflected in the process of correcting erroneous data with the average vectors. Compared with feature extraction and matrix multiplication in the process of data reconstruction, the time consumed by correcting erroneous data can be simply ignored and the results in Figure 12 are almost consistent with different error rates.
Another interesting comparison is the difference regarding memory usage. In Figure 12b, the proposed method uses far less memory compared to SECDED ECC technique are shown. In particular, for an image of size 1024 × 1024, the proposed technique reduces memory usage by 68%, which attributes to block-level processing of our approach and ECC requiring six parity bits for encoding each 32-bit code word.
5. Conclusions
This work presents a generic low-cost error confinement technique based on the algorithm of Principle Component Analysis. The extracted features of PCA are used to confine the impact of errors for any block-wise data during data reconstruction. Compared with conventional word-level memory protection techniques such as ECC, the PCA-based technique not only detects both single and multiple bit-flip errors but also achieves a significant reduction in performance and storage overheads. Furthermore, a trade-off between quality of reconstructed data and the remaining number of principal components reviews the advantage of discovering and ranking the features of any block data over the homogeneous word-level protection by ECC.
Future work includes the physical implementation of PCA which can give realistic performance benchmarking with other protection methods. From an application side, applying the proposed technique to state-of-the-art applications such as machine learning and big data will be addressed to further demonstrate advantages of block-wise error confinement techniques for specific computing domains.
Author Contributions
Data curation: J.F. and Z.W.; Funding acquisition: Z.W. and H.L.; Investigation: C.S., J.F. and Z.W.; Methodology: Z.W.; Project administration: H.L.; Software: C.S., Z.W. and J.F.; Writing–original draft: C.S.; Writing–review & editing: Z.W.
Funding
This work was supported by NSFC 61672512, U1632271, 61702493 and the Shenzhen S&T Funding with Grant No. JCYJ20160510154531467, KQJSCX20170731163915914, CAS Key Laboratory of Human-Machine Intelligence-Synergy Systems, Shenzhen Institutes of Advanced Technology, Shenzhen Engineering Laboratory for Autonomous Driving Technology, SIAT Innovation Program for Excellent Young Researchers (2017001).
Conflicts of Interest
The authors declare no conflict of interest.
References
- Moore, G.E. Cramming more components onto integrated circuits. IEEE Solid-State Circuits Newsl. 2006, 3, 33–35. [Google Scholar] [CrossRef]
- Hoefflinger, B. ITRS: The international technology roadmap for semiconductors. In Chips 2020; Springer: Berlin/Heidelberg, Germany, 2011; pp. 161–174. [Google Scholar]
- Slayman, C. Soft errors-past history and recent discoveries. In Proceedings of the IEEE International Integrated Reliability Workshop Final Report (IRW), Fallen Leaf, CA, USA, 17–21 October 2010; IEEE: New York, NY, USA, 2010; pp. 25–30. [Google Scholar]
- Semiconductor, T. Soft Errors in Electronic Memory—A White Paper; Tezzaron Semiconductor: Naperville, IL, USA, 2004. [Google Scholar]
- Darnell, M. Error control coding: Fundamentals and applications. IEE Proc. F Commun. Radar Signal Process. 1985, 132, 68. [Google Scholar] [CrossRef]
- Dong, X.; Muralimanohar, N.; Jouppi, N.; Kaufmann, R.; Xie, Y. Leveraging 3d pcramtechnologies to reduce checkpoint overhead for future exascale systems. In Proceedings of the Conference on High Performance Computing Networking, Storage and Analysis, Portland, OR, USA, 14–20 November 2009; ACM: New York, NY, USA, 2009; p. 57. [Google Scholar]
- Chippa, V.K.; Chakradhar, S.T.; Roy, K.; Raghunathan, A. Analysis and characterization of inherent application resilience for approximate computing. In Proceedings of the 50th Annual Design Automation Conference, Austin, TX, USA, 29 May–7 June 2013; ACM: New York, NY, USA, 2013; p. 113. [Google Scholar]
- Lee, I.; Kwon, J.; Park, J. Priority based error correction code (ECC) for the embedded SRAM memories in H.264 system. J. Signal Process. Syst. 2013, 73, 123–136. [Google Scholar] [CrossRef]
- Yueh, W.; Cho, M.; Mukhopadhyay, S. Perceptual quality preserving SRAM architecture for color motion pictures. In Proceedings of the Design, Automation and Test in Europe, DATE 13, Grenoble, France, 18–22 March 2013; pp. 103–108. [Google Scholar]
- Esmaeilzadeh, H.; Sampson, A.; Ceze, L.; Burger, D. Architecture support for disciplinedapproximate programming. ACM Sigplan Not. 2012, 4, 301–312. [Google Scholar] [CrossRef]
- Sampson, A.; Dietl, W.; Fortuna, E.; Gnanapragasam, D.; Ceze, L.; Grossman, D. Approximate data types for safe and general low-power computation. ACM Sigplan Not. 2011, 46, 164–174. [Google Scholar] [CrossRef]
- Venkataramani, S.; Chippa, V.K.; Chakradhar, S.T.; Roy, K.; Raghunathan, A. Quality programmable vector processors for approximate computing. In Proceedings of the 46th Annual IEEE/ACM International Symposium on Microarchitecture, Davis, CA, USA, 7–11 December 2013; ACM: New York, NY, USA, 2013; pp. 1–12. [Google Scholar]
- Cho, H.; Leem, L.; Mitra, S. ERSA: Error resilient system architecture for probabilistic applications. IEEE Trans. CAD Integr. Circuits Syst. 2012, 31, 546–558. [Google Scholar] [CrossRef]
- Wang, Z.; Karakonstantis, G.; Chattopadhyay, A. A low overhead error confinement method based on application statistical characteristics. In Proceedings of the Design, Automation & Test in Europe (DATE), Dresden, Germany, 14–18 March 2016; pp. 1168–1171. [Google Scholar]
- Sirovich, L.; Kirby, M. Low-dimensional procedure for the charac-terization of human faces. J. Opt. Soc. Am. A 1987, 4, 519–524. [Google Scholar] [CrossRef] [PubMed]
- Turk, M.; Pentland, A. Eigenfaces for recognition. J. Cogn. Neurosci. 1991, 3, 71–86. [Google Scholar] [CrossRef] [PubMed]
- Shlens, J. A Tutorial on Principal Component Analysis; Google Research: Mountain View, CA, USA, 2013. [Google Scholar]
- Carvalho, G.V.; Moraes, L.B.; Cavalcanti, G.D.C.; Ren, T.I. A weighted image reconstruction based on PCA for pedestrian detection. In Proceedings of the IEEE International Joint Conference on Neural Networks, San Jose, CA, USA, 31 July–5 August 2011. [Google Scholar]
- Korat, U.A. A Reconfigurable Hardware Implementation for the Principal Component Analysis. Ph.D. Thesis, San Diego State University, San Diego, CA, USA, 2016. [Google Scholar]
- Smith, L.I. A tutorial on principal components analysis. Inf. Fusion 2002, 51, 219–226. [Google Scholar]
- Strang, G. Linear Algebra and Its Applications; Cengage Learning: Boston, MA, USA, 2006. [Google Scholar]
- Wold, S. Principal Component Analysis. Chemom. Intell. Lab. Syst. 1987, 2, 37–52. [Google Scholar] [CrossRef]
- Fay, D.; Shye, A.; Bhattacharya, S.; Connors, D.A.; Wichmann, S. An Adaptive Fault-Tolerant Memory System for FPGA-based Architectures in the Space Environment. In Proceedings of the Nasa/esa Conference on Adaptive Hardware and Systems, Edinburgh, UK, 5–8 August 2007; pp. 250–257. [Google Scholar]
- Locklear, D. Chipkill Correct Memory Architecture Technology Brief; Dell Computer Corporation: Round Rock, TX, USA, 2000. [Google Scholar]
- Kerbyson, D.J.; Hoisie, A.; Pakin, S.; Petrini, F.; Wasserman, H.J. A Performance Evaluation of an Alpha EV7 Processing Node. Int. J. High Perform. Comput. Appl. 2004, 18, 199–209. [Google Scholar] [CrossRef]
- Stewart, G.W. A Krylov-Schur Algorithm for Large Eigenproblems. SIAM J. Matrix Anal. Appl. 2001, 23, 601–614. [Google Scholar] [CrossRef]
- Krizhevsky, A.; Sutskever, I.; Hinton, G.E. Imagenet classification with deep convolutional neural networks. Adv. Neural Inf. Process. Syst. 2012, 60, 1097–1105. [Google Scholar] [CrossRef]
- Ciresan, D.C.; Meier, U.; Masci, J.; Gambardella, L.M.; Schmidhuber, J. Flexible, high performance convolutional neural networks for image classification. In Proceedings of the IJCAI Proceedings-International Joint Conference on Artificial Intelligence, Catalonia, Spain, 16–22 July 2011; Volume 22, pp. 1237–1242. [Google Scholar]
- Huynh-Thu, Q.; Ghanbari, M. Scope of validity of psnr in image/video quality assessment. Electron. Lett. 2008, 44, 800–801. [Google Scholar] [CrossRef]
- Wang, X. Modular PCA based on Within-Class median for face recognition. In Proceedings of the IEEE International Conference on Computer Science and Information Technology, Chengdu, China, 9–11 July 2010; pp. 52–56. [Google Scholar]
- Parvathy, S.B.; Naveen, S.; Moni, R.S. A novel approach for multimodal face recognition system based on modular PCA. In Proceedings of the IEEE International Conference on Computational Systems & Communications, Trivandrum, India, 17–18 December 2014; pp. 127–132. [Google Scholar]


© 2019 by the authors. Licensee MDPI, Basel, Switzerland. This article is an open access article distributed under the terms and conditions of the Creative Commons Attribution (CC BY) license (http://creativecommons.org/licenses/by/4.0/).