1. Introduction
The global energy and environmental targets have directed most countries worldwide towards a greener energy generation portfolio. A large portion of renewable generation capacity is likely to be in form of distributed generations (DGs) directly connected to distribution (medium and low voltage) networks [
1]. The increasing number of DGs, such as wind turbines and solar photovoltaic (PV) generators operating with an internal DC link has brought forward the concept of DC collector grids [
2]. This concept is not limited to DGs integration as it can also be used as an interface for integrating DC loads such as electric vehicle’s (EV) charging facilities, battery energy storage systems (BESS), LED lighting systems, DC data centers, and variable-speed machines. Furthermore, the DC system operates at a higher efficiency due to a reactive power that is not present, therefore reducing conduction losses. It is likely that the future medium voltage (MV) distribution network will consist of a hybrid AC/DC network or at least some parts of it. In recent years, there have been several demonstration projects of deployment of medium voltage DC (MVDC) networks. A campus project was developed by RWTH Aachen University to investigate the benefits of MVDC grids [
3,
4,
5]. In the context of the UK, the first trial project of a MVDC link called “Angle-DC” will be installed by transforming the existing 33-kV AC distribution circuits between the Llanfair PG substation on Anglesey and the Bangor substation at North Wales [
6] into DC operation.
The voltage source converter (VSC) is the key element in enabling the deployment of MVDC infrastructure in existing distribution networks. A back-to-back (BTB) configuration of VSCs has been introduced in [
7] by replacing the normally open mechanical switches at the end of feeders, called soft-open point (SOP), to facilitate DG penetration in distribution networks. In a later study, [
8] advocated the benefit of SOPs in terms of fault isolation and supply restoration. In [
9], the SOP was suggested to replace all remotely controlled switches which include both tie switches and sectionalising switches for a rapid network reconfiguration. The capability of SOP for fast voltage regulation was investigated in [
10]. Since the application of SOPs provides operational flexibility to distribution networks, it has been considered as one of the factors to determine an optimal placement for distributed energy storage in [
11]. A dynamic energy management framework considering renewable generations, energy storage systems, flexible demands, and the SOP application was proposed in [
12]. In a recent study, [
13] introduced a decentralised control of VSC stations to address the issue of communication failure. Like the demonstration project in [
6], these studies [
7,
8,
9,
10,
11,
12,
13] only considered the interconnection between any two feeders which would limit control (e.g., load transfer capability) to the two feeders. In recent years, the multi-terminal high voltage direct current (HVDC) configurations have been investigated extensively at the transmission level [
14,
15,
16,
17,
18,
19]. A similar concept is plausible and may be applied at the MV level to achieve higher levels of operational flexibility by connecting all end feeders together.
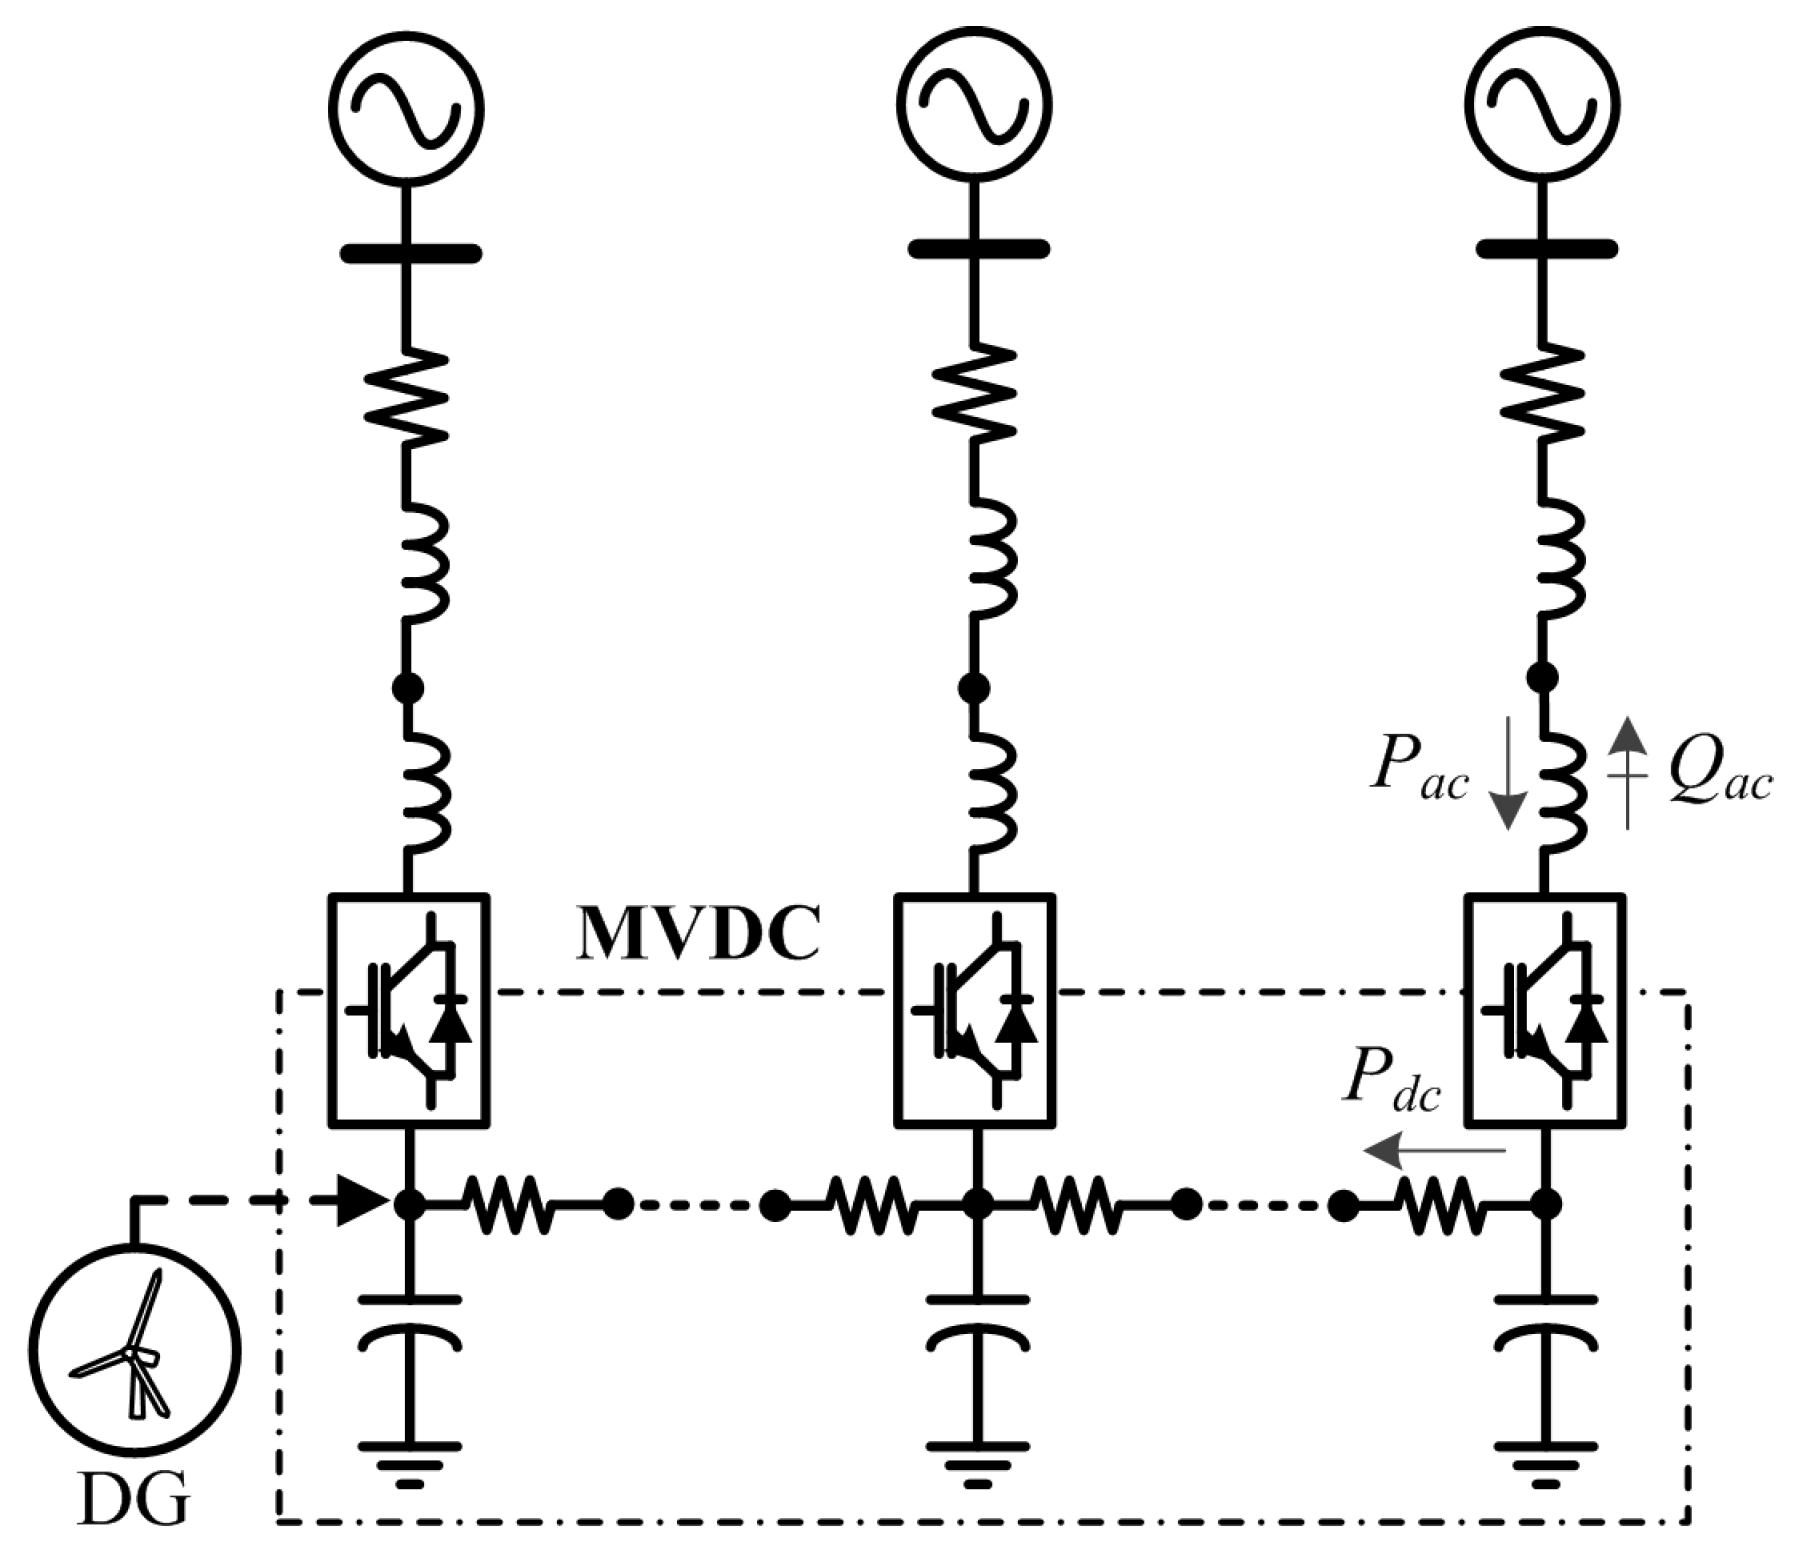
This paper proposes a flexible hybrid AC/DC MV distribution grid concept, which at its core takes advantage of the higher levels of operational flexibility by using an integrated MVDC interface that consists of a DC collection grid containing multiple VSCs and connects all end feeders together. Consequently, all DGs with internal DC links (wind and solar generators) can be connected directly to the MVDC system. The MVDC interface may also be used to achieve power transfer between the feeders, improving voltage control (e.g., at end feeders) and improving the control of the power flows. This expands the application of soft-open points (SOP) to all feeders. Meanwhile, an active network management (ANM) framework is proposed in order to operate this hybrid network to its fullest potential. The ANM framework optimises the operation of multiple VSCs within the network and takes advantage of schemes such as flexible demand shifting and renewable energy curtailment to minimise operational costs and maintain a continuity of supply to all loads even after contingencies.
The concept of steady-state operational security is well known for transmission networks. However, a similar concept has received little attention for distribution networks, mostly due to the radial configuration of distribution feeders. Notwithstanding this, the problem of operational security in distribution networks has been introduced in [
20]. The work in [
20] proposed a distribution system security region (DSSR), based on the concept of total supply capability (TSC) [
21]. In this way, all operating points were determined, satisfying the
security criteria. The approach considered the capacities of substation transformers, network topology, and operational constraints. This concept was also applied in [
22] at a varying load using network reconfiguration techniques to reduce total load shedding. Recently, a quantitative maximum DG output assessment was used in [
23] based the concept of DSSR to guarantee the
secure operation of distribution networks. The work in [
24] incorporated the situation awareness that involved three steps: Perception (i.e., data collection), comprehension (i.e., data analysis), and projection (i.e., data prediction) to carry out preventive actions toward any contingency events. However, the studies allow load interruptions during contingencies and lack of involvement from other network devices to react toward undesirable events. In our ANM framework, however, using the MVDC interface in conjunction with flexible demand and renewable energy curtailment entails that the operating of loads and grid supply points can be planned in advance (i.e., day-ahead) in such a way to keep the continuity of supply at contingency conditions given a
criterion in place. We, therefore, introduce a new distribution security constrained optimal power flow (D-SCOPF) that contains three stages, namely pre-contingency, short-term, and long-term post-contingencies to distinguish from the DSSR. The short-term contingency period is introduced in order to take advantage of the fast control of VSCs connected to the MVDC interface and distinguish from other slow reaction devices such as the tap changer in the long-term contingency period.
Our contributions in this paper are three-fold: (1) A day-ahead distribution network management framework with flexible demand and DG curtailment to uphold the secure operation during contingencies, (2) an extended security constrained, which covers three stages, pre-contingency, short-term, and long-term post-contingencies, is used to highlight the different remedial action capabilities between slow response (i.e., load tap changer) and fast response (i.e., VSCs) control devices, and (3) a multi-terminal configuration of MVDC is introduced to alleviate the limitations of back-to-back (BTB) or point-to-point (P2P) configurations used in [
7,
8,
9,
10,
11,
12,
13] and thus a more flexible network operation can be achieved. The MVDC interface works as a platform for renewable energy integrations at the end of distribution feeders that uses the same number of VSCs as in P2P configuration.
This paper is organised as follows: A new active network management by adopting the flexible demand and non-firm distributed generation for security operational is presented in
Section 2,
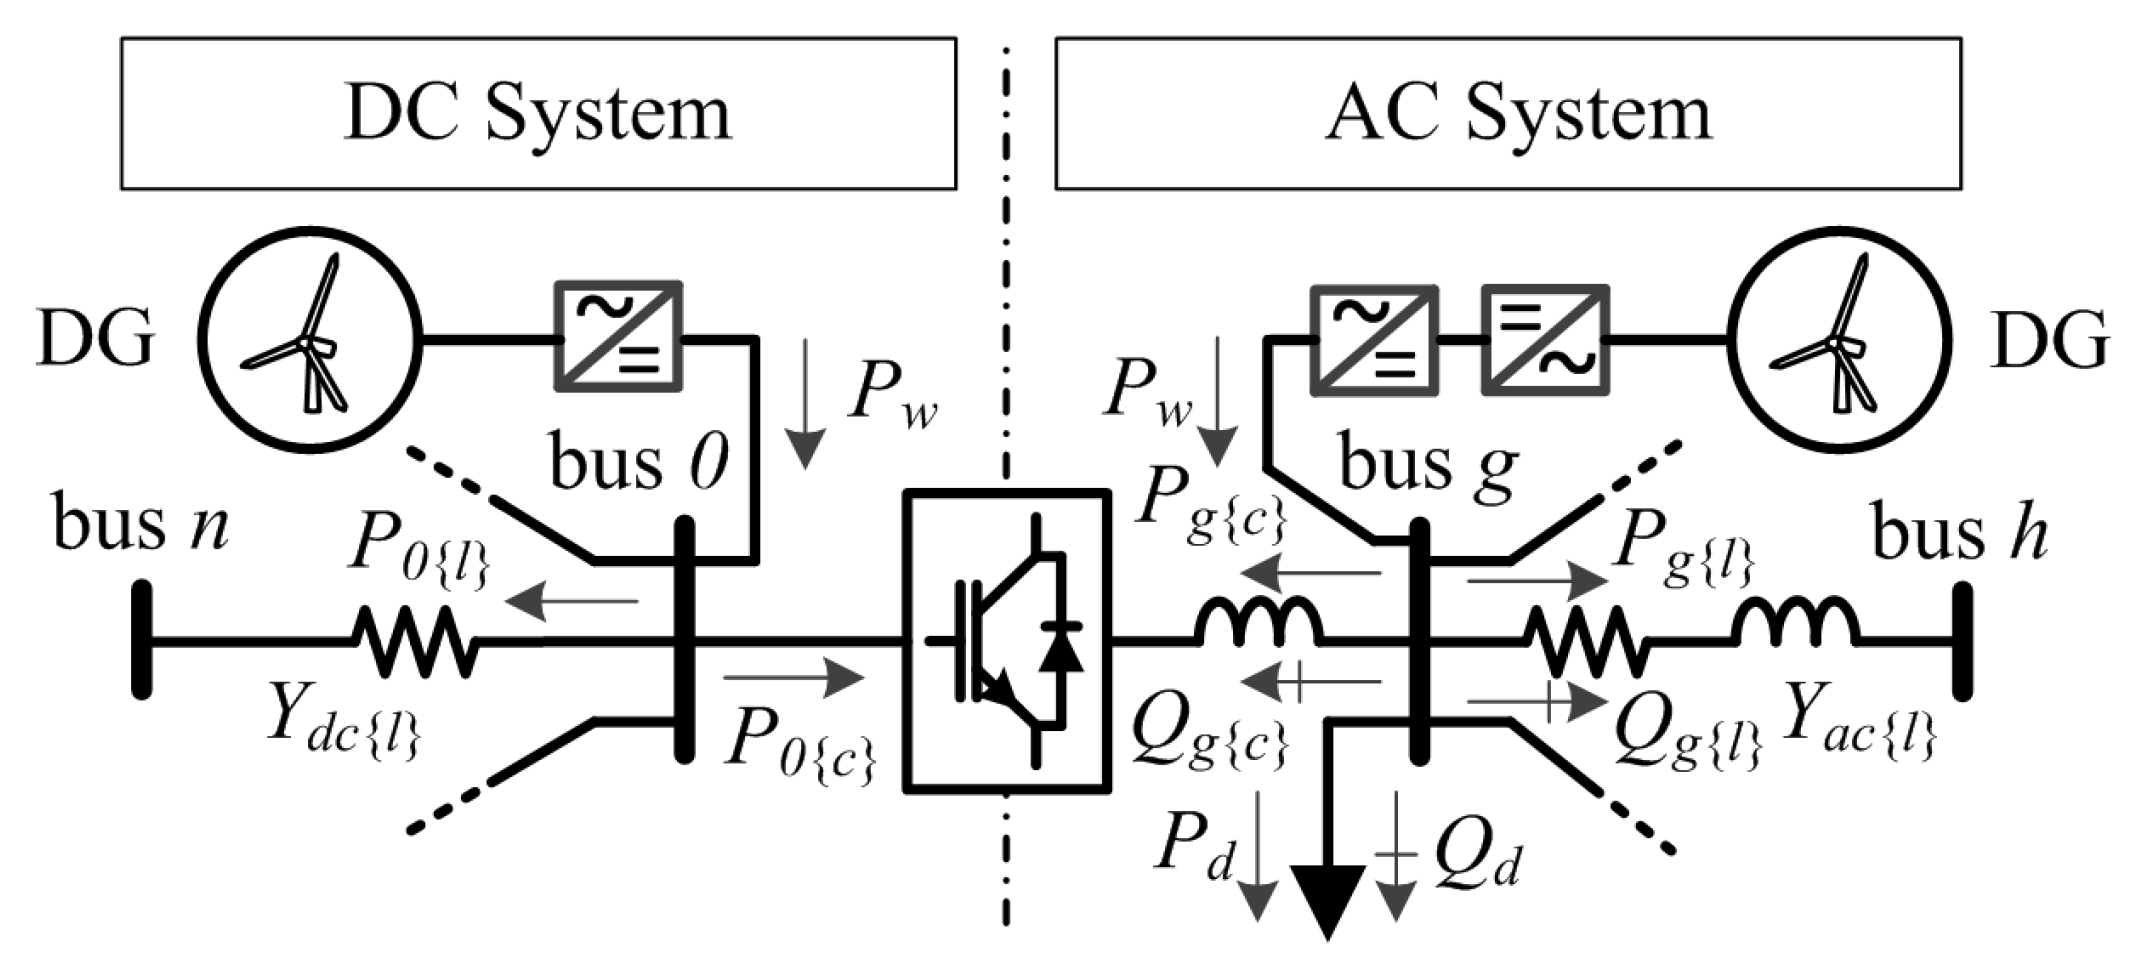
Section 3 describes a mathematical model of the hybrid AC/DC network for a possible application within the ANM framework,
Section 4 discusses case studies and comparison results of applying the ANM framework to the hybrid network, and finally, a conclusion is drawn in
Section 5.
2. A New Security ANM Framework
Typically, an ANM framework in distribution networks optimises the operation of the system without considering post contingency (faults) operational states [
25]. The ANM framework proposed in this paper ensures a continuity of supply in the distribution network, even after the occurrence of faults in the feeders or substation transformers (satisfying the
security criterion). The proposed ANM framework solves a multi-period D-SCOPF that ensures a continuity of supply by imposing operational constraints in both normal operation (pre-contingency) and abnormal (post-contingency) conditions [
26]. The proposed ANM framework is to be operated by the distribution system operator (DSO). This requires a SCADA system with remote controllers. In this way, set points for control actions of the VSCs, DG curtailment, and demand shift will be provided by the centralised controller (ANM framework).
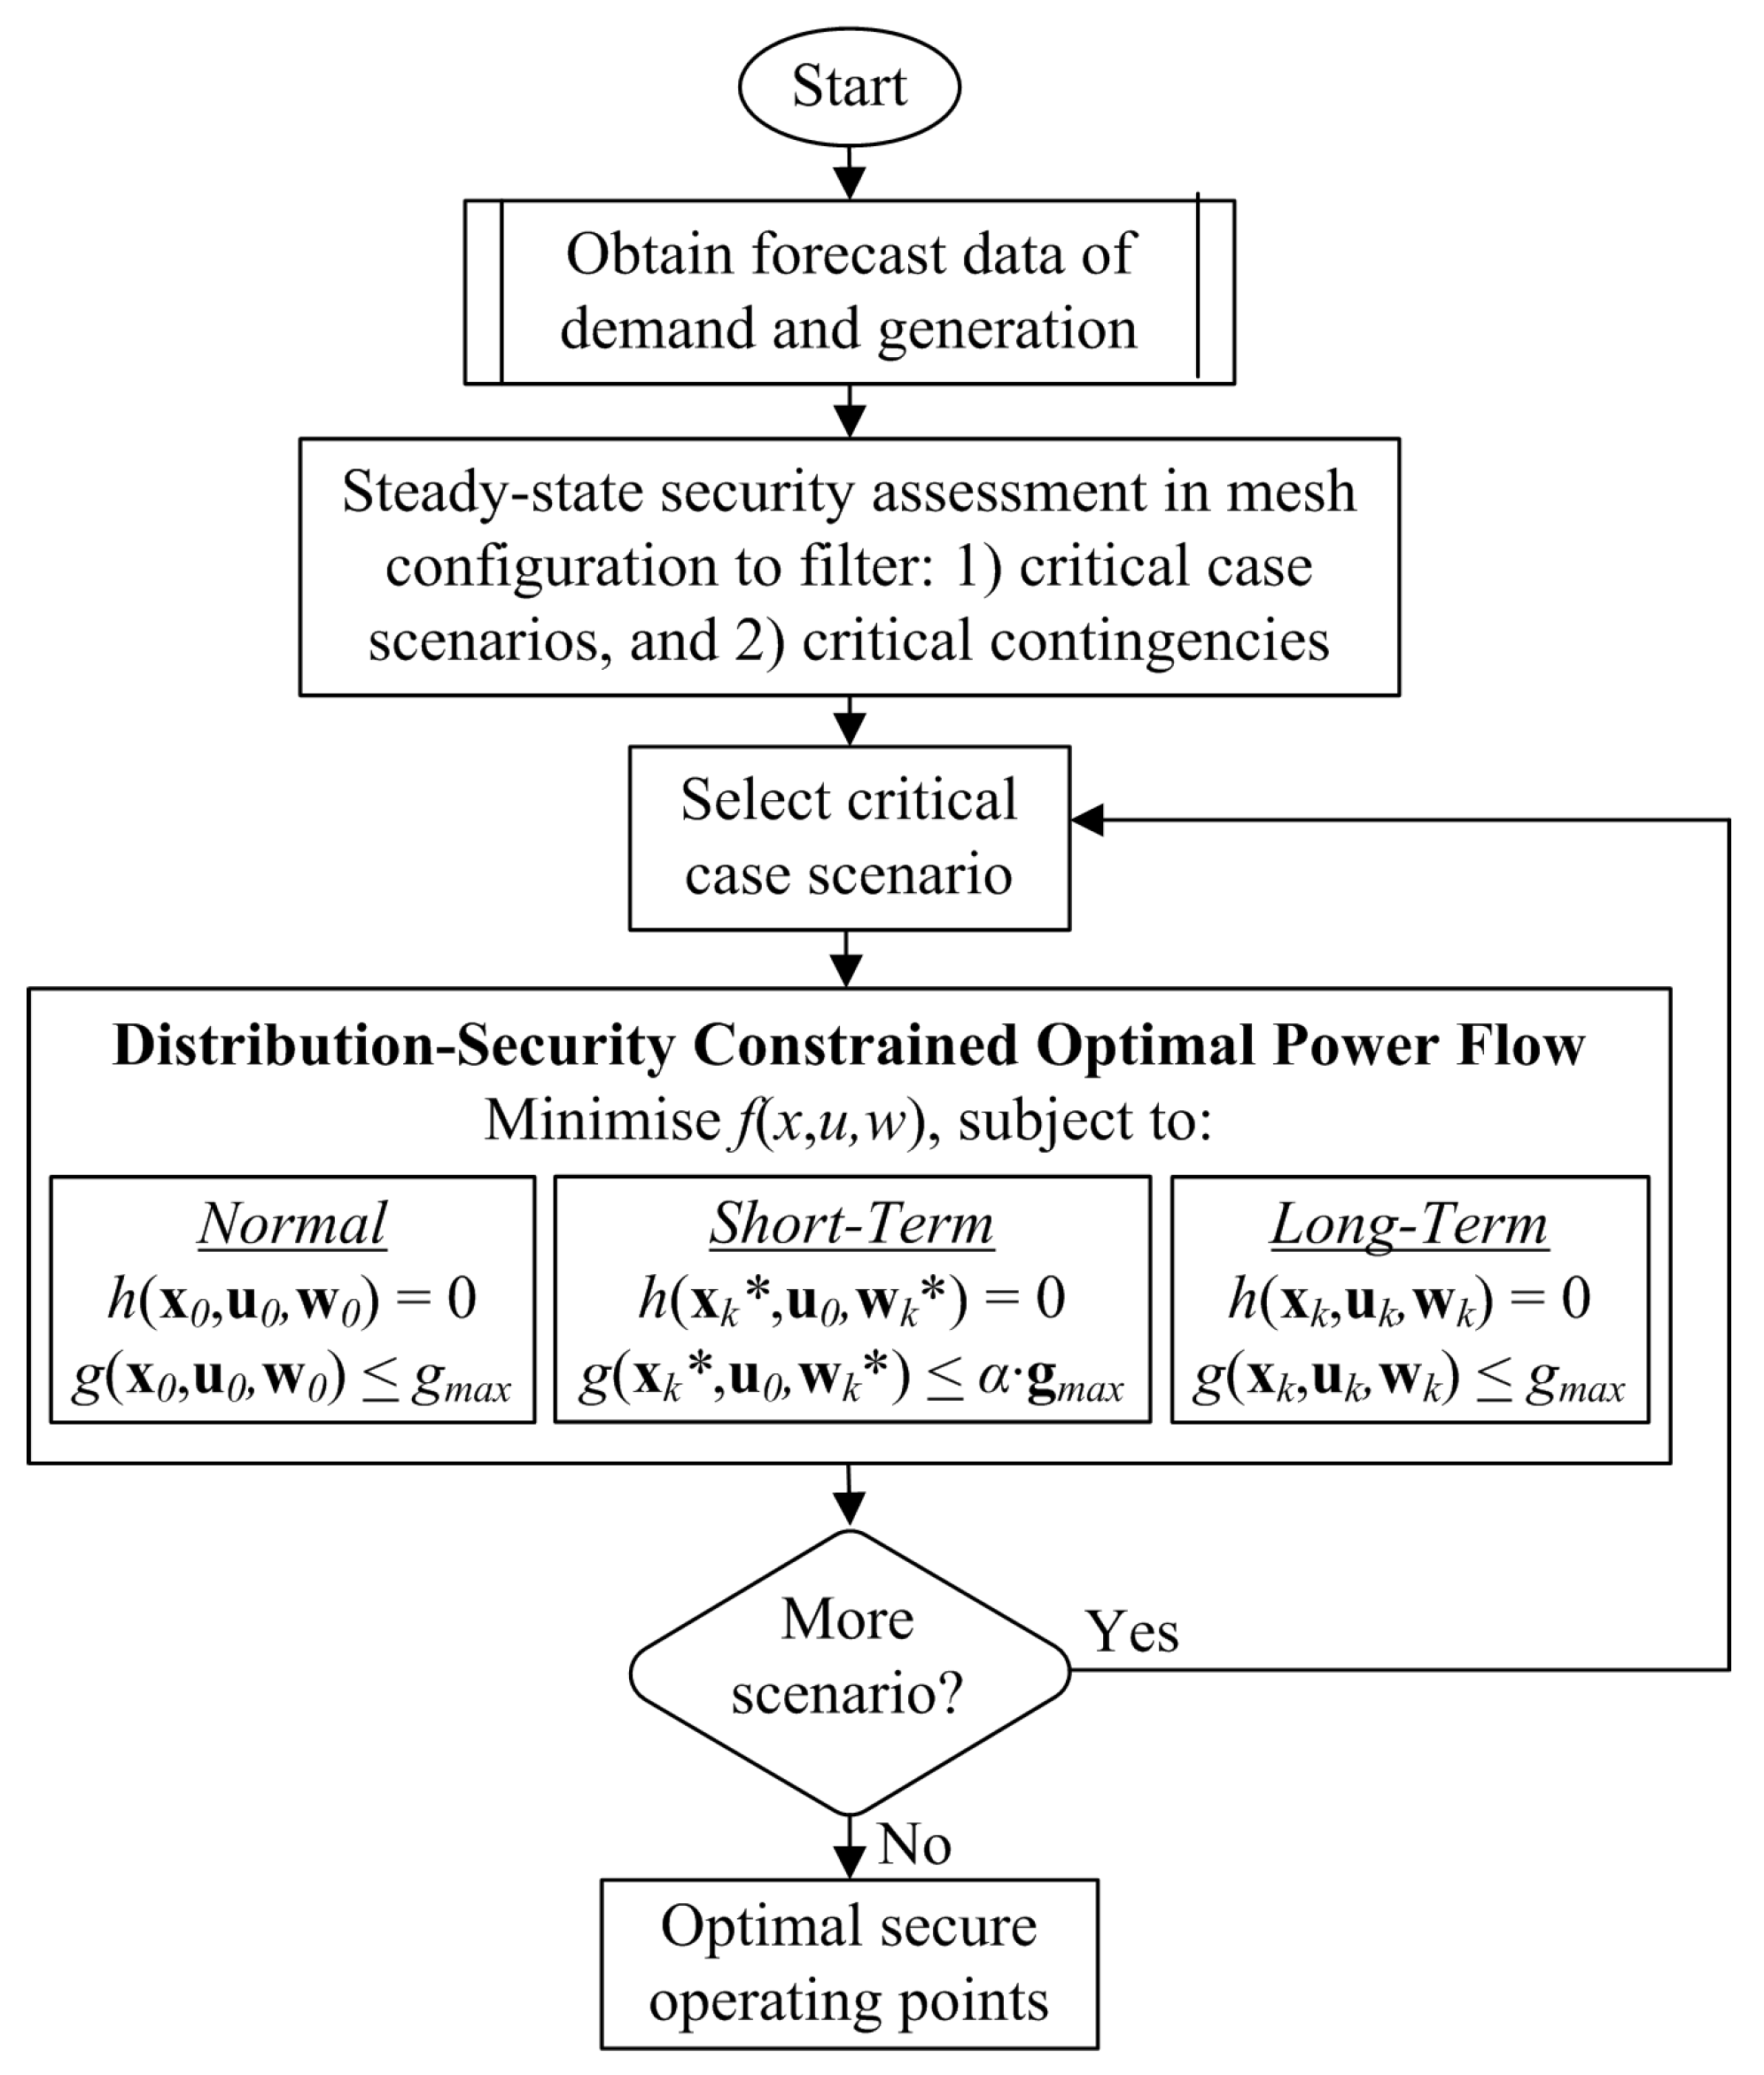
Figure 1 shows a flowchart of the introduced ANM framework where
x is the vector of state variables (voltage magnitudes and angles),
u is the vector of conventional control variables (tap changer operation), and
w is the vector of the fast control variables (modulation index and phase shift of VSCs). The responses available to the DSO are divided into two time scales: short-term and long-term. Parameter
in
Figure 1 is used to relax the limits of the equipment during the short-term time scale immediately after a contingency (commonly called emergency ratings). Immediately after a contingency, the fast response of the VSCs will provide short-term remedial actions, followed by long-term corrective actions carried out by slower devices such as tap changers. The proposed ANM framework is divided into four main layers and will be explained in the following subsections:
Load and generation forecasting;
Steady-state security assessment;
Distribution security-constrained optimal power flow;
Day-ahead optimal scheduling.
2.1. Load and Generation Forecasting
In the first layer, we assume the DSO has access to forecast data for load and generation profiles for the day-ahead time horizon. In this paper, we used historic data in [
25] for our simulations.
2.2. Steady-State Security Assessment
The second layer consists of a steady-state security assessment where the critical contingencies from all scenarios obtained from demand and generation forecasting are identified. The critical contingency cases are selected from the contingency cases that cause violations of the operational constraints. The non-critical contingency cases are disregarded since they will not provide any difference in comparison to the conventional optimal power flow calculation. The critical contingency selection is carried out for all scenarios of demand and generation and therefore, identifying the critical case scenarios (i.e, demand and generation operating points binding with the critical contingency) can be done at the same time. The period of critical case scenarios is identified in a priori, in order to take into account effective control actions (i.e., power curtailment of the DGs and/or demand response). The objective of these control actions is to ensure that the system operational state always remains in the normal operation limits. This step is essential for reducing the number of contingency cases to be analysed and to identify the period of demand and generation operating points that affect the secure operation of the system. As a result, the size of the optimisation problem in the computational burden are reduced significantly.
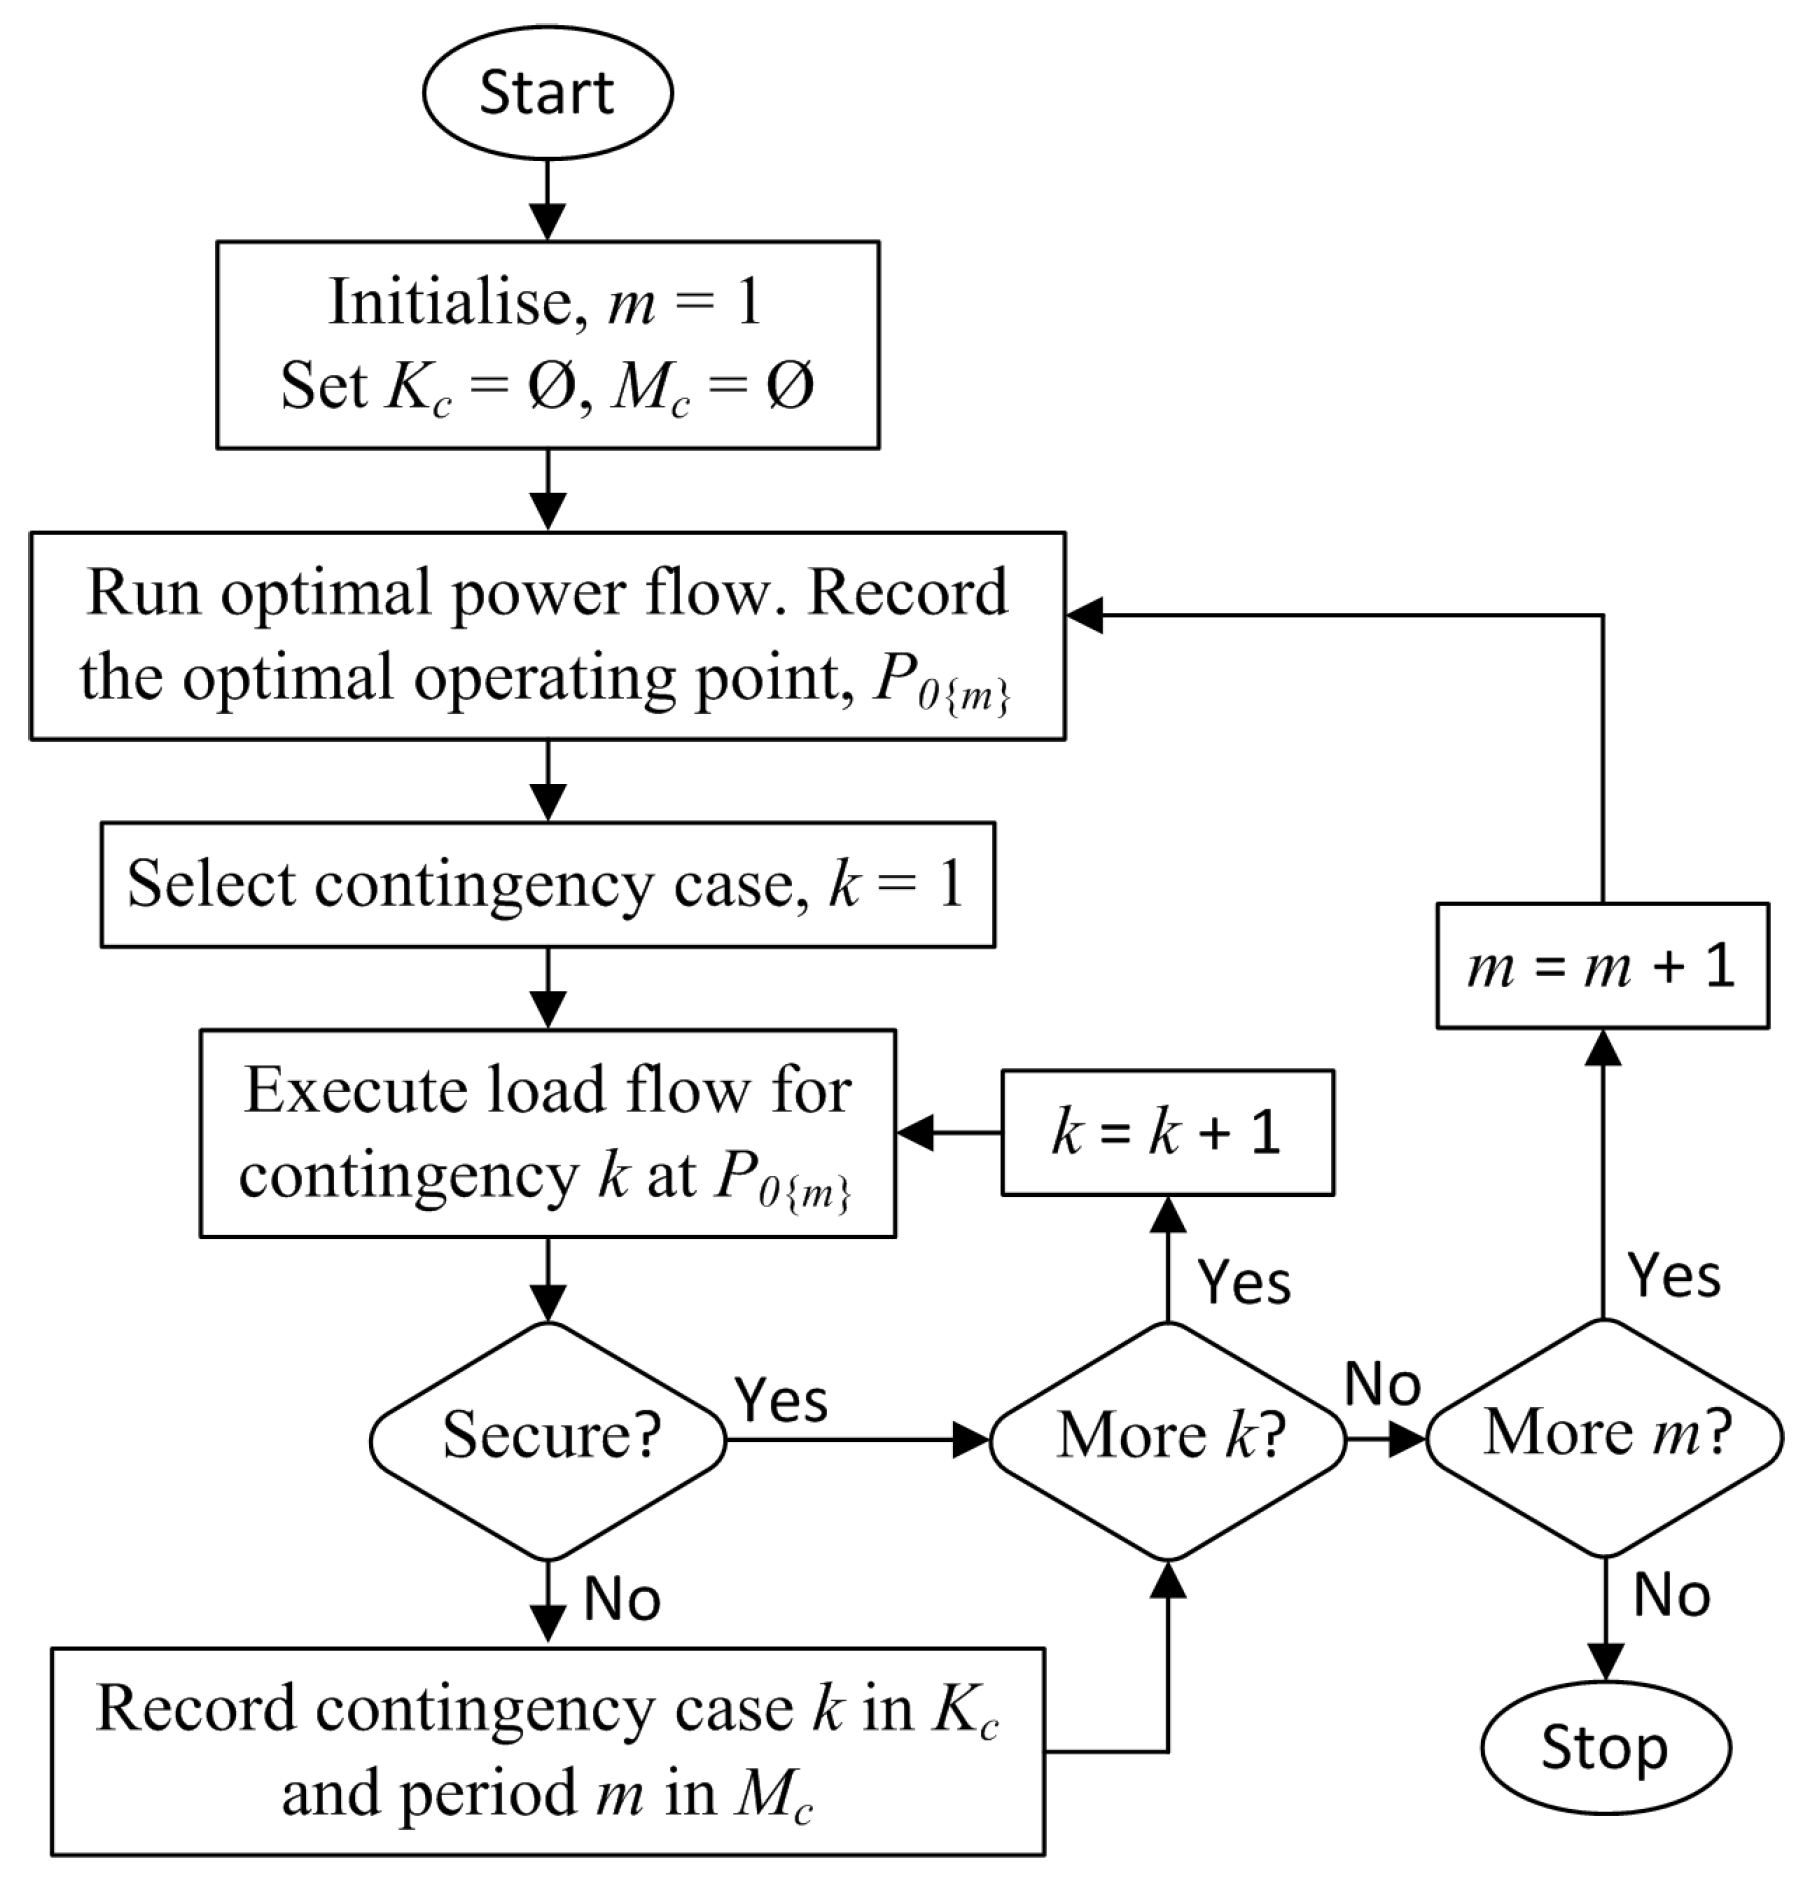
An iterative procedure is proposed to identify the set of critical contingencies and case scenarios for each time period. The simulation is carried out in a meshed configuration (i.e., all tie switches are closed, in order to account for the worst conditions).
Figure 2 shows the iterative procedure being used in this assessment to select the potential critical contingency cases. Let
K be the set of contingencies used in the security analysis (i.e., line outages at the main feeders, including the transformers of the main distribution substation) and let
be the set of critical case scenarios. Let
be the optimal operating point at period
. The proposed iterative procedure in
Figure 2 can be further explained as follows:
Initialisation of the the critical contingency set and the subset of critical case scenario: and ;
Select a time period of the forecast demand and generation, , and solve an OPF using base case constraints. The optimal optimal operating point at period , obtained from the OPF is denoted as ;
Simulate each contingency with by running a conventional power flow calculation. If the analysed contingencies do not lead to constraint violations, then is considered a secure optimal solution. Otherwise, the contingency case k that produces post-contingency violations of the limits is recorded as the subset of critical contingencies () and the time period of the forecast demand and generation, m is recorded in the subset of the critical case scenario ();
The computation is continued for the next period and terminated after all periods are executed.
2.3. Distribution Security Constrained Optimal Power Flow
The third layer consists of solving a multi-period distribution security constrained optimal power flow (D-SCOPF) for the day-ahead time horizon. The secure optimum settings for preventive and corrective control actions (available to the DSO) will be obtained from the solution of the D-SCOPF. For the results presented in this paper, historic load/generation profiles will be used, rather than actual day-ahead time series values. Only the critical case scenarios (i.e., extreme cases of load/generation variations) will be considered in this layer in order to maintain computational efficiency. In this way, the D-SCOPF algorithm will run over the set of all binding contingencies for the selected critical case scenarios. Furthermore, the optimisation problem will be solved in three stages: Normal operation (pre-contingency), short-term, and long-term post-contingency, as shown in
Figure 1.
The corrective controls are divided into short-term (VSC), long-term (LTC), and demand-shift, and DG curtailment. In the demand shift control scheme, a price
will be paid to consumers in order to achieve the demand-shift services required by the DSO,
. In the DG-curtailment scheme, a compensation price,
is set. Therefore, the DSO will pay to the DG owners the required curtailed power,
, at this price. The proposed D-SCOPF scheme also takes into account the cost of power transfer losses,
, at the forecast energy market price,
. It is assumed that
>
because it is desirable to reduce the levels of demand shifting than the levels of DG power curtailment, in prioritising consumer welfare. Consequently, the objective function of the proposed D-SCOPF algorithm is formulated as:
The details of the optimisation problems (power equations and constraints) are provided in
Appendix A. This optimisation problem can be solved in the three stages: Normal operation (pre-contingency), short-term, and long-term post-contingency (refer
Figure 1).
2.4. Day-Ahead Optimal Scheduling
In this layer, the final day-ahead optimal scheduling is generated for the DSO to share with other agents (i.e., DG owners, demand aggregators, and the upstream energy market operator). The offers/bids put forward by the DSO will obviously be based on the forecast prices used to create the final scheduling in the third layer.
4. Case Study and Results
The application of a hybrid AC/DC system with the proposed security ANM framework is now analysed in an urban UK distribution system. The application of the ANM framework is assessed based on minimum DG curtailment and demand shifting that could be achieved under relevant system contingencies.
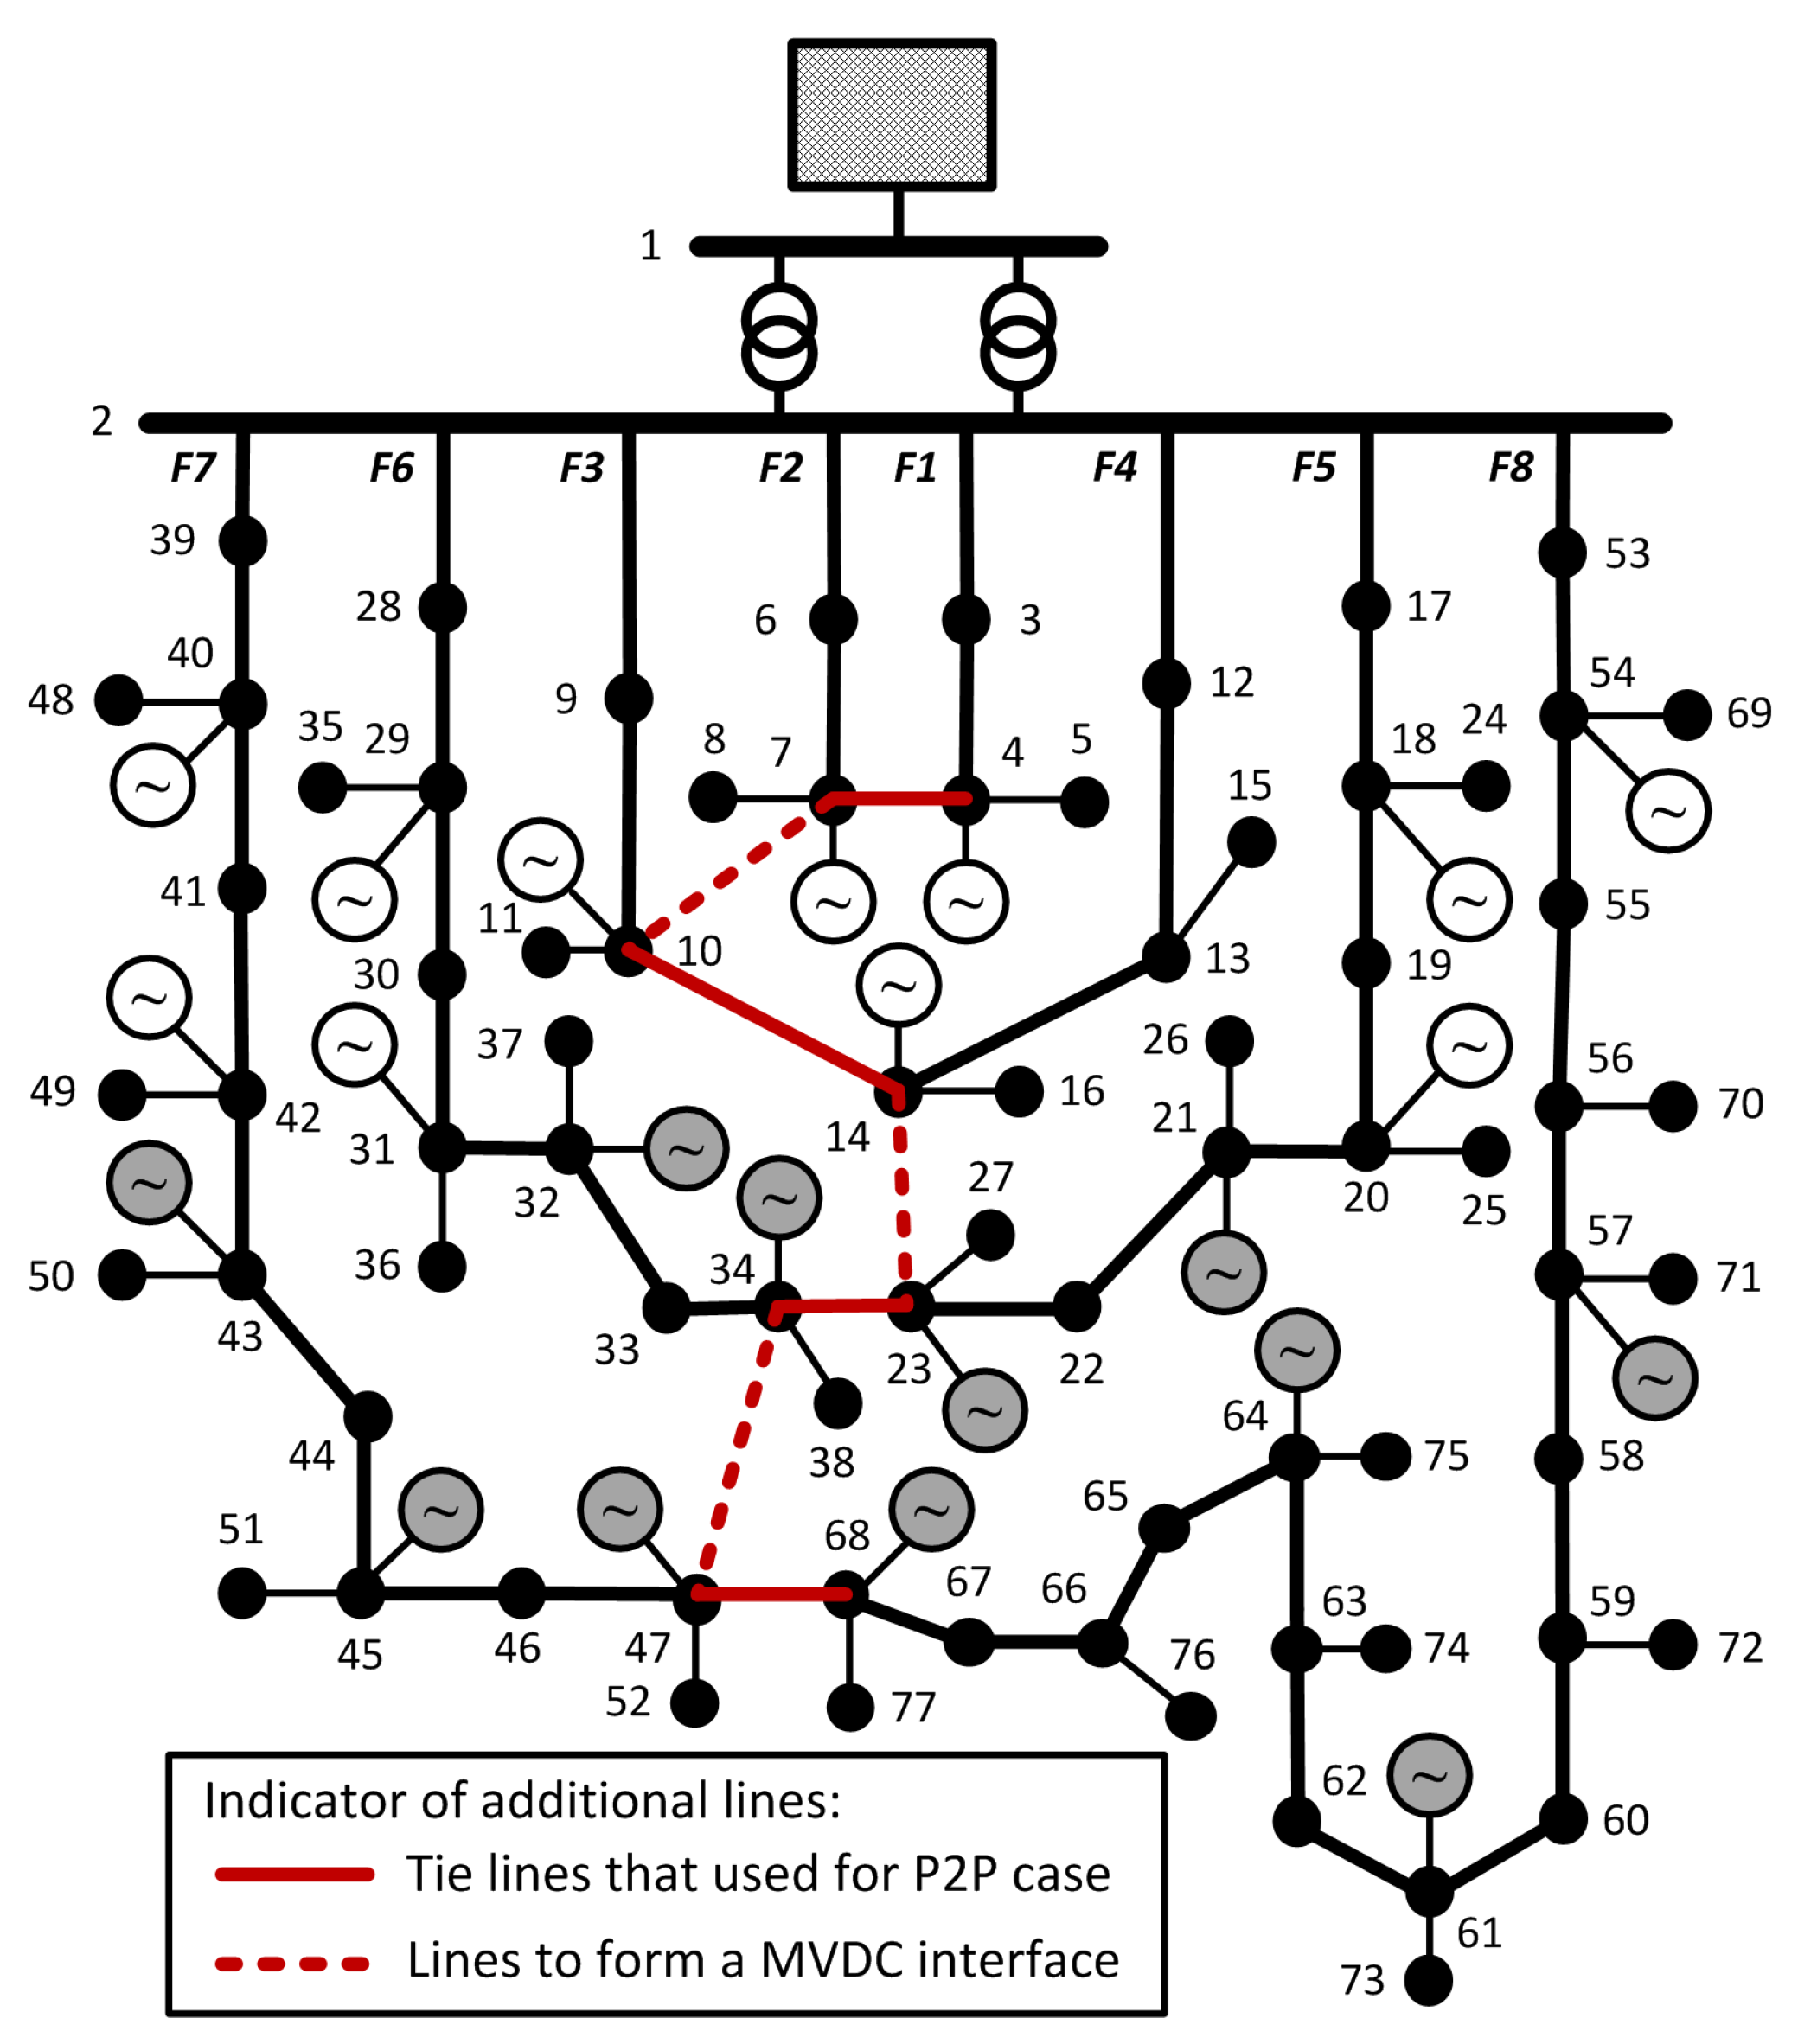
The test system considered for this study consists of the 11-kV urban 77-bus UK generic system in [
32] with a MVDC interface at the end of all feeders of the system, as shown in
Figure 6. The distribution system is fed from a 33-kV utility grid through two substation transformers. The hybrid AC/DC distribution system contains 75 AC lines and 7 additional DC lines. Four of the DC lines are considered as the existing tie lines (marked with red solid lines). It is assumed that the system is supported by 23 wind-based DGs with a capacity of 1.73 MW each. The total peak load is 24.274 MW and 4.855 MVar. The off-peak load is considered at 40% of the peak load. The voltage limits are set to 0.97/1.03 p.u. (
% of the nominal voltage) at all buses and thermal limits as given in [
32] are used in this study. These limits are relaxed at short-term emergency ratings of 0.94/1.06 p.u. at all bus voltages and thermal limits are 20% higher than the continuous current ratings of the original case.
The parameter of the VSCs are provided in
Table 1. The demand and generation profiles were obtained from the historic demand and wind data of central Scotland in 2003, as presented in [
25]. The data contain two sets of wind generation profiles (as a percentage of the total generation capacity) and one set of demand profile (as a percentage of the system peak load). The number of coincident hours per year for each condition that occurred in the year is also provided. In this study, we have chosen a subset of the original data used containing only instances of high-generation low-demand and low-generation high-demand for our simulation purposes. The selected critical case scenarios of demand and generation profiles are described in
Table 2.
As described earlier in
Section 2, we ran a steady-state security assessment for the original test system (without modifications) to identify all the binding contingencies. Since historic data was used, we only considered the critical case scenarios given in
Table 2. For the original UK generic system, there are 19 critical contingency cases given in
Table 3. We considered these for the modified hybrid network as well. From
Table 3, it is clearly shown that outages of any line in the short feeders (F1 to F4) and tie-lines are non-binding.
Three configurations are considered:
The base case does not contain VSCs and, therefore, the only control actions available to the DSO are the LTC voltage control, DG curtailment, and flexible demand shifting. In both, P2P and MVDC configurations, all available active network management schemes in the base case are used, in addition to the control actions of the VSCs. The D-SCOPF algorithm described in
Section 2 has been implemented in AIMMS [
33]. The optimisation problem is solved using CONOPT 3.14V on a PC of 3.5 GHz and 8 GB RAM. The performances of the three configurations are compared in terms of operating costs, demand shift, DG curtailment, line power loadings, and tap ratio optimal settings.
4.1. Operating Costs
Comparison results of the three configurations (base case, P2P, and MV) are provided in
Table 4. The application of VSCs increased the total losses of the system, since the switching action in the VSCs introduced additional losses. Nevertheless, the use of VSCs, either in P2P or MVDC configurations, improved performance, reduced the shifted demand and DG curtailment, in comparison to the base case. When using the proposed MVDC interface, the curtailed energy was dramatically reduced by almost 3.5 in comparison to the base case and twice in comparison to the P2P configuration. Overall, results of
Table 4 proves that, using the MVDC configuration, the DSO could save over 80% of operational costs in comparison to the base case while improving the continuity of the supply condition.
4.2. Demand Shift
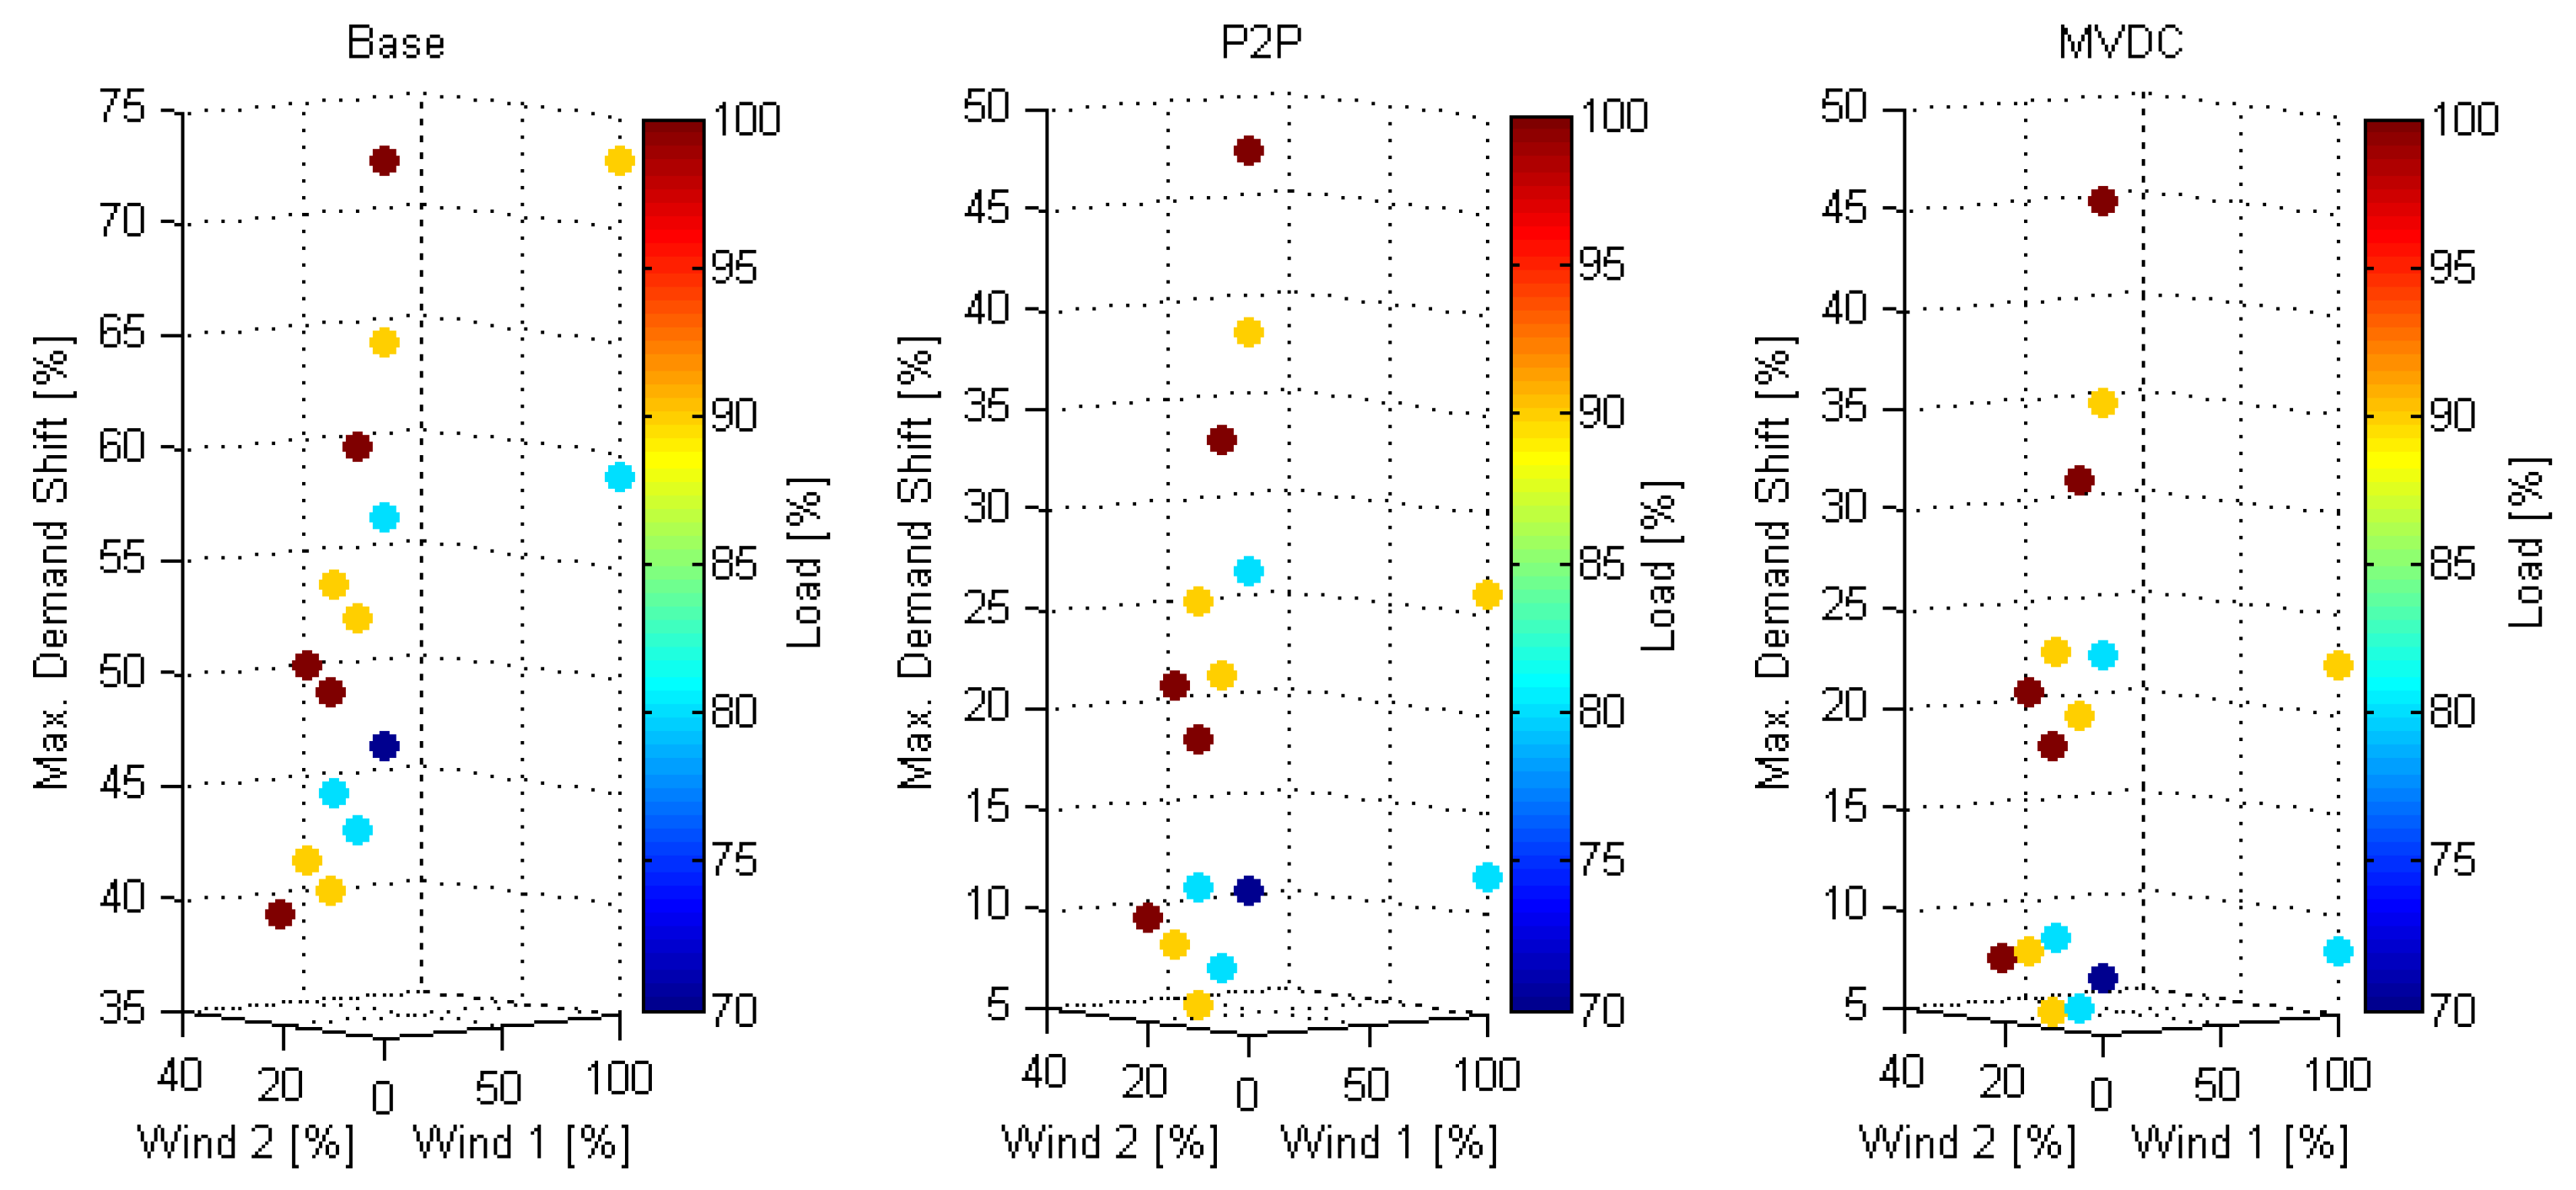
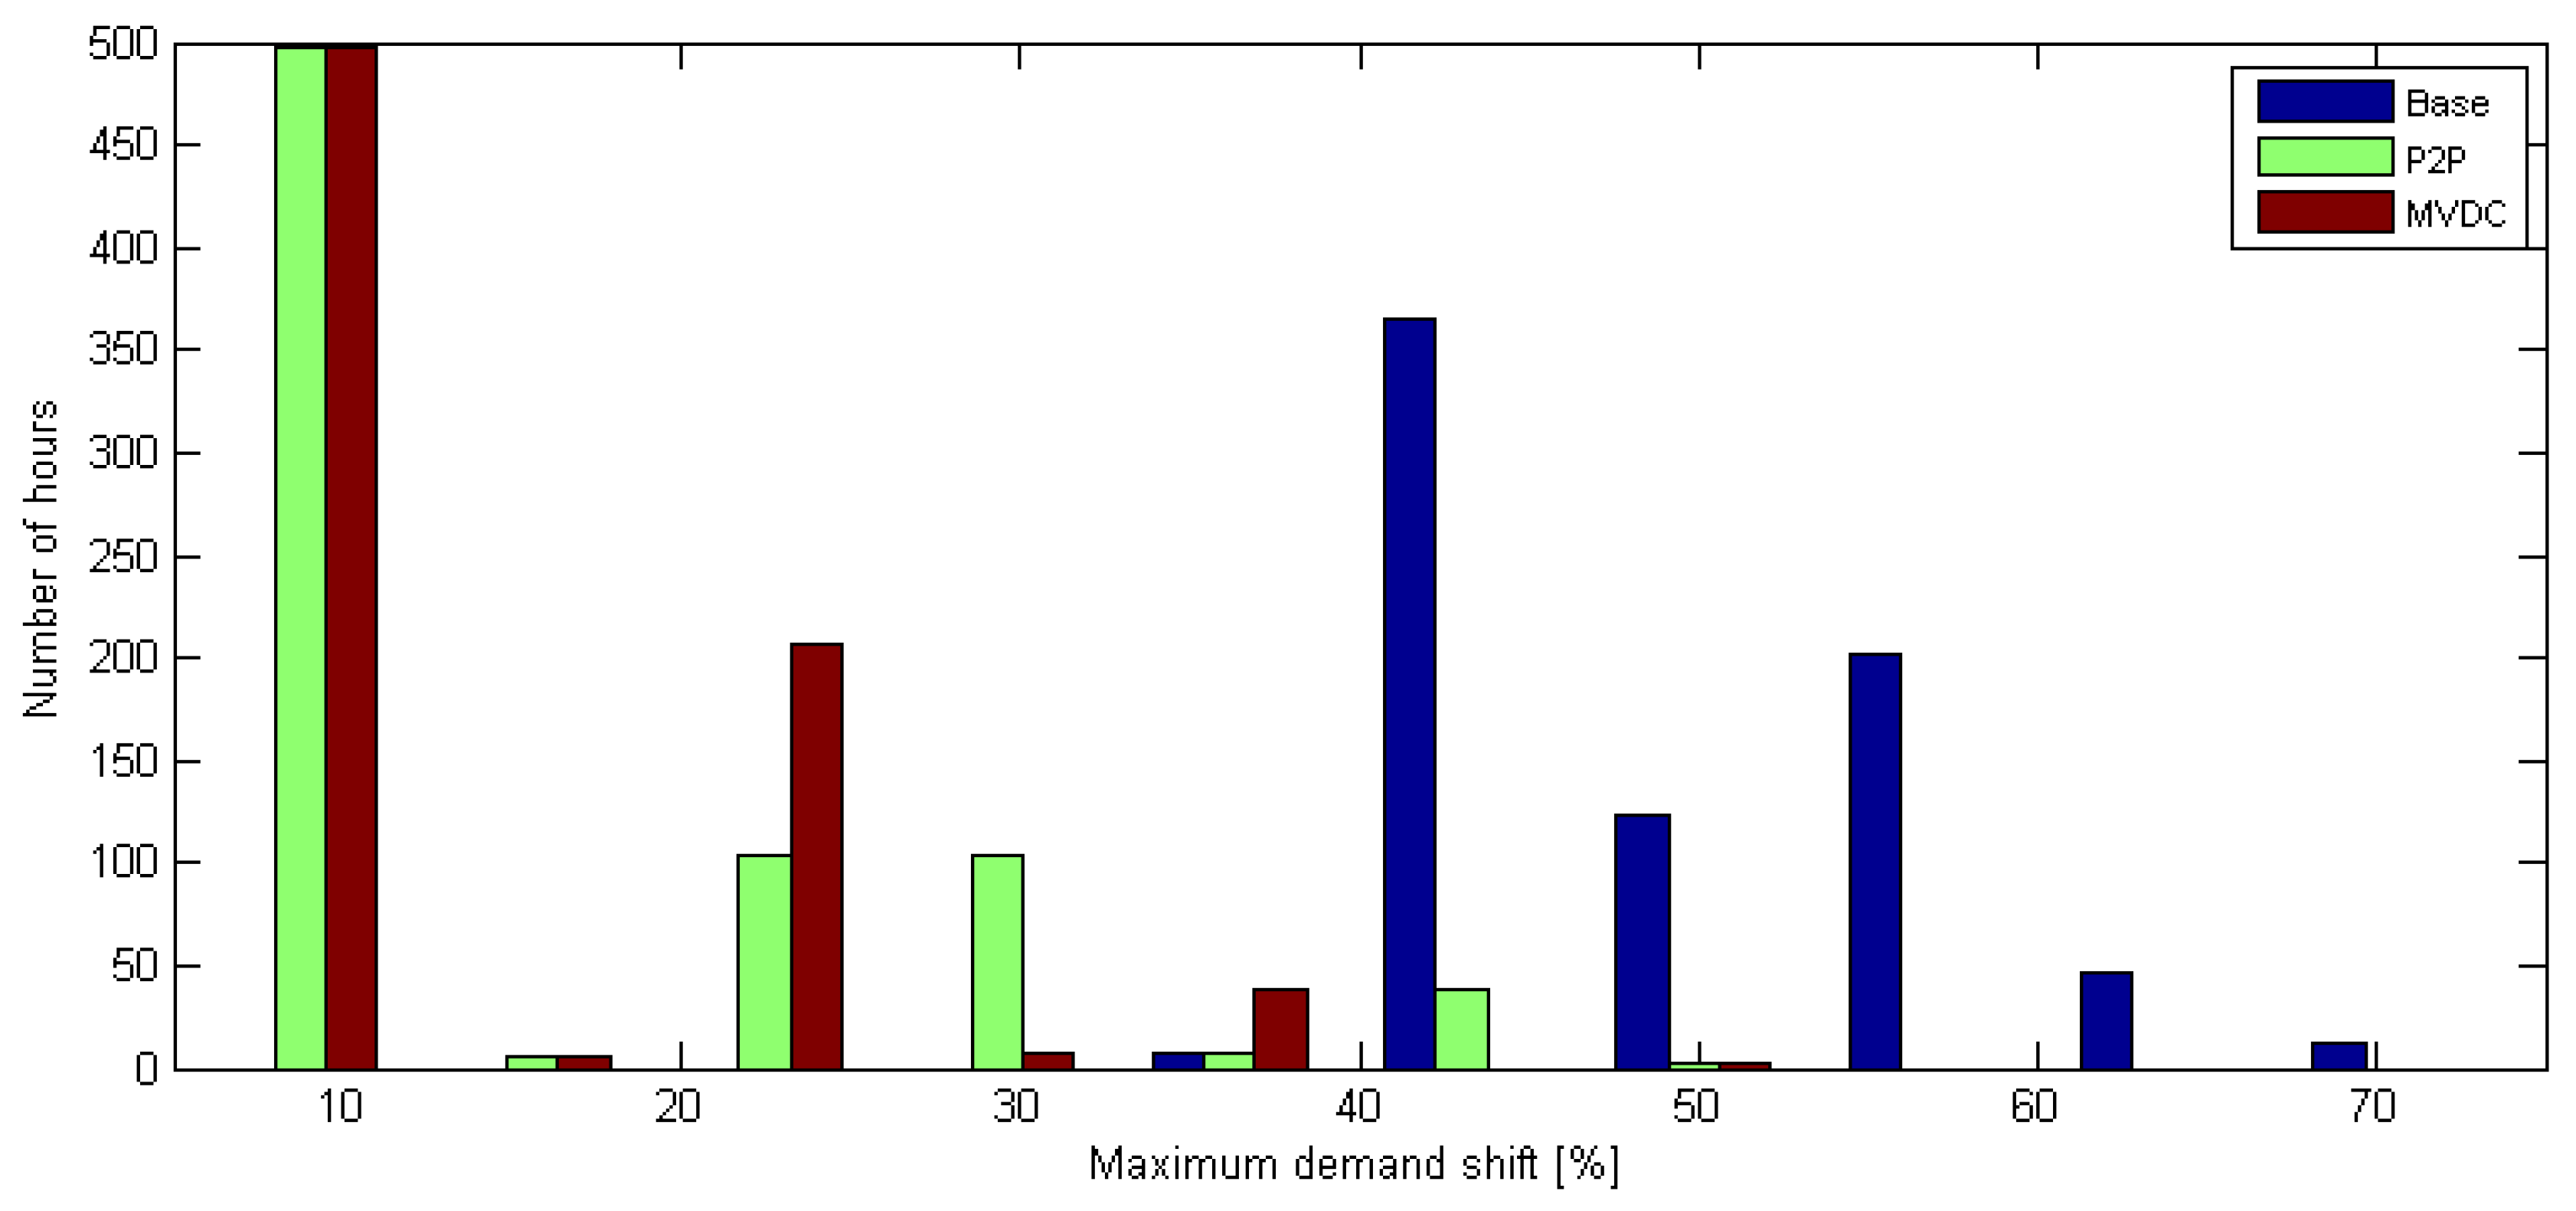
Figure 7 and
Figure 8 show the percentage of maximum demand shift for the analysed three system configurations. The largest demand shift occurred during a period of high demand and low generation (load at 100% of peak demand and both wind generations are 0%), as shown in
Figure 7. However, this scenario did not appear very often as shown in
Figure 8. Results showed that a demand shift of 73.9% in the base case could be reduced to 49.3% (with the P2P configuration) and to 46.7% (with the MVDC configuration). Hence, the MVDC configuration presented the best performance. This particularly can also be observed in
Figure 8, where maximum demand shift using P2P configuration was between 30%–45%, while it was reduced significantly to 25%–40%, when using the proposed MVDC configuration.
4.3. DG Curtailment
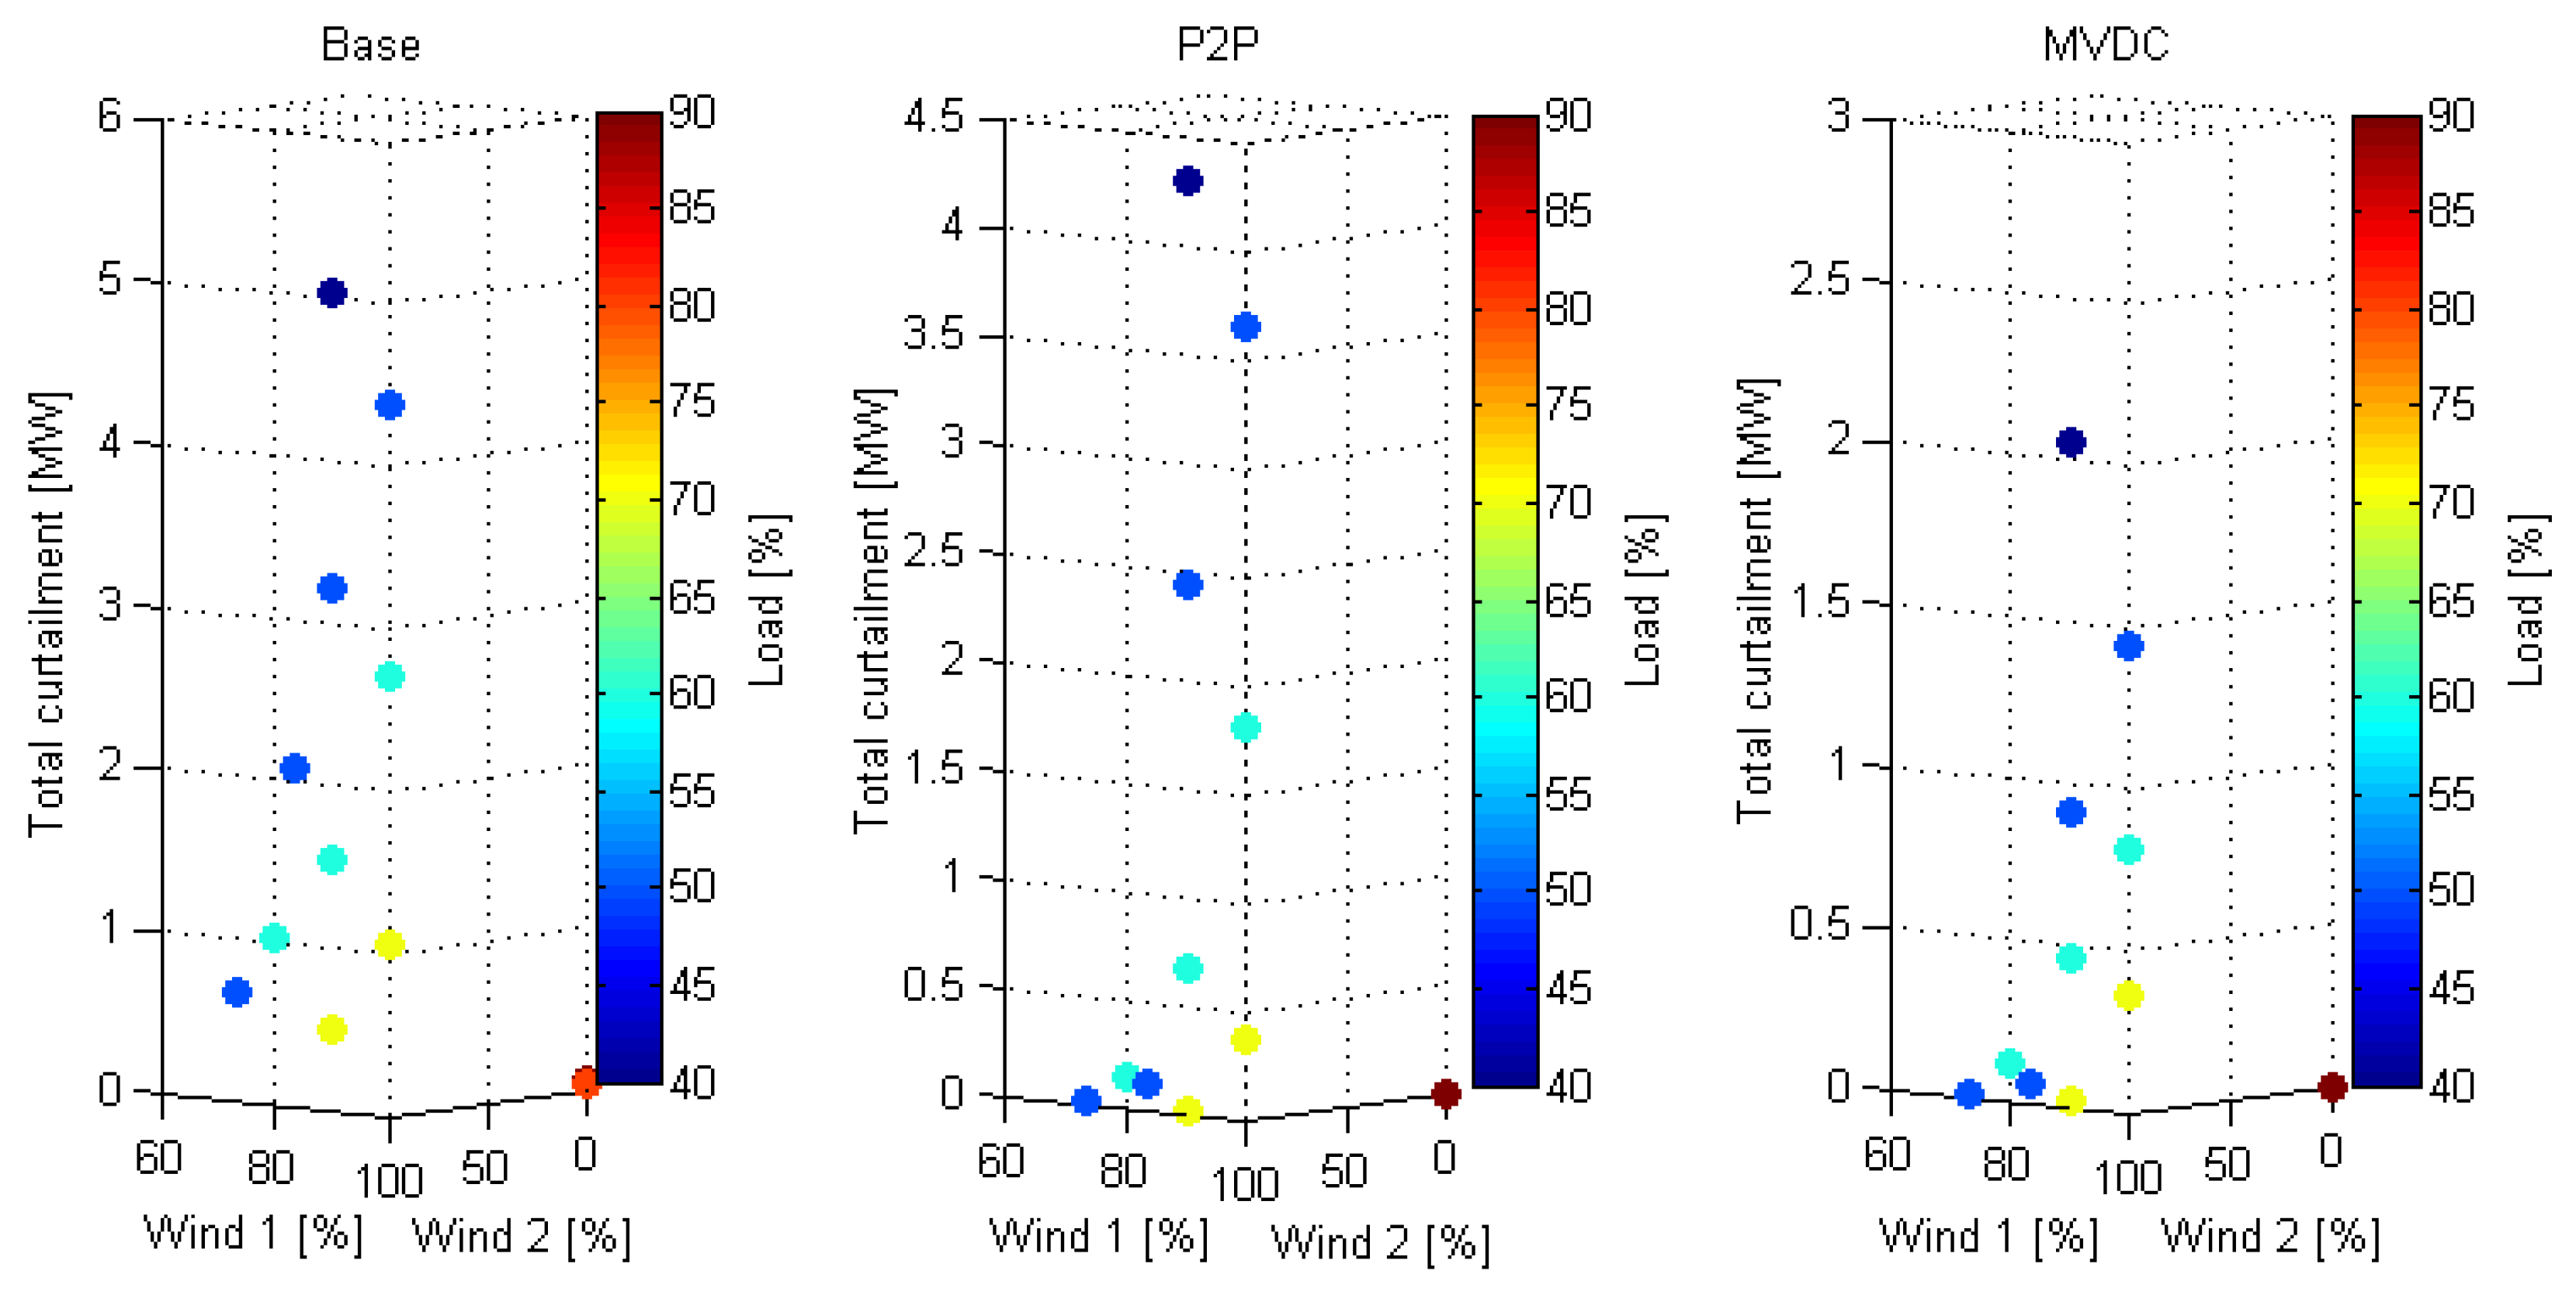
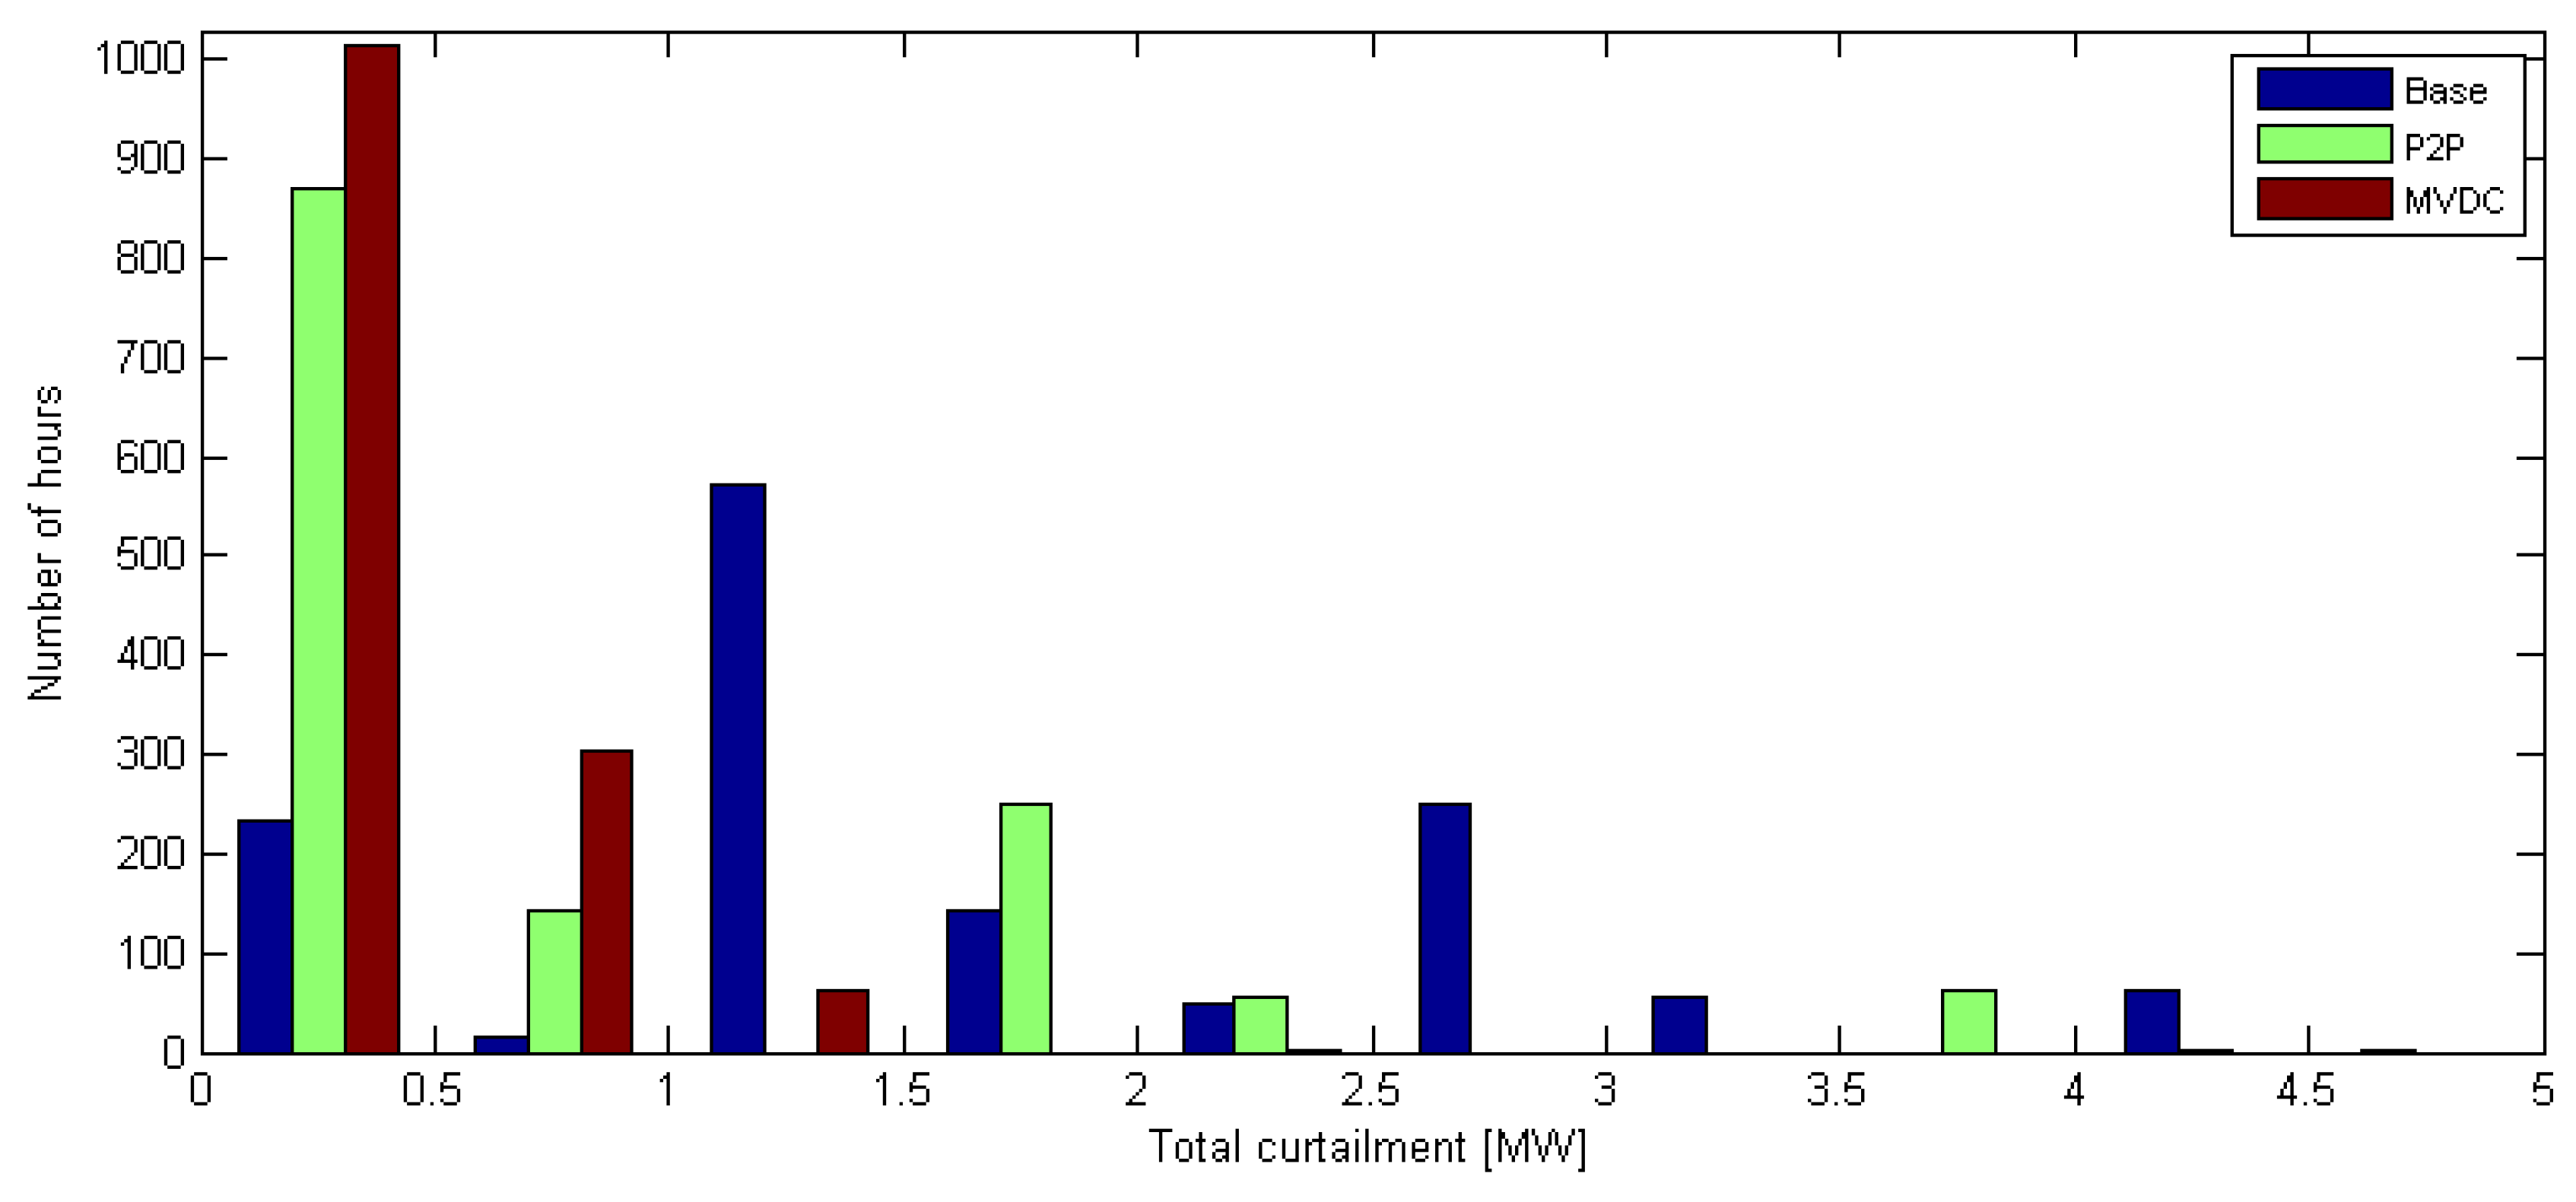
In scenarios with low demand and high generation, the power curtailment of DG takes place.
Figure 9 and
Figure 10 show the total DG power curtailment for the analysed three configurations. The highest total DG power curtailment occurred in the base case (5.03 MW), as shown in
Figure 9. With P2P configuration, DG power curtailment was reduced to 4.29 MW (a reduction of 15%) and DG power curtailment with the proposed MVDC interface was reduced to 2.05 MW (a substantial reduction of 59% was achieved). Furthermore, the DG curtailment was at a minimum when using the proposed MVDC configuration, as illustrated in
Figure 10. Results clearly proved that the application of the proposed MVDC interface maximised the usage of renewable DG resources in the distribution network.
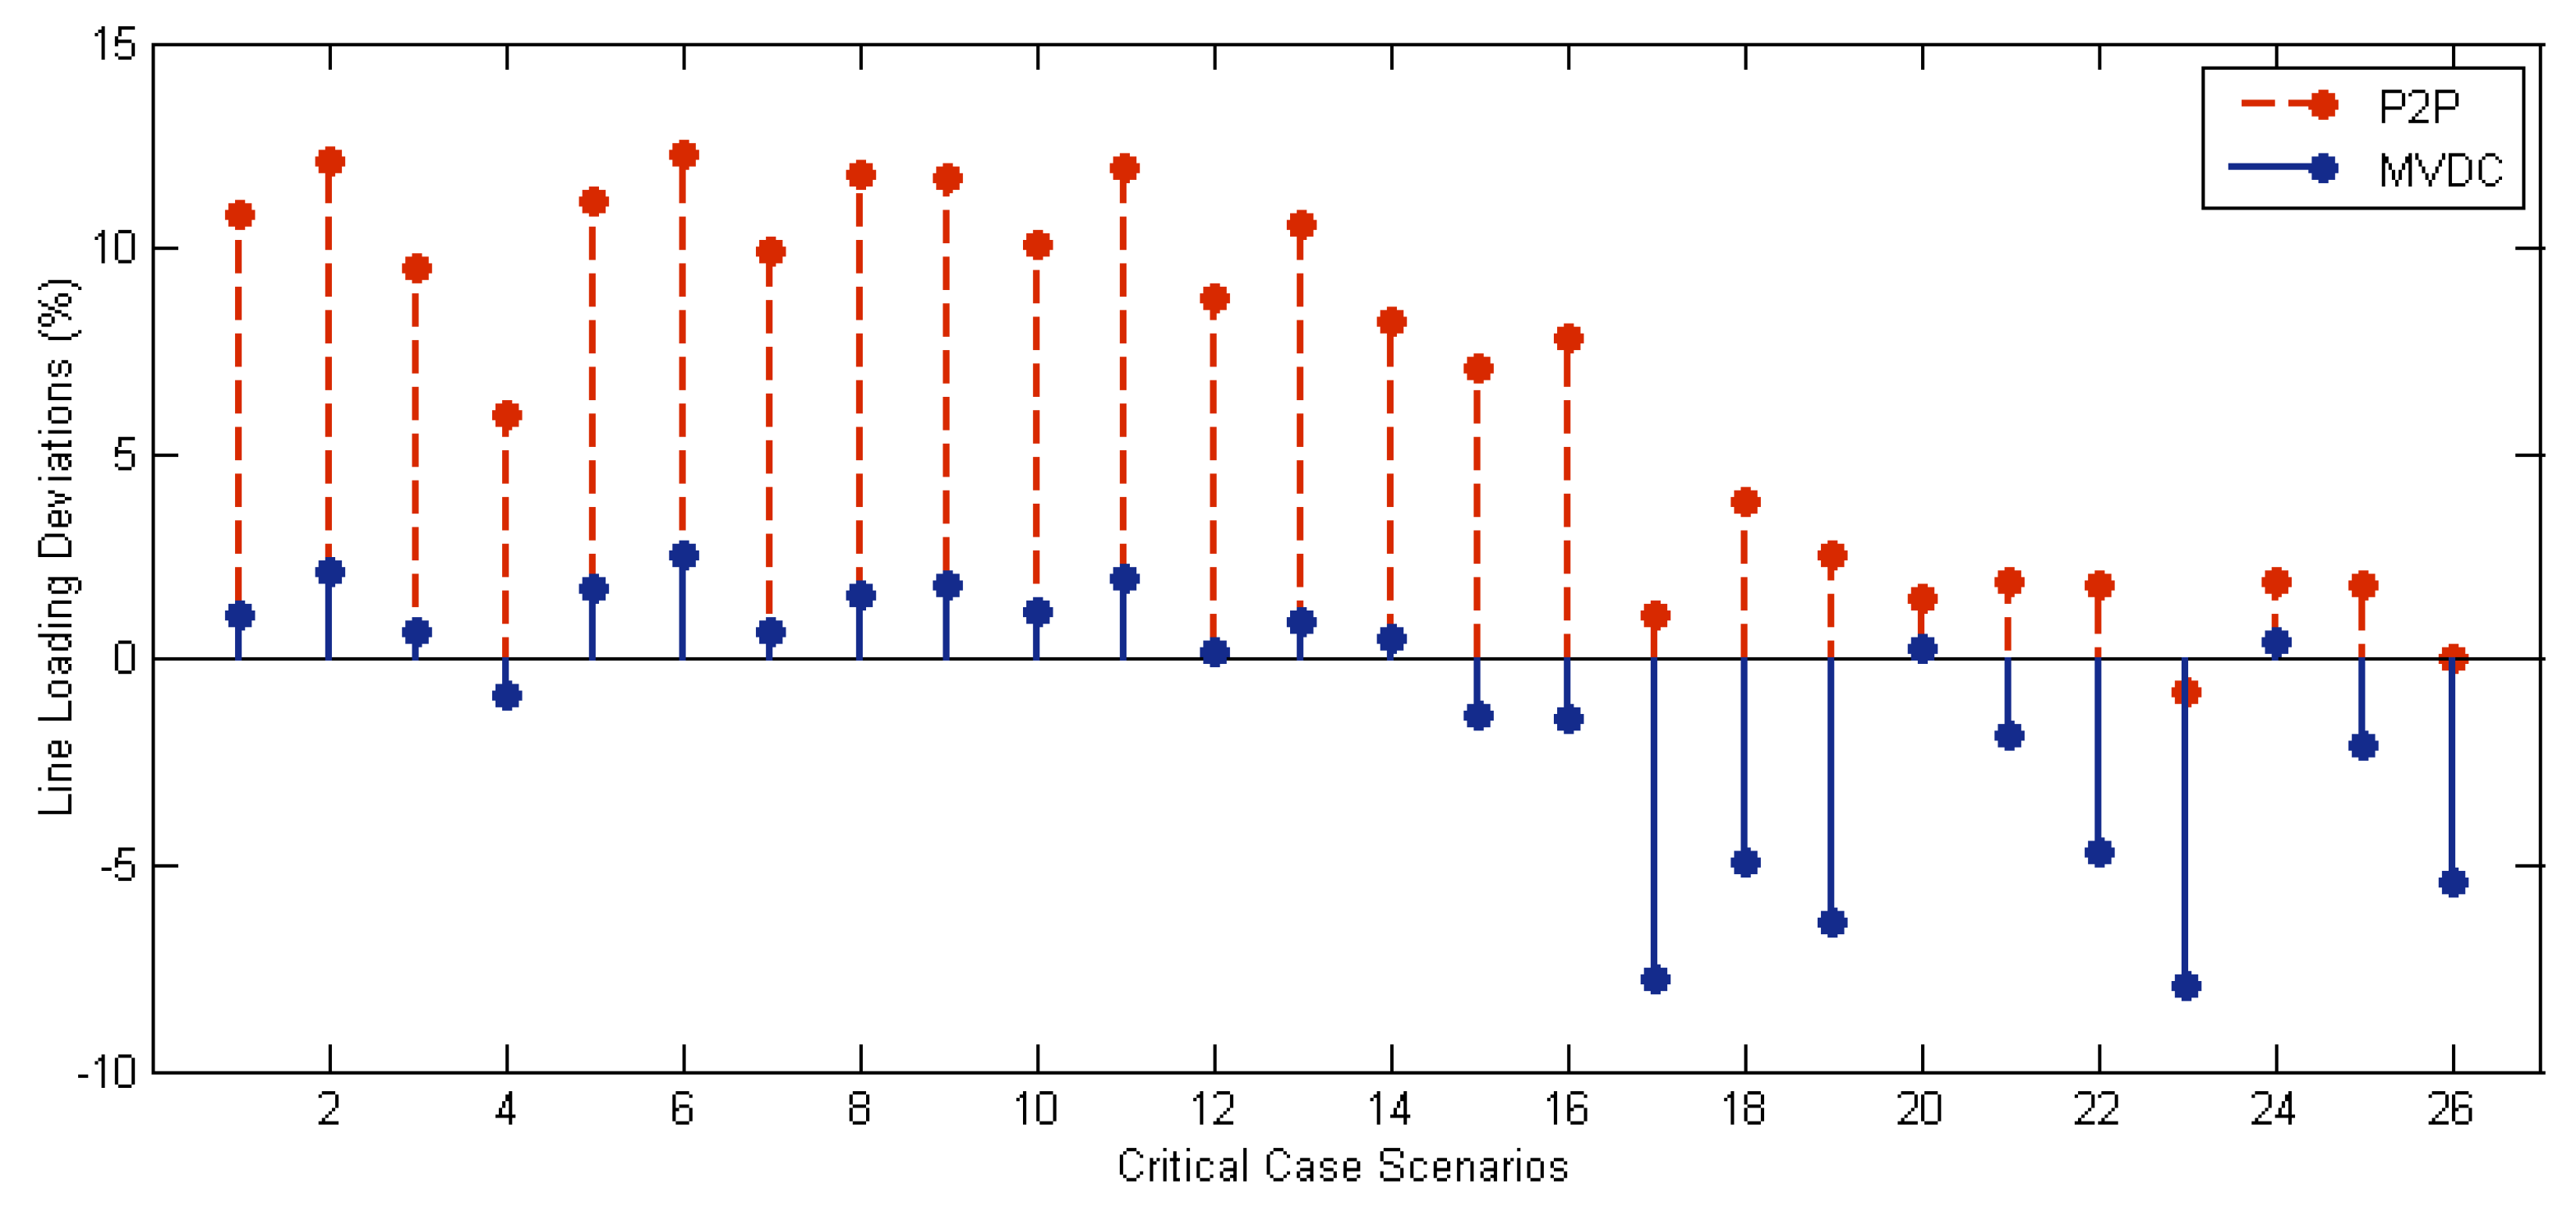
4.4. Line Loading
Figure 11 shows the deviations of the power flow through the line with the highest power loading, obtained with P2P and MVDC configurations. Deviations were calculated with respect to the power flow of the base case: Δline loading (%) = selected case loading (%) − base case loading (%). Results show that P2P configuration presented a much higher line power loading than the base case, in order to maximise the DG usage as well as demand shift. On the other hand, MVDC configuration not only presented lower DG curtailment and demand shift (as shown in previous subsection), but it also maintained the low line power loading during high demand (scenarios 1–16) and further decreased the loading during high DG output (scenarios 17–26). This was due to the fact that the MVDC interface allowed a power exchange between multiple feeders.
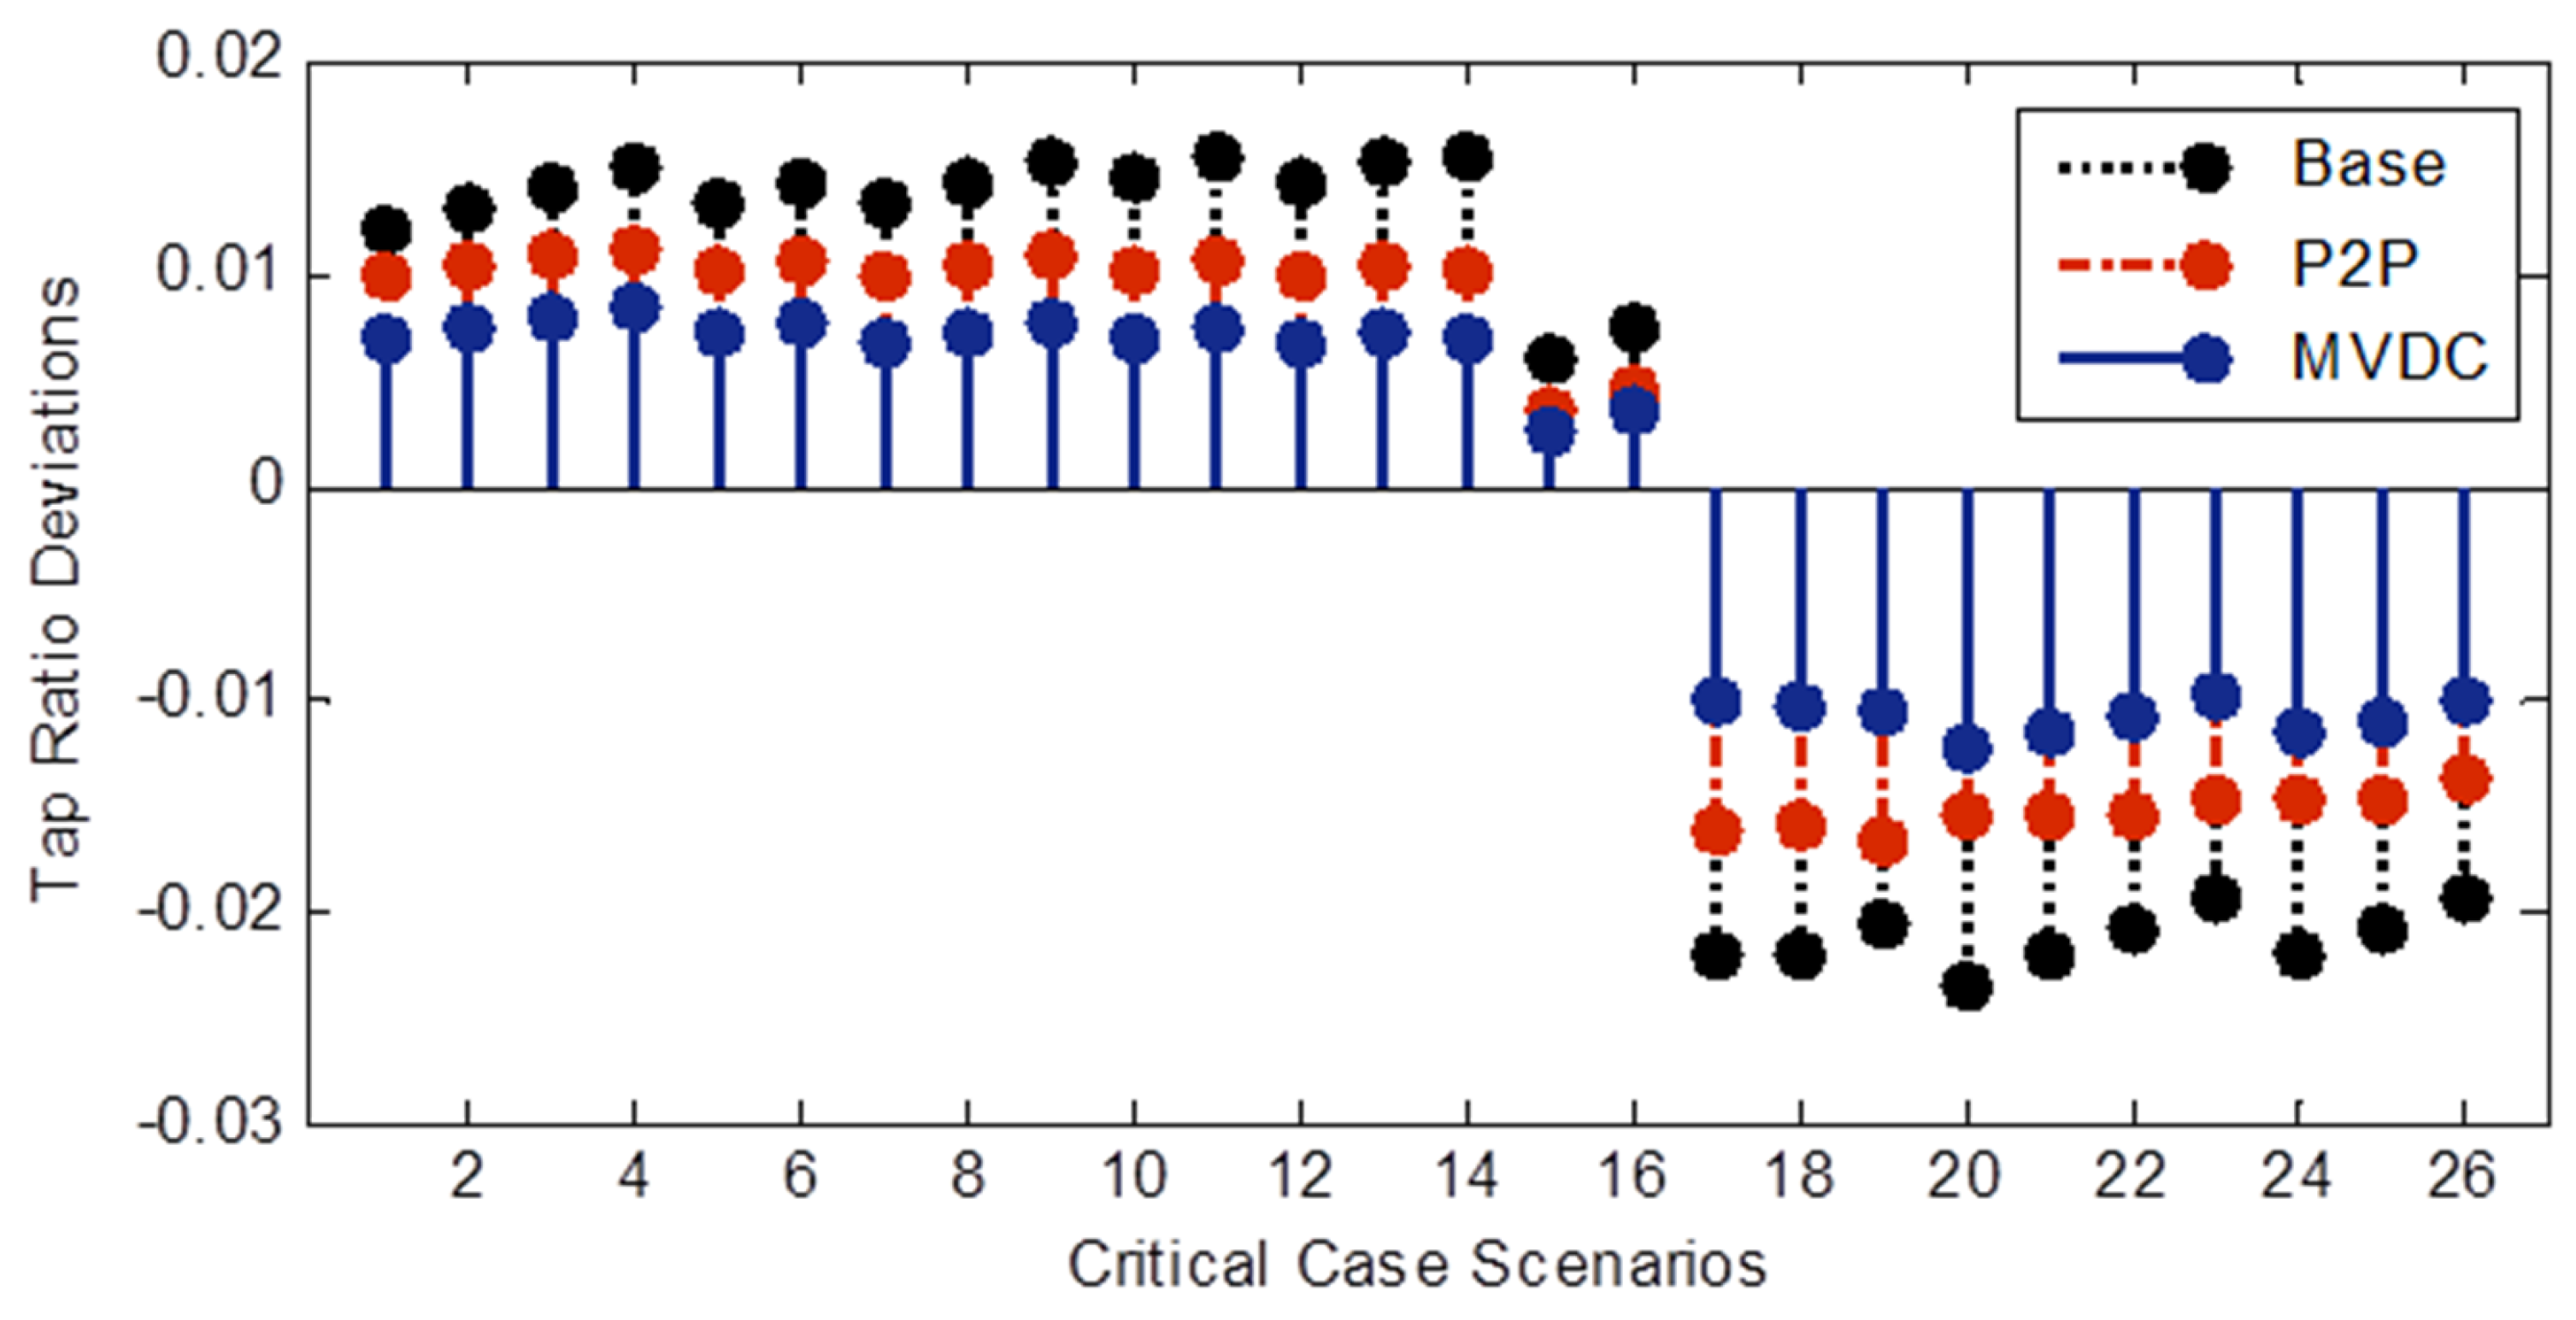
4.5. Tap Ratio Setting
Figure 12 shows the deviation of the tap ratio at the substation transformers, obtained in all 26 critical case scenarios, in comparison to the average tap settings. The deviation of the tap ratio was calculated for each of the analysed three configurations (base case, P2P, and MVDC) and was calculated as:
. The average of the tap settings,
obtained in the base case, with P2P configuration and with MVDC configuration were 1.029, 1.025, and 1.029, respectively. In all three configurations, tap ratios operated at higher values of
r during high-demand at low DG generation (scenarios 1–16 of
Table 2) in comparison to the scenarios with lower demand and higher DG generation (scenarios 17–26 of
Table 2). The base case presents the highest deviations of the tap ratio and less tap ratio deviations obtained with the hybrid configurations (P2P and MVDC). This was because the VSCs in the hybrid AC/DC system could provide fast remedial actions of reactive power support, especially during short-term periods. The MVDC configuration presents the least deviations due to the active power transfer flexibility between multiple feeders through the MVDC network.
4.6. Investment Costs and Revenue
Notwithstanding the fact that the scope of this paper is on evaluating the impact of short-term operational planning cost savings of the MVDC interface when compared to individual P2Ps, a simple cost analysis was carried out to evaluate the operational cost savings in
Table 4, weighing against the initial investment cost of the MVDC implementation. Investment costs to build SOP and new distribution lines have been estimated in [
34] as given in
Appendix B. Referring to
Table A1, the investment cost for two VSC stations in back-to-back configuration (i.e., SOP) is £90,000 or approximately
$57,000 per VSC station and the cost for a new line installation is £65,000/km or approximately
$131,000 per mile in length. We assume the distance between feeders is around half a mile for the additional lines and make use of the existing tie lines to form a MVDC interface in this study.
Table 5 presents an estimated investment cost and return on the investment for the analysed configurations. A net present value (NPV) for the revenue generated from each technology is calculated from the total operational cost savings during period
t (denoted as
) and the total initial investment cost (denoted as
) using the expression in Equation (
20) with an interest rate,
at 5%. The first year operational savings of the P2P and MVDC configurations can obtained from the difference between operational cost of the base case and the analysed configuration in
Table 4. The operational costs are expected to increase over the years (due to inflation) and therefore, total operational cost savings vary at period
t. For simplicity, we consider the operational costs increased in proportion to the interest rate,
, and the lifetime of the invested technologies,
. As shown in
Table 5, the NPV at 30 years for the MVDC configuration is higher than the P2P configuration, which means MVDC is more profitable. The payback period is also presented in
Table 5, obtained when the NPV = 0 (i.e., total revenue equals to the investment cost). It is clearly shown that the MVDC configuration requires less than two additional years as compared to the P2P configuration in order to get payback from the total investment cost. This indicates that the implications on the investment cost are not drastic and can be compensated with the potential technical benefits that can be gained in terms of demand shifting, DG power curtailment, line loadings, and tap ratio settings as discussed earlier.
5. Conclusions
This paper proposed a new security ANM framework for optimal operational planning in active distribution networks using a flexible hybrid VSC-based AC/DC system (containing MVDC interfaces) while upholding a security of supply condition. The proposed (ANM) scheme was described and applied to a modified urban 75-bus UK generic distribution network. The proposed ANM scheme was compared using three configurations: Base case (only AC), P2P (with point-to-point VSCs), and with the proposed configuration (MVDC). The advantage of the ANM framework was that it could guarantee a security of supply at all times akin to the reliability criterion applied to transmission systems (i.e., ).
The results clearly proved that the proposed approach with the proposed hybrid AC/DC configuration improved the operation of the distribution system. The proposed MVDC configuration reduced demand shifting and DG curtailment when compared to normal AC or hybrid P2P configurations while upholding continuity of supply. The MVDC interface also reduced the power loadings of the lines and facilitated the tap changer operation burden, since it provided seamless load balancing between multiple feeders. The use of the proposed MVDC interface also showed significant savings to the DSO, when compared to the P2P configuration with the same number of VSCs.
Nevertheless, further work could be carried out to estimate the exact geographical locations of the MVDC placements. This is however highly dependent on specific networks and the topological and geographical constraints.


