Abstract
The Sudokwon landfill site in Korea, is one of the largest landfill sites in the world, and consists of a first landfill site and second landfill site. The second landfill site generates 3–30 times more H2S than that of the first landfill site. However, the cause of the increase in H2S has not been identified. In this study, the main causes of H2S concentration increase were investigated in the second landfill site in the Sudokwon landfill site. We classified wastes at the Sudokwon landfill site into seven types including Construction and demolition (C&D) debris waste. A lysimeter reactor was designed as a similar environment to the Sudokwon landfill site for simulation. In addition, the experiment was conducted under the same conditions. Three components and elements were analyzed to identify the composition of waste in the landfill site. Leachate was analyzed through a chemical oxygen demand and SO42− standard method. For landfill gas, a gas analyzer was used. The trend in the generation of leachate and landfill gas depending on waste composition at the landfill site was observed and the cause of the increase in H2S was examined. As a result, landfilling of C&D debris waste is recommended as a single landfill.
1. Introduction
Waste is generated from various sources including construction, commerce, industrial, domestic, mining, and agriculture. Particularly, construction and demolition waste are on the increase around the world because of urbanisation. Construction and demolition waste accounts for 44% of total waste in Britain [1], 29% in the USA [2], 44% in Australia, and 27% in Canada. Construction and demolition (C&D) debris waste depend on landfills. C&D debris waste is mostly landfilled. About 35% of landfill waste is reported as C&D debris waste [3,4,5,6]. The percentage of C&D debris waste that is brought to a landfill site in the Republic of Korea, the largest in the world, is on the increase because of redevelopment projects such as the new town project. According to the Sudokwon landfill site statistical yearbook, the percentage of C&D debris waste increased up to 26% in 2018. Regarding the composition of the C&D debris waste that is brought to a landfill at the Sudokwon landfill site, brick construction waste including waste concrete accounts for 29%–31%, earth and sand construction waste including silt 23%–26%, and combustible waste 43%–48% [7].
The problem of the landfill site is odor [8]. According to the U.S. Occupational Safety and Health Administration (OSHA), H2S is mainly responsible for the odor from C&D debris waste at a landfill site accounting for approximately 1% of landfill gas [9]. H2S is generated by the sulphate-reducing bacteria (SRB) sulphate reduction reaction under anaerobic conditions. SRB induces sulphate to be taken into cells and it decomposes and synthesizes ATP via the ATP sulphurylase enzyme in cells. Sulphate (SO42−) is an electron acceptor of H2S and is included in the leachate of C&D debris waste that contains gypsum such as concrete, cement, and drywall [10]. Sulphate (SO42−) oxidizes to decompose ATP converting it into adenosine-5-phosphosul-fate (APS). Sulphite (SO32−) is isolated from APS and sulphite reduces to sulphide (HS−) via dissimilatory sulphite reductase (DSR) generating H2S [11]. However, SRB along with methane-producing bacteria (MPB) under anaerobic conditions are known to play an important role in decomposing organic matter [12,13,14].
Landfill leachate is produced when the moisture content of the waste exceeds the capacity of the landfill site. Increase of moisture content is the main reason for the leachate production, but it contributes to enhancement of biodegradability of the waste [15,16]. Accordingly, it has been reported that enhancement of biodegradability leads to rapid stabilization [17]. However, increase of moisture content also causes a decrease in void ratio of the landfilled wastes, leading to the anaerobic condition [18]. When C&D debris wastes is landfilled, it was reported that a large amount of H2S is generated due to the exudation of SO42− [19].
H2S is known to cause acid rain and be harmful to human health because of its severe odor (rotten egg smell). The H2S indoor exposure concentration limit as determined by OSHA is 10 ppm for 10 min. It has been reported that at 100 ppm H2S paralyzes the olfactory nerve within 2–15 min and at 800 ppm lethality reaches 50% (LC50) at an exposure of 5 min. Odor is not accumulated but it causes widespread damage. Specifically, odor from a landfill site stays on the earth’s surface as it is not diffused by low pressure making it more severe during the morning and evening. When wetness is high, moisture in the atmosphere easily attaches to the olfactory organ causing stimulation [20].
The Sudokwon landfill is the world’s largest landfill and consists of a first landfill site and second landfill site. As the proportion of C&D debris wastes increased, C&D debris wastes were landfilled not only in the first landfill site but also the second landfill site, leading to odor occurrence. It is estimated that earth and sand construction waste that contains gypsum in the form of fine particles is mainly responsible for odor in a landfill site. It has been reported that for the first landfill site, H2S is generated at less than 1000 ppm and for the second landfill site in which construction waste, domestic waste, and industrial waste are mixed, the H2S concentration reaches at least 4000 ppm and at most 30,000 ppm [21]. It is necessary to examine substances that result in an increase in the H2S concentration at the second landfill site and its cause. However, former studies have focused on underground water pollution caused by landfill leachate, cover material for odor control, and CH4 production efficiency enhancement [22,23,24]. Additionally, for the simulation of H2S production in landfill gas, research on pilot-scaled lysimeter reactors is insufficient. Moreover, research on the production characteristics of the leachate produced from mixed waste containing C&D debris waste and the landfill gas production characteristic is insufficient [19,25,26].
In this study, the main causes of H2S concentration increase were investigated in the second landfill site in the Sudokwon landfill site. A lysimeter reactor was designed for landfill modelling of landfilled wastes in the Sudokwon landfill site. The landfill consisted of seven samples of C&D debris waste, C&D debris waste and sewage sludge, C&D debris waste and solidified sludge, mixed waste, domestic waste, brick construction waste, and earth and sand construction waste, respectively. Three components (moisture, ash content, and combustibles) and elements were analyzed to identify the composition of the waste landfilled at the Sudokwon landfill site. The trend in the landfill gas and leachate from the seven samples of landfill was analyzed. Causes of H2S concentration and odor increase at the second landfill site was investigated according to the waste composition.
2. Materials and Methods
2.1. Selection of Waste to Be Used in This Study
For the investigation of H2S production and content analysis, different wastes were selected. The wastes were sewage sludge, solidified sludge, domestic waste, and construction waste which belong to general industrial waste in the Sudokwon Landfill Site Management Corporation in 2018. It was conducted to identify the SRB activation between construction waste which contains gypsum (CaSO4 2H2O), combustible waste with abundant organic matter (domestic waste), and organic waste (sludge). Data from 2009–2011 were used for the overall waste composition. According to the data, the composition of domestic waste was 24% (2,193,979 tons) for 3 years, and the percentage of sewage sludge dumped at the landfill site was 21%. For construction waste, the amount of waste that was dumped at the landfill site was 4,977,188 tons accounting for 55%. In this study, construction waste consisted of brick construction waste at 12%, earth and sand construction waste at 38%, and combustibles at 50% as landfilled by the Sudokwon Landfill Site Management Corporation [27].
For domestic waste, combustibles were used except for food, paper, textile, wood, rubber leather, and plastic. For construction waste, samples that contained combustibles such as wood, plastic, paper, and textile and non-flammable waste such as brick construction waste, earth and sand construction waste, metal, and glass porcelain were used. Samples that were used in this study were applied based on the composition of waste dumped at the landfill site. This study examined the characteristics of the generation of landfill gas when C&D debris waste and other wastes were mixed landfilled and estimated to contain the most SO42−. As shown in Table 1, a total of seven types of waste were assessed in this study.

Table 1.
Type and composition ratio of seven wastes from the Sudokwon landfill site.
2.2. Design of the Lysimeter Reactor and Filling
To maintain a volume of 100 L for the waste sample, stainless use steel (SUS) was selected for the lysimeter reactor. A moisture injection tube, gas sampling port, and pressure gauge for checking gas generation were installed. At the sides, sampling ports were installed at the top, middle, and bottom in preparation for recirculation of leachate and a water meter for checking moisture inside was installed. Thermometers were installed at the top and bottom to check the temperature in the reactor. For temperature control, a heat-insulating material was installed on the side and a water-heating device was installed at the bottom. The thermometer and electric panel for temperature control were installed in the middle. At the bottom, a leachate spill tube was installed, and pebbles were placed to prevent the loss of waste when leachate leaked and the pebbles were filled up to the bottom of the heating device to prevent waste from being directly heated (Figure 1 and Figure 2). The pebbles were filtration sand (membrane) containing 90% or more SiO2. Small sized pebbles 5–10 mm and 20–30 mm in size were filled first.
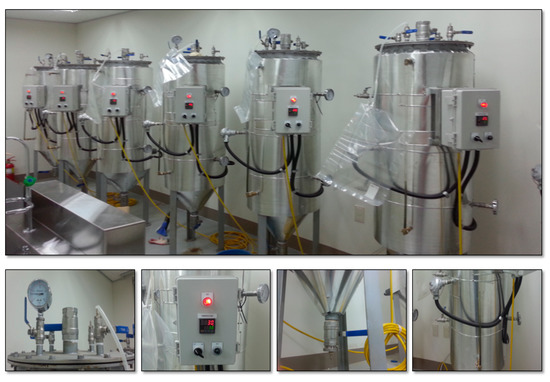
Figure 1.
Photos of the experimental lysimeter reactor.
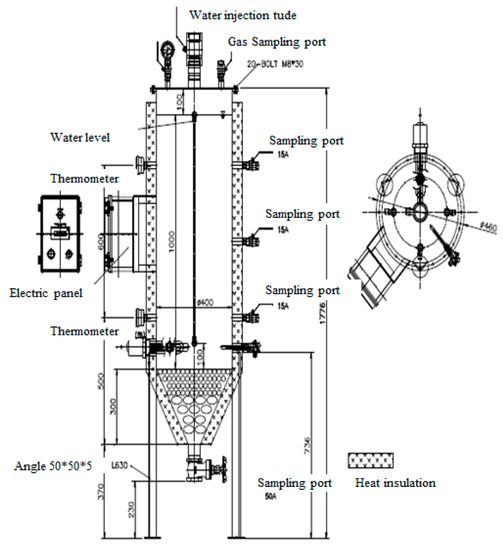
Figure 2.
Column schematic of the experimental lysimeter reactor.
For the waste sample, domestic waste collected from Suwon city in Gyeonggi was used. For other wastes, waste dumped at the landfill site at the Sudokwon landfill site was collected three times and 100 L of waste was filled mixing it by weight ratio. The waste size was set at 20 mm or less. Waste of the same shape was mixed with other wastes in a reactor. For consolidation, force was applied between filling. The apparent density was measured to understand the degree of consolidation.
2.3. Three Component and Chemical Composition
Seven types of waste samples were analyzed for moisture, solidified substances, loss ignition, and organic matter content according to a waste process test standard (2011.01). Samples were dried for 4 h at 105–110 °C according to the moisture and solidified substance-weight method (ES 06303.1) and the amount (%) of moisture and solid material was determined after cooling in a desiccator. Samples were heated with ammonium nitrate solution (25%) according to the loss ignition and organic matter content-weight method (ES 06301.1) and ignited for 3 h in an electric furnace at 600 ± 25 °C. They were then cooled in a desiccator and weighed to determine the amount of loss ignition and organic matter content (%) from the difference in weight in the evaporation dish. Moisture, combustibles, and ash content, the three components, were noted. The solid material of the sample except moisture content was marked as TS (total solid). Volatile solid material, dry standard loss ignition was marked as VS (volatile solid).
Elemental analysis was conducted in terms of chemical composition. Elemental analysis was originally designed to analyze the standard of coal and coke but it has been used widely to determine elemental composition. The content of nitrogen, carbon, hydrogen, sulphur, and oxygen was analyzed by landfilling samples at a high temperature (900 °C) and decomposing them into gases containing various elements and measuring the thermal conductance of these gases using an elemental analyzer (EA) according to KS E3709.
2.4. Gas and Leachate Analysis Method
Gases generated from the waste sample were measured using a gas meter (OSR-1000, Sensoronics Co., Ltd., Washington, DC, USA). The measuring range of CH4 and CO2 was 0%–100%. The measuring range of H2S was 0–5000 ppm. Highly concentrated samples above the measuring range were analyzed by calculating dilute magnification based on the measurement of a detector tube and using a gas sampling bag and gas syringe diluted with nitrogen gas. For measuring gas production, a wet gas meter (W-NK-5A, Shinagawa Co., Ltd, Tokyo, Japan) was used connected to a gas meter outlet. An H2S concentration greater than 5000 ppm was measured using a detector tube. The detector tubes were 4LT (0.1–4.0 ppm), 4H (100–4000 ppm), and 4HP (1%–20%). An Agilent Technologies, gas chromatographer equipped with TCD detector (7890A, Agilent Co., Ltd., CA, USA) was used to verify the measured value. Gases to be analyzed were diluted using nitrogen (N2) gas. H2S, CH4, and CO2 were analyzed. PLOT Q was used as a column. Gases were analyzed under a temperature increasing condition from 60 °C (2 min) to 240 °C (1 min). Table 2 shows the analysis of leachate generated by landfill gas. Chemical oxygen demand (CODCr) was analyzed according to Standard Methods using the reagent SO42− and total-sulphide (H2S, HS−, and S2−) using a spectrophotometer (DR5000, Hach Co., Ltd., Loveland, CO, USA).
Table 2.
Water quality analysis method of leachate.
3. Results
3.1. Results of the Analysis of the Three Components
Three components of waste at the landfill site were analyzed, combustibles, ash content, and moisture, affecting the growth of microorganisms. According to the analysis of moisture content and odor-generating mechanism path, moisture content plays an important role in generating odor by affecting microorganism activity and the biodegradation path of the substrate. It has been reported that at a high moisture content of 60%–80%, oxygen begins to be exhausted after 3 days which facilitates the anaerobic process which is favorable for odor generation [28]. In addition, moisture content is well known to contribute to leachate production [16]. Moisture, solid matter, loss ignition, and organic matter were calculated according to the waste process test method. The basic physical composition of the seven types of samples was investigated through analysis of the three components. It was found that most waste samples except the C&D debris waste + sewage sludge sample consisted of solid material (TS) at greater than 70%. The solid material in the C&D debris waste was as high as 91.05%. However, solid material in the C&D debris waste + sewage sludge sample was 69.57%, and in the C&D debris waste + solidified sludge sample 76.15%. The reason the percentage of solid material in the sewage sludge and solidified sludge is lower than that of the other samples is that moisture content in the aforementioned sludge is high; 86.30% in the sewage sludge and 50% in the solidified sludge (Table 3).
Table 3.
Three component analyses of seven wastes from the Sudokwon landfill site (Average of two analyses).
The basic physical properties of samples as well as percentage of moisture affecting the growth of microorganisms were identified. Mixing sludge and construction waste raised the moisture in the C&D debris waste to 30.43% from 8.95%; thus, mixed sludge and C&D debris waste is more favorable to an anaerobic reaction than single C&D debris waste.
3.2. Results of Elemental Analysis
Results of elemental analysis are shown in Table 4. The chemical composition of the samples was investigated. The chemical composition of nitrogen, carbon, hydrogen, sulphur, and oxygen was analyzed. The percentage of sulphur (S) that contains SO42− generating H2S and carbon (C), which is an energy source of microorganisms, was identified through elemental analysis. The sample that contained the most carbon was domestic waste at 57.17%. However, the carbon content in brick construction waste and earth and sand construction waste, which are non-flammable, was 3.24% and 7.23%, respectively.
Table 4.
Chemical composition of seven wastes from the Sudokwon landfill site (%, on a dry basis, Average of two analyses).
Earth and sand construction waste that contained fine particle such as gypsum showed the highest sulphur contents. Fine particles of C&D debris waste generated in Florida had sulphur. It has been reported that gypsum remaining in C&D debris waste is the main source of sulphate [29,30]. Earth and sand construction waste shows a high percentage of sulphur. The reason C&D debris waste + solidified sludge shows a higher sulphur contents than C&D debris waste + sewage sludge seems to be the influence of a firming agent (cement). It seems that the creation of SO42− generating H2S and the increased carbon, an energy source of microorganisms, facilitates SRB microorganism proliferation increasing H2S production.
3.3. Characteristics of Gases and Leachate Generated from the Lysimeter Reactor
The lysimeter reactor was designed and operated at the optimal temperature of 30 ± 3 °C which is similar to the landfill site to examine the cause of the increased H2S by identifying the characteristics of the generation of leachate and landfill gas in seven samples (earth and sand construction waste, brick construction waste, C&D debris waste, C&D debris waste + solidified sludge, C&D debris waste + sewage sludge, and domestic waste) based on waste landfilled at the second landfill site. Leachate CODCr, SO42− concentration, and a change in gas composition (%) in each reactor are shown in graphs (Figure 2, Figure 3, Figure 4, Figure 5, Figure 6, Figure 7 and Figure 8). Leachate CODCr, SO42− concentration, and a trend in the generation of landfill gas were investigated according to composition of landfill samples to examine the cause of the odor at the second landfill site and propose management policies.
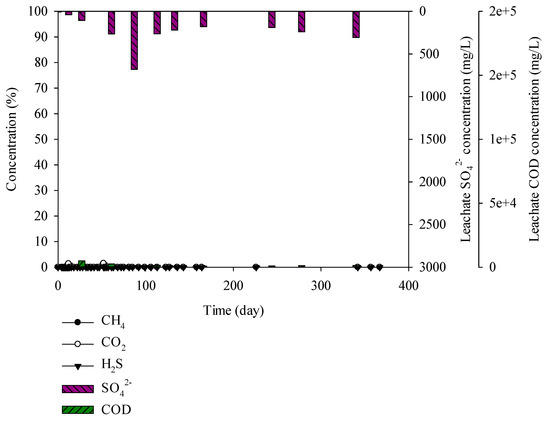
Figure 3.
Landfill gas and leachate CODCr and sulphate (SO42−) versus time for the brick construction waste.
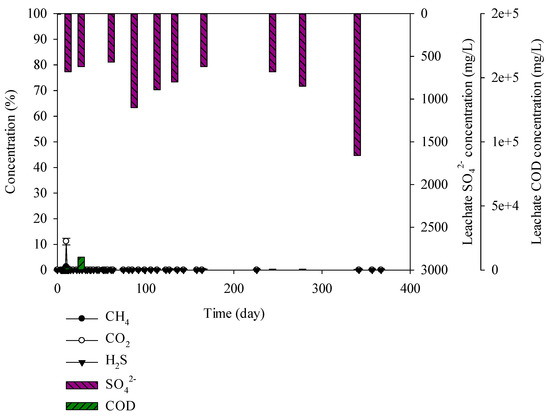
Figure 4.
Landfill gas and leachate CODCr and SO42− versus time for the earth and sand construction waste.
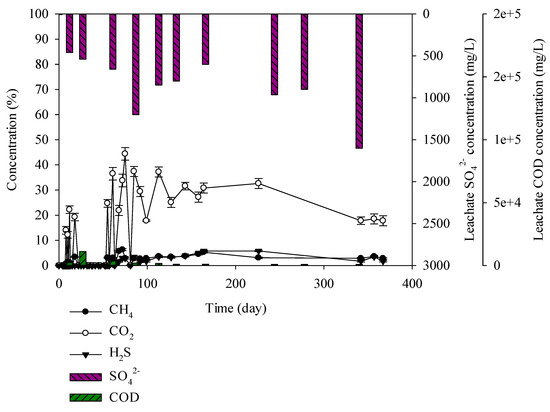
Figure 5.
Landfill gas and leachate CODCr and SO42− versus time for the construction and demolition (C&D) debris waste.
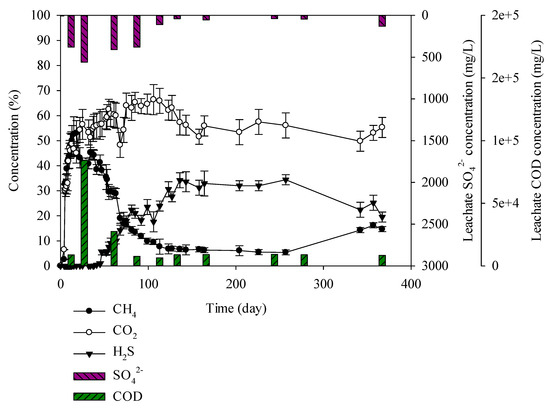
Figure 6.
Landfill gas and leachate CODCr and SO42− versus time for the C&D debris waste + sewage sludge.
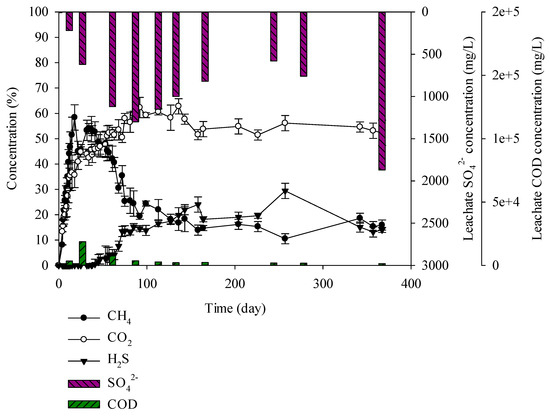
Figure 7.
Landfill gas and leachate CODCr and SO42− versus time for the C&D debris waste + solidified sludge.
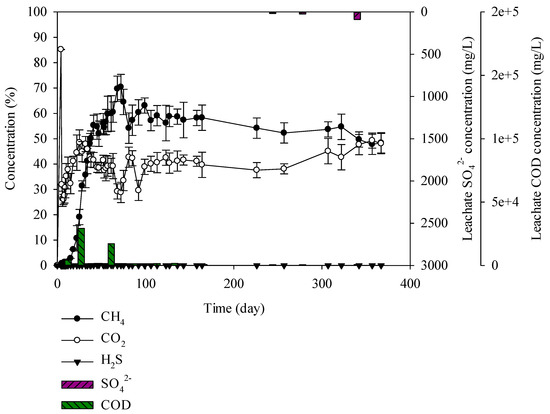
Figure 8.
Landfill gas and leachate CODCr and SO42− versus time for the domestic waste.
It was found that the moisture, carbon, and sulphur contents in brick construction wastes were 0.01%, 3.24%, and 0%, respectively. CODCr and SO42− concentrations in the leachate were 660–4951 and 7–680 mg/L, respectively. CH4, CO2, and H2S, which are landfill gases, are not generated (Figure 3).
According to Lopez and Lobo (2014), 500 mg/L of H2S was produced from the leachate at 100–800 mg/L of SO42− concentration [31]. Asakura (2015) reported that SO42− concentration has to be below 50 mg/L to control the H2S production below 1000 mg/L, and SO42− below 100 mg/L to control the H2S production below 2000 mg/L [32]. However, the mentioned research is the result of biodegradable materials by microbiological degradation. Thus, in this study, waste from the landfill site was used and the SO42− concentration was 7–680 mg/L, without H2S production. Comparison of the lysimeter experiment with the landfill site waste was insufficient.
For the earth and sand construction waste, moisture, and carbon and sulphur were 15.88%, 7.23%, and 5.15%, respectively. The percentage of moisture and carbon in the earth and sand construction waste was higher than that in the brick construction waste. The CODCr concentration in the leachate was 616–10,024 mg/L. The SO42− concentration in the leachate was 7–1660 mg/L, which was higher than that in the brick construction waste. However, CH4, CO2, and H2S, were not generated (Figure 4). In the case of the brick construction waste, SO42− concentration in the leachate was maintained due to low water content and sulphur content. On the other hand, earth and sand construction waste contained high water content and sulphur content. It showed SO42− accumulation due to inhibition of landfill gas production caused by microorganism inactivation. Lay et al. (1997) conducted a long-term landfill gas experiment. Rapid degradation occurred in 0~250 days, leading to production of landfill gas. After 250 days, the pH of leachate was changed to neutral, and the non-degraded wastes ran-off in the leachate [33]. In this study, SO42− concentration was increased in the samples containing C&D debris waste as shown in Figure 4, Figure 5, Figure 7 and Figure 9, and this result is caused as the C&D debris waste would have ran-off in the leachate, leading to the SO42− increase. This result was also shown in the C&D debris waste, C&D debris waste + solidified sludge, and the mixed waste. It seems that microorganisms did not activate. The leachate contains abundant SO42− via the earth and sand construction waste but H2S was not generated.
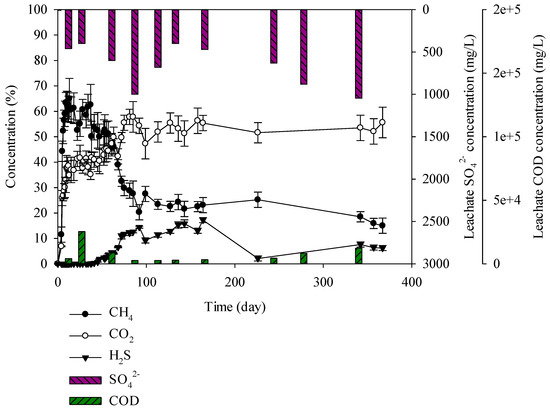
Figure 9.
Landfill gas and leachate CODCr and SO42− versus time for the mixed waste.
C&D debris waste samples consisted of brick construction waste at 12%, earth and sand construction waste at 38%, and combustibles at 50%. Percentage of carbon was high at 26.7%. CODCr concentration in leachate was low at 840–11,111 mg/L. Combustibles consisted of wood, plastics, paper, and textile by which microbial decomposition is difficult. Moisture content in leachate was low at 8.95% and leachate CODCr was relatively low. SO42− in leachate was 7–1600 mg/L given the influence of sulphur in earth and sand construction waste. CO2 generating from C&D debris waste was 12%–44% and showed the highest level at 44% on the 75th day, CH4 production was 0%–6.3% and H2S production was 0%–5.8% or less (Figure 5). Yang et al. has designed landfill modelling with concrete waste and the mixture of framed wall, wood, and concrete waste. Consequently, highly concentrated H2S was generated with the existence of framed wall. It was reported that framed wall provided the organic matter for the SRB activation [34]. Biological sulphuric acid needs an organic carbon source [35]. As a result, for C&D debris waste in which combustibles are mixed, H2S production increases to 5.8% and odor at the landfill site will occur. It seems that H2S generation up to 5.8% was caused by the combustibles and the environment in which microorganisms can live a carbon source that is included in the combustibles.
When conducting an experiment with mixed C&D debris waste, sewage sludge, and solidified sludge, it was found that C&D debris waste + sewage sludge produced 52% methane up to 13 days. After 14 days, methane decreases gradually and after 47 days it decreased up to 38%. However, hydrogen sulphide increased as methane decreased. Sulphate in leachate decreased gradually with CODCr concentration after 27 days. Hydrogen sulphide concentration increased as sulphate and CODCr in leachate decreased. As sulphate and CODCr concentration decreased, H2S concentration increased. Hydrogen sulphide in C&D debris waste + sewage sludge sample generated 5% on the 47th day and 34% on the 136th day and it remained until the 257th day. Methane generated until the 47th day and then it decreased. Hydrogen sulphide increased for 47 days as methane decreased and it continued until the 257th day (Figure 6). Chen et al. (2014) reported that in the early days of competition between MPB and SRB, for CODCr consumption, MPB was 47%–61% and SRB was 21.26% and since then CODCr consumption in SRB increased to 42%–65% [36]. The SO42− concentration of the leachate produced from the C&D debris waste + sewage sludge was lower than other samples. This is due to stabilization of the SRB microorganisms in the reactor, leading to increase of SO42− consumption. In the research of Fairweather and Barlaz, effects of municipal solid waste, C&D waste, and sewage sludge on H2S production were verified. The C&D debris leachate was produced, and resulted in strong H2S odor [37]. In the event that there are sufficient sulphate and CODCr in leachate, MPB are prevalent until the 47th day and thereafter SRB microorganisms are prevalent. It seems that generation of highly concentrated H2S at the second landfill site is caused by mixed landfilling, particularly sewage sludge having a great influence. It is advisable that when landfilling C&D debris waste, sewage sludge should be separated from C&D debris waste.
C&D debris waste + solidified sludge increased, producing 58% of the methane until the 18th day. After 22 days, the C&D debris waste + solidified sludge gradually decreased and after 47 days it decreased up to 48%. As with the C&D debris waste + sewage sludge, in the C&D debris waste + solidified sludge, H2S began to increase. H2S generated from C&D debris waste + solidified sludge was 10% less than that from C&D debris waste + sewage sludge. According to Swati et al. (2005), moisture content is one of the key factors for the stabilization of microorganisms [38]. Yang et al. in 2000 reported that in the event that concrete is contained in construction waste, it increases the pH in the leachate creating a less favorable environment for activation of SRB microorganisms [35,39]. When creating solidified sludge, cement is used as a firming agent. In this study, it was found that the pH in the C&D debris waste + solidified sludge after 100 days was 7.6–8.81, which was higher than that of the other wastes. It appears that SRB microorganisms in the C&D debris waste + solidified sludge were less activated than in the C&D debris waste + sewage sludge given the influence of less moisture and firming agent (Figure 7). C&D debris waste + solidified sludge produced a high H2S content of 24%, which implies that it influenced generation of H2S at the second landfill site.
Sulphur was not found in the domestic waste. For landfill gas, methane was generated from the beginning and on the 72th day 70% methane was observed. Gas composition and the degradation rate is known to be affected by the types of waste [40]. According to Qin et al. (2019), paper wastes have produced above 50% of CH4 during 0~50 days of landfill. When paper wastes were mixed with food waste, the waste was degraded altogether, leading to increase in CH4 up to 60%~70% [41]. Domestic waste is the mixture of paper, plastic, food, and wood, with 50% paper content, leading to a high content of cellulose. Cellulose is degraded slowly compared to glucose and protein. Leading to slow degradation compared to other samples. However, the addition of food waste contributed to CH4 production above 60%~70%. Hydrogen sulphide was generated at 500 mg/L or less. The CODCr concentration in leachate was high at 600–29,227 mg/L and SO42− was 0–88 mg/L (Figure 8). SO42− was not produced in the leachate as the sulphur was not involved in the sample. Lack of SO42− led to unsuitable condition for the SRB microorganism survival. H2S was not generated, but CO2 and CH4 were generated in abundance. Accordingly, the generated gas did not have any significant effect on odor problem.
Finally, the mixture of C&D debris waste (55%), domestic waste (24%), and sewage (21%) was used for the experiment. Mixed waste containing C&D debris waste, domestic waste, and industrial waste was placed at the second landfill site. The landfill was created in such a manner that it was similar to the second landfill site. When examining generation of landfill gases, it was found that 65% methane was generated until the 13th day and then it decreased to 50% on the 47th day. H2S increased until the 136th day and generated up to 17% (Figure 9). SRB depend on other organic material for degradation product supply as SRB does not degrade natural biopolymers such as starch, glycogen, protein, and lipids. Resultingly, microbial competition at the hydrolysis stage of anaerobic digestion does not occur [42]. However, SRB is highly generated with the presence of SO42− compared to MPB, leading to SRB dominance and reduces the CH4 production. After the hydrolysis stage, CH4 was produced up to 47 days. After 47 days, H2S production was gradually increased, leading to a decrease in CH4 production. The mixed waste showed lower H2S gas production compared to C&D debris waste + sewage sludge sample. Domestic waste has lower moisture content compared to sewage sludge. Additionally, the domestic waste contains hardly biodegradable materials. As a result, similar amounts of H2S and CH4 were generated. In the mixed waste, a high H2S of 17% was generated which is lower than that of the C&D debris waste + sewage sludge but sufficient to cause an odor problem at the landfill site. Odour from the second landfill site is caused by the mixture of C&D debris waste, domestic waste, and industrial waste. As sewage sludge and solidified sludge have the greatest influence, they should be separately landfilled.
4. Conclusions
This study conducted an experiment to determine the generation of landfill gases using a lysimeter to examine the odor problem from the second landfill site at the Sudokwon landfill site. The study aimed to examine the odor problem by investigating generation of leachate and landfill gas by classifying landfilled C&D debris waste, domestic waste, and industrial waste into seven types. C&D debris waste, the main cause of the odor and classified into brick construction waste and earth and sand construction waste, was rated. When brick construction waste and earth and sand construction waste were separately landfilled, landfill gas was not generated. It seems that as brick construction waste and earth and sand construction waste contain less carbon and moisture, it was difficult for microorganisms to activate. However, when construction waste containing combustibles was landfilled, landfill gases of CH4 at 0%–6.3% and H2S at 0%–5.8% or less were generated. Landfill gas was generated from C&D debris waste that contained high combustibles of carbon of 47%. Such a result seems to have been caused by the mixture of carbon which is helpful in activating microorganisms. It is estimated that H2S will be generated, causing odor.
The landfill gas production characteristic of seven types of waste was significantly different. At the beginning, CH4 was generated, and it was decreased after 47 days with the increase of H2S due to SRB competition. This result is caused by SRB characteristic that it cannot degrade nature biopolymers, and use degradation products provided by other organism’s activity. Wastes mixed with sewage sludge showed rapid landfill gas production with high concentration compared to other mixed waste. This is due to biodegradation characteristics of the sewage sludge, and especially it affects the H2S production when mixed with C&D debris waste. The characteristics of leachate vary with the gas production. However, after 250 days, SO42− in the leachate was increased in the samples mixed with C&D debris waste. This result is caused by the runoff of the non-degraded products to the leachate.
This study found that odor generated from the second landfill site is caused by C&D debris waste, domestic waste, and industrial waste being landfilled in a mixed manner. In the sewage sludge and solidified sludge with a higher percentage of carbon and moisture affecting the survival of microorganisms, highly concentrated H2S was generated. A single landfill is advisable when landfilling C&D debris waste. It is estimated that separation of combustibles will aid in preventing generation of landfill gases. The findings of this study can be used as basic data helpful in examining odor at landfill sites and proposing management policies.
Author Contributions
Conceptualization, W.C., S.J. and S.C.; data curation, W.C. and S.J.; formal analysis, W.C. and S.J.; investigation, W.C. and S.J.; methodology, W.C., S.J. and S.C.; writing—original draft, W.C.; writing—review and editing, W.C., S.J. and S.C.
Funding
This research was supported by the Korea Institute of Energy Technology Evaluation and Planning (KETEP) and the Ministry of Trade, Industry & Energy (MOTIE) of the Republic of Korea (No. 20183020141270 and No. 20194110300040).
Acknowledgments
The authors gratefully acknowledge the Korea Institute of Energy Technology Evaluation and Planning (KETEP) and the Ministry of Trade, Industry & Energy (MOTIE) of the Republic of Korea.
Conflicts of Interest
The authors declare no conflict of interest.
References
- Department for Environment Food and Rural Affairs (DEFRA). Waste Prevention Programme for England: Overview of Evidence—A Rationale for Waste Prevention in England; Defra: London, UK, 2013.
- Yu, R.; Shui, Z. Influence of agglomeration of a recycled cement additive on the hydration and microstructure development of cement based materials. Constr. Build. Mater. 2013, 49, 841–851. [Google Scholar] [CrossRef]
- Lu, W.; Tam, V.W.Y. Construction waste management policies and their effectiveness in Hong Kong: A longitudinal review. Renew. Sustain. Energy Rev. 2013, 23, 214–223. [Google Scholar] [CrossRef]
- Oyedele, L.O.; Ajayi, S.O.; Kadiri, K.O. Use of recycled products in UK construction industry: An empirical investigation into critical impediments and strategies for improvement. Res. Conserv. Recycl. 2014, 93, 23–31. [Google Scholar] [CrossRef]
- Solis Guzman, J.; Marrero, M.; Montes Delgado, M.V.; Ramirez de Arellano, A. A Spanish model for quantification and management of construction waste. Waste Manag. 2009, 29, 2542–2548. [Google Scholar] [CrossRef] [PubMed]
- Kim, J.H.; Sung, J.H.; Jeon, C.S.; Lee, S.H.; Kim, H.S. A study on the properties of Recycled aggregate concrete and its production facilities. Appl. Sci. 2019, 9, 1935. [Google Scholar] [CrossRef]
- Sudokwon Landfill Management Corporation. Sudokwon Landfill Statistical Yearbook; Sudokwon Landfill Management Corporation: Seo-gu, Korea, 2019; p. 17. [Google Scholar]
- Plaza, C.; Xu, Q.; Townsend, T.; Bitton, G.; Booth, M. Evaluation of alternative landfill cover soils for attenuating hydrogen sulfide from construction and demolition (C&D) debris landfills. J. Environ. Manag. 2007, 84, 314–322. [Google Scholar]
- Rabus, R.; Hansen, T.A.; Widdel, F. Dissimilatory Sulfate-and Sulfur-Reducing Prokaryotes. Prokaryotes Prokaryot. Physiol. Biochem. 2013, 309–404. [Google Scholar]
- Townsend, T.G.; Jang, Y.; Thurn, L.G. Simulation of construction and demolition waste leachate. J. Environ. Eng. 1999, 125, 1071–1081. [Google Scholar] [CrossRef]
- Einsiedl, F.; Maloszewski, P.; Stichler, W. Multiple isotope approach to the determination of the natural attenuation potential of a high-alpine karst system. J. Hydrol. 2009, 365, 113–121. [Google Scholar] [CrossRef]
- Shin, H.S.; Oh, S.E.; Bae, B.U. Competition between SRB and MPB according to temperature change in the anaerobic treatment of tannery wastes containing high sulfate. Environ. Technol. 1996, 17, 361–370. [Google Scholar] [CrossRef]
- Munusamy, P.; Ravichandran, M.; Natarajan, S.D.; Varadhaaraju, C. Biolofical aspects of anaerobic digestion and its kinetics: An overview. J. Microbiol. Biotechnol. Food Sci. 2017, 6, 1090–1097. [Google Scholar] [CrossRef]
- Fang, H.H. Microbial distribution in UASB granules and its resulting effects. Water Sci. Technol. 2000, 42, 201–208. [Google Scholar] [CrossRef]
- Xu, Q.; Qin, J.; Jo, J.H. Municipal solid waste landfill performance with different biogas collection practices: Biogas and leachate generations. J. Clean. Prod. 2019, 222, 446–454. [Google Scholar] [CrossRef]
- Fadel, M.E.; Zeid, E.B.; Chahine, W.; Alayli, B. Temporal variation of leachate quality from pre-sorted and baled municipal solid waste with high organic and moisture content. Waste Manag. 2002, 22, 269–282. [Google Scholar] [CrossRef]
- Ko, J.H.; Yang, F.; Xu, Q. The impact of compaction and leachate recirculation on waste degradation in simulated landfills. Bioresour. Technol. 2016, 211, 72–79. [Google Scholar] [CrossRef]
- Lu, X.; Ni, J.; Zhen, G.; Kubota, K.; Li, Y.Y. Response of morphology and microbial community structure of granules to influent COD/SO42– ratios in an upflow anaerobic sludge blanket (UASB) reactor treating starch wastewater. Bioresour. Technol. 2018, 256, 456–465. [Google Scholar] [CrossRef]
- Sun, M.; Sun, W.; Barlaz, M.A. A batch assay to measure microbial hydrogen sulfide production from sulfur-containing solid wastes. Sci. Total Environ. 2016, 551, 23–31. [Google Scholar] [CrossRef]
- Simonton, S.; Spears, M. Human health effects from exposure to low-level concentrations of hydrogen sulfide. J. Occup. Health Saf. 2007, 76, 102–104. [Google Scholar]
- Sudokwon Landfill Management Corporation. Effect of Landfill Evaporation on Landfill Gas Generation; Sudokwon Landfill Management Corporation: Seo-gu, Korea, 2013. [Google Scholar]
- Xu, Q.; Tian, Y.; Wang, S.; Ko, J.H. A comparative study of leachate quality and biogas generation in simulated anaerobic and hybrid bioreactors. Waste Manag. 2015, 41, 94–100. [Google Scholar] [CrossRef]
- Franke-Whittle, I.H.; Walter, A.; Ebner, C.; Insam, H. Investigation into the effect of high concentrations of volatile fatty acids in anaerobic digestion on methanogenic communities. Waste Manag. 2014, 34, 2080–2089. [Google Scholar] [CrossRef]
- Alabi, A.O.; Bakare, A.A. Genetic damage induced by electronic waste leachates and contaminated underground water in two prokaryotic systems. Toxicol. Mech. Methods 2017, 27, 657–665. [Google Scholar] [CrossRef] [PubMed]
- Tetteh, E.K.; Ansah Amano, K.O.; Asante-Sackey, D.; Armah, E.K. Biochemical Methane Potential (BMP) of Miscanthus Fuscus for Anaerobic Digestion. Int. J. Sci. Res. Publ. 2017, 7, 434–439. [Google Scholar]
- Im, S.; Petersen, S.O.; Lee, D.; Kim, D.H. Effects of storage temperature on CH4 emissions from cattle manure and subsequent biogas production potential. Waste Manag. 2019, 101, 35–43. [Google Scholar] [CrossRef] [PubMed]
- Sudokwon Landfill Management Corporation. Sudokwon Landfill Statistical Yearbook; Sudokwon Landfill Management Corporation: Seo-gu, Korea, 2012; p. 10. [Google Scholar]
- Zaman, N.Q.; Sukor, N.S.A.; Rahman, S.A.A.; Yaacof, N. The influence of moisture content on the production of odor from food waste using path analysis. Environ. Sci. Pollut. Res. 2019, 26, 13658–13663. [Google Scholar] [CrossRef] [PubMed]
- Townsend, T.G.; Jang, Y.; Lee, S. Characterization of Recovered Screened Material from C&D Recycling Facilities in Florida; Center for Solid and Hazardous waste Management Report No. 1998 98-13; University of Florida: Gainesville, FL, USA, 1998. [Google Scholar]
- Yong, C.J.; Townsend, T. Sulfate leaching from recovered construction and demolition debris fines. Adv. Environ. Res. 2001, 5, 203–217. [Google Scholar]
- Lopez, A.; Lobo, A. Emissions of C&D refuse in landfills: A European case. Waste Manag. 2014, 34, 1446–1454. [Google Scholar]
- Asakura, H. Sulfate and organic matter concentration in relation to hydrogen sulfide generation at inert solid waste landfill site—Limit value for gypsum. Waste Manag. 2015, 43, 328–334. [Google Scholar] [CrossRef] [PubMed]
- Lay, J.J.; Li, Y.Y.; Noike, T. Influences of pH and moisture content on the methane production in high-solids sludge digestion. Water Res. 1997, 31, 1518–1524. [Google Scholar] [CrossRef]
- Yang, K.; Xu, Q.; Townsend, T.G.; Chadik, P.; Bitton, G.; Booth, M. Hydrogen Sulfide Generation in Simulated Construction and Demolition Debris Landfills: Impact of Waste Composition. J. Air Waste Manag. Assoc. 2006, 56, 1130–1138. [Google Scholar] [CrossRef]
- Aerts, S.; Canniere, P.D.; Moors, H. Presence of Sulphate Reducing Bacteria Near a Boom Clay-Steel Interface; External Report; The Belgian Nuclear Research Centre: Boeretang, Belgium, 2009; pp. 251–262. [Google Scholar]
- Chen, Y.; Wen, Y.; Zhou, J.; Tang, Z.; Li, L.; Zhou, Q.; Vymazal, J. Effects of cattail biomass on sulfate removal and carbon sources competition in subsurface-flow constructed wetlands treating secondary effluent. Water Res. 2014, 59, 1–10. [Google Scholar] [CrossRef]
- Fairweather, R.; Barlaz, M. Hydrogen Sulfide Production During Decomposition of Landfill Inputs. J. Environ. Eng. 1998, 124, 353–361. [Google Scholar] [CrossRef]
- Swati, M.; Kurgan, J.; Nagendran, R. Bioreactor landfill lysimeter studies on indian urban refuse. In Proceedings of the Tenth International Waste Management and Landfill Symposium, Cagliari, Italy, 3–7 October 2005; pp. 229–237. [Google Scholar]
- Yang, K.J. Hydrogen Sulfide Generation in Simulated Landfill Columns. Master’s Thesis, University of Florida, Gainesville, FL, USA, 2000. [Google Scholar]
- Lay, J.J.; Li, Y.Y.; Noike, T. The influence of pH and ammonia concentration on the methane production in high-solids digestion processes. Water Environ. Res. 1998, 70, 1075–1082. [Google Scholar] [CrossRef]
- Qin, Y.; Li, L.; Wu, J.; Xiao, B.; Hojo, T.; Kubota, K.; Cheng, J.; Li, Y.Y. Co-production of biohydrogen and biomethane from food waste and paper waste via recirculated two-phase anaerobic digestion process: Bioenergy yields and metabolic distribution. Bioresour. Technol. 2019, 276, 325–334. [Google Scholar] [CrossRef] [PubMed]
- Yuan, H.; Zhu, N. Progress in inhibition mechanisms and process control of intermediates and by-products in sewage sludge anaerobic digestion. Renew. Sustain. Energy Rev. 2016, 58, 429–438. [Google Scholar] [CrossRef]


© 2019 by the authors. Licensee MDPI, Basel, Switzerland. This article is an open access article distributed under the terms and conditions of the Creative Commons Attribution (CC BY) license (http://creativecommons.org/licenses/by/4.0/).