Novel Nature-Inspired Hybrids of Neural Computing for Estimating Soil Shear Strength

 ,
,  ,
, 
Abstract
:1. Introduction
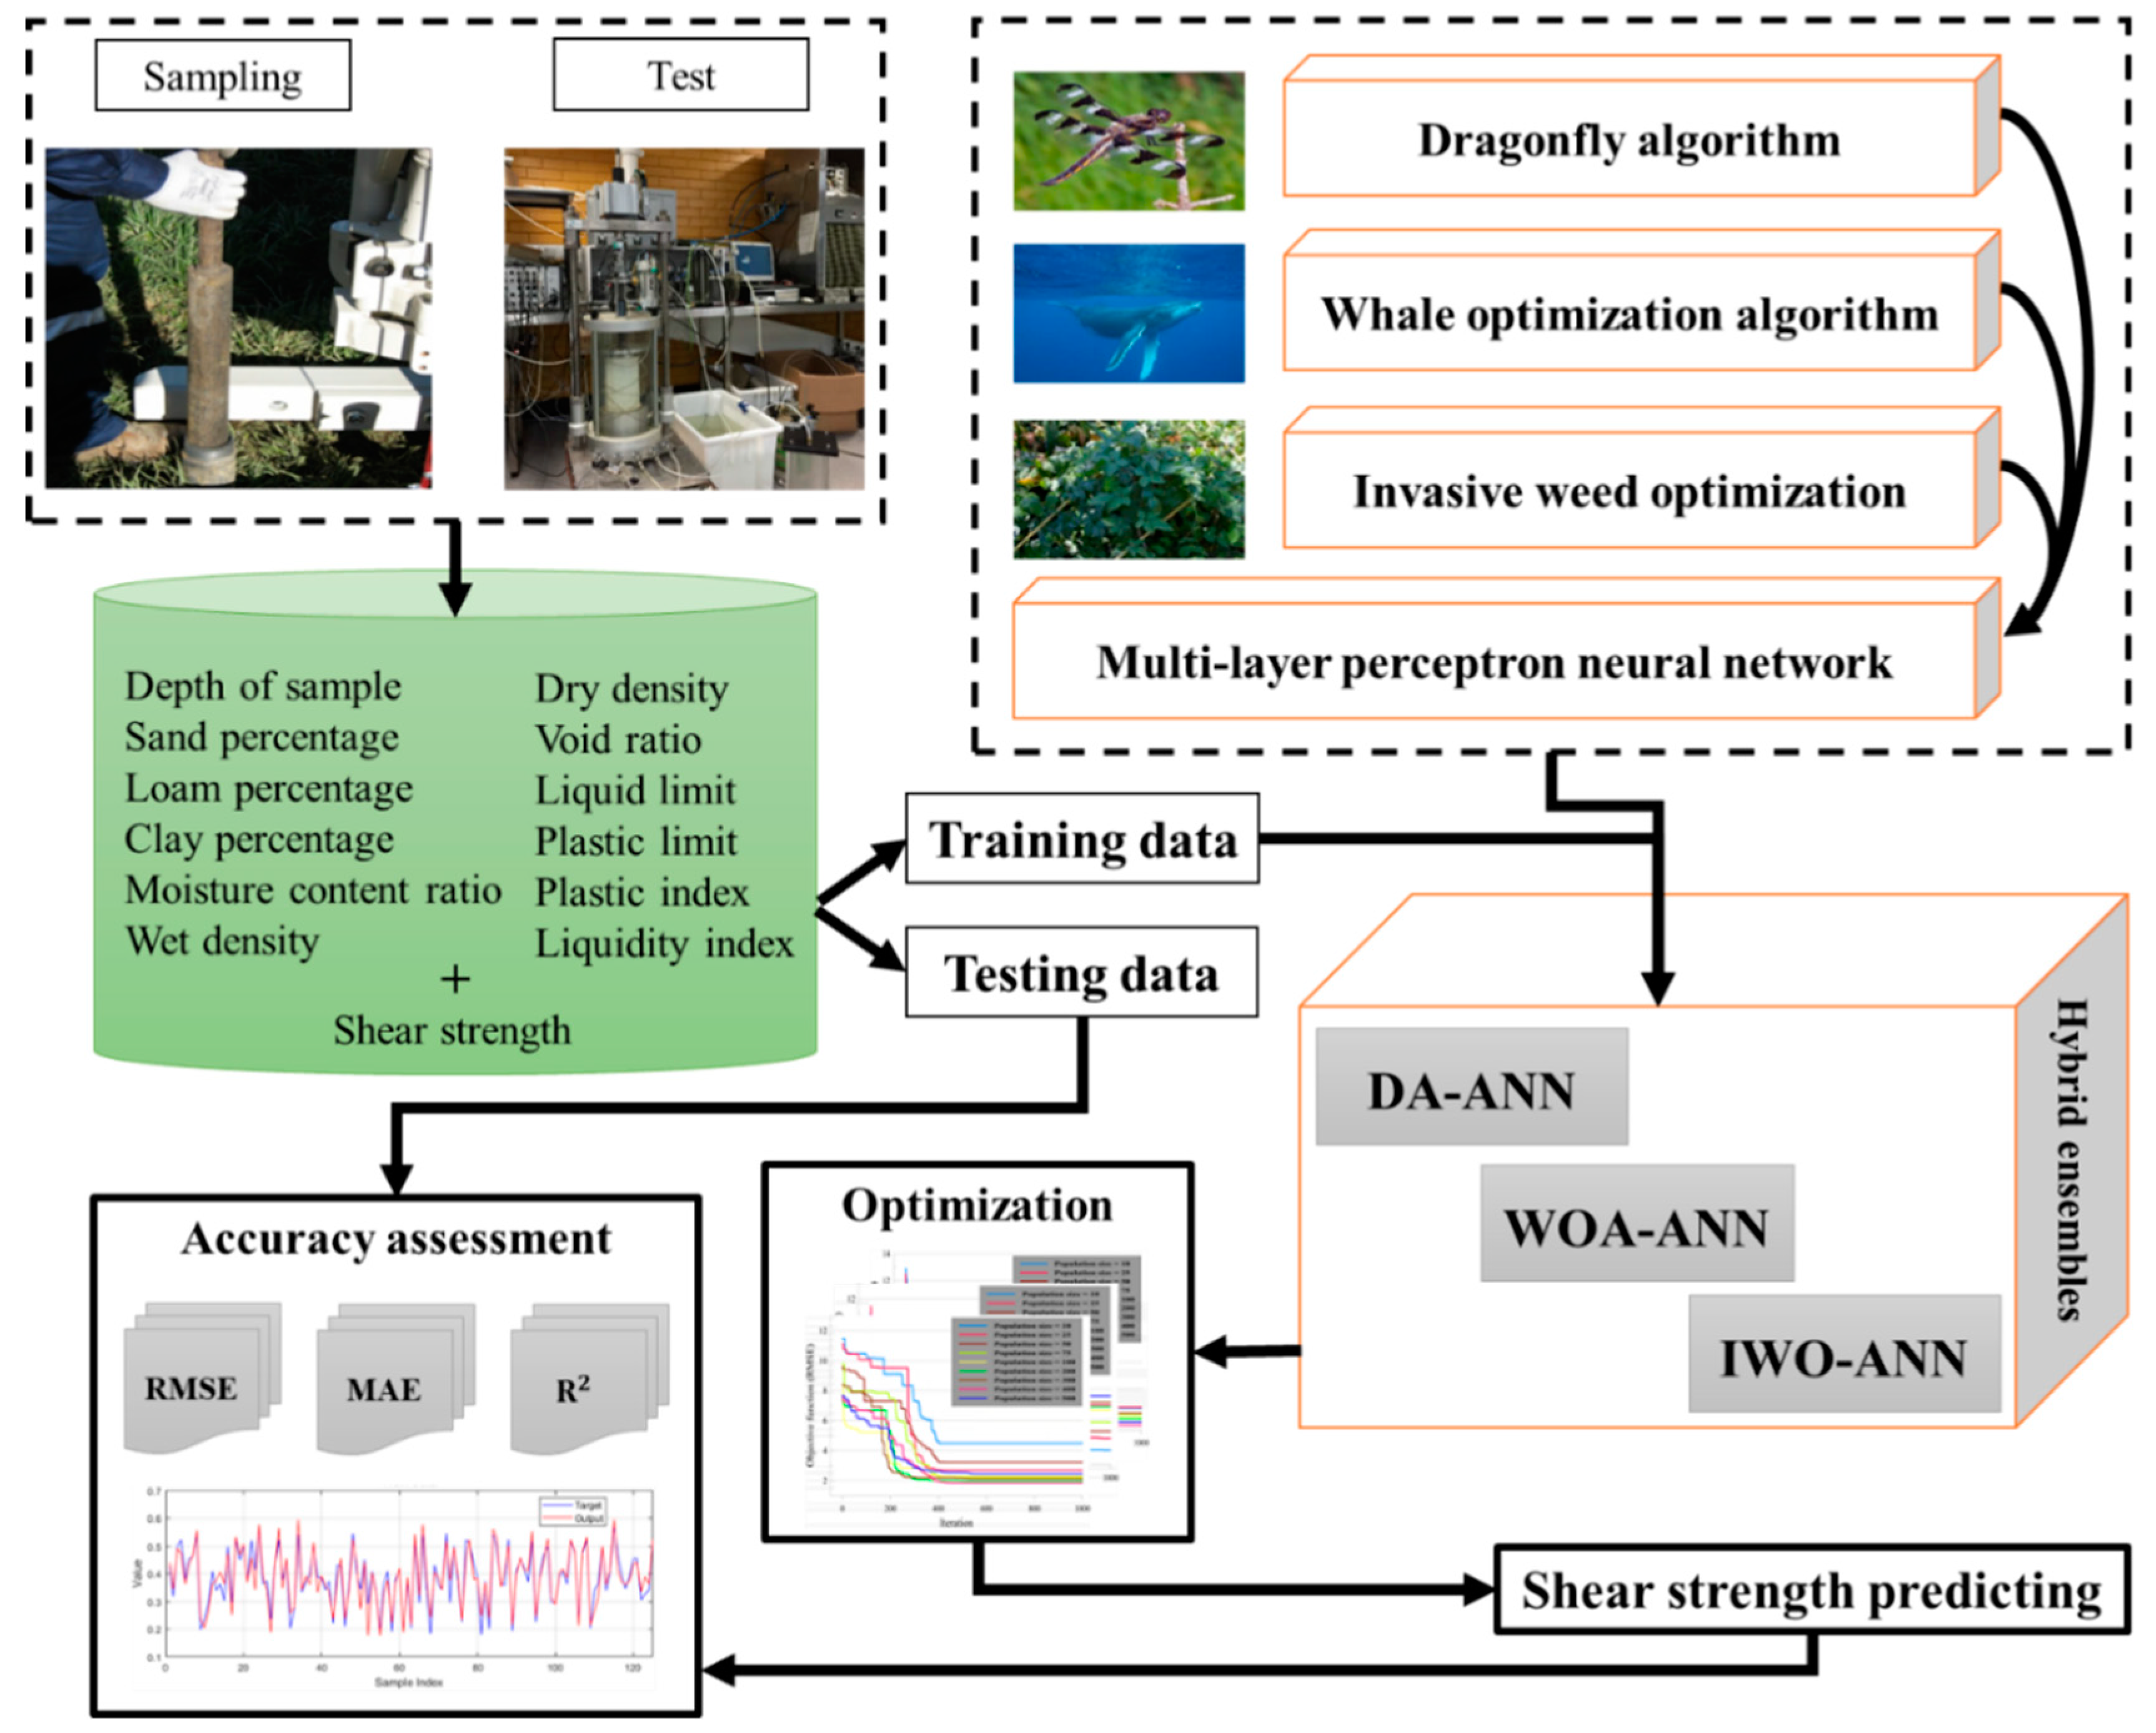
2. Methodology
- (a)
- As is known, providing a proper dataset is an essential task in the utilization of computational intelligence tools. Hence, data provision and preprocessing is the first stage. This process is broadly explained in the following section.
- (b)
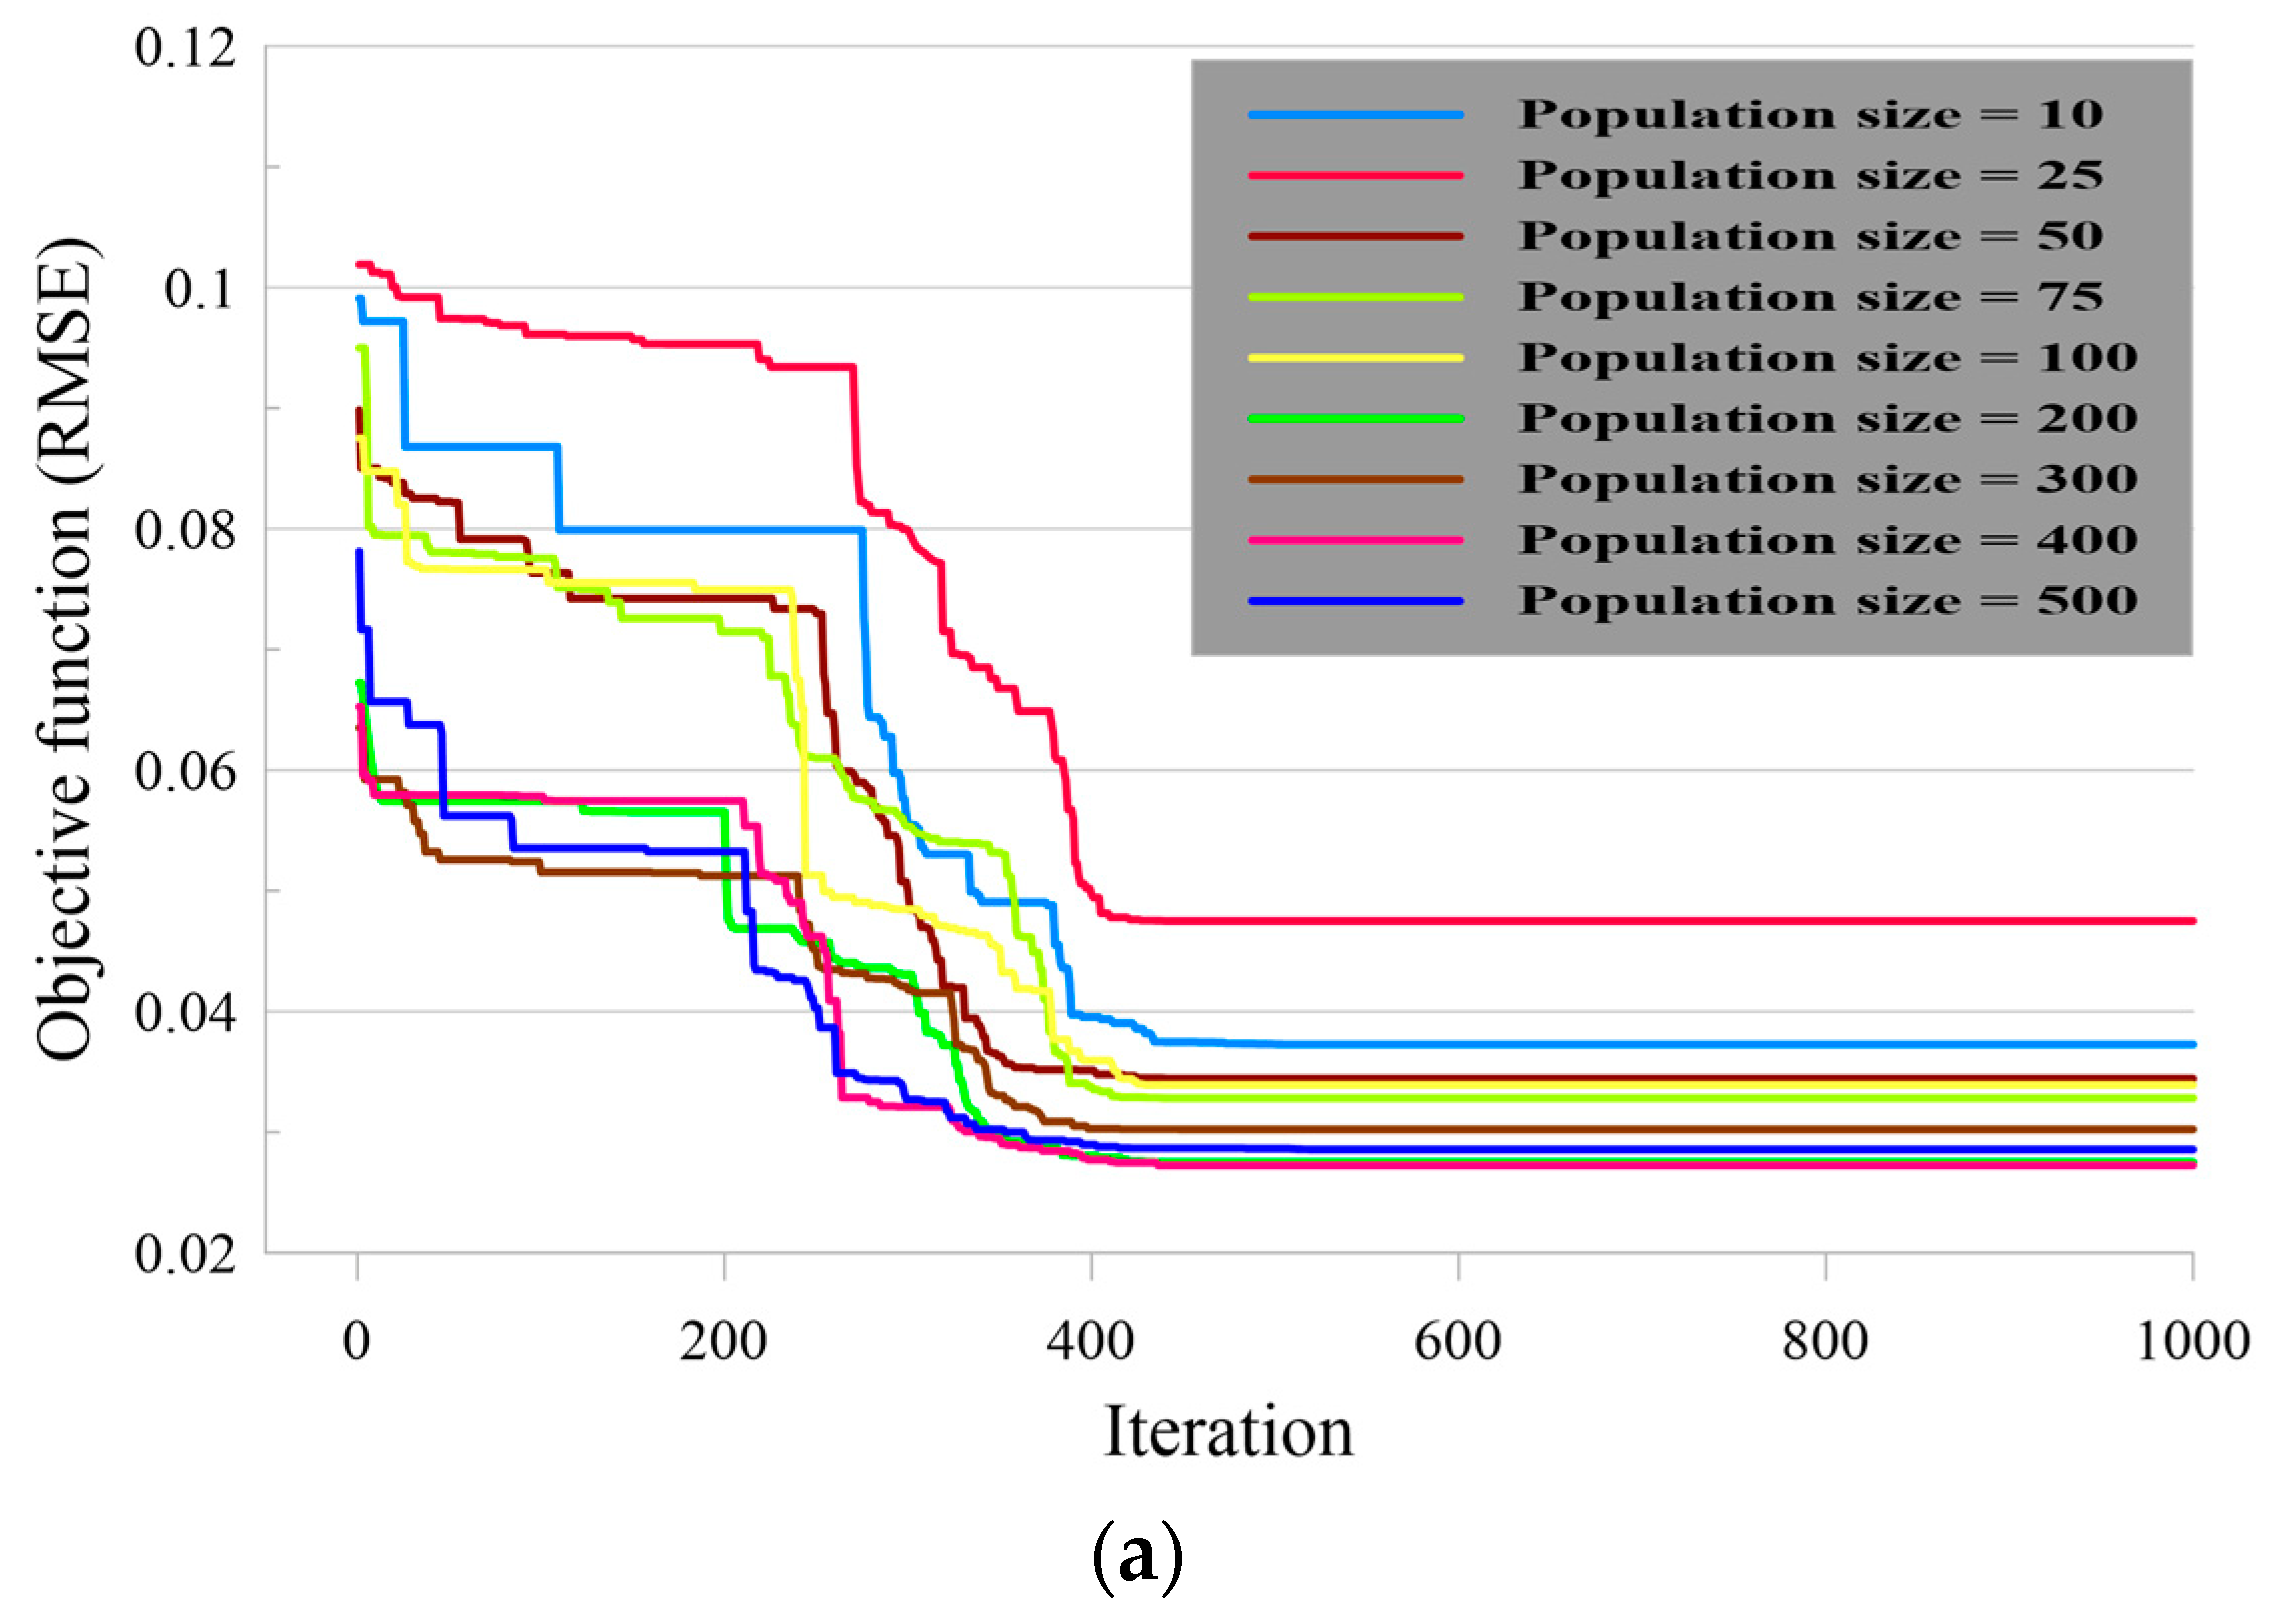
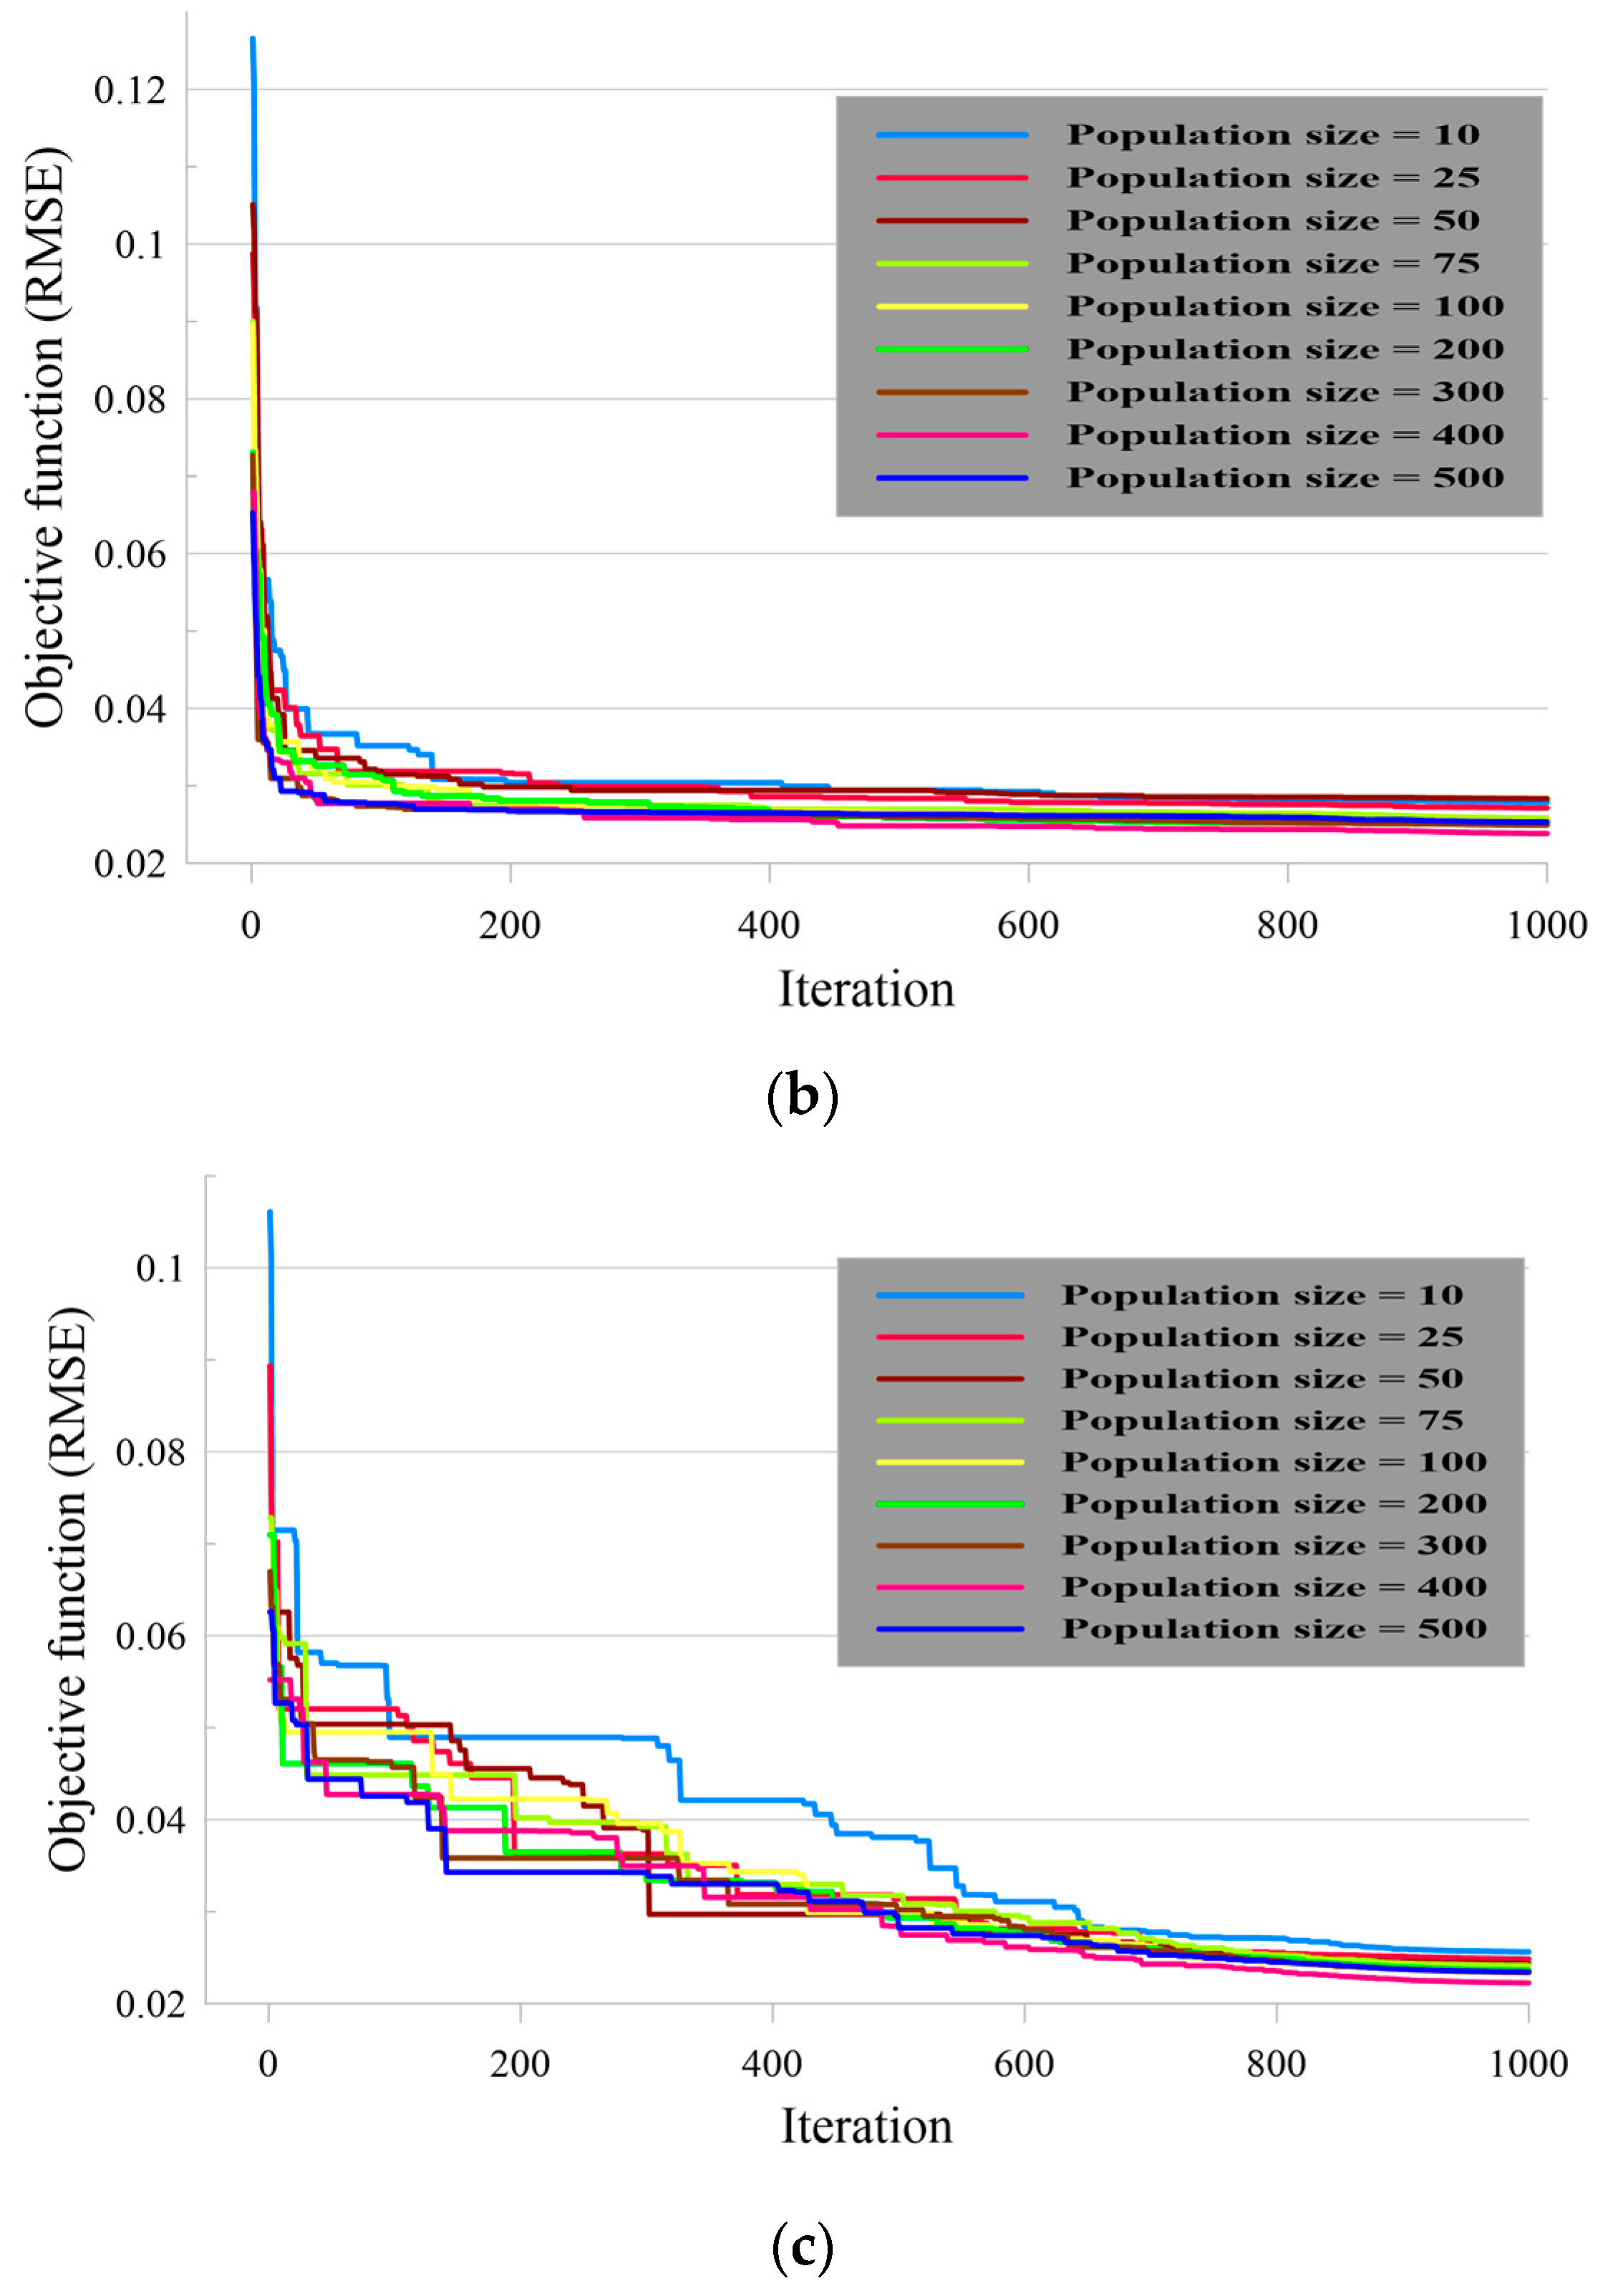
- After determining the appropriate structure of the basic model (i.e., the multi-layer perceptron (MLP) neural network), the optimization algorithms of DA, WOA, and IWO are synthesized with it to design the DA-ANN, WOA-ANN, and IWO-ANN hybrid ensembles. Next, an extensive sensitivity analysis is applied to the ensembles in order to find the best-fitted structure of them.
- (c)
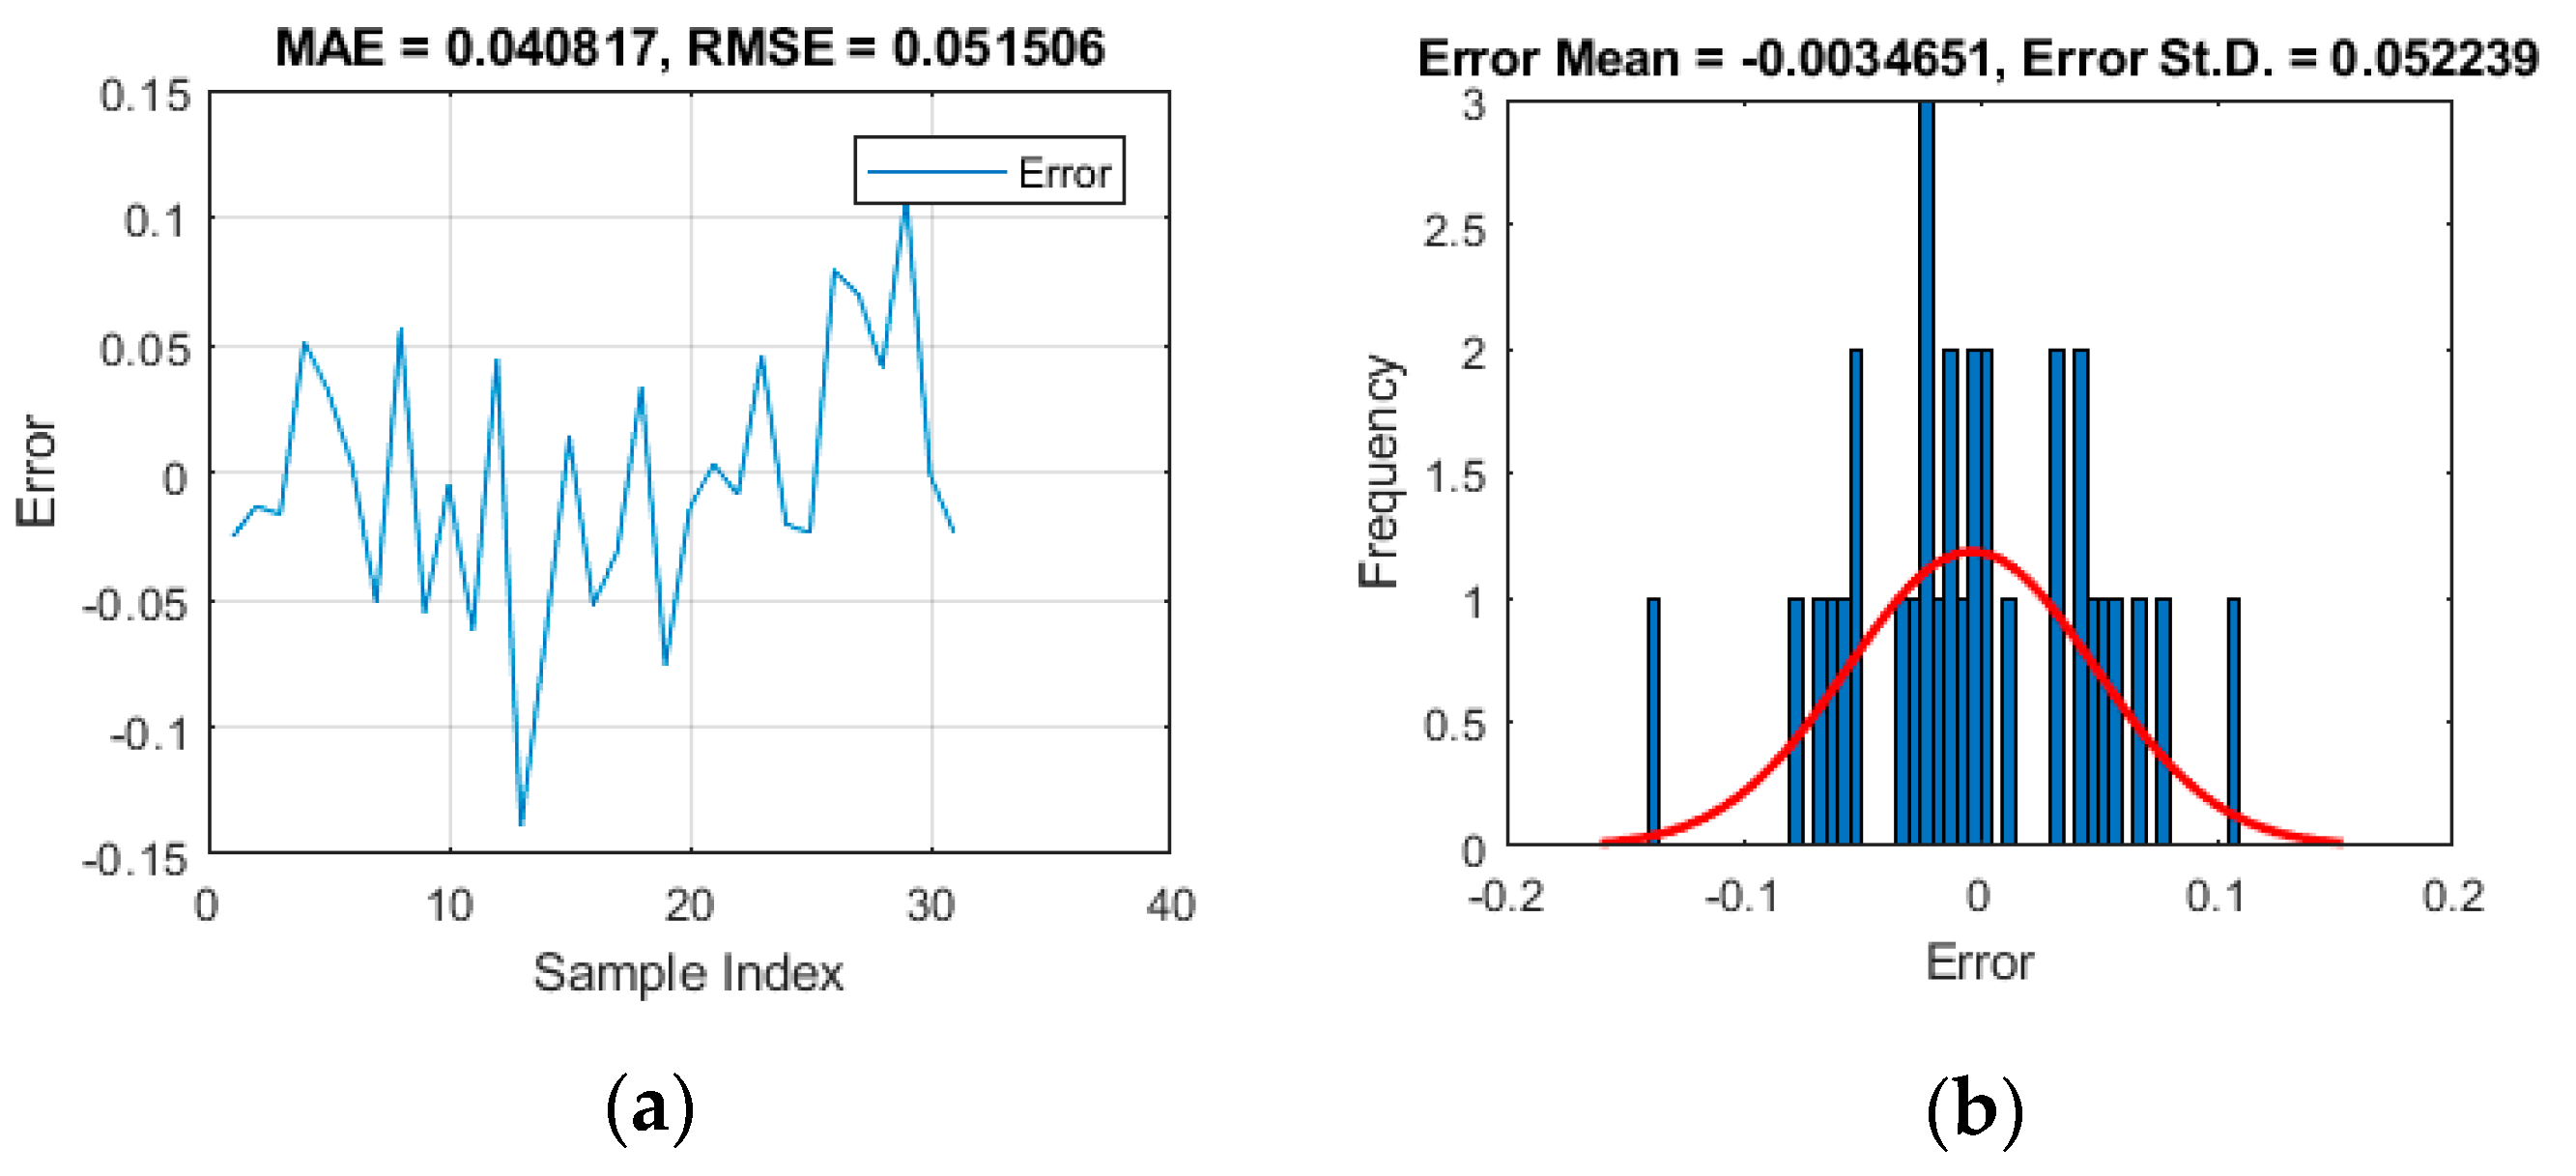
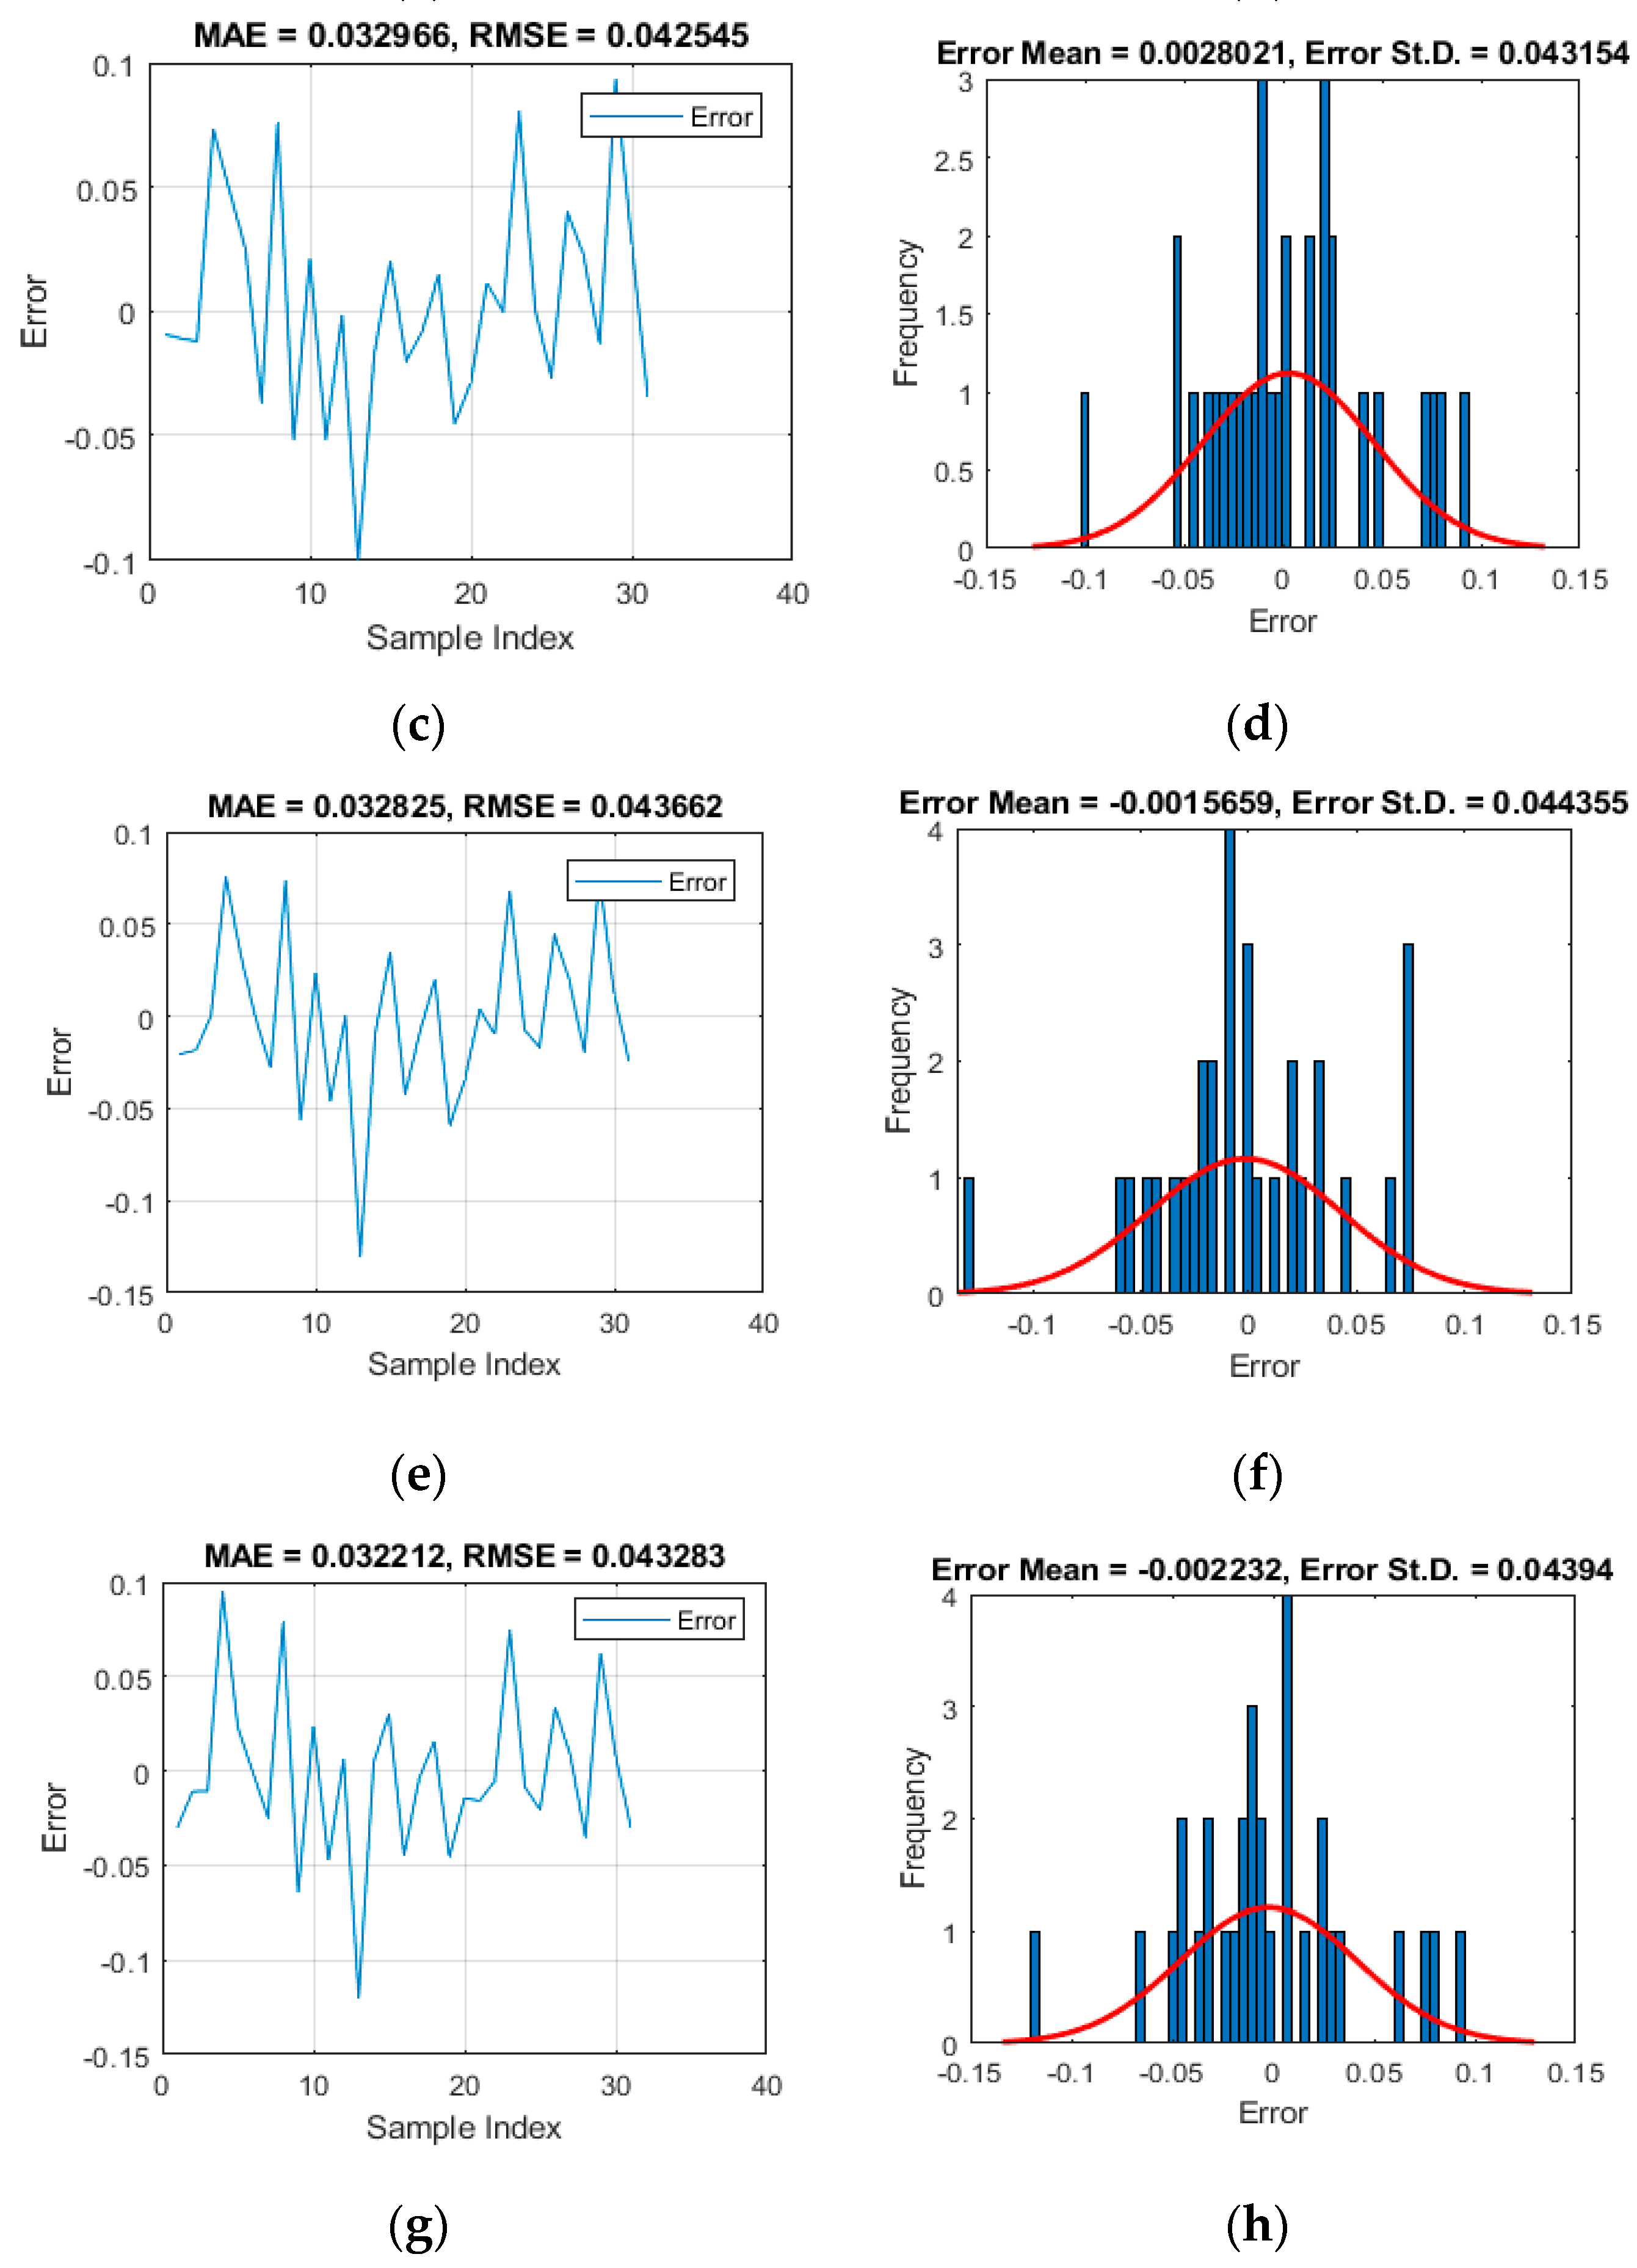
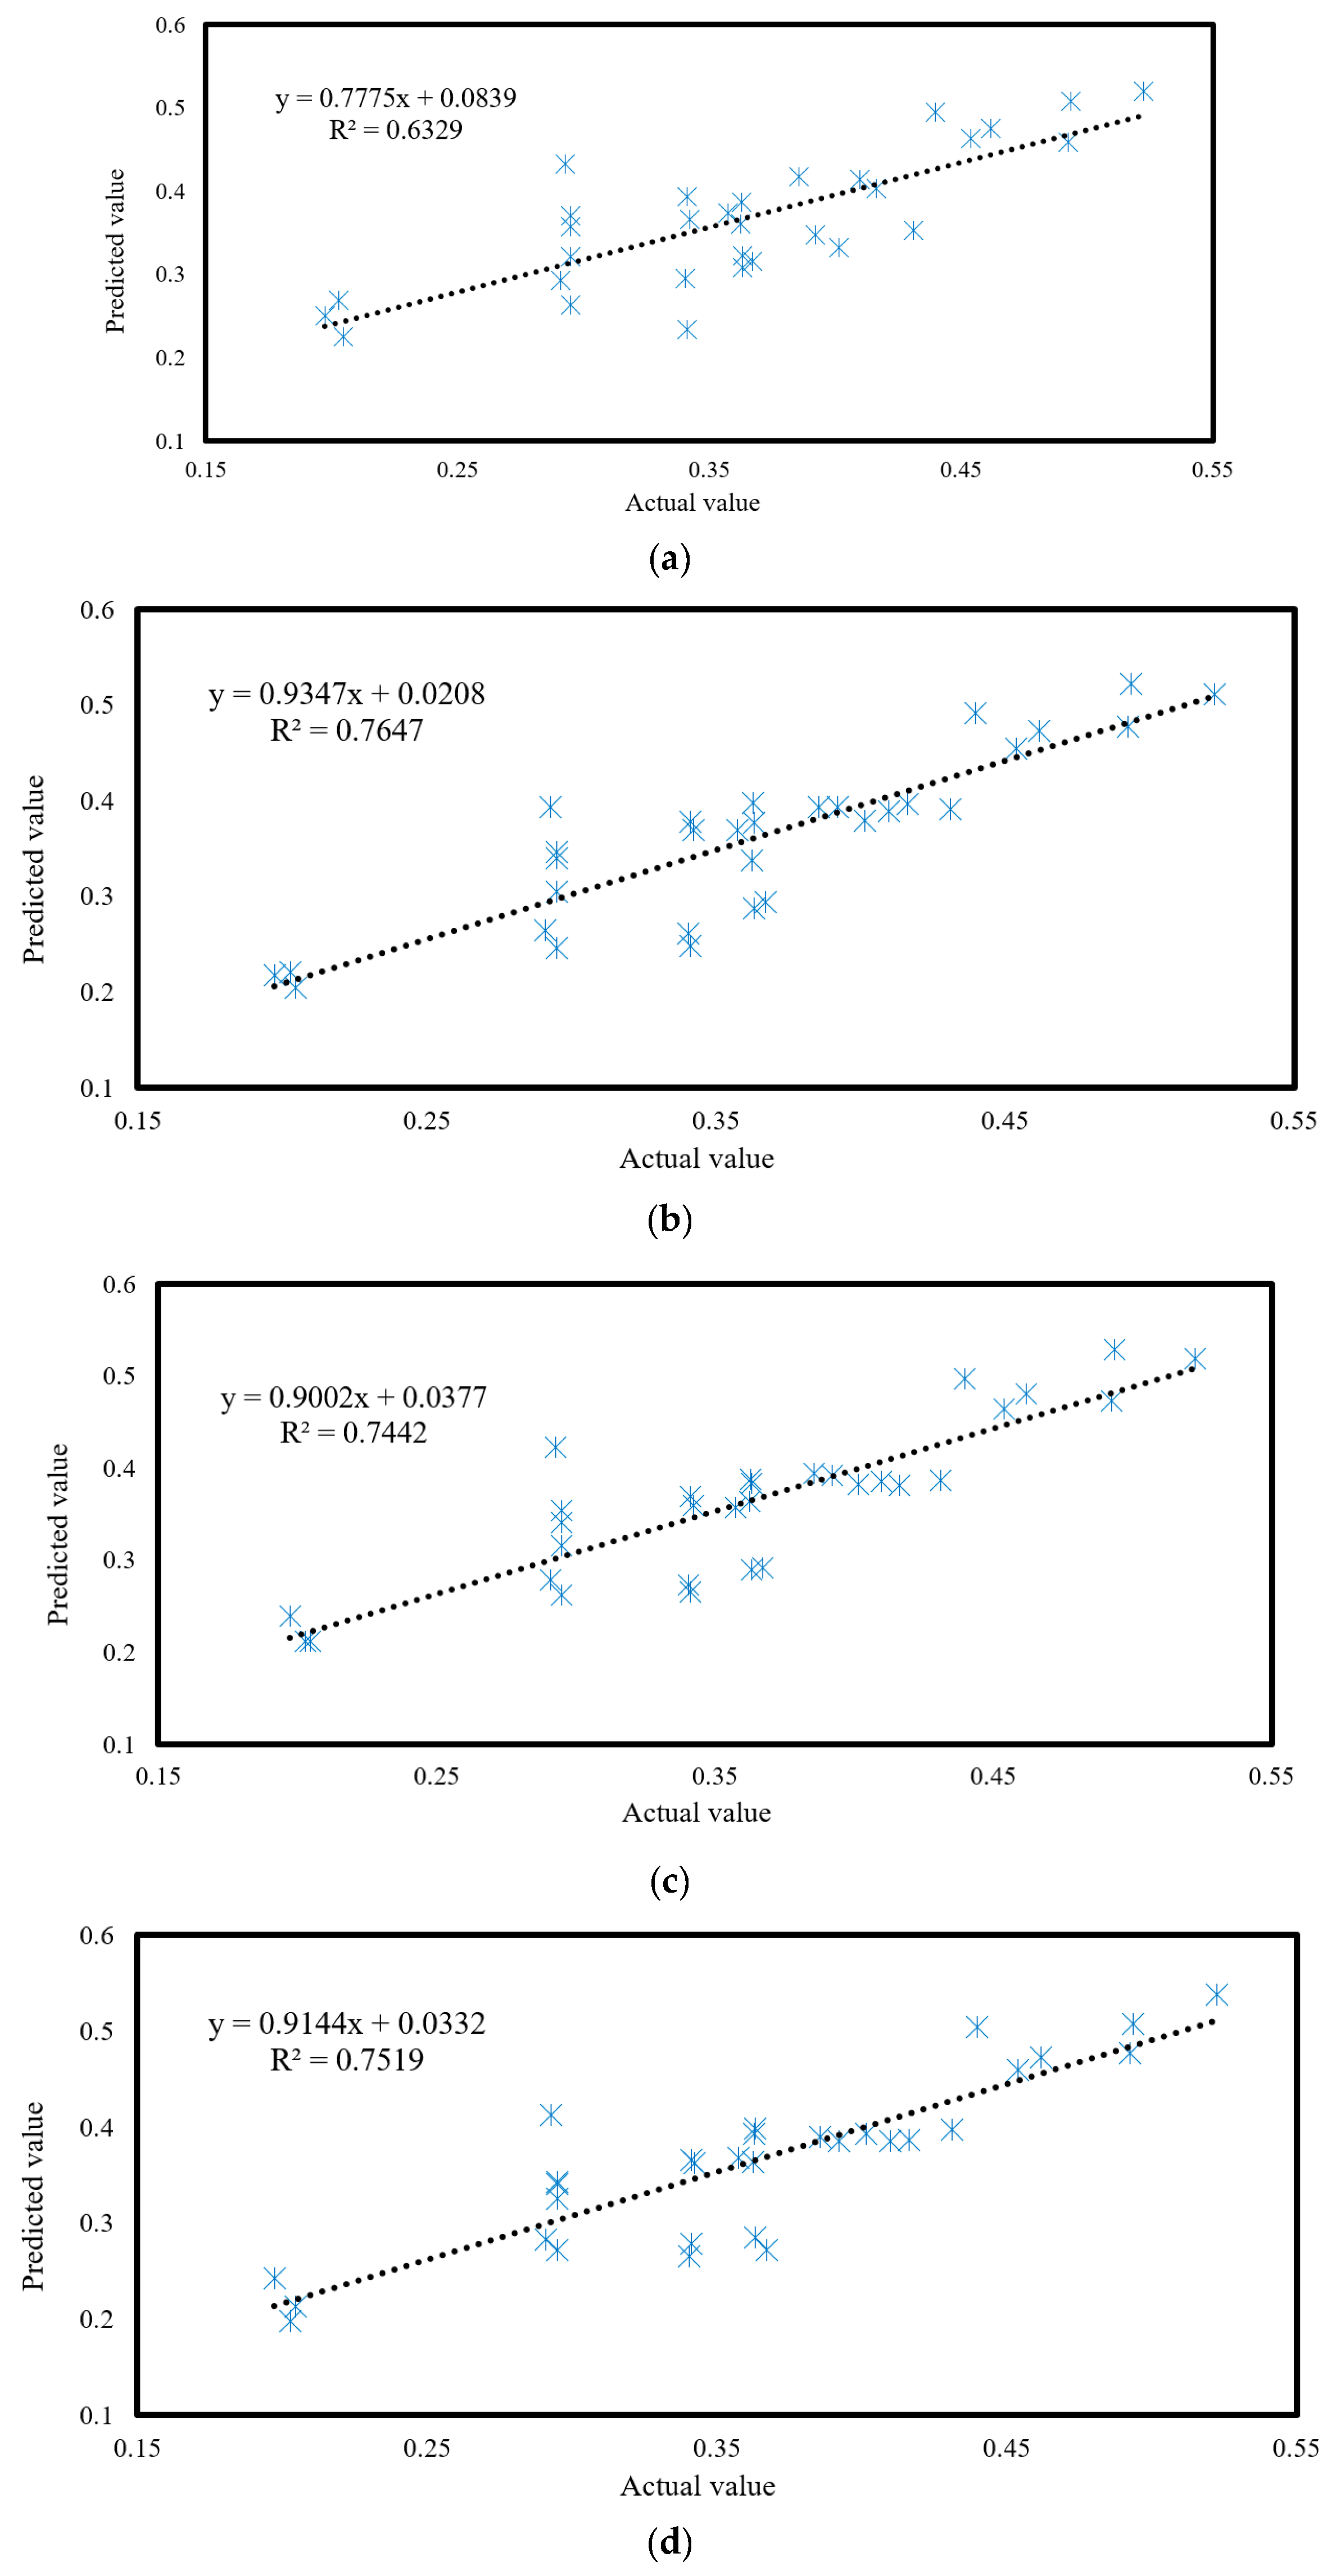
- Lastly, the results are evaluated using three well-known accuracy criteria, namely root mean square error (RMSE), coefficient of determination (R2), and mean absolute error (MAE). The formulation of these indices is expressed by the following equations:where Yi predicted, Yi observed, and observed symbolize the predicted, observed SSSs, and the average of the observed SSSs, respectively. Also, N denotes the number of data.
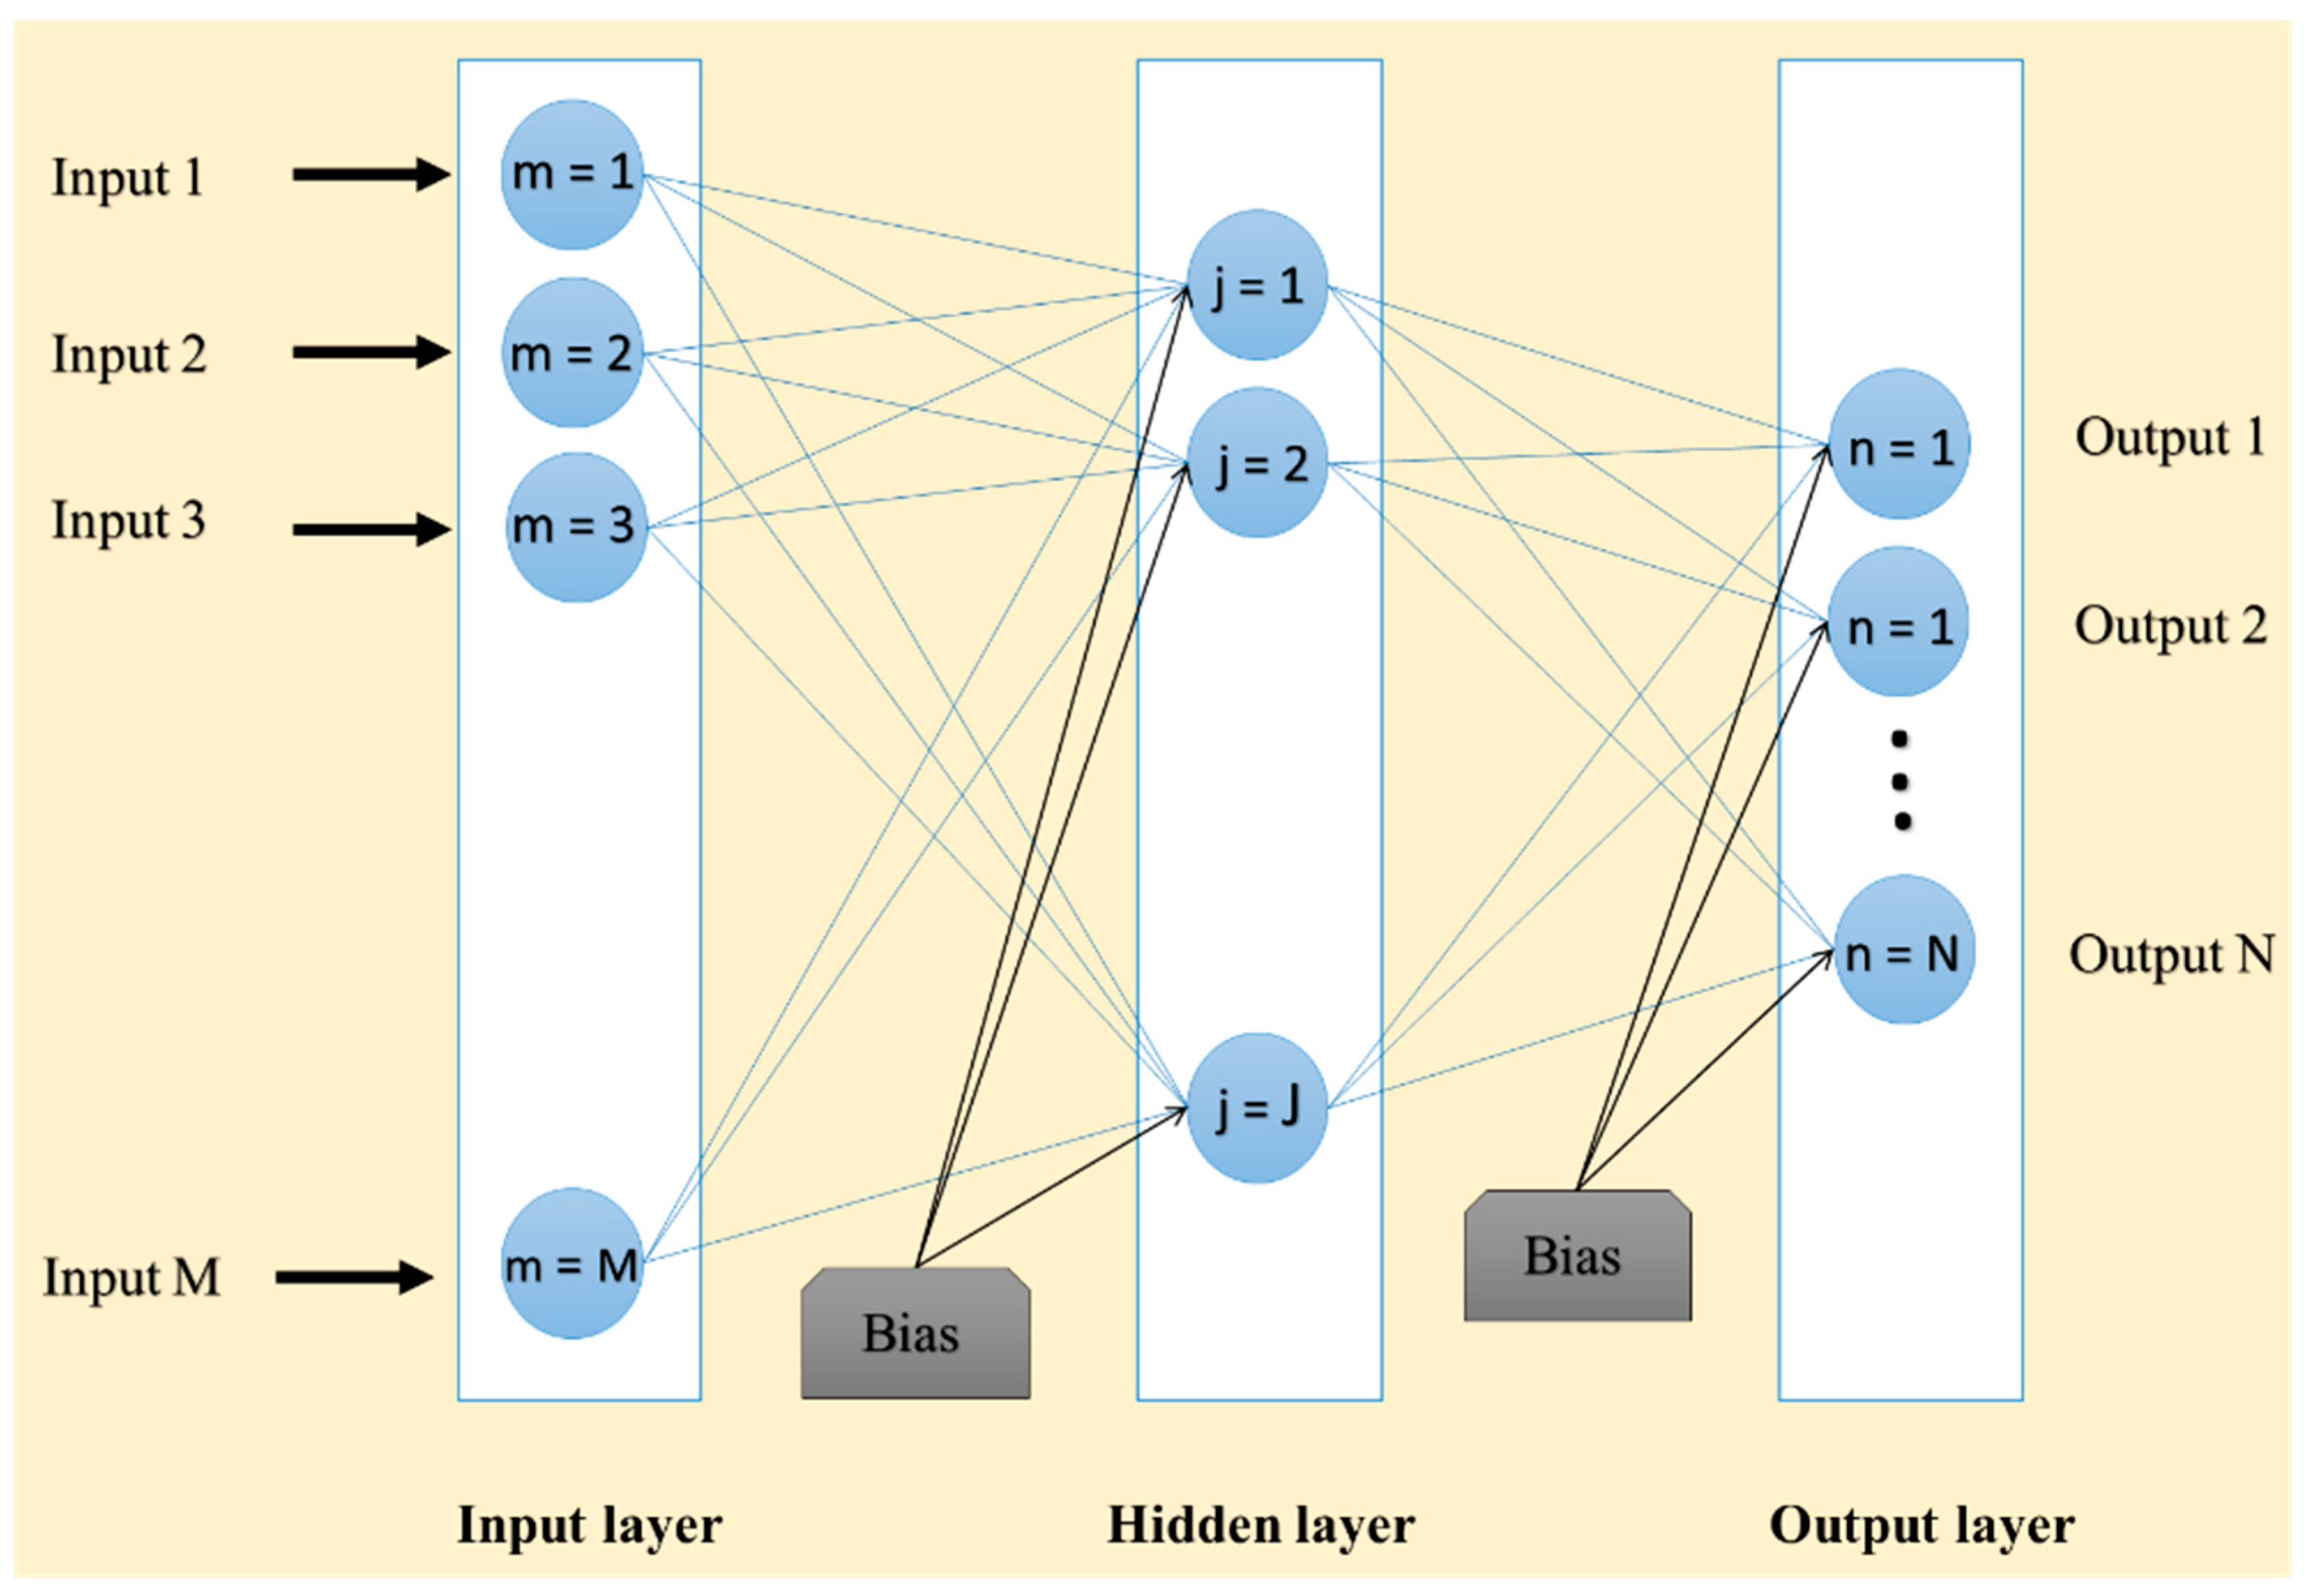
2.1. Multi-Layer Perceptron Neural Network
2.2. Metaheuristic Optimization Algorithms
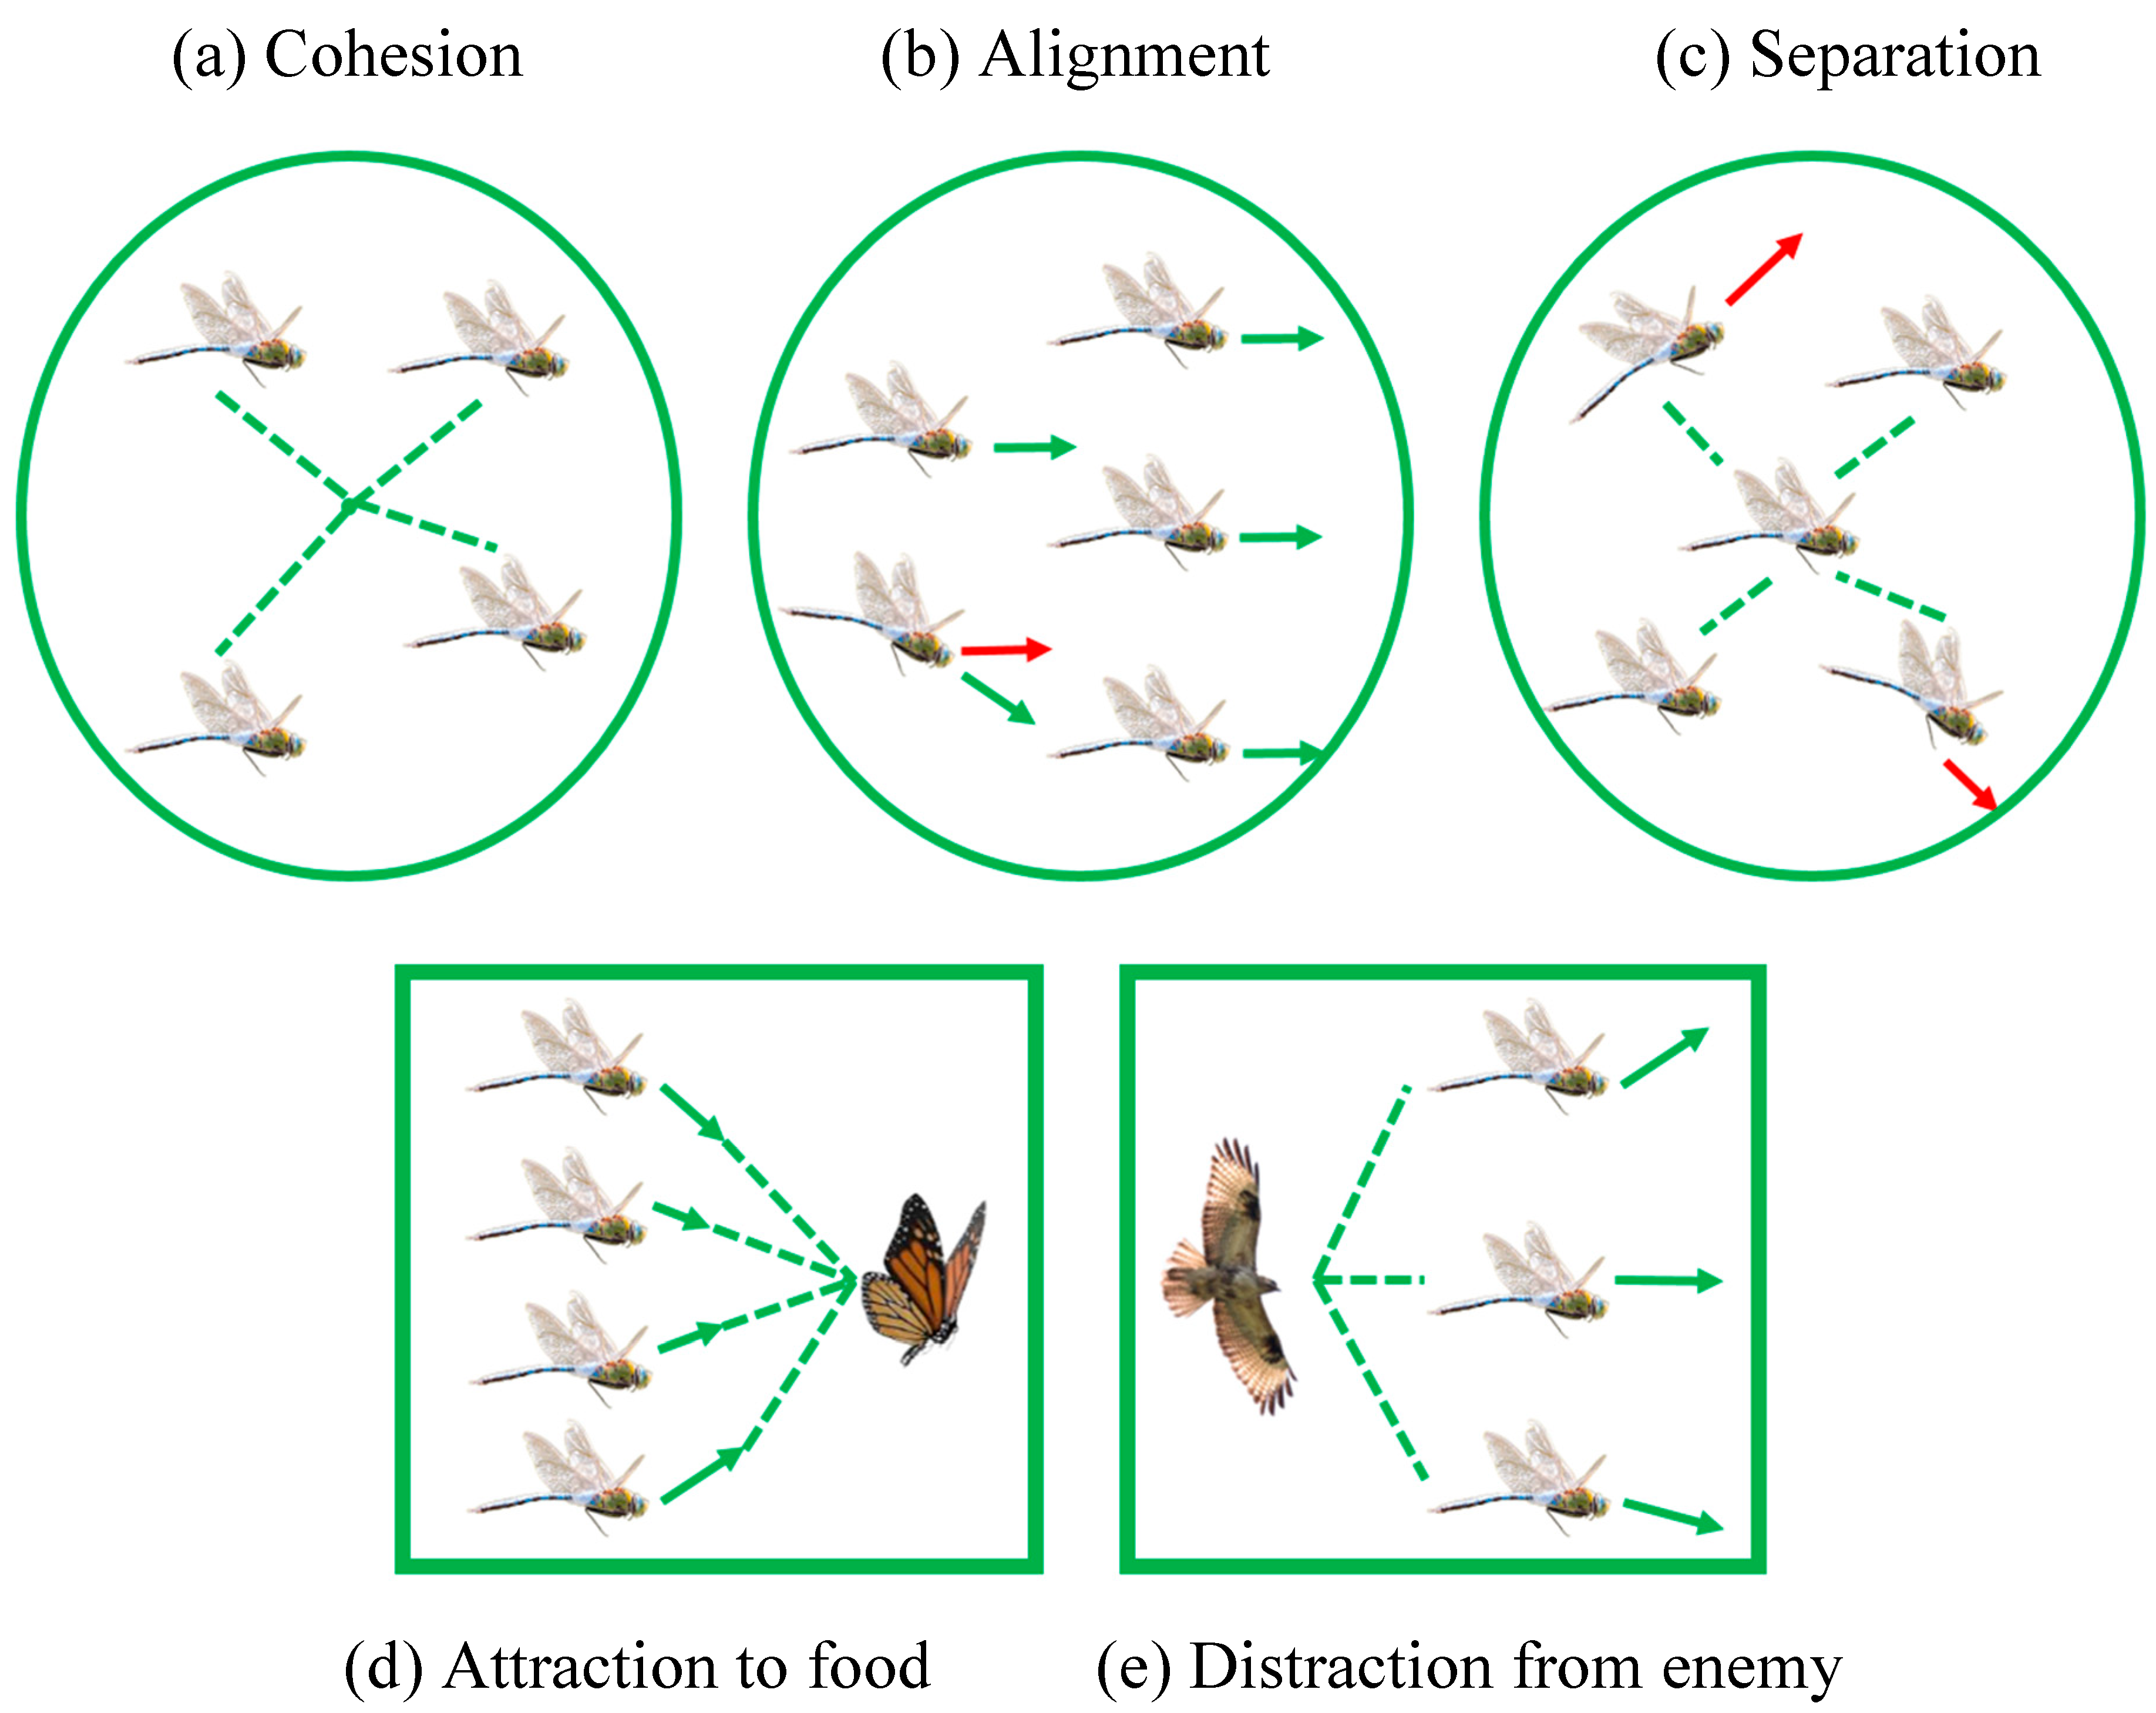
2.2.1. Dragonfly Algorithm
- (a)
- In the separation, the dragonflies avoid other individuals because of the collision in a stationary position from the vicinity.
- (b)
- During the alignment, the velocity of the members coordinates with each other in the vicinity.
- (c)
- In the cohesion, the members fly toward the group midpoint in the vicinity.
2.2.2. Whale Optimization Algorithm
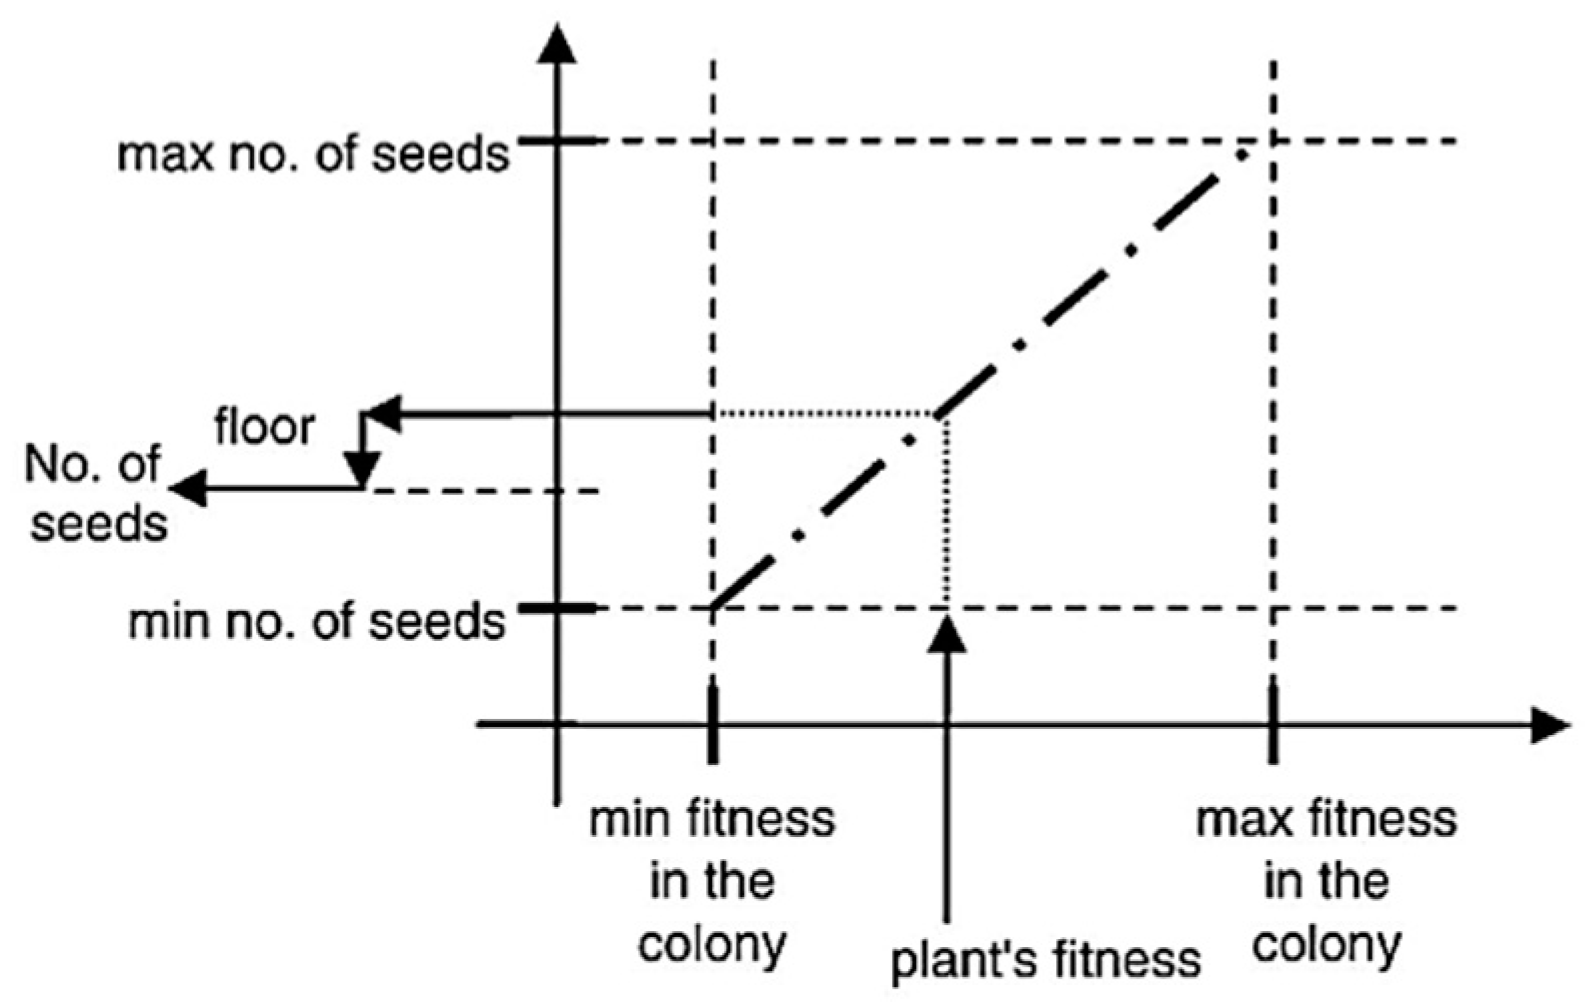
2.2.3. Invasive Weed Optimization
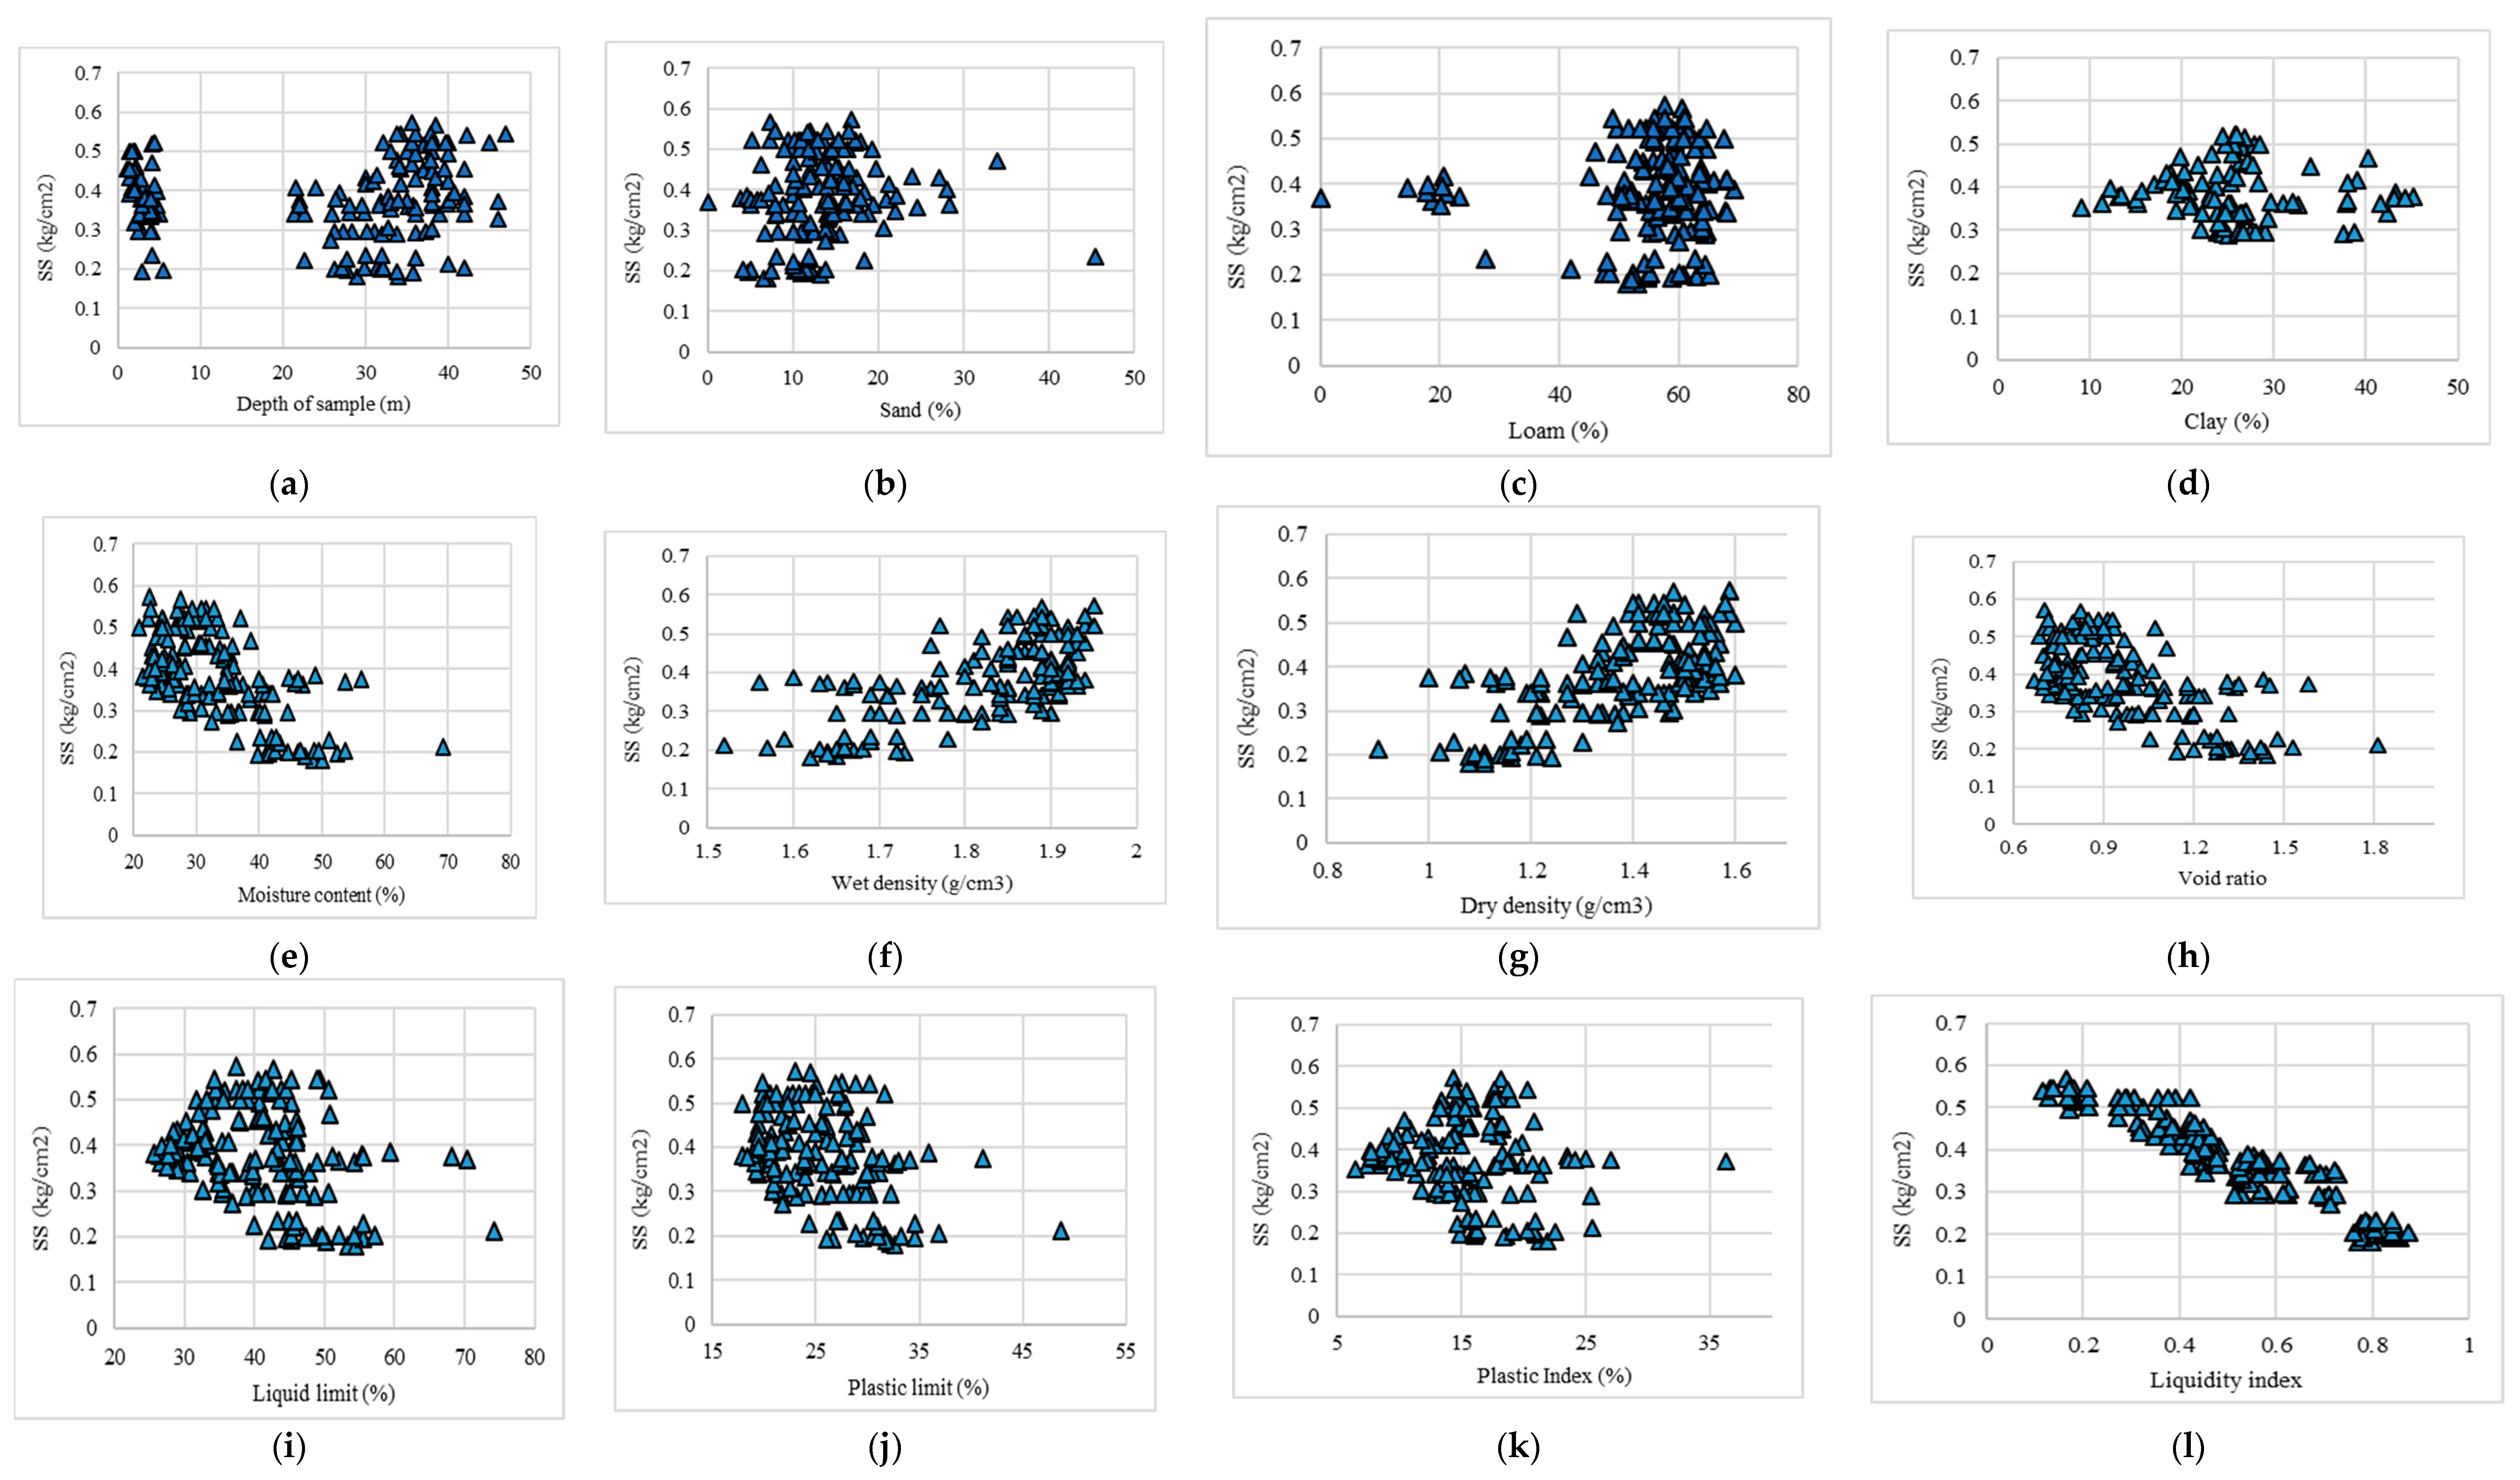
3. Data Collection and Statistical Analysis
4. Results and Discussion
4.1. Optimizing the ANN Using DA, WOA, and IWO
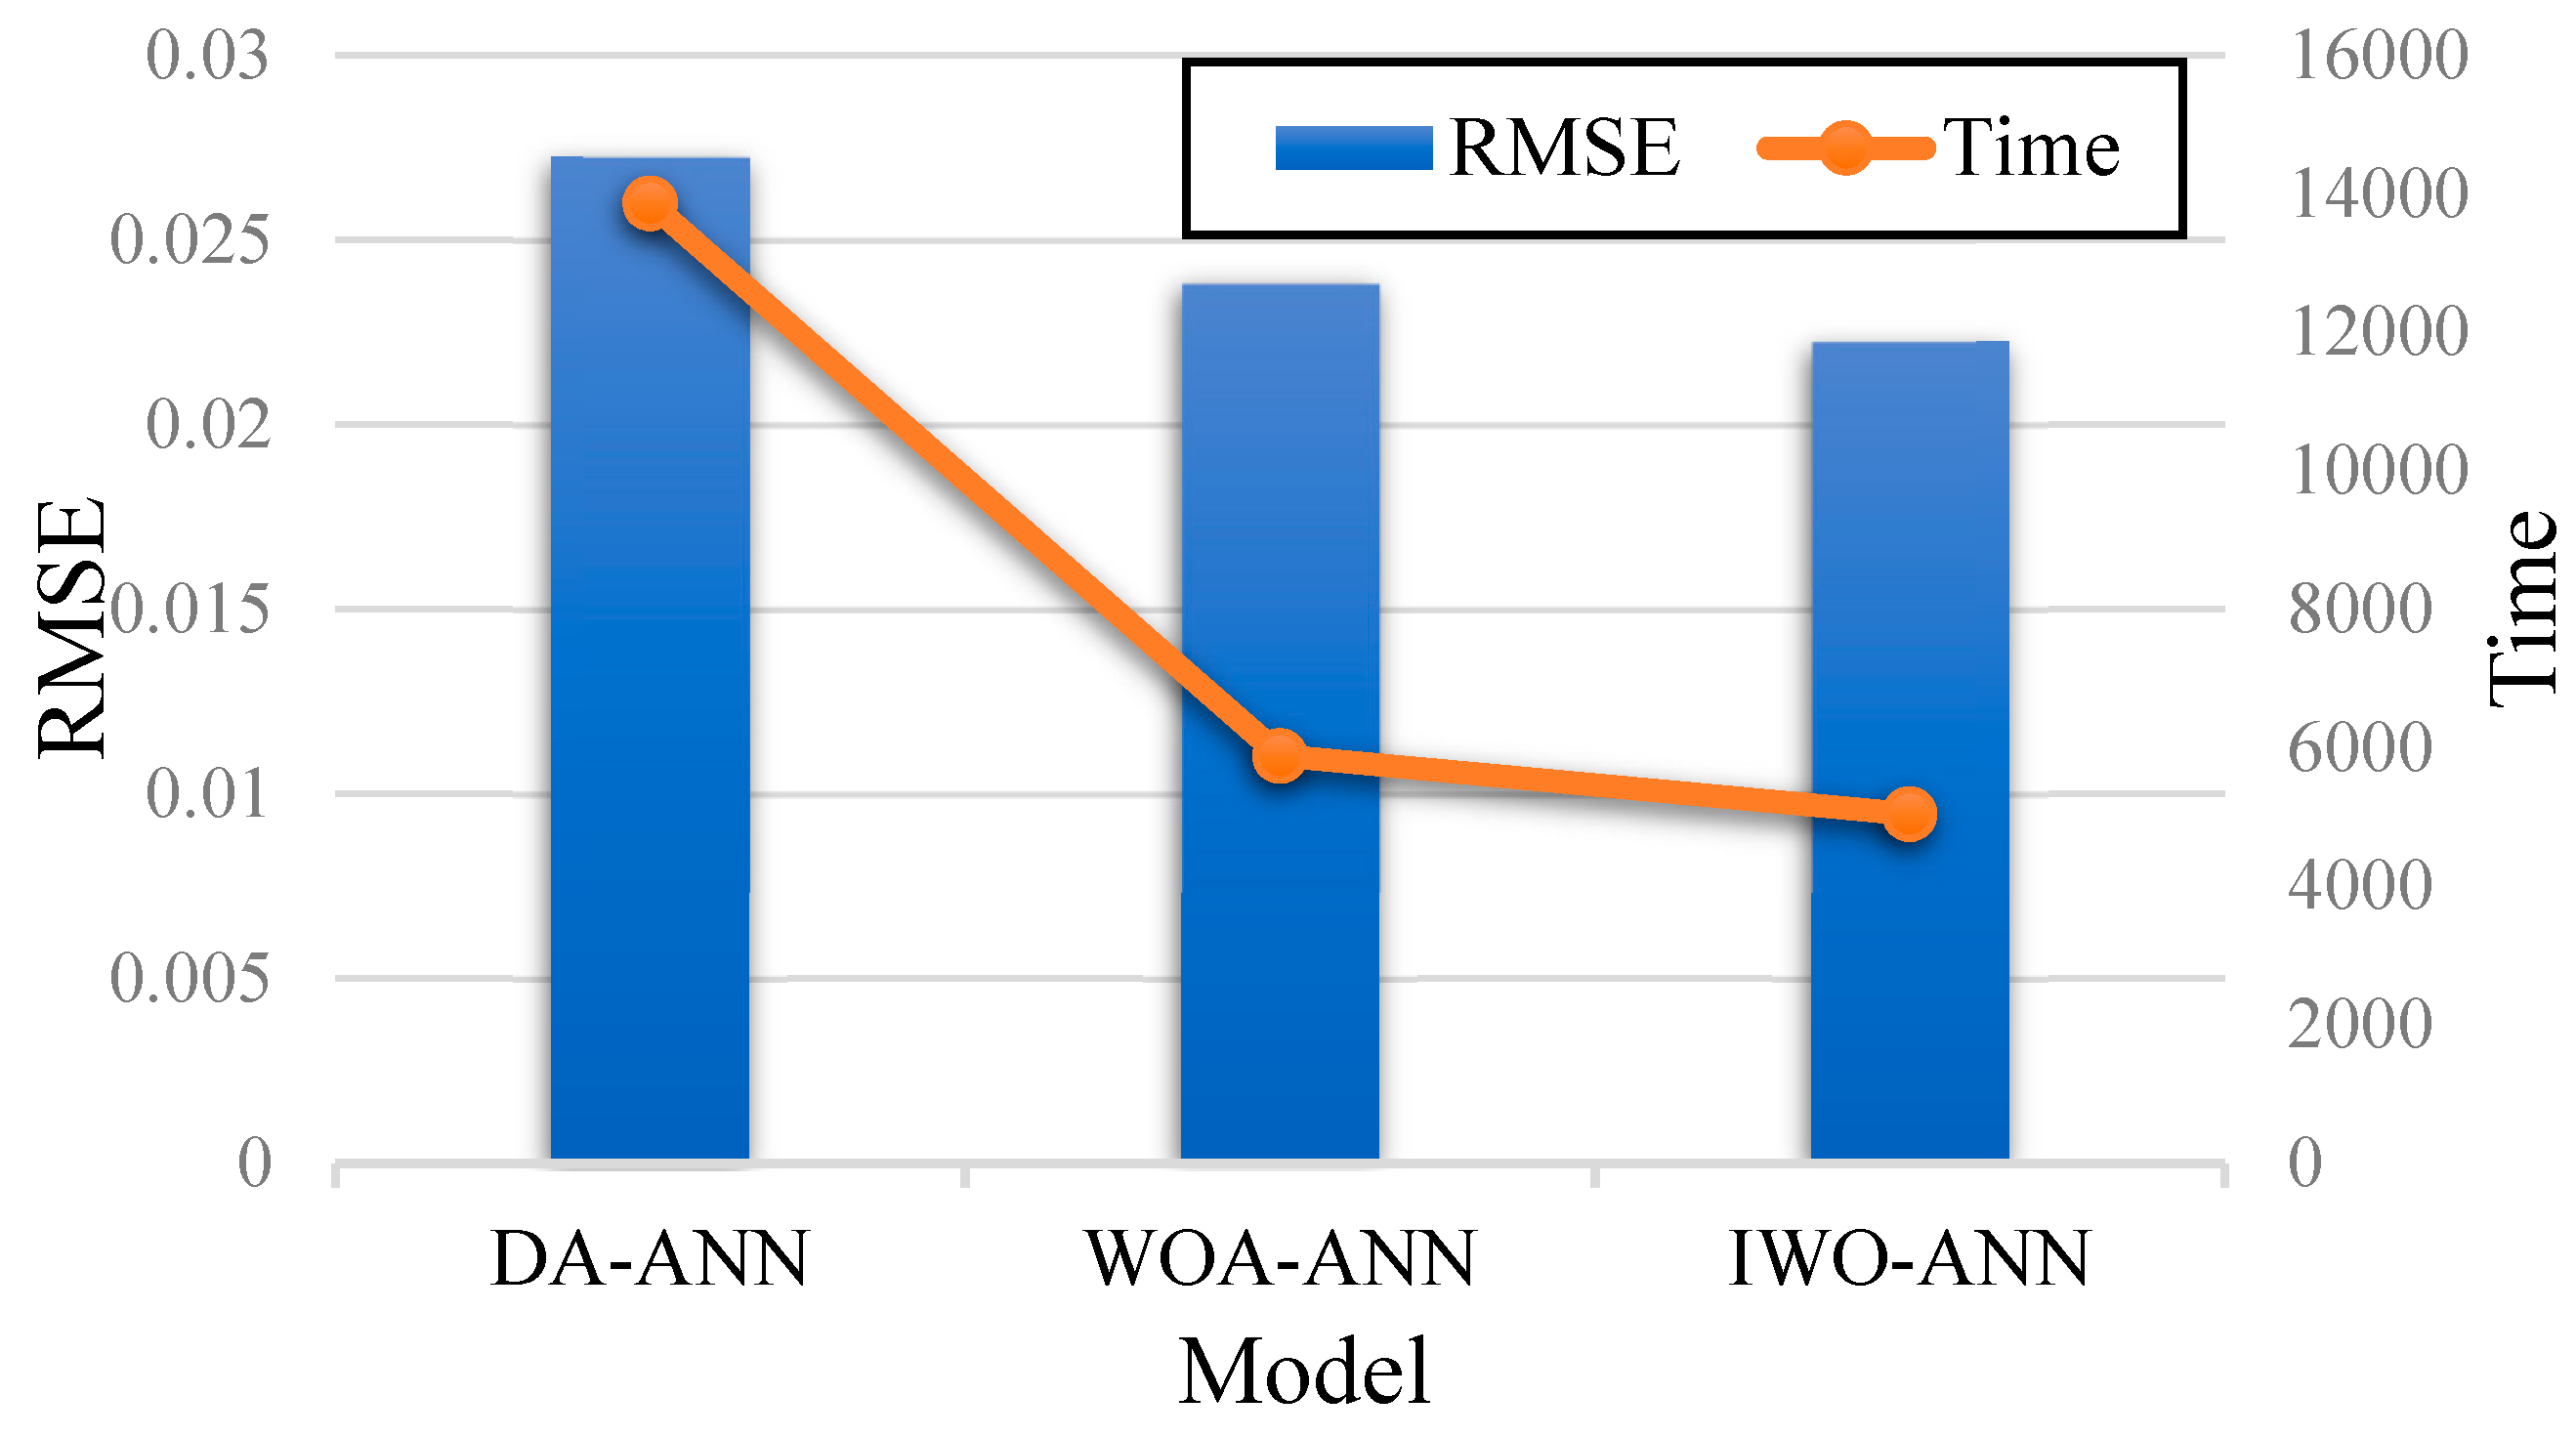
4.2. Accuracy Assessment of Predictive Models
5. Conclusions
Author Contributions
Funding
Acknowledgments
Conflicts of Interest
References
- Das, B.M.; Sobhan, K. Principles of Geotechnical Engineering; Cengage Learning: Boston, MA, USA, 2013. [Google Scholar]
- Vanapalli, S.; Fredlund, D. Comparison of different procedures to predict unsaturated soil shear strength. In Advances in Unsaturated Geotechnics; American Society of Civil Engineers: Preston, VA, USA, 2000; pp. 195–209. [Google Scholar]
- Nhu, V.-H.; Hoang, N.-D.; Duong, V.-B.; Vu, H.-D.; Bui, D.T. A hybrid computational intelligence approach for predicting soil shear strength for urban housing construction: A case study at Vinhomes Imperia project, Hai Phong city (Vietnam). Eng. Comput. 2019, 36, 1–14. [Google Scholar] [CrossRef]
- Nam, S.; Gutierrez, M.; Diplas, P.; Petrie, J. Determination of the shear strength of unsaturated soils using the multistage direct shear test. Eng. Geol. 2011, 122, 272–280. [Google Scholar] [CrossRef]
- Rassam, D.W.; Williams, D.J. A relationship describing the shear strength of unsaturated soils. Can. Geotech. J. 1999, 36, 363–368. [Google Scholar] [CrossRef]
- Gan, J.; Fredlund, D.; Rahardjo, H. Determination of the shear strength parameters of an unsaturated soil using the direct shear test. Can. Geotech. J. 1988, 25, 500–510. [Google Scholar] [CrossRef]
- Moayedi, H.; Hayati, S. Artificial intelligence design charts for predicting friction capacity of driven pile in clay. Neural Comput. Appl. 2018, 36, 1–17. [Google Scholar] [CrossRef]
- Besalatpour, A.; Hajabbasi, M.; Ayoubi, S.; Afyuni, M.; Jalalian, A.; Schulin, R. Soil shear strength prediction using intelligent systems: Artificial neural networks and an adaptive neuro-fuzzy inference system. Soil Sci. Plant Nutr. 2012, 58, 149–160. [Google Scholar] [CrossRef]
- Kiran, S.; Lal, B.; Tripathy, S. Shear strength prediction of soil based on probabilistic neural network. Indian J. Sci. Technol. 2016, 9, 1–6. [Google Scholar] [CrossRef]
- Jokar, M.H.; Mirasi, S. Using adaptive neuro-fuzzy inference system for modeling unsaturated soils shear strength. Soft Comput. 2018, 22, 4493–4510. [Google Scholar] [CrossRef]
- Nguyen, H.; Mehrabi, M.; Kalantar, B.; Moayedi, H.; Abdullahi, M.A.M. Potential of hybrid evolutionary approaches for assessment of geo-hazard landslide susceptibility mapping. Geomat. Nat. Hazards Risk 2019, 10, 1667–1693. [Google Scholar] [CrossRef]
- Moayedi, H.; Mehrabi, M.; Mosallanezhad, M.; Rashid, A.S.A.; Pradhan, B. Modification of landslide susceptibility mapping using optimized PSO-ANN technique. Eng. Comput. 2018, 35, 967–984. [Google Scholar] [CrossRef]
- Moayedi, H.; Mehrabi, M.; Kalantar, B.; Mu’azu, M.A.; Rashid, A.S.A.; Foong, L.K.; Nguyen, H. Novel hybrids of adaptive neuro-fuzzy inference system (ANFIS) with several metaheuristic algorithms for spatial susceptibility assessment of seismic-induced landslide. Geomat. Nat. Hazards Risk 2019, 10, 1879–1911. [Google Scholar] [CrossRef] [Green Version]
- Bui, D.T.; Hoang, N.-D.; Nhu, V.-H. A swarm intelligence-based machine learning approach for predicting soil shear strength for road construction: A case study at Trung Luong National Expressway Project (Vietnam). Eng. Comput. 2019, 35, 955–965. [Google Scholar]
- Pham, B.T.; Hoang, T.-A.; Nguyen, D.-M.; Bui, D.T. Prediction of shear strength of soft soil using machine learning methods. Catena 2018, 166, 181–191. [Google Scholar] [CrossRef]
- McCulloch, W.S.; Pitts, W. A logical calculus of the ideas immanent in nervous activity. Bull. Math. Biophys. 1943, 5, 115–133. [Google Scholar] [CrossRef]
- Moré, J.J. The Levenberg-Marquardt algorithm: Implementation and theory. In Numerical Analysis; Springer: Berlin, Germany, 1978; pp. 105–116. [Google Scholar] [Green Version]
- Hecht-Nielsen, R. Theory of the backpropagation neural network. In Neural Networks for Perception; Elsevier: Amsterdam, The Netherlands, 1992; pp. 65–93. [Google Scholar]
- Mirjalili, S. Dragonfly algorithm: A new meta-heuristic optimization technique for solving single-objective, discrete, and multi-objective problems. Neural Comput. Appl. 2016, 27, 1053–1073. [Google Scholar] [CrossRef]
- Moayedi, H.; Abdullahi, M.A.M.; Nguyen, H.; Rashid, A.S.A. Comparison of dragonfly algorithm and Harris hawks optimization evolutionary data mining techniques for the assessment of bearing capacity of footings over two-layer foundation soils. Eng. Comput. 2019, 36, 1–11. [Google Scholar] [CrossRef]
- Vanishree, J.; Ramesh, V. Optimization of size and cost of static var compensator using dragonfly algorithm for voltage profile improvement in power transmission systems. Int. J. Renew. Energy Res. (IJRER) 2018, 8, 56–66. [Google Scholar]
- Wikelski, M.; Moskowitz, D.; Adelman, J.S.; Cochran, J.; Wilcove, D.S.; May, M.L. Simple rules guide dragonfly migration. Biol. Lett. 2006, 2, 325–329. [Google Scholar] [CrossRef]
- Palappan, A.; Thangavelu, J. A New Meta Heuristic Dragonfly Optimizaion Algorithm for Optimal Reactive Power Dispatch Problem. Gazi Univ. J. Sci. 2018, 31, 1107–1121. [Google Scholar]
- Yasen, M.; Al-Madi, N.; Obeid, N. Optimizing Neural Networks using Dragonfly Algorithm for Medical Prediction. In Proceedings of the 2018 IEEE 8th International Conference on Computer Science and Information Technology (CSIT), Amman, Jordan, 11–12 July 2018; pp. 71–76. [Google Scholar]
- Mirjalili, S.; Lewis, A. The whale optimization algorithm. Adv. Eng. Softw. 2016, 95, 51–67. [Google Scholar] [CrossRef]
- Rana, N.; Latiff, M.S.A. A Cloud-based Conceptual Framework for Multi-Objective Virtual Machine Scheduling using Whale Optimization Algorithm. Int. J. Innov. Comput. 2018, 8, 53–58. [Google Scholar] [CrossRef]
- Mehrabian, A.R.; Lucas, C. A novel numerical optimization algorithm inspired from weed colonization. Ecol. Inform. 2006, 1, 355–366. [Google Scholar] [CrossRef]
- Tien Bui, D.; Khosravi, K.; Li, S.; Shahabi, H.; Panahi, M.; Singh, V.; Chapi, K.; Shirzadi, A.; Panahi, S.; Chen, W. New hybrids of anfis with several optimization algorithms for flood susceptibility modeling. Water 2018, 10, 1210. [Google Scholar] [CrossRef]
- Naidu, Y.R.; Ojha, A. A hybrid version of invasive weed optimization with quadratic approximation. Soft Comput. 2015, 19, 3581–3598. [Google Scholar] [CrossRef]
- Ghasemi, M.; Ghavidel, S.; Akbari, E.; Vahed, A.A. Solving non-linear, non-smooth and non-convex optimal power flow problems using chaotic invasive weed optimization algorithms based on chaos. Energy 2014, 73, 340–353. [Google Scholar] [CrossRef]
- Bui, D.T.; Nhu, V.-H.; Hoang, N.-D. Prediction of soil compression coefficient for urban housing project using novel integration machine learning approach of swarm intelligence and multi-layer perceptron neural network. Adv. Eng. Inform. 2018, 38, 593–604. [Google Scholar]
- Xi, W.; Li, G.; Moayedi, H.; Nguyen, H. A particle-based optimization of artificial neural network for earthquake-induced landslide assessment in Ludian county, China. Geomat. Nat. Hazards Risk 2019, 10, 1750–1771. [Google Scholar] [CrossRef] [Green Version]
- Cybenko, G. Approximation by superpositions of a sigmoidal function. Math. Control Signals Syst. 1989, 2, 303–314. [Google Scholar] [CrossRef]
- Hornik, K.; Stinchcombe, M.; White, H. Multilayer feedforward networks are universal approximators. Neural Netw. 1989, 2, 359–366. [Google Scholar] [CrossRef]
- Gao, W.; Wang, W.; Dimitrov, D.; Wang, Y. Nano properties analysis via fourth multiplicative ABC indicator calculating. Arabian J. Chem. 2018, 11, 793–801. [Google Scholar] [CrossRef]
- Gao, W.; Dimitrov, D.; Abdo, H. Tight independent set neighborhood union condition for fractional critical deleted graphs and ID deleted graphs. Discret. Contin. Dyn. Syst. S 2018, 12, 711–721. [Google Scholar]
- Gao, W.; Guirao, J.L.G.; Abdel-Aty, M.; Xi, W. An independent set degree condition for fractional critical deleted graphs. Discret. Contin. Dyn. Syst. S 2019, 12, 877–886. [Google Scholar] [Green Version]
- Gao, W.; Guirao, J.L.G.; Basavanagoud, B.; Wu, J. Partial multi-dividing ontology learning algorithm. Inf. Sci. 2018, 467, 35–58. [Google Scholar] [CrossRef]
- Gao, W.; Wu, H.; Siddiqui, M.K.; Baig, A.Q. Study of biological networks using graph theory. Saudi J. Biol. Sci. 2018, 25, 1212–1219. [Google Scholar] [CrossRef]


| Features | Descriptive Index | |||||||||
|---|---|---|---|---|---|---|---|---|---|---|
| Mean | Standard Error | Median | Mode | Standard Deviation | Sample Variance | Skewness | Minimum | Maximum | Count. | |
| Depth of sample (m) | 24.72 | 1.21 | 31.20 | 38.00 | 15.06 | 226.83 | −0.57 | 1.20 | 47.00 | 154 |
| Sand (%) | 16.26 | 1.11 | 13.00 | 10.00 | 13.83 | 191.16 | 2.95 | 0.00 | 70.80 | 154 |
| Loam (%) | 55.18 | 0.92 | 57.95 | 55.90 | 11.50 | 132.33 | −2.47 | 0.00 | 69.20 | 154 |
| Clay (%) | 28.10 | 0.62 | 26.80 | 24.60 | 7.68 | 59.01 | 0.28 | 9.10 | 48.00 | 154 |
| Moisture content (%) | 33.23 | 0.70 | 31.60 | 25.80 | 8.69 | 75.59 | 1.00 | 20.80 | 69.20 | 154 |
| Wet density (g/cm3) | 1.82 | 0.01 | 1.85 | 1.89 | 0.10 | 0.01 | −0.90 | 1.52 | 1.95 | 154 |
| Dry density (g/cm3) | 1.38 | 0.01 | 1.41 | 1.41 | 0.16 | 0.02 | −0.68 | 0.90 | 1.60 | 154 |
| Void Ratio | 0.97 | 0.02 | 0.91 | 1.20 | 0.23 | 0.05 | 0.98 | 0.67 | 1.81 | 154 |
| Liquid limit (%) | 40.87 | 0.70 | 40.70 | 46.00 | 8.69 | 75.55 | 0.77 | 25.60 | 74.20 | 154 |
| Plastic limit (%) | 25.38 | 0.40 | 25.00 | 21.00 | 5.01 | 25.12 | 1.01 | 17.90 | 48.70 | 154 |
| Plastic Index (%) | 15.49 | 0.35 | 15.10 | 15.70 | 4.42 | 19.50 | 0.79 | 6.50 | 36.30 | 154 |
| Liquidity index | 0.49 | 0.02 | 0.47 | 0.45 | 0.19 | 0.04 | 0.06 | −0.03 | 0.88 | 154 |
| Shear strength (kg/cm2) | 0.38 | 0.01 | 0.38 | 0.29 | 0.10 | 0.01 | −0.21 | 0.18 | 0.57 | 154 |
| Model | Training Data | Testing Data | Training Score | Testing Score | Total Ranking Score (TRS) | Rank | ||||
|---|---|---|---|---|---|---|---|---|---|---|
| RMSE | MAE | R2 | RMSE | MAE | R2 | |||||
| ANN | 1 | 1 | 1 | 1 | 1 | 1 | 3 | 3 | 6 | 3 |
| DA-ANN | 2 | 2 | 2 | 4 | 2 | 4 | 6 | 10 | 16 | 2 |
| WOA-ANN | 3 | 3 | 3 | 2 | 3 | 2 | 9 | 7 | 16 | 2 |
| IWO-ANN | 4 | 4 | 4 | 3 | 4 | 3 | 12 | 10 | 22 | 1 |
© 2019 by the authors. Licensee MDPI, Basel, Switzerland. This article is an open access article distributed under the terms and conditions of the Creative Commons Attribution (CC BY) license (http://creativecommons.org/licenses/by/4.0/).
Share and Cite
Moayedi, H.; Tien Bui, D.; Dounis, A.; Kok Foong, L.; Kalantar, B. Novel Nature-Inspired Hybrids of Neural Computing for Estimating Soil Shear Strength. Appl. Sci. 2019, 9, 4643. https://doi.org/10.3390/app9214643
Moayedi H, Tien Bui D, Dounis A, Kok Foong L, Kalantar B. Novel Nature-Inspired Hybrids of Neural Computing for Estimating Soil Shear Strength. Applied Sciences. 2019; 9(21):4643. https://doi.org/10.3390/app9214643
Chicago/Turabian StyleMoayedi, Hossein, Dieu Tien Bui, Anastasios Dounis, Loke Kok Foong, and Bahareh Kalantar. 2019. "Novel Nature-Inspired Hybrids of Neural Computing for Estimating Soil Shear Strength" Applied Sciences 9, no. 21: 4643. https://doi.org/10.3390/app9214643
APA StyleMoayedi, H., Tien Bui, D., Dounis, A., Kok Foong, L., & Kalantar, B. (2019). Novel Nature-Inspired Hybrids of Neural Computing for Estimating Soil Shear Strength. Applied Sciences, 9(21), 4643. https://doi.org/10.3390/app9214643