Article

Development of Two Novel Hybrid Prediction Models Estimating Ultimate Bearing Capacity of the Shallow Circular Footing

1
Department for Management of Science and Technology Development, Ton Duc Thang University, Ho Chi Minh City, Vietnam
2
Faculty of Civil Engineering, Ton Duc Thang University, Ho Chi Minh City, Vietnam
3
RIKEN Center for Advanced Intelligence Project, Goal-Oriented Technology Research Group, Disaster Resilience Science Team, Tokyo 103-0027, Japan
4
Department of Industrial Design and Production Engineering, University of West Attica, Campus 2, 250 Thivon & P. Ralli, 12244 Egaleo, Greece
5
Institute of Research and Development, Duy Tan University, Da Nang, Vietnam
6
Geographic Information System Group, Department of Business and IT, University of South-Eastern Norway, N-3800 Bø i Telemark, Norway
7
Centre of Tropical Geoengineering (Geotropik), School of Civil Engineering, Faculty of Engineering, Universiti Teknologi Malaysia, 81310 Johor Bahru, Johor, Malaysia
*
Authors to whom correspondence should be addressed.
Appl. Sci. 2019, 9(21), 4594; https://doi.org/10.3390/app9214594
Submission received: 11 September 2019 / Revised: 7 October 2019 / Accepted: 11 October 2019 / Published: 29 October 2019
(This article belongs to the Special Issue Artificial Intelligence in Smart Buildings)

Abstract

:
In the present work, we employed artificial neural network (ANN) that is optimized with two hybrid models, namely imperialist competition algorithm (ICA) as well as particle swarm optimization (PSO) in the case of the problem of bearing capacity of shallow circular footing systems. Many types of research have shown that ANNs are valuable techniques for estimating the bearing capacity of the soils. However, most ANN training models have some drawbacks. This study aimed to focus on the application of two well-known hybrid ICA–ANN and PSO–ANN models to the estimation of bearing capacity of the circular footing lied in layered soils. In order to provide the training and testing datasets for the predictive network models, extensive finite element (FE) modelling (a database includes 2810 training datasets and 703 testing datasets) are performed on 16 soil layer sets (weaker soil rested on stronger soil and vice versa). Note that all the independent variables of ICA and PSO algorithms are optimized utilizing a trial and error method. The input includes upper layer thickness/foundation width (h/B) ratio, footing width (B), top and bottom soil layer properties (e.g., six of the most critical soil characteristics), vertical settlement of circular footing (s), where the output was taken ultimate bearing capacity of the circular footing (Fult). Based on coefficient of determination (R2) and Root Mean Square Error (RMSE), amounts of (0.979, 0.076) and (0.984, 0.066) predicted for training dataset and amounts of (0.978, 0.075) and (0.983, 0.066) indicated in the case of the testing dataset of proposed PSO–ANN and ICA–ANN models of prediction network, respectively. It demonstrates a higher reliability of the presented PSO–ANN model for predicting ultimate bearing capacity of circular footing located on double sandy layer soils.

Graphical Abstract

1. Introduction

Recently, artificial neural network (ANN) has been suggested to support the estimation of ultimate bearing capacity of the circular footing in single homogenous soil environments as well as other engineering materials [1,2,3,4]. The study of Fult (maximum applied stresses corresponding to a particular settlement, i.e., 0.10 foundation width) of foundations is essential to geotechnical engineering and soil mechanics. In addition, complex geological structure, e.g., bearing capacity of shallow footings lied on multilayer soil (or non-homogeneous soil), are important to be considered. Traditional approaches are based on complex solutions, i.e., utilizing limit equilibrium consideration [5,6,7,8,9] or extensive experimental approaches [10,11,12,13,14]. In many cases, the suggested solutions illustrated how the top layer thickness (or its ratio to the footing width) affects the Fult of the shallow footing placed on two or more layered soils. In this regard, the settlement and bearing capacity of shallow footings have been proven to depend on several key factors, namely foundation soil parameters, the shape of the footing, and number of soil layer beneath the footing. The complexity of the problem is raised by the addition of soil layers under the footing. Different equations have been proposed to compute the soil bearing capacity (e.g., in a particular settlement) of circular and square footings [15,16,17]. The main problem of predicting the ultimate bearing capacity of the circular footing is to reduce or minimize its likelihood of high settlement after real stresses are used. The most effective parameters in predicting a correction amount for the bearing capacity are (i) soil parameters (or layered soils beneath footing), (ii) footing shape (e.g., strip, circular, and rectangular); and (iii) soil layers arrangement [18]. It is important to note that the soil properties (e.g., dilation angle, unit weight, internal friction angle and cohesion, and Poisson’s ratio, as well as elastic modulus) can apply stresses on the footing. In general, the ultimate bearing capacity of the circular footing has been determined to be the ultimate applied stress in the case of the maximum ratio of settlement (footing settlement/footing width or S/B) that is 10% of the footing width [5,19,20]. There are many factors that can affect bearing capacity of the shallow footing like multilayer soil and geological conditions, failure model considered through the calculation, the stronger soil location (for example, the arrangement of soil layer), type of the soil, and footing width [21]. For providing a reliable prediction of the ultimate bearing capacity (Fult) for shallow footings placed on multi-layered soils, many scholars like Haghbin [22], Lotfizadeh and Kamalian [23], Meyerhof and Hanna [10], and Ahmadi and Kouchaki [24] suggested novel formulas.
In this study, to forecast the Fult of the circular footing, 84 ANN models and 58 hybrid models (for example, helping the ANN for providing an efficient outcome), namely (i) imperialist competition algorithm (ICA) and (ii) particle swarm optimization (PSO) were designed. The hybrid ICA–NN and PSO–ANN models provided here were not utilized in the engineering-based example provided in this study. There does not exist a study conducted on the use of the proposed hybrid model to predict the Fult of circular footing rested on multilayer soil conditions. Thus, this study aimed to optimize ANN with two well-developed hybrid optimization algorithm models with a reliable approximation of circular footing’s bearing capacity rested on layered soils.

2. Methodology and Model Assessment

2.1. Artificial Neural Network

In this study, three different hybrid artificial intelligent systems were used to estimate the ultimate bearing capacity of the circular footing, namely (i) conventional feedforward backpropagation ANN, (ii) hybrid PSO–ANN, and also (iii) ICA–ANN. McCulloch and Pitts [25] suggested ANN for the first one. Then, in 1949, the first technique for training ANNs was suggested [26]. There were several rules according to observations and hypothesis of neuro-physiologic nature. Numerous other researchers have investigated the development of nonlinear and simple mathematical models according to biological neuron [27,28]. These studies allow for the production of a big number of structures (e.g., topologies) and network learning algorithms [29,30,31,32,33,34,35]. With using a randomly selected testing database, ANN-based models run the dataset in a training network and can also analyze the predicted result (i.e., less than 30% of the whole datasets) [36,37,38]. More details about the ANN algorithm are presented in Figure 1.

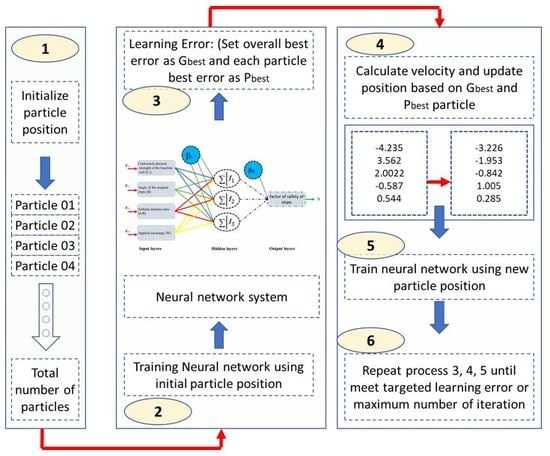
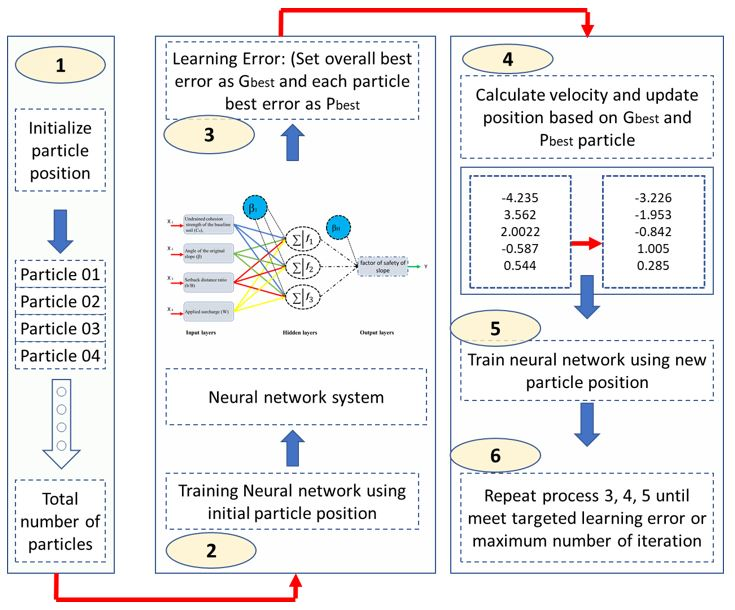
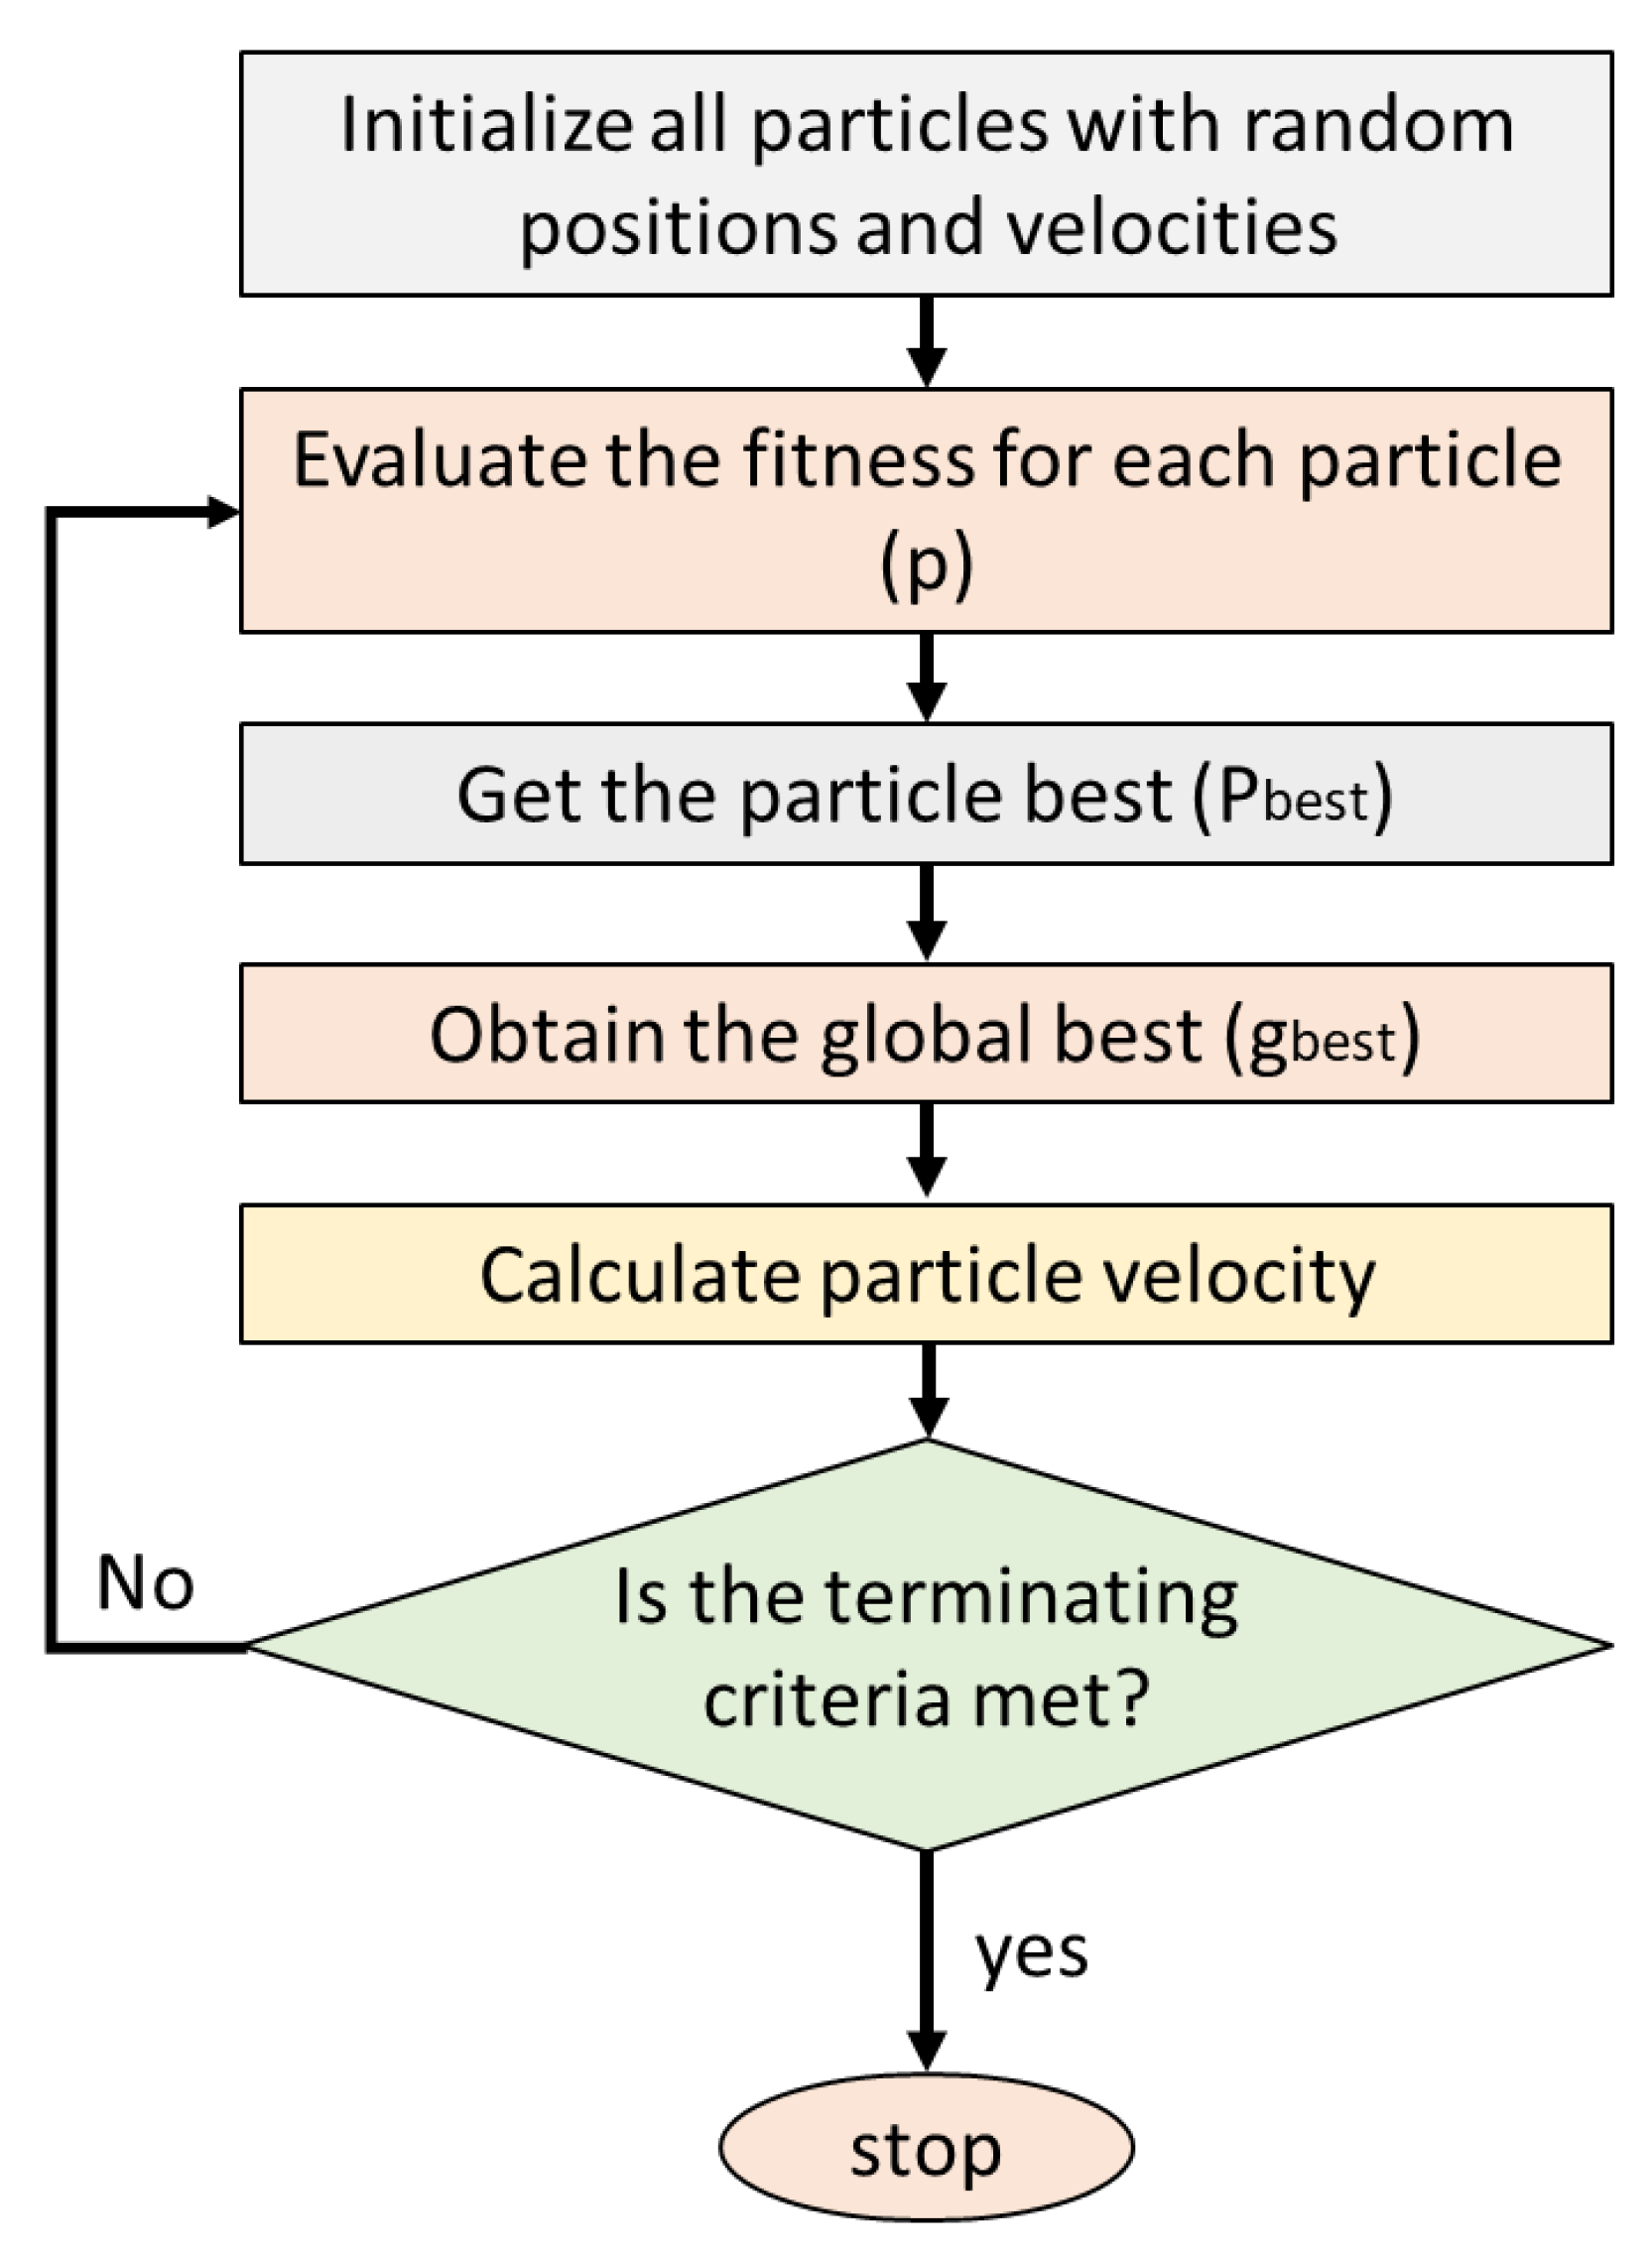
2.2. Particle Swarm Optimization (PSO)

Eberhart and Kennedy [39] have introduced particle swarm optimization (PSO) algorithm. After that, many scholars used it, including Huang and Dun [40] and Wan et al. [41], in different optimization problems. This algorithm commonly uses less memory and also has a higher learning speed than other optimization algorithms like the genetic algorithm. Figure 2 shows simplified details about the algorithm of PSO that all considered particles were initialized. The most appropriate particle can be chosen when the fitness assessment for every particle is performed. Then, among all particles, the global best particle can be selected and the outcomes for particle velocity should be tested by terminating criteria. The algorithm ends when the terminating criteria are met. With this new compatibility, the algorithm is predicted again, and new compatibility can be selected per each particle. In many studies (Zhang, et al. [42], Yuan and Moayedi [43], Yuan and Moayedi [44], Xi, et al. [45] and Moayedi, et al. [46]), the learning approach of hybrid PSO combined with the ANN algorithm (called PSO-ANN in this study) was suggested (Figure 3).

2.3. Imperialist Competition Algorithm (ICA)

The method of imperialist competition algorithm (ICA) was firstly developed by [47] and later expanded in different engineering subjects by other researchers (e.g., Mosallanezhad and Moayedi [48]). Its process is very similar to many other evolutionary algorithms such as PSO and genetic algorithm (GA). The first step in ICA is candidate solutions (or initial population). This step in ICA gets started with a number of countries. The number of countries will be separated into two main groups, namely imperialists and colonies. In these groups, the imperialists are some of the strongest countries where the colonies are the remaining countries (Figure 4). Note that colonies are distributed between the imperialists to make the empires. The distribution of the colonies is based on their own relative strength. As in the ICA, each one of the emeries competes with others to govern more colonies and therefore expand their territory. At the end of this imperialist competition looping, stronger empires will take possession of weaker colonies located in weaker empires. The process will stop after being satisfied by pre-defined termination criteria. Description of the ICA algorithm including its designed steps is well described in other studies. The algorithm of ICA is presented in Figure 5.
In the literature, for enhancing the efficiency of the ANN-based algorithm by the use of novel optimization algorithms, many works have been performed. In the case of solving engineering issues, algorithms like genetic, ICA, and PSO algorithms can be selected as the new optimization approaches. Moreover, in order to improve the defect of the ANNs, many optimization algorithms have been tested. The optimized finding method of ANN algorithm can cause undesirable solution because the backpropagation approach is a local searching method, for example, searching via the training algorithm. For finding an appropriate weight along with bias of the network and for enhancing the efficiency, different optimization approaches can be selected. Because optimization algorithms can discover a global minimum in comparison with backpropagation-based neural networks, one can find a higher probability of finding more appropriate convergence in these methods. Hence, by taking advantage of hybrid methods like PSO–ANN and ICA–ANN, the ANN weakness in the case of finding the global minimum is removed for example enhancing its searching characteristics by fitness functions and also cost functions.

3. FEM Simulation and Data Collection
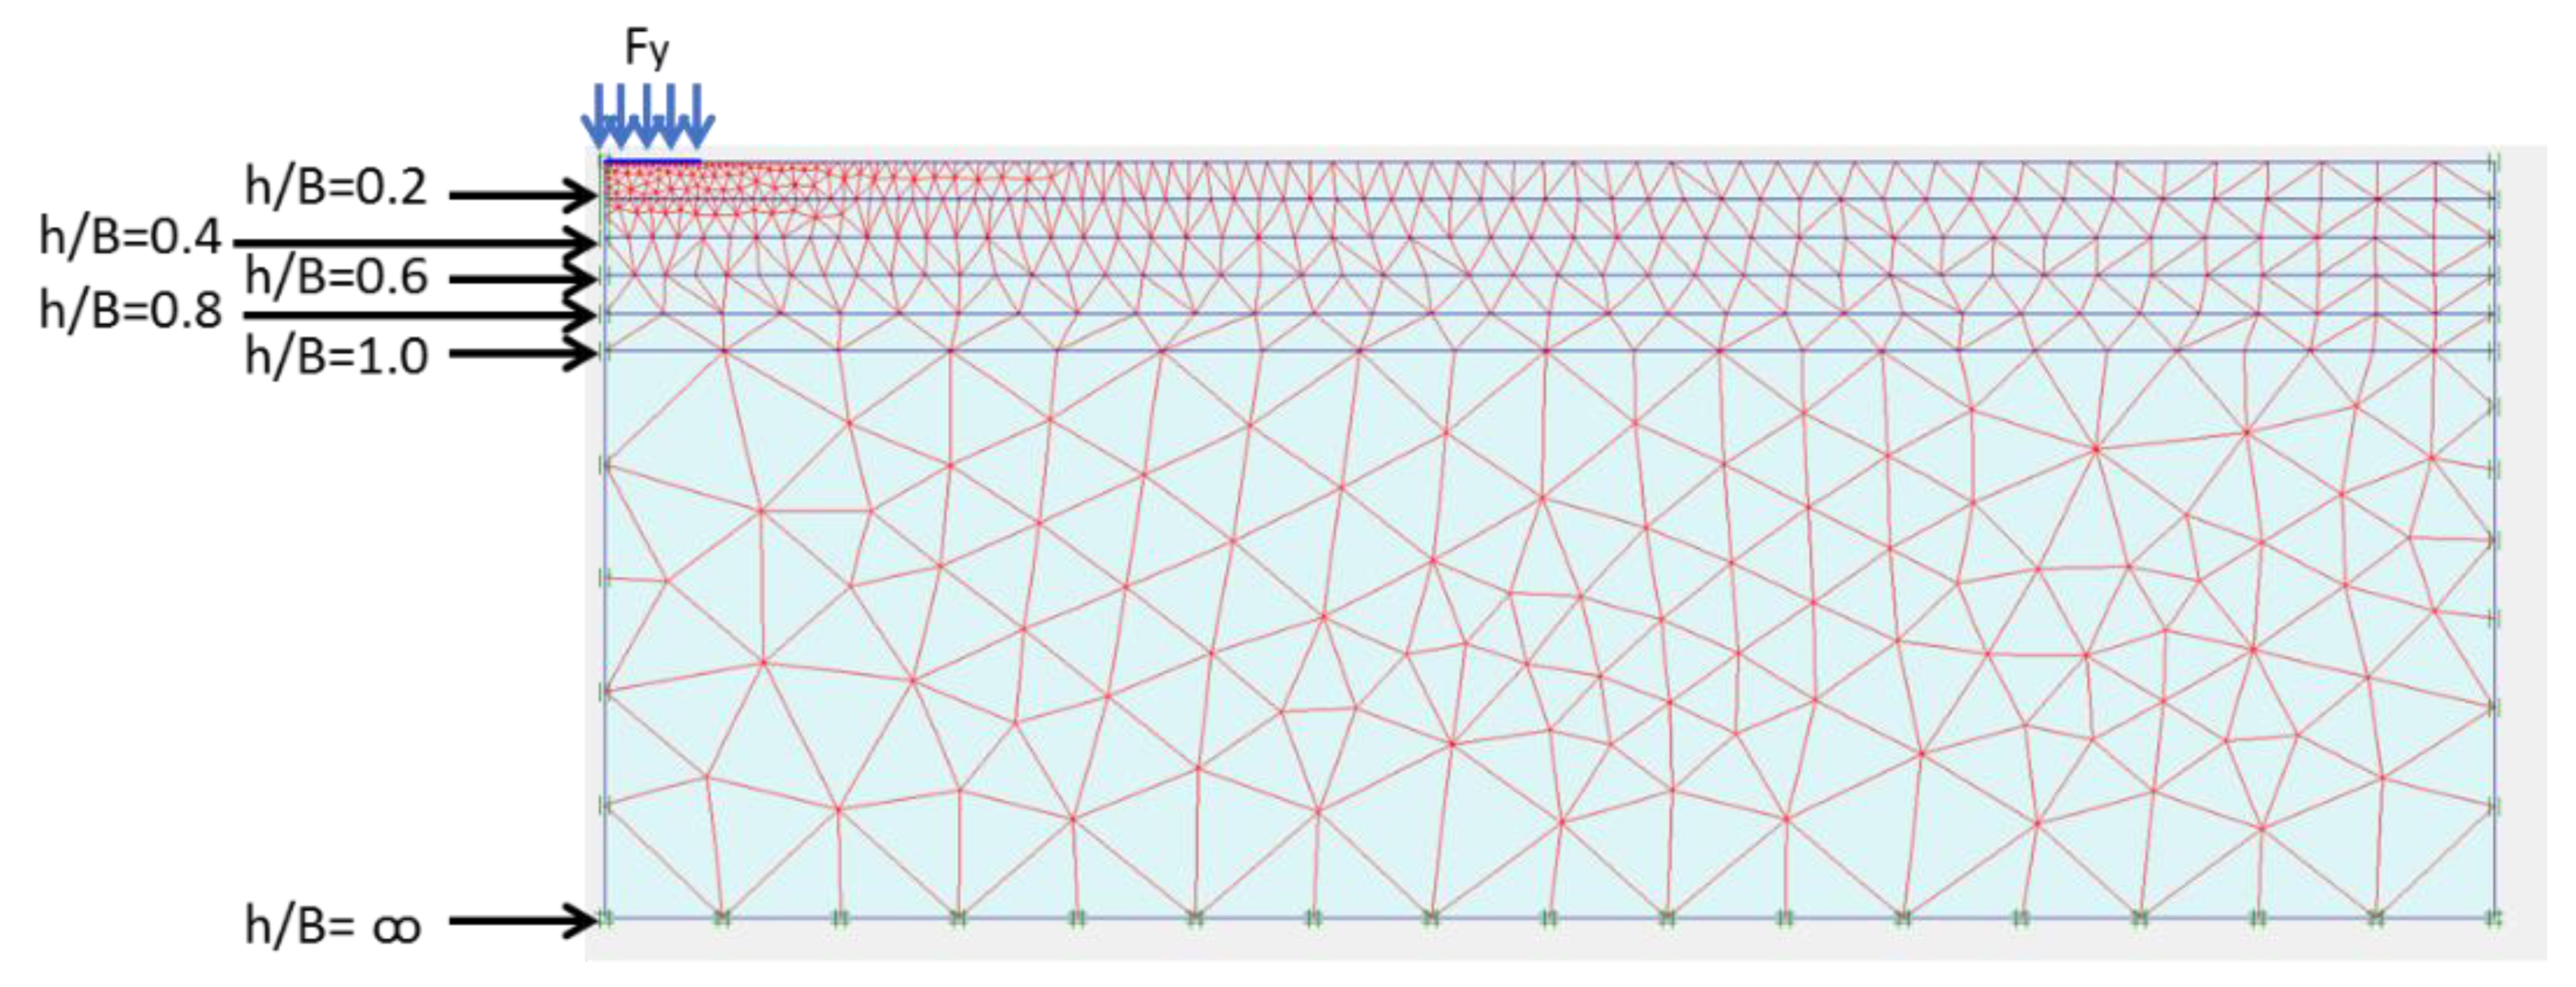
3.1. FEM Simulation

In this study, eight different soil types were used along with significant diversity in their main attributes. These attributes can address almost the most usual kinds of sands. In the modelling, internal friction and dilation angles in the range of 32–42 and 3.4–11.5 degrees are selected and also utilized, respectively. Moreover, the elastic modulus, Poisson’s ratio, and unit weight varied between the values of 17500–65000 kN/m2, 0.333–0.249, and 19–21.1 kN/m3, respectively. The soil properties, which are attended for prediction of a network can be shown as a series of the graphical summary that is the range of input data. These datasets include friction angle, Poisson’s ratio, elastic modulus, and unit weight is drawn in Figure 6. To determine applied stresses beneath the footing (Fult), asymmetric FEM of circular foundation, for example, a width around 1.0 m is placed on two-layer soils (Figure 7). Infeasible civil engineering plans, the layers of soil beneath the foundations are not homogeneous, commonly, and there are many cases where (i) a weaker soil layer rested on a stronger soil layer or (ii) stronger soil placed on a soil layer with much weaker physical characteristics. Plaxis 2D (a commercial finite element software) is employed to predict the influences of soil layer’s properties on ultimately applied stresses. Based on several recommendations (e.g., Mosallanezhad and Moayedi [50], and Hou, et al. [51]) the most effective factors, which influence the maximum bearing capacity of the soil, are (i) soil properties (for example, soil layer thickness beneath the footing), maximum expected settlement (s), friction angle φ , unit weight γ , elastic modulus E, Poisson’s ratio υ , type of design analysis, and dilation angle ψ . (Table 1). Note that, in the present work, cohesion has been considered equal to zero for estimating the Fult in distinct layered sandy soils. In addition, zero value for cohesion means soil does not have any cohesive strength and provides sandy soil state. Values of 0, 0.4, 0.4, 0.8, and also 1.0 are selected for the upper layer width of thickness.
As stated earlier, to generate the best structure for the proposed hybrid models, the database employed to train the models is obtained by a total of 3513 full-scale finite element simulations. The dataset is considered for a circular footing with a radius of 1.0 m, rested on two-layered soil condition. It is noted that the vertical stress amounts before arriving at the maximum S/B ratio are labelled Fult. Based on many similar works (e.g., Anvari and Shooshpasha [52] and Noorzad and Manavirad [53]), soil layer thickness beneath the footing, maximum expected settlement (s), friction angle φ , unit weight   γ , elastic modulus E , Poisson’s ratio υ , type of design analysis, and dilation angle ψ were selected as inputs and applied datasets for building the proposed models. An instance of a database received by the FEM simulation and effective factors influencing the Fult, as the model output, selected in the ANN algorithm was shown in Table 2.

3.2. Model Assessment

The normalized data were employed in this study. Moreover, two well-known statistical criteria of coefficient of determination (R2) and root mean square error (RMSE) were specified to calculate the error rate of the predicted network results. Equations (1) and (2) formulate these indices:
R 2 = 1 i = 1 s ( Y i p r e d i c t e d Y i o b s e r v e d ) 2 i = 1 s ( Y i o b s e r v e d Y ¯ o b s e r v e d ) 2
RMSE = 1 N i = 1 N [ ( Y i o b s e r v e d Y i p r e d i c t e d ) ] 2
where Yi observed, and Yi predicted are the real and estimated values of a bearing capacity, respectively. Also, the term N indicates the number of instances and Y ¯ observed denotes the average of capacities.

4. Model Development for Fult Estimation

4.1. ANN Network Optimization

Estimation of the maximum applied stress on circular footings lied in 16 different layered soil sates is the most important objective of this research. As the first step of the optimization method of ANN, different training and testing datasets are taken for the prediction that considering around 80% of the total dataset (in the case of the training dataset) and 20% of the total dataset (for the testing dataset). To drive the most appropriate predictive network, many works (e.g., Moayedi, et al. [46], and Chakraborty and Goswami [12]) proposed to use 20% or 703 datasets and 80% or 2810 datasets of both datasets (i.e., testing and training), respectively. The most appropriate structure of the model of ANN could be obtained after a large number of trial and also error process and using change in the number of the hidden layer as well as the number of neurons [54]. Therefore, around 84 ANN-Tansig models were built. For finding their best network performances, the efficiency of suggested networks has been measured. Figure 8 and Figure 9 show the mean outcome of six ANN iterations in the case of the network efficiency R2 and RMSE. For ranking the achieved outcomes from ANN iterations, two distinct ranking systems of total ranking and also color intensity are utilized. The proposed model number 14 with the total ranking value of 28 should be selected as the best-constructed model according to the mean network performance from a total of 84 ANN built networks, and the testing and training datasets (i.e., that is after six iterations). However, we have gained better network performance results after analyzing whole network efficiency (as shown in Figure 8 and Figure 9) with eight hidden neurons. This proves that the final structure of ANN that is designated for this approach should have a structure of 14×8×1, however searching for the trivial change in the accuracy and the network efficiency (in the case of the training and testing databases as shown in Figure 8 and Figure 9), for the pre-introduced node number in a single structure of hidden layer the optimized amount was designated to be eight. This is also a simplification that is provided for the proposed model to be more practical.

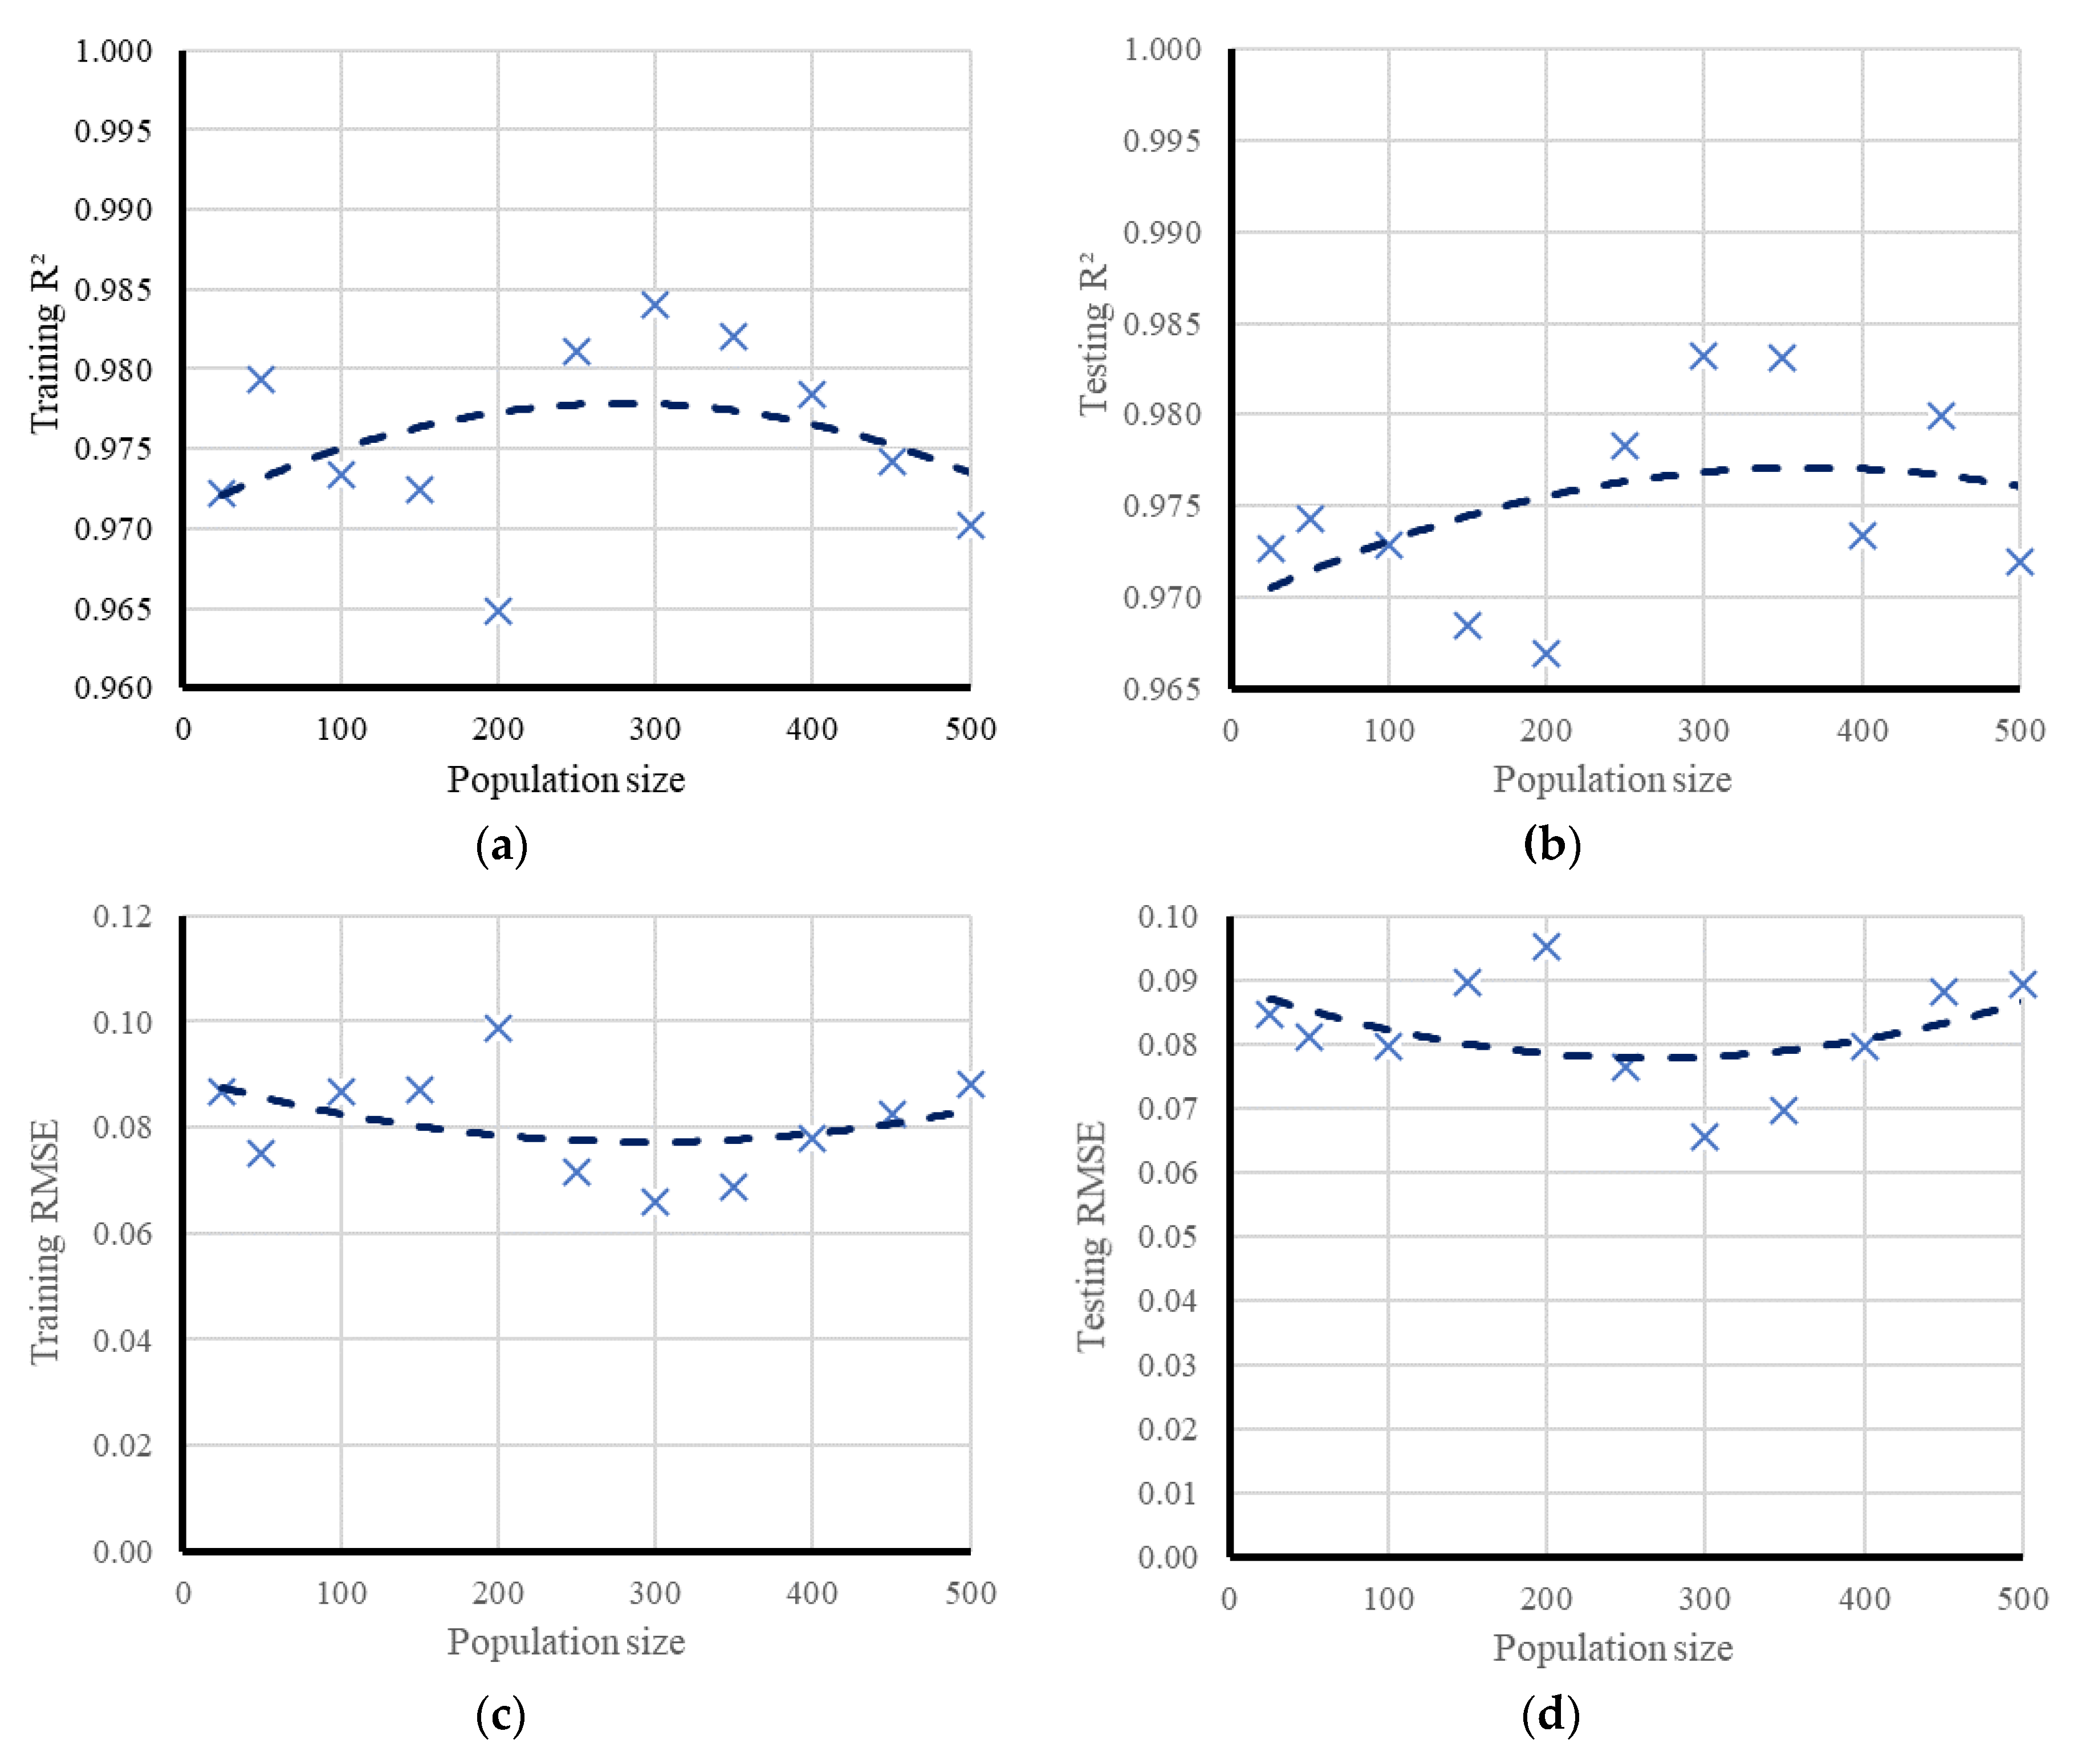
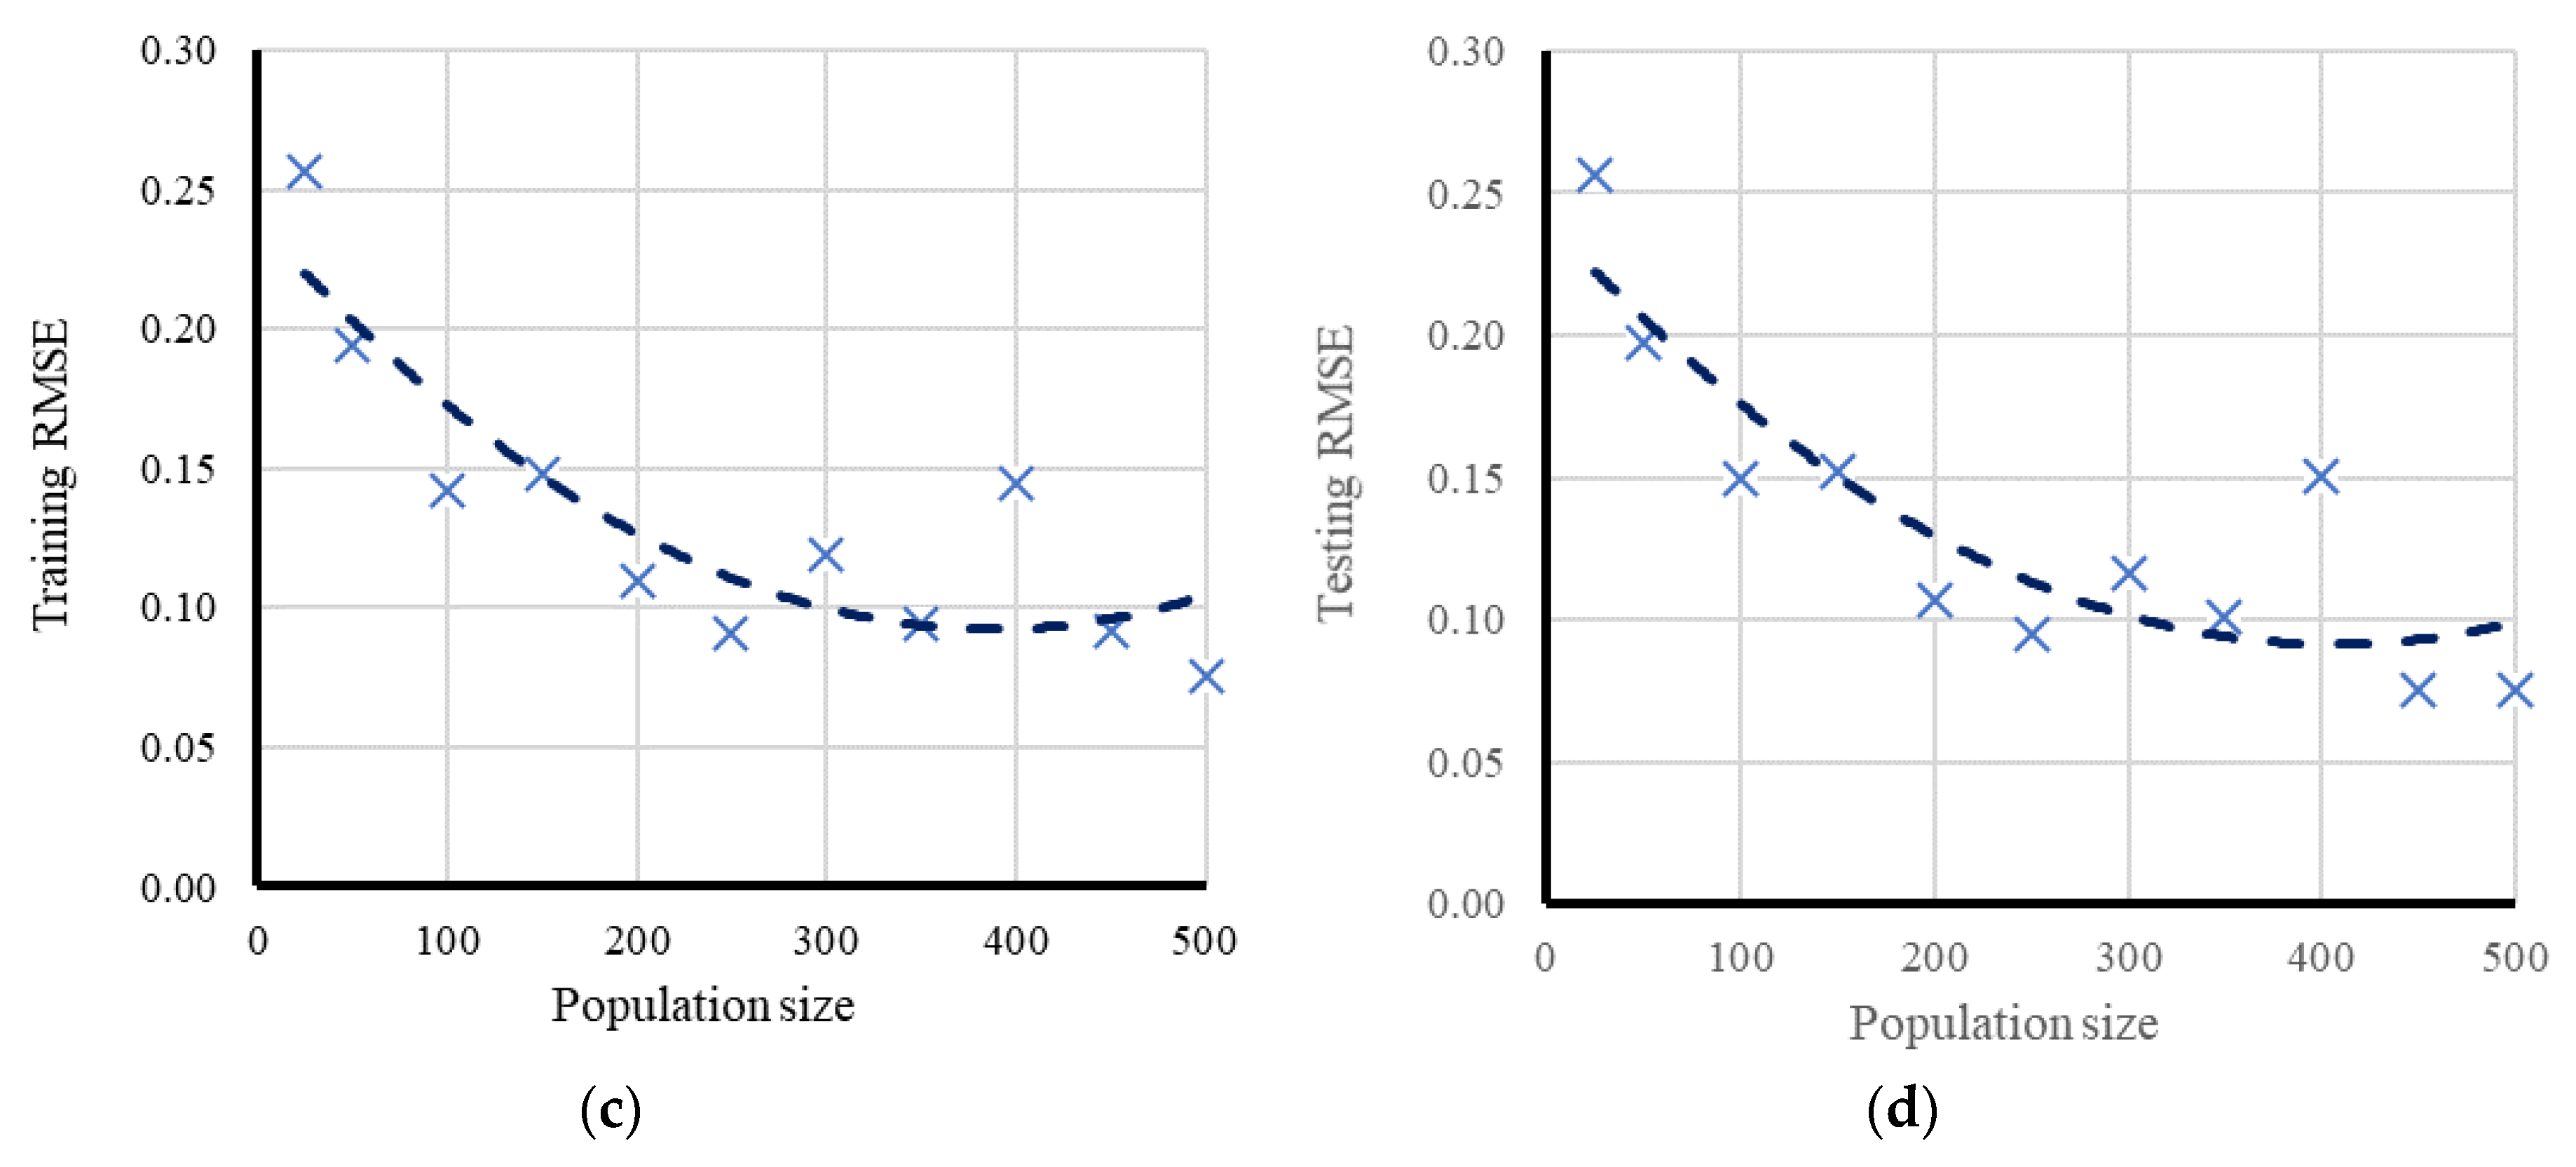
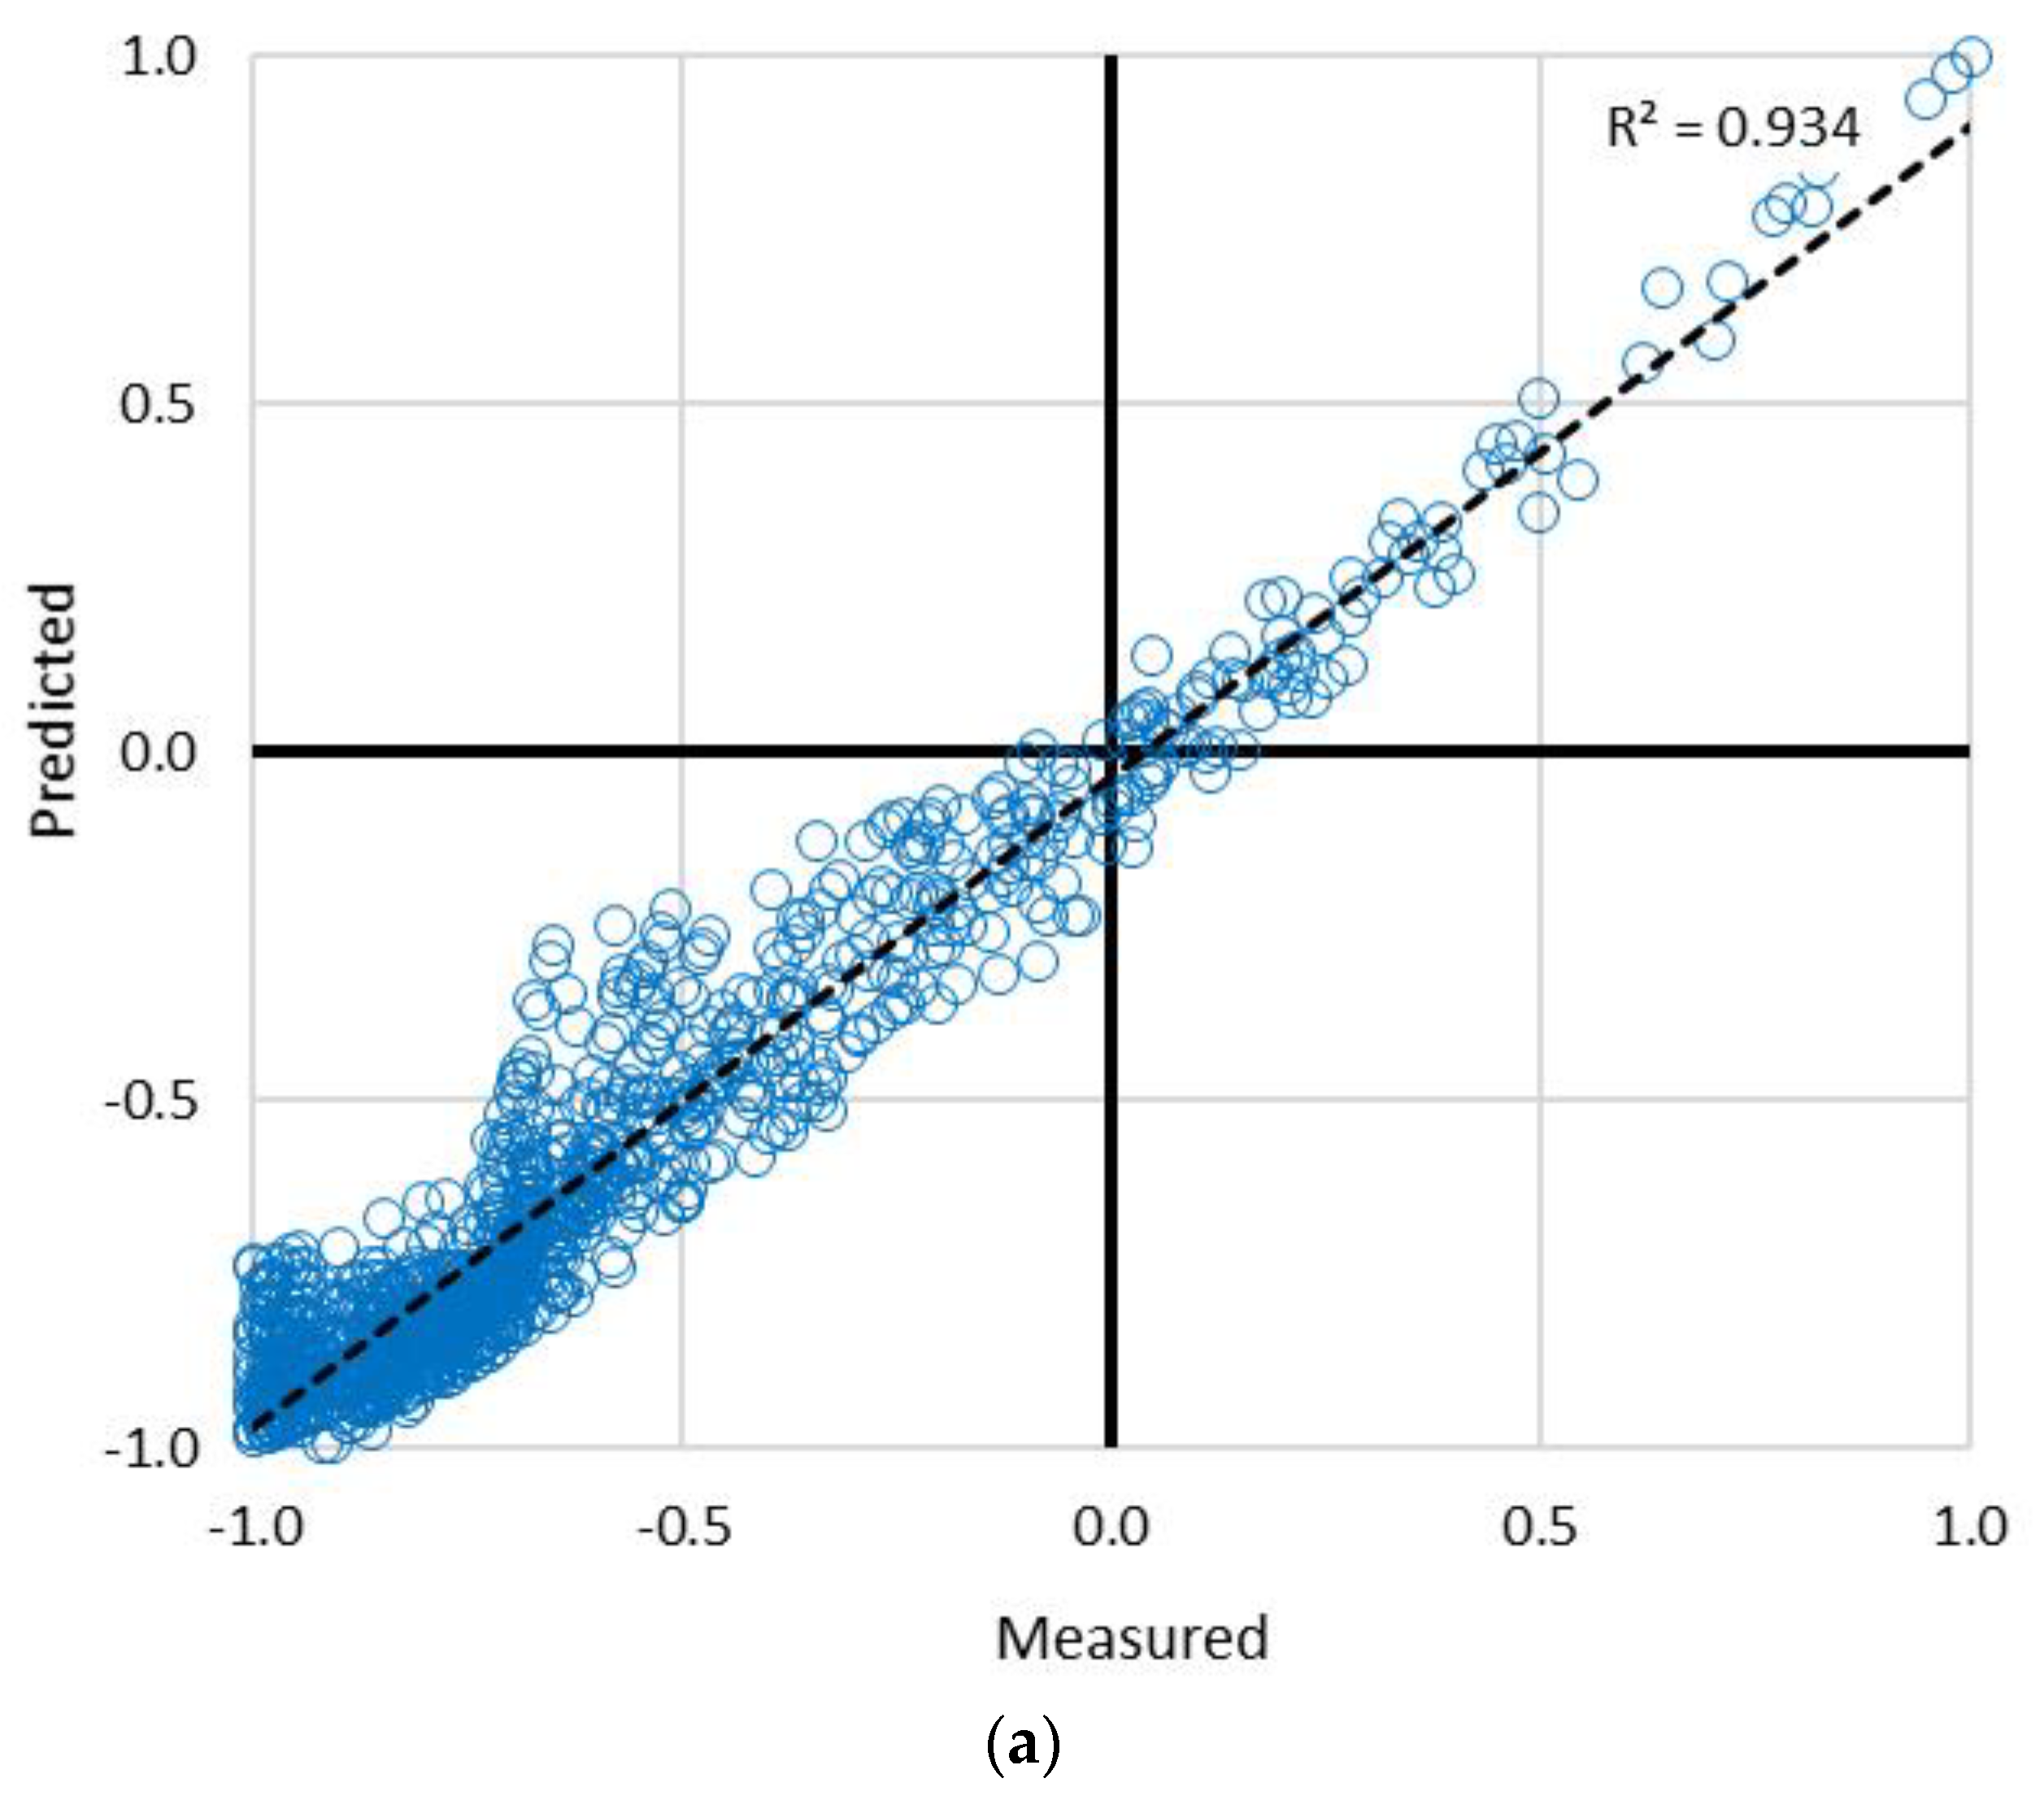
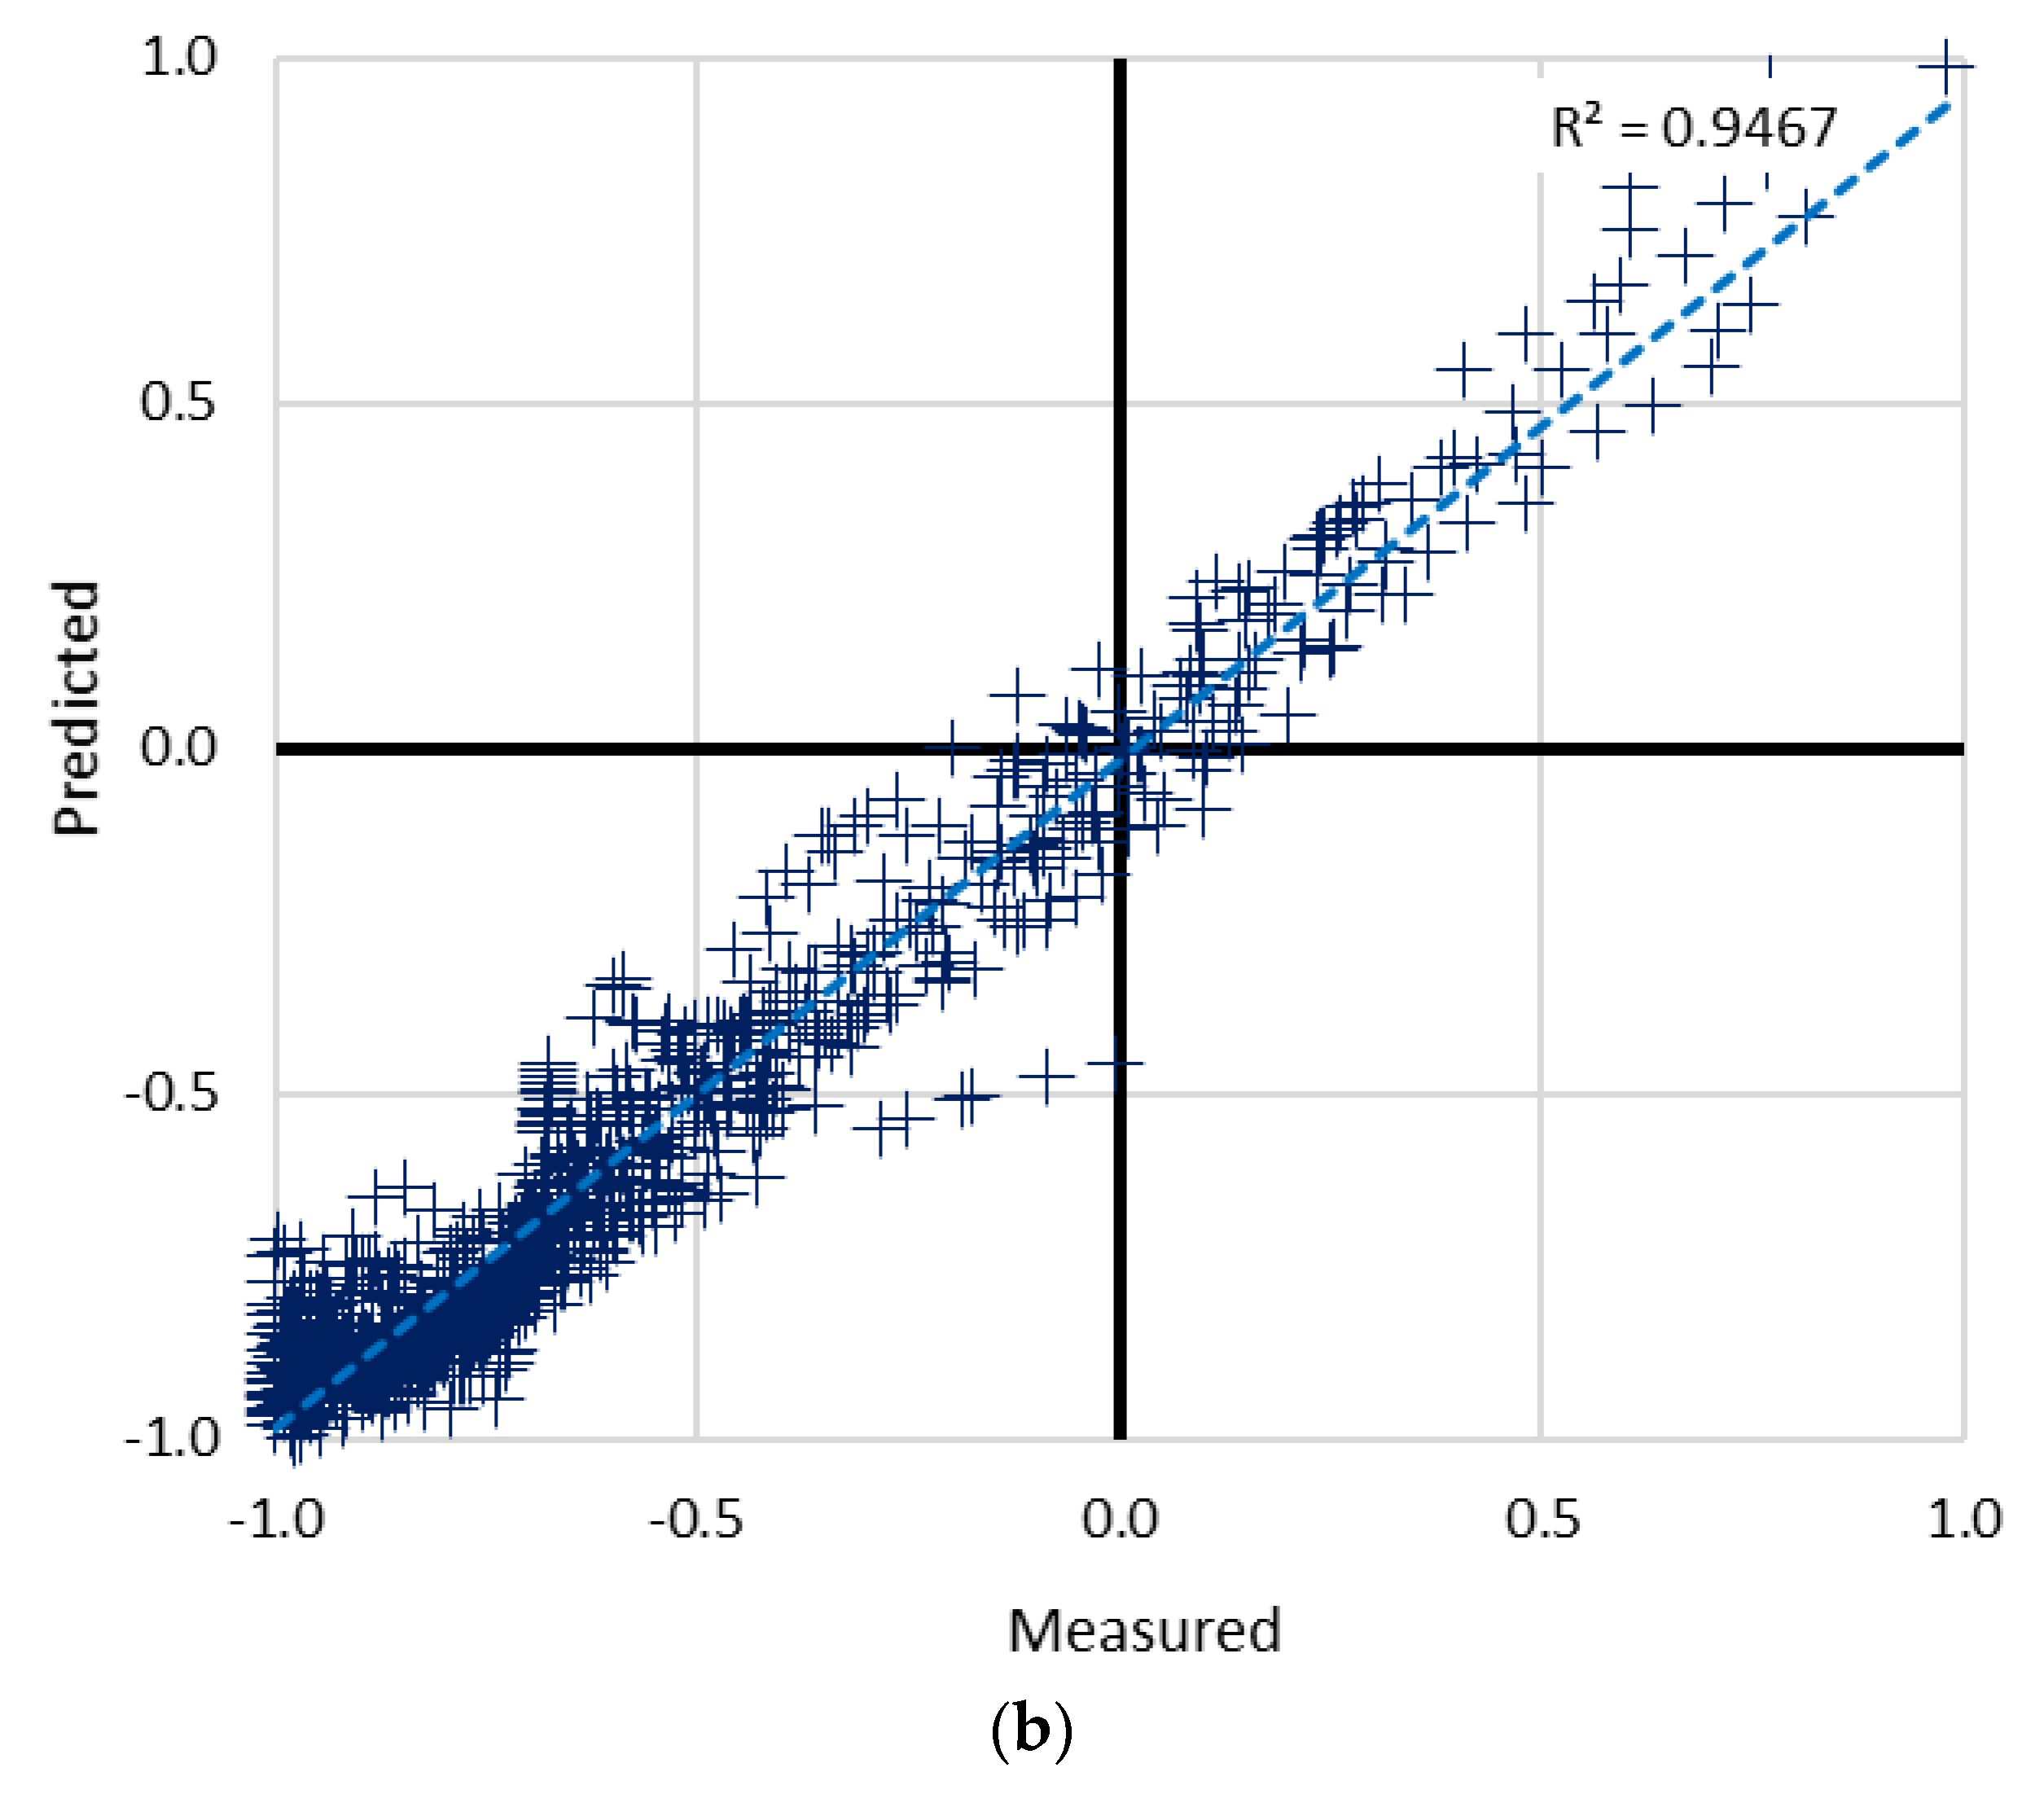
4.2. Hybrid PSO–ANN and ICA–ANN Models in Predicting Fult

Two-hybrid models of ICA–ANN and also PSO–ANN are employed to choose the most suitable predictive model among them. Therefore, to discover optimum factors in both models, many parametric studies are done. The optimal state of ANN model needs to be indicated, prior to running a parametric investigation for hybrid model factors. Parametric investigation of ANN model was performed considering a series of trial and error process (discussed in Section 4.1), and it was found that an ANN model with eight hidden neurons (or architecture of 12 × 8 × 1) received better performances. Hence, the obtained architecture was confirmed and used to both hybrid intelligent systems (e.g., ICA-ANN and PSO-ANN).
As previously mentioned, in order to determine the most appropriate structure of the hybrid model of PSO-ANN, there is a need for a parametric investigation according to the trial and error process. Numerous parameters such as coefficients of velocity relation (C1 and C2), inertia weight and the number of iterations, and the number of existing particles can considerably affect network efficiency of the PSO approach. Many scholars suggested that, for providing an acceptable network performance, C1 and C2 equal to 2 as well as inertia weight (iw) of 0.25 is proper. Different models of PSO are generated by distinct amounts of swarm size (i.e., 25, 50, 75, 100, 150, 200, 250, 300, 350, 400, 450, and 500) to indicate the appropriate particle size/swarm population (with Iw = 0.25 as well as C1 and C2 equal to 2). When 400 is the number of swarm size, the best efficiency is obtained. For the training and testing datasets, the R2 and RMSE are (0.9607 and 0.076) and (0.978, and 0.075), respectively. Figure 10a shows the performance result variation; for example, MSE utilized here, of PSO–ANN models that have different various population sizes. As observed, the model that has swarm sizes equal to 400 indicates the least RMSE, which demonstrates its advantage in comparison to other approaches. For selecting appropriate values for C1 and C2, a similar trial and error approach is used. In this regard, by distinct C1 and C2, around 12 models are designed, and then their efficiencies are according to total ranking and CER approaches. The most appropriate efficiencies with the total value of 69 obtained when C1 and C2 were (1.33 and 0.67) or (1.5 and 1.5), respectively. For the testing datasets, the R2, and RMSE are 0.9607, and 0.076, respectively. Finally, five approaches are provided by Iw (0.2, 0.4, 0.6, 0.8, and 1.0) to choose an appropriate amount for the Iw. For the IW, achieved total rank of 0.2, 0.4, 0.6, 0.8, and 1.0 are 28, 12, 18, 6, and 26, respectively. It demonstrates the advantage of the PSO–ANN approach with Iw of 0.2.
In order to take the most appropriate predictive result from the ICA–ANN hybrid approach, optimizing its influential factors is an important concern. In order to employ the best approach, two distinct ranking methods (CER and total ranking [49]) are used. Similar to the first parametric study process performed, e.g., in selecting proper ANN architecture and PSO–ANN model, this has also been obtained considering a series of trial and error progress. As stated earlier, in ICA, number of the country (Nc), number of the decade (Nd), and number of imperialists (Ni) are recommended as the most influential parameters on ICA performance. In order to determine the proper Nc, several designs are created by distinct amounts of Nc (25, 50, 75, 100, 150, 200, 250, 300, 350, 400, 450, and 500). For these models, Ni = 5 and Nd = 200 were utilized. As a result, with the total rank of 68, Nc = 300 can provide a higher efficiency system capacity. Then, for applying the best amount for Ni, 12 models with Ni values of 5, 10, 15, 20, 25, 30, 35, 40, 45, 50, 55, and 60 were constructed and assessed using R2 and RMSE. The results show that all three statistical indexes are not changed for the Ni more than 5. Therefore, Ni = 5 is considered the best value for the number of imperialists. Finally, the step of the ICA–ANN modelling, using the Ni = 5 and Nc = 300, several models of ICA were constructed considering the various number of Nd, i.e., 50, 100, 200, 300, 400, and 500 (results shown in Figure 10b). These models are also assessed according to their efficiency indexes (e.g., R2 and RMSE). It can be clearly seen that increasing the number of nodes causes more convergence between the predicted network and measured outputs. According to the obtained result, the model with Nd = 300 was the best value, among others.
The results of network performance varied vs. population size for both of the ICA–ANN and PSO–ANN approaches are shown in Figure 11 and Figure 12, respectively.
Training and testing outcomes of employed models, i.e., ANN, ICA–ANN, and PSO–ANN in predicting Fult according to their R2, are presented in Figure 13, Figure 14 and Figure 15, respectively.

5. Conclusions

In the present paper, outputs of a total of 3513 FEM simulations are found to calculate the applicability of the used method. We found that the learning approach is acceptable in term of whole selected predictive models. According to the outcomes, the hybrid PSO–ANN model, which is a combination of ANN optimal with PSO, showed a proper and also more trustworthy ANN model, however, for prediction tasks, whole suggested models have proper results in the case of estimation bearing capacity of shallow circular footing systems. In comparison to the other two methods, the PSO–ANN algorithm had a higher performance for training and testing sets in terms of all statistical indexes like RMSE and R2. It can be observed, clearly, from the high-performance outcomes of the training network. Amounts of (0.979 and 0.076) and (0.978 and 0.0750) are obtained according to R2 and RMSE, respectively, for training and testing databases of the optimal PSO–ANN predictive models. In the same way, in ICA–ANN, the training and testing datasets are (0.984 and 0.066) and (0.983, and 0.066), respectively, based on the R2 and RMSE. It proved the superiority of the PSO–ANN method in the case of prediction of Fult.

Author Contributions

H.M., and D.T.B. performed experiments and field data collection; H.M. and A.D. wrote the manuscript; L.K.F. and B.K. discussed and analyzed the data.

Funding

This work was financially supported by Ton Duc Thang University and University of South-East Norway.

Conflicts of Interest

The authors declare no conflict of interest.

References

  1. Asadi, A.; Moayedi, H.; Huat, B.B.; Parsaie, A.; Taha, M.R. Artificial neural networks approach for electrochemical resistivity of highly organic soil. Int. J. Electrochem. Sci 2011, 6, 1135–1145. [Google Scholar]
  2. Alrashed, A.A.A.A.; Karimipour, A.; Bagherzadeh, S.A.; Safaei, M.R.; Afrand, M. Electro- and thermophysical properties of water-based nanofluids containing copper ferrite nanoparticles coated with silica: Experimental data, modeling through enhanced ANN and curve fitting. Int. J. Heat Mass Transf. 2018, 127, 925–935. [Google Scholar] [CrossRef]
  3. Mojaddadi, H.; Pradhan, B.; Nampak, H.; Ahmad, N.; Ghazali, A.H.B. Ensemble machine-learning-based geospatial approach for flood risk assessment using multi-sensor remote-sensing data and GIS. Geomat. Nat. Hazards Risk 2017, 8, 1080–1102. [Google Scholar] [CrossRef] [Green Version]
  4. Azeez, O.S.; Pradhan, B.; Shafri, H.Z.; Shukla, N.; Lee, C.-W.; Rizeei, H.M. Modeling of CO emissions from traffic vehicles using artificial neural networks. Appl. Sci. 2019, 9, 313. [Google Scholar] [CrossRef]
  5. Bowles, J.E. Foundation Analysis and Design; McGraw-hill: New York, NY, USA, 1996. [Google Scholar]
  6. Nazir, R.; Moayedi, H. Soil Mass Loss Reduction during Rainfalls by Reinforcing the Slopes with the Surficial Confinement. World Acad. of Sci., Eng. Technol., Int. J. of Environ., Ecol., Geomat., Earth Sci. Eng. 2014, 8, 331–334. [Google Scholar]
  7. Nazir, R.; Ghareh, S.; Mosallanezhad, M.; Moayedi, H. The influence of rainfall intensity on soil loss mass from cellular confined slopes. Measurement 2016, 81, 13–25. [Google Scholar] [CrossRef]
  8. Bui, D.T.; Moayedi, H.; Gör, M.; Jaafari, A.; Foong, L.K. Predicting slope stability failure through machine learning paradigms. Isprs Int. Geo-Inf. 2019, 8, 395. [Google Scholar] [CrossRef]
  9. Moayedi, H.; Bui, D.T.; Gör, M.; Pradhan, B.; Jaafari, A. The feasibility of three prediction techniques of the artificial neural network, adaptive neuro-fuzzy inference system, and hybrid particle swarm optimization for assessing the safety factor of cohesive slopes. Isprs Int. Geo-Inf. 2019, 8, 391. [Google Scholar] [CrossRef]
  10. Meyerhof, G.G.; Hanna, A.M. Ultimate bearing capacity of foundations on layered soils under inclined load. Can. Geotech J. 1978, 15, 565–572. [Google Scholar] [CrossRef]
  11. Niroumand, H.; Kassim, K.A.; Nazir, R.; Faizi, K.; Adhami, B.; Moayedi, H.; Loon, W. Slope stability and sheet pile and contiguous bored pile walls. Electron. J. Geotech. Eng. 2012, 17, 19–27. [Google Scholar]
  12. Chakraborty, A.; Goswami, D. Prediction of slope stability using multiple linear regression (MLR) and artificial neural network (ANN). Arab. J. Geosci. 2017, 10, 11. [Google Scholar] [CrossRef]
  13. Nguyen, H.; Moayedi, H.; Foong, L.K.; Al Najjar, H.A.H.; Jusoh, W.A.W.; Rashid, A.S.A.; Jamali, J. Optimizing ANN models with PSO for predicting short building seismic response. Eng. Comput. 2019, 35, 1–15. [Google Scholar] [CrossRef]
  14. Moayedi, H.; Moatamediyan, A.; Nguyen, H.; Bui, X.-N.; Bui, D.T.; Rashid, A.S.A. Prediction of ultimate bearing capacity through various novel evolutionary and neural network models. Eng. Comput. 2019, 35, 1–17. [Google Scholar] [CrossRef]
  15. Rashid, A.S.A.; Kalatehjari, R.; Noor, N.M.; Yaacob, H.; Moayedi, H.; Sing, L.K. Relationship between liquidity index and stabilized strength of local subgrade materials in a tropical area. Measurement 2014, 55, 231–237. [Google Scholar] [CrossRef]
  16. Moayedi, H.; Mosallanezhad, M.; Nazir, R. Evaluation of Maintained Load Test (MLT) and Pile Driving Analyzer (PDA) in Measuring Bearing Capacity of Driven Reinforced Concrete Piles. Soil Mech. Found. Eng. 2017, 54, 150–154. [Google Scholar] [CrossRef]
  17. Moayedi, H.; Nazir, R.; Ghareh, S.; Sobhanmanesh, A.; Tan, Y.C. Performance Analysis of a Piled Raft Foundation System of Varying Pile Lengths in Controlling Angular Distortion. Soil Mech. Found. Eng. 2018, 55, 265–269. [Google Scholar] [CrossRef]
  18. Momeni, E.; Armaghani, D.J.; Fatemi, S.A.; Nazir, R. Prediction of bearing capacity of thin-walled foundation: A simulation approach. Eng. Comput. 2018, 34, 319–327. [Google Scholar] [CrossRef]
  19. Ranjan, G.; Rao, A.S.R. Basic and Applied Soil Mechanics; New Age International: Kerala, India, 2007. [Google Scholar]
  20. Das, B.M. Principles of Foundation Engineering, 8th ed.; McGraw-Hill Book Co.: Singapore, 2008. [Google Scholar]
  21. Moayedi, H.; Hayati, S. Modelling and optimization of ultimate bearing capacity of strip footing near a slope by soft computing methods. Appl. Soft Comput. 2018, 66, 208–219. [Google Scholar] [CrossRef]
  22. Haghbin, M. Bearing Capacity of Strip Footings Resting on Granular Soil Overlying Soft Clay. Int. J. Civ. Eng. 2016, 14, 467–477. [Google Scholar] [CrossRef]
  23. Lotfizadeh, M.R.; Kamalian, M. Estimating Bearing Capacity of Strip Footings over Two-Layered Sandy Soils Using the Characteristic Lines Method. Int. J. Civ. Eng. 2016, 14, 107–116. [Google Scholar] [CrossRef]
  24. Ahmadi, M.M.; Kouchaki, B.M. New and Simple Equations for Ultimate Bearing Capacity of Strip Footings on Two-Layered Clays: Numerical study. Int. J. Geomech. 2016, 16, 11. [Google Scholar] [CrossRef]
  25. McCulloch, W.; Pitts, W. A logical calculus of the ideas immanent in nervous activity. Bull. Math. Biophys. 1943, 5, 115–133. [Google Scholar] [CrossRef]
  26. Hebb, D. The Organization of Behavior: A Neurophysiological Approach; Wiley: Hoboken, NJ, USA, 1949. [Google Scholar]
  27. Binh Thai, P.; Prakash, I.; Dieu Tien, B. Spatial prediction of landslides using a hybrid machine learning approach based on Random Subspace and Classification and Regression Trees. Geomorphology 2018, 303, 256–270. [Google Scholar]
  28. Dieu Tien, B.; Viet-Ha, N.; Nhat-Duc, H. Prediction of soil compression coefficient for urban housing project using novel integration machine learning approach of swarm intelligence and Multi-layer Perceptron Neural Network. Adv. Eng. Inform. 2018, 38, 593–604. [Google Scholar] [CrossRef]
  29. Sharma, L.K.; Singh, R.; Umrao, R.K.; Sharma, K.M.; Singh, T.N. Evaluating the modulus of elasticity of soil using soft computing system. Eng. Comput. 2017, 33, 497–507. [Google Scholar] [CrossRef]
  30. Shahri, A.A. An Optimized Artificial Neural Network Structure to Predict Clay Sensitivity in a High Landslide Prone Area Using Piezocone Penetration Test (CPTu) Data: A Case Study in Southwest of Sweden. Geotech. Geol. Eng. 2016, 34, 745–758. [Google Scholar] [CrossRef]
  31. Saghatforoush, A.; Monjezi, M.; Faradonbeh, R.S.; Armaghani, D.J. Combination of neural network and ant colony optimization algorithms for prediction and optimization of flyrock and back-break induced by blasting. Eng. Comput. 2016, 32, 255–266. [Google Scholar] [CrossRef]
  32. Gao, W.; Wu, H.; Siddiqui, M.K.; Baig, A.Q. Study of biological networks using graph theory. Saudi J. Biol. Sci. 2018, 25, 1212–1219. [Google Scholar] [CrossRef]
  33. Gao, W.; Guirao, J.L.G.; Basavanagoud, B.; Wu, J. Partial multi-dividing ontology learning algorithm. Inf. Sci. 2018, 467, 35–58. [Google Scholar] [CrossRef]
  34. Gao, W.; Wang, W.; Dimitrov, D.; Wang, Y. Nano properties analysis via fourth multiplicative ABC indicator calculating. Arab. J. Chem. 2018, 11, 793–801. [Google Scholar] [CrossRef]
  35. Gao, W.; Guirao, J.L.G.; Abdel-Aty, M.; Xi, W. An independent set degree condition for fractional critical deleted graphs. Discret. Contin. Dyn. Syst. -S 2019, 12, 877–886. [Google Scholar] [CrossRef] [Green Version]
  36. Nguyen, H.; Bui, X.-N.; Bui, H.-B.; Mai, N.-L. A comparative study of artificial neural networks in predicting blast-induced air-blast overpressure at Deo Nai open-pit coal mine, Vietnam. Neural Comput. Appl. 2018, 1–17. [Google Scholar] [CrossRef]
  37. Bui, X.-N.; Nguyen, H.; Le, H.-A.; Bui, H.-B.; Do, N.-H. Prediction of Blast-induced Air Over-pressure in Open-Pit Mine: Assessment of Different Artificial Intelligence Techniques. Nat. Resour. Res. 2019, 1–21. [Google Scholar] [CrossRef]
  38. Nguyen, H.; Bui, X.-N.; Tran, Q.-H.; Mai, N.-L. A new soft computing model for estimating and controlling blast-produced ground vibration based on hierarchical K-means clustering and cubist algorithms. Appl. Soft Comput. 2019, 77, 376–386. [Google Scholar] [CrossRef]
  39. Eberhart, R.; Kennedy, J. A new optimizer using particle swarm theory. In Micro Machine and Human Science, Proceedings of the Sixth International Symposium on Micro Machine and Human Science, 1995; IEEE: Nagoya, Japan, 1995; pp. 39–43. [Google Scholar]
  40. Huang, C.-L.; Dun, J.-F. A distributed PSO–SVM hybrid system with feature selection and parameter optimization. Appl. Soft Comput. 2008, 8, 1381–1391. [Google Scholar] [CrossRef]
  41. Wan, S.; Yen, J.Y.; Lin, C.Y.; Chou, T.Y. Construction of knowledge-based spatial decision support system for landslide mapping using fuzzy clustering and KPSO analysis. Arab. J. Geosci. 2015, 8, 1041–1055. [Google Scholar] [CrossRef]
  42. Zhang, X.; Nguyen, H.; Bui, X.; Tran, Q.; Nguyen, D.; Bui, D.; Moayedi, H. Novel Soft Computing Model for Predicting Blast-Induced Ground Vibration in Open-Pit Mines Based on Particle Swarm Optimization and XGBoost. Nat. Resour. Res. 2019, 28, 1–11. [Google Scholar] [CrossRef]
  43. Yuan, C.; Moayedi, H. Evaluation and comparison of the advanced metaheuristic and conventional machine learning methods for prediction of landslide occurrence. Eng. Comput. 2019, 36, 1–11. [Google Scholar] [CrossRef]
  44. Yuan, C.; Moayedi, H. The performance of six neural-evolutionary classification techniques combined with multi-layer perception in two-layered cohesive slope stability analysis and failure recognition. Eng. Comput. 2019, 36, 1–10. [Google Scholar] [CrossRef]
  45. Xi, W.; Li, G.; Moayedi, H.; Nguyen., H. A particle-based optimization of artificial neural network for earthquake-induced landslide assessment in Ludian county, China. Geomat. Nat. Hazards Risk 2019, 10, 1750–1771. [Google Scholar] [CrossRef] [Green Version]
  46. Moayedi, H.; Mosallanezhad, M.; Mehrabi, M.; Safuan, A.R.A.; Biswajeet, P. Modification of landslide susceptibility mapping using optimized PSO-ANN technique. Eng. Comput. 2018, 35, 967–984. [Google Scholar] [CrossRef]
  47. Atashpaz-Gargari, E.; Lucas, C. Imperialist competitive algorithm: An algorithm for optimization inspired by imperialistic competition. In Proceedings of the CEC 2007. IEEE Congress on Evolutionary Computation, 2007; IEEE: Singapore; pp. 4661–4667.
  48. Mosallanezhad, M.; Moayedi, H. Developing hybrid artificial neural network model for predicting uplift resistance of screw piles. Arab. J. Geosci. 2017, 10, 479. [Google Scholar] [CrossRef]
  49. Moayedi, H.; Armaghani, D.J. Optimizing an ANN model with ICA for estimating bearing capacity of driven pile in cohesionless soil. Eng. Comput. 2017, 34, 347–356. [Google Scholar] [CrossRef]
  50. Mosallanezhad, M.; Moayedi, H. Comparison Analysis of Bearing Capacity Approaches for the Strip Footing on Layered Soils. Arab. J. Sci. Eng. 2017, 42, 3711–3722. [Google Scholar] [CrossRef]
  51. Hou, J.; Zhang, M.X.; Dai, Z.H.; Li, J.Z.; Zeng, F.F. Bearing capacity of strip foundations in horizontal-vertical reinforced soils. Geotext. Geomembr. 2017, 45, 29–34. [Google Scholar] [CrossRef]
  52. Anvari, S.M.; Shooshpasha, I. Influence of size of granulated rubber on bearing capacity of fine-grained sand. Arab. J. Geosci. 2016, 9, 707. [Google Scholar] [CrossRef]
  53. Noorzad, R.; Manavirad, E. Bearing capacity of two close strip footings on soft clay reinforced with geotextile. Arab. J. Geosci. 2014, 7, 623–639. [Google Scholar] [CrossRef]
  54. Gao, W.; Dimitrov, D.; Abdo, H. Tight independent set neighborhood union condition for fractional critical deleted graphs and ID deleted graphs. Discret. Contin. Dyn. Syst. -S 2018, 12, 711–721. [Google Scholar] [CrossRef]
Figure 1. Flowchart of the ANN model.
Applsci 09 04594 g001
Figure 2. The algorithm of particle swarm optimization (PSO) (after Moayedi, et al. [46]).
Applsci 09 04594 g002
Figure 3. The learning approach of PSO–ANN.
Applsci 09 04594 g003
Figure 4. Imperialist competition algorithm main procedure to take possession of a weaker colony.
Applsci 09 04594 g004
Figure 5. The flowchart of the ICA process (after Moayedi and Armaghani [49]).
Applsci 09 04594 g005
Figure 6. A summary of the range of input information vs. soil type, (a) Dilation angle, (b) Unit weight, (c), Internal friction angle, (d) Elastic modulus, (e) Poisson’s ratio
Applsci 09 04594 g006aApplsci 09 04594 g006b
Figure 7. A schematic view of the finite element modeling employed for the current study
Applsci 09 04594 g007
Figure 8. Variation of R2 vs. the number of nodes in the estimation of Fult.; (a) Training R2; (b) Testing R2.
Applsci 09 04594 g008
Figure 9. Variation of root mean square error (RMSE) vs. the number of nodes in the estimation of Fult., (a) Training RMSE, (b) Testing RMSE
Applsci 09 04594 g009
Figure 10. The results of proposed models’ performances with various population sizes; (a) PSO–ANN, (b) ICA­–ANN.
Applsci 09 04594 g010
Figure 11. The results of network performance for the ICA–ANN vs. population size, (a) training R2, (b) testing R2, (c) training RMSE, (d) testing RMSE.
Applsci 09 04594 g011
Figure 12. The results of network performance for the PSO–ANN vs. population size, (a) training R2, (b) testing R2, (c) training RMSE, (d) testing RMSE.
Applsci 09 04594 g012aApplsci 09 04594 g012b
Figure 13. Training and testing outcomes form ANN model in estimating Fult (e.g., with eight nodes). (a) ANN-training dataset, (b) ANN-testing dataset
Applsci 09 04594 g013aApplsci 09 04594 g013b
Figure 14. Training and testing outcomes form PSO–ANN model in estimating Fult.; (a) PSO-ANN-training dataset, (b) PSO-ANN-testing dataset
Applsci 09 04594 g014aApplsci 09 04594 g014b
Figure 15. Training and testing outcomes form ICA–ANN model in estimating Fult.; (a) ICA-ANN-training dataset, (b) ICA-ANN-testing dataset
Applsci 09 04594 g015aApplsci 09 04594 g015b
Table 1. FEM plan used for the input layers’ preparation.
Ground ConditionsFoundation Diameter (B) (m)(Upper Layer Thickness/Foundation Width) or h/B
Soil layer S1 on soil layer (S2, S3, S4, S5, S6, S7, S8)1.00, 0.2, 0.4, 0.8, 1.0,
Soil layer S8 on soil layer (S1, S2, S3, S4, S5, S6, S7)
Table 2. Instance of input and also output datasets employed for simulating purpose in the estimation of Fult.
ModelInputsOutput
Top Layer PropertiesBottom Layer Properties
φ t o p ψ t o p γ t o p   E t o p υ t o p φ b o t ψ b o t γ b o t E b o t υ b o t h/BSettlementFult
(deg)(deg)kN/m3kPa-(deg)(deg)kN/m3kPa--mmkPa
1303.419175000.333335.819.9250000.3130.230.362297.789
2303.419175000.3334211.521.1650000.2490.230.358641.312
34211.521.1650000.24936820.5350000.2910.630.324819.291
4303.419175000.333346.420.1275000.306130.279229.515
54211.521.1650000.24936820.5350000.2910.230.264645.802
64211.521.1650000.249314.219.3200000.3270.230.257351.505
74211.521.1650000.249346.420.1275000.3060.630.175674.178
84211.521.1650000.249391020.9500000.270.230.112932.268
94211.521.1650000.249391020.9500000.270.830.0711096.348
10303.419175000.333378.820.7400000.2850.230.050439.321
114211.521.1650000.24936820.5350000.2910.430.041739.102
124211.521.1650000.249378.820.7400000.2850.230.040735.445
134211.521.1650000.249303.419175000.3330.230.005307.149
14303.419175000.33336820.5350000.2910.429.973292.666
154211.521.1650000.249346.420.1275000.306129.972823.612
164211.521.1650000.249335.819.9250000.3130.829.949692.368
17303.419175000.333346.420.1275000.3060.229.942324.735
18303.419175000.33336820.5350000.2910.629.940249.580
19303.419175000.3334211.521.1650000.2490.629.934251.650
204211.521.1650000.249391020.9500000.270.629.9041054.378
214211.521.1650000.249378.820.7400000.2850.629.884896.035
224211.521.1650000.249391020.9500000.27129.8561124.575
234211.521.1650000.249346.420.1275000.3060.829.831742.268
24303.419175000.333314.219.3200000.327129.829220.100
25303.419175000.333314.219.3200000.3270.629.817225.296
26303.419175000.333314.219.3200000.3270.829.801221.703
274211.521.1650000.249335.819.9250000.3130.429.784533.911
284211.521.1650000.249346.420.1275000.3060.229.771497.129
29303.419175000.333378.820.7400000.2850.829.709239.304
30303.419175000.333314.219.3200000.3270.429.701230.895

