Article

Computational Analysis of Deep Visual Data for Quantifying Facial Expression Production

1
Institute of Applied Sciences and Intelligent Systems, National Research Council, 73100 Lecce, Italy
2
Department of History, Society and Human Studies, Università del Salento, 73100 Lecce, Italy
3
Lab of Applied Psychology and Intervention, Università del Salento, 73100 Lecce Le, Italy
*
Author to whom correspondence should be addressed.
Appl. Sci. 2019, 9(21), 4542; https://doi.org/10.3390/app9214542
Submission received: 9 September 2019 / Revised: 14 October 2019 / Accepted: 22 October 2019 / Published: 25 October 2019
(This article belongs to the Special Issue Home Ambient Intelligent System)

Abstract

:
The computational analysis of facial expressions is an emerging research topic that could overcome the limitations of human perception and get quick and objective outcomes in the assessment of neurodevelopmental disorders (e.g., Autism Spectrum Disorders, ASD). Unfortunately, there have been only a few attempts to quantify facial expression production and most of the scientific literature aims at the easier task of recognizing if either a facial expression is present or not. Some attempts to face this challenging task exist but they do not provide a comprehensive study based on the comparison between human and automatic outcomes in quantifying children’s ability to produce basic emotions. Furthermore, these works do not exploit the latest solutions in computer vision and machine learning. Finally, they generally focus only on a homogeneous (in terms of cognitive capabilities) group of individuals. To fill this gap, in this paper some advanced computer vision and machine learning strategies are integrated into a framework aimed to computationally analyze how both ASD and typically developing children produce facial expressions. The framework locates and tracks a number of landmarks (virtual electromyography sensors) with the aim of monitoring facial muscle movements involved in facial expression production. The output of these virtual sensors is then fused to model the individual ability to produce facial expressions. Gathered computational outcomes have been correlated with the evaluation provided by psychologists and evidence has been given that shows how the proposed framework could be effectively exploited to deeply analyze the emotional competence of ASD children to produce facial expressions.

1. Introduction

Computational quantification of neurodevelopmental disorders is one of the most attractive research areas [1] since it overcomes limitations of human perception and it also allows caregivers to get quick and objective outcomes [2]. Invasive tools are the most explored method so far to accomplish this challenging task. Unfortunately, they require acceptance and collaborative behaviors during calibration. Moreover, they have no negligible costs and caregivers have to be trained to properly use them. Besides, the gathered data are conditioned by the bias introduced by the presence of the tools. On the one hand, high costs make their pervasive use economically unsustainable for most private and public organizations and, on the other hand, their effectiveness in the assessment of neurodevelopmental disorders is controversial. This is even truer in the case of Autism Spectrum Disorders (ASD) [3], particularly in the case of treatment of children. Accurate evaluation, using non-invasive tools, is becoming a primary need, also considering the increase of ASD prevalence (1/59) [4] in the general population. In particular, since it is well known that ASD children show a clear deficit in the quality of facial expression production compared to typically developing ones [5,6], some computer vision and machine learning techniques can be successfully implemented to automatically assess emotional skills in a not invasive and accurate way [7] and, finally, to give an automatic assessment of autism spectrum disorders. Unfortunately, to the best of our knowledge, there are no works exploiting the aforementioned computational technologies to provide a comprehensive study carried out comparing psychologists and automatic outcomes to quantify children’s ability to produce basic emotions. Prior works mainly report qualitative assessment (ASD vs. non-ASD behavioral features) or just rough quantitative assessments (e.g., smiling/not smiling). A pioneering approach towards this challenging research line was the one in [8]: it introduced an algorithmic pipeline able to analyze facial dynamics using a continuously updated and personalized reference model, differently from the plethora of approaches in the literature that lies on predefined facial models. Unfortunately, that work had two main drawbacks: its outcomes were validated only on ASD children and, besides, it did not exploit the great potential of convolutional neural networks. This leads to an incomplete analysis of its potential in assessing ASD, to a sub-optimal correlation between numerical outcomes and the strength of facial expressions and, last but not least, to collect unreliable outcomes especially in the cases of non-frontal head pose and non-collaborative behaviors of children. To overcome the above limitations, in this paper, the pipeline in [8] has been improved by advanced computer vision and machine learning modules that rely on deep learning strategies. The updated pipeline, as proved in the experimental section carried out on both ASD and typically developing children, allows the framework to get numerical outcomes more correlated to the actual strength of the expression executions. Besides, it increases the system’s performance in terms of accuracy with respect to manual annotations provided by a team of psychologists. It is worth noting that, even if the pipeline relies on existing strategies, it combines them in a fruitful, and still unexplored, way in order to achieve the pursued application goal. The exploitation of the pipeline brought to a generalization of the knowledge by allowing to perform a deeper computational analysis of how children with ASD manifest their deficit in emotional competence, in particular, by comparing them to typically developing (TD henceforth) children 24-36 months old. Indeed, studies on emotional competence [9,10,11] considered this age range the crucial moment in which children start to develop the ability to name and recognize the facial expression of basic emotions (i.e., happiness, sadness, fear, and anger). Summing up, this paper has two levels of innovation: on the one side, it improves the pipeline in [8] by introducing deep learning strategies for face detection and facial landmark positioning. On the other side it extends the experimental evidence about the possibility of using the proposed pipeline to computationally analyze facial expressions also for typically developing children (in [8] only ASD children were involved). From the above, an important additional contribution derives: for the first time the computational outcomes on ASD and TD groups are compared and a discussion about the gathered outcomes is provided from both technological and clinical sides.
The rest of the paper is organized as follows: in Section 2 related works achieving the automatic assessment of ASD behavioral cues are reported and discussed. In addition, a brief overview of the most recent computer vision techniques addressing facial expressions recognition is given. Then, in Section 3, the proposed pipeline is described whereas Section 4 describes method and participants. Section 5 reports experimental results on both ASD and TD children and it numerically compares gathered outcomes. Subsequently, Section 6 reports and discusses a performance comparison, on the same set of data, with some leading approaches in the literature. Section 7 reports instead a discussion about clinical evidence emerged from experimental outcomes and, finally, Section 8 concludes the paper, giving an explanation of how the proposed framework could be exploited in the clinical treatment to improve emotional competence’s evaluation of ASD children. It gives also a sight of possible future works.

2. Related Work

This section firstly discusses some works dealing with the exploitation of computer vision and machine learning techniques to assess behavioral cues in ASD children. Subsequently, a brief overview of the most recent computer vision techniques addressing facial expressions recognition is given. Concerning the assessment of ASD behavioral cues, computer vision and machine learning techniques have been effectively exploited in the last years to highlight signs that are considered early features of ASD [12]. Computer vision analysis measured participants’ attention and orienting in response to name calls in [13] whereas in [14] the head postural stability was evaluated while the children watched a series of dynamic movies involving different types of stimuli. Both works made use of an algorithm that detects and tracks 49 facial landmarks on the child’s face and estimates head pose angles relative to the camera by computing the optimal rotation parameters between the detected landmarks and a 3D canonical face model. In [15] a video segmentation approach was exploited to retrieve social interactions that happen in unstructured video collected during social games, such as a “peek-a-boo” or “patty cake,” that consist of repetitions of stylized, turn-taking interactions between a child and a caregiver or peer. More complex behaviors (i.e., sharing Interest, visual tracking and disengagement of attention) were analyzed in [16] by using a semiautomatic system relying on a dense motion estimator, multi-scale Histograms of Orientated Gradients (HOG) and Support Vector Machine. The authors assumed that, in the first frame, the bounding boxes of the left ear, left eye and nose are available and proposed a way to estimate yaw and pitch motion from images acquired in unstructured environments. Unfortunately, the relevant deficit of ASD children in recognizing and producing facial expressions (that is clinically considered a robust feature to evaluate ASD conditions) has not been deeply investigated by using automatic techniques. This is due to the fact that computational analysis of facial expressions in digital images is an emerging research topic: there are only a few attempts to quantify facial expression production [17] whereas most of the scientific productions aim at the easier task of evaluating the ability to recognize if either a facial expression is present or not [18]. Very recently, some pioneering studies introduced advanced approaches to get computational outcomes able to numerically prove only the differences in facial skills of ASD vs. TD children groups [19,20,21,22]. Other approaches focused instead on detecting early risk markers of ASD. An application of displaying movie stimuli on a mobile device which were expertly designed to capture the toddler’s attention and elicit behaviors relevant to early risk markers of ASD, including orienting to name call, social referencing, smiling while watching the movie stimuli, pointing, and social smiling was, for example, proposed in [23]. A rough assessment with respect to smiling/ not smiling labels provided by human raters was carried out. Authors in [24] presented an end-to-end system (based on the multi-task learning approach) for ASD classification using different facial attributes: facial expressions, Action units, arousal, and valence. High-level diagnostic labels (ASD or No-ASD) were used as a reference. Table 1 sums-up the most relevant prior works in the literature. For each work the involved computer vision tasks are indicated and, in the last column, the validation process put in place is mentioned. In particular, from the last column, it is possible to derive that works in [19,20,21,22] did not consider any quantitative evaluation but just a qualitative analysis of the outcomes to highlight the differences in affective abilities of ASD vs. TD groups.
The last row in Table 1 reports the work in [8] that has been the first attempt to introduce an algorithm pipeline to quantify affective abilities by analyzing facial traits. As already stated in Section 1, it had a major limitation consisting in the use of the handcrafted features and shallow learning strategies that are operational choices largely overcome by the recent literature on facial analysis. The recognition of facial expression can be achieved with high accuracy by learning robust and discriminative features from the data as proposed in [25] where deep sparse auto-encoders are established. A deep learning architecture, that includes convolutional and recurrent neural network layers, has been also proposed in [26] and it has been exploited for the estimation of emotional valence and arousal in-the-wild. An approach that combines automatic features learned by convolutional neural networks (CNN) and handcrafted features computed by the bag-of-visual-words (BOVW) model has been proposed in [27]. Similarly in [28], an improved expression recognition network that combines the improved Local Binary Patterns (LBP) features with deep convolution neural network facial features was designed. Facial expressions can be also modeled directly from image intensities using deep neural networks (i.e., without requiring or involving facial landmark detection) as proposed in [29]. Computational aspects have been addressed in [30] where a new Convolutional Neural Network (CNN) model, namely MobileNet, is proposed in order to compound accuracy and speed. Finally, even automatic recognition of micro-expressions has been effectively tackled by convolutional neural networks [31]. However, most of the aforementioned existing facial expression recognition methods work on static images. Unfortunately, their intrinsic nature makes them useless in a context where it is important to evaluate the facial dynamics following external elicitation stimuli or verbal requests to produce facial expressions. On the other hand, it is ineluctable that this kind of evaluation can benefit from the temporal correlations of consecutive frames in a sequence. In literature, there are some works that addressed this challenging problem: some of the simply aggregate outcomes on consecutive frames whereas more effective approaches learned spatio-temporal evolution in producing facial expressions. Although dynamic FER is known to have a higher recognition rate than static FER, it does suffer from a few drawbacks: the extracted dynamic features depend on the facial geometry, the different temporal transient from inexpressive face to emotion apex, the initial facial configuration that can trick the classifier by affecting temporal evolution of facial features. Very outstanding survey papers on this topic can be found in [32] and [33]. The above limitations are emphasized when the goal is to recognize and even to quantify facial expression in individuals with limited skills due to cognitive impairments (e.g., affected by ASD) or still under functional development (e.g., toddlers). Under those circumstances, classical FER approaches decrease their accuracy since their models are built on typically developed individuals and their generalization could be not trivial. Finally, it should also be pointed out that also outstanding papers that treat the expression intensity estimation as a regression problem [34] are not suited for the considered application context since they make use of a common (not personalized) reference model.

3. The Proposed Framework

The framework mainly consists of four algorithmic modules performing face detection, facial landmark detection and tracking, facial action unit intensity estimation and high-level semantic analysis that provides the computational quantification of the facial expressions. In Figure 1 the proposed algorithmic pipeline is schematized. It is worth noting that the figure points out, by the horizontal dotted line and the blocks differently colored, that the two modules above the line (face detection and facial landmark detection and tracking) are the ones heavily improved with regards to the former work in [8]. To be as clear as possible, the heavily changed algorithmic modules with respect to the framework in [8] are colored in light orange.
The system works on the images acquired by off-the-shelf cameras. In each acquired image human face detection is performed by multiple CNNs (cascaded) integrating, by multi-task learning, both face detection and alignment [35]. After resizing the input image to different scales, the resulting image pyramid is given as input to a three-stage series of cascaded convolutional neural networks, that have been proved to be a very effective approach to solve the face detection problem under unconstrained conditions [36]. At first, a fully convolutional network is used to detect candidate facial regions and related bounding boxes. Candidates are then refined by a linear regression model followed by a non-maximal suppression. Resulting regions are fed to another CNN which further rejects a large number of false candidates and newly performs bounding box regression followed by non-maximal suppression. Finally, the same network used at stage 1 but empowered by a larger number of convolutional layers is used to accurately localize faces in the input image. The face detector was trained on WIDER FACE [37] and CelebA [38] datasets. Details on employed network architectures can be found in [35].
Each facial patch, extracted by the aforementioned face detector, is given as input to the facial landmark detection and tracking step. This crucial step is carried out by making use of the Convolutional Experts Constrained Local Model (CECLM) [39]. CECLM algorithm consists of two main parts: response map computation using Convolutional Experts Network and shape parameter update. The first step is to compute a response map that helps to accurately localize individual landmarks by evaluating the landmark alignment probability at individual pixel locations. During the parameter update, the positions of all landmarks are updated jointly and penalized for misaligned landmarks and irregular shapes using a point distribution model. The following objective function
p = arg min p i = 1 n D i ( x i ; I ) + R ( p )
is used where p is the optimal set of parameters controlling the position of landmarks, with p being the current estimate. D i is the alignment probability of landmark i in location x i for input facial image I computed by Convolutional Experts Network. R is the regularization enforced by a point distribution model exploiting mean-shift over the landmarks but with regularization imposed through a global prior over their joint motion [40].
The estimation of Action Unit (AU) intensities is subsequently carried out on the basis of the detected facial landmarks. The AU estimation starts from the initial regression outcomes coming from a Support Vector Regressor [41] having linear kernels. The regressor was trained on feature vectors built by concatenating geometry (i.e., the CECLM parameters) and appearance features. The CE-CLM parameters consist of the scale factor, the first two rows of a 3D rotation matrix, the 2D translation t and a vector describing the linear variations of non-rigid shape. In addition, geometry is described by the locations of each detected landmark. In particular, the location into the 3D reference model is used starting from the inferred 2D position in the facial region. This led to a 23 + 204 (i.e., 68 × 3) = 227 dimensional vector describing the face geometry [42]. On the other hand, in order to extract appearance features, the detected face is mapped onto a common reference frame by transforming detected landmarks to a representation of frontal landmarks from a neutral expression (pivoting on a 3d model) in order to get a 112 × 112 pixel image of the face with 45 pixel inter-papillary distance. Histograms of Oriented Gradients (HOG) features [43] are then extracted only from the facial region (surroundings are discarded) by exploiting blocks of 2 × 2 cells, of 8 × 8 pixels. This leads to 12 × 12 blocks of 31 dimensional histograms that represent the facial appearance features. The resulting vector (having 4464 elements) is subsequently reduced to 1391 elements by projecting it on the most informative data directions through principal component analysis. The complete vector is then made up by the concatenation of geometry and appearance ones features ( 1391 + 227 = 1618 elements). Finally, the AU intensities are estimated by Support Vector Regression (SVR) employing linear kernels [41]. The models used in the proposed approach were trained on DISFA [44], SEMAINE [45] and BP4DD-Spontaneous [46] datasets coontaining video data of people responding to emotion-elicitation tasks.
Estimated AU intensity values are subsequently smoothed in time by an adaptive degree polynomial filter (ADPF)) [47] and regularized by geometrical constraints raising from probabilistic reasonings.
ADPFs are smoothing filters that, unlike most common Finite Impulse Response (FIR) digital filters, are represented by polynomial equations. The basic idea is to take advantage of a process, known as convolution, to fit successive subsets of adjacent data points with a low-degree polynomial by the method of linear least squares. This kind of filters is typically used to smooth a noisy signal whose frequency range of the signal without noise is large. In the considered application, ADPFs perform better than the standard FIR filters because these tend to attenuate a significant portion of high frequencies of the signal along with noise. It is worth noting that the variation in each AU brings information about facial expression production and then high frequencies have to be preserved during smoothing processes. The particular formulation of ADPFs preserves moments of higher orders much better than other methods. As a consequence, the widths and amplitudes of the peaks for the desired signals tend to be preserved. This is the reason why an ADPF is used in the proposed pipeline, although it is less effective in removing high-level noises in a signal than common finite impulse response filters. Concerning ADPF’s parameters, the number of points used in each subset of model fits is 5 (frame length) and a polynomial of order 3 is exploited to represent each signal portion.
Since the intensities of multiple AUs are not independent of each other their cross-correlation can, therefore, be exploited to mitigate the effects of single random variations (due for example to noise and/or errors in the estimation or involuntary movements of the muscles) and, on the other hand, to emphasize significant patterns instead. To accomplish this fundamental task a Bayesian Network (BN) has been trained using a large number of videos containing annotated facial expressions as suggested in [48]. In particular, AU dependencies were learned on the well known Cohn-Kanade Dataset (CK+) [49]. Each node of the BN has been associated with an AU label, whereas the links among nodes and their transition probabilities capture the conditional dependencies among AUs. Conditional dependencies among AUs were exploited to regularize AU intensities by the following rule:
A U i ¯ ( t ) = A U i ( t ) + R i ( t ) i { 1 n }
where
R i ( t ) = j ( p i , j ( A U i ( t ) A U j ( t ) ) ) n { i , j } { 1 n } ; i j
with n the number of considered co-occurrent action units (in this paper n = 14 ). The outputs of this step are regularized AU intensities, i.e., AU intensities whose values at each time instant have been ’smoothed’ or ’enhanced’ according to the learned parameters of the model there are applied on the values of the intensities of the related AUs.
Facial Expression Analysis is subsequently performed on the basis of the estimated, temporally smoothed and regularized AU intensities. To this purpose, the Ekman model [50] that attributes the character of basic emotions to happiness, sadness, fear, and anger has been taken as theoretical reference.
To this end, firstly, the actual variation in each A U intensity is computed by introducing a short-term statistics on a modeling window W m ( t Δ m ; t 1 ) where Δ is the observation period whose length depends on the expected temporal distance between two consecutive relevant facial expressions. The modeling window W m ( t Δ m ; t 1 ) is exploited to build a probabilistic model with multiple Gaussian functions built on the observed configurations of the facial muscles. The probability to observe the value X of the intensity of A U i is then computed as:
P ( X ) = i = 1 K w i η ( X , μ i , Σ i )
where K is the number of distributions ( K = 3 in this paper), w i is an estimate of the weight of the ith Gaussian in the mixture, μ i and Σ i are the mean value and covariance matrix of the ith Gaussian respectively, and η is a Gaussian probability density function.
Given the model, the largest value of A U i in the observation window W o ( t + 1 ; t + Δ o ) is extracted, its probability to fit the model is computed and its negative log-likelihood
V A U i ( t ) = l o g ( P D F ( m a x ( A U i ( t ) : t W o ) )
is retained as a measure of the variation of the current values with respect to the expected ones.
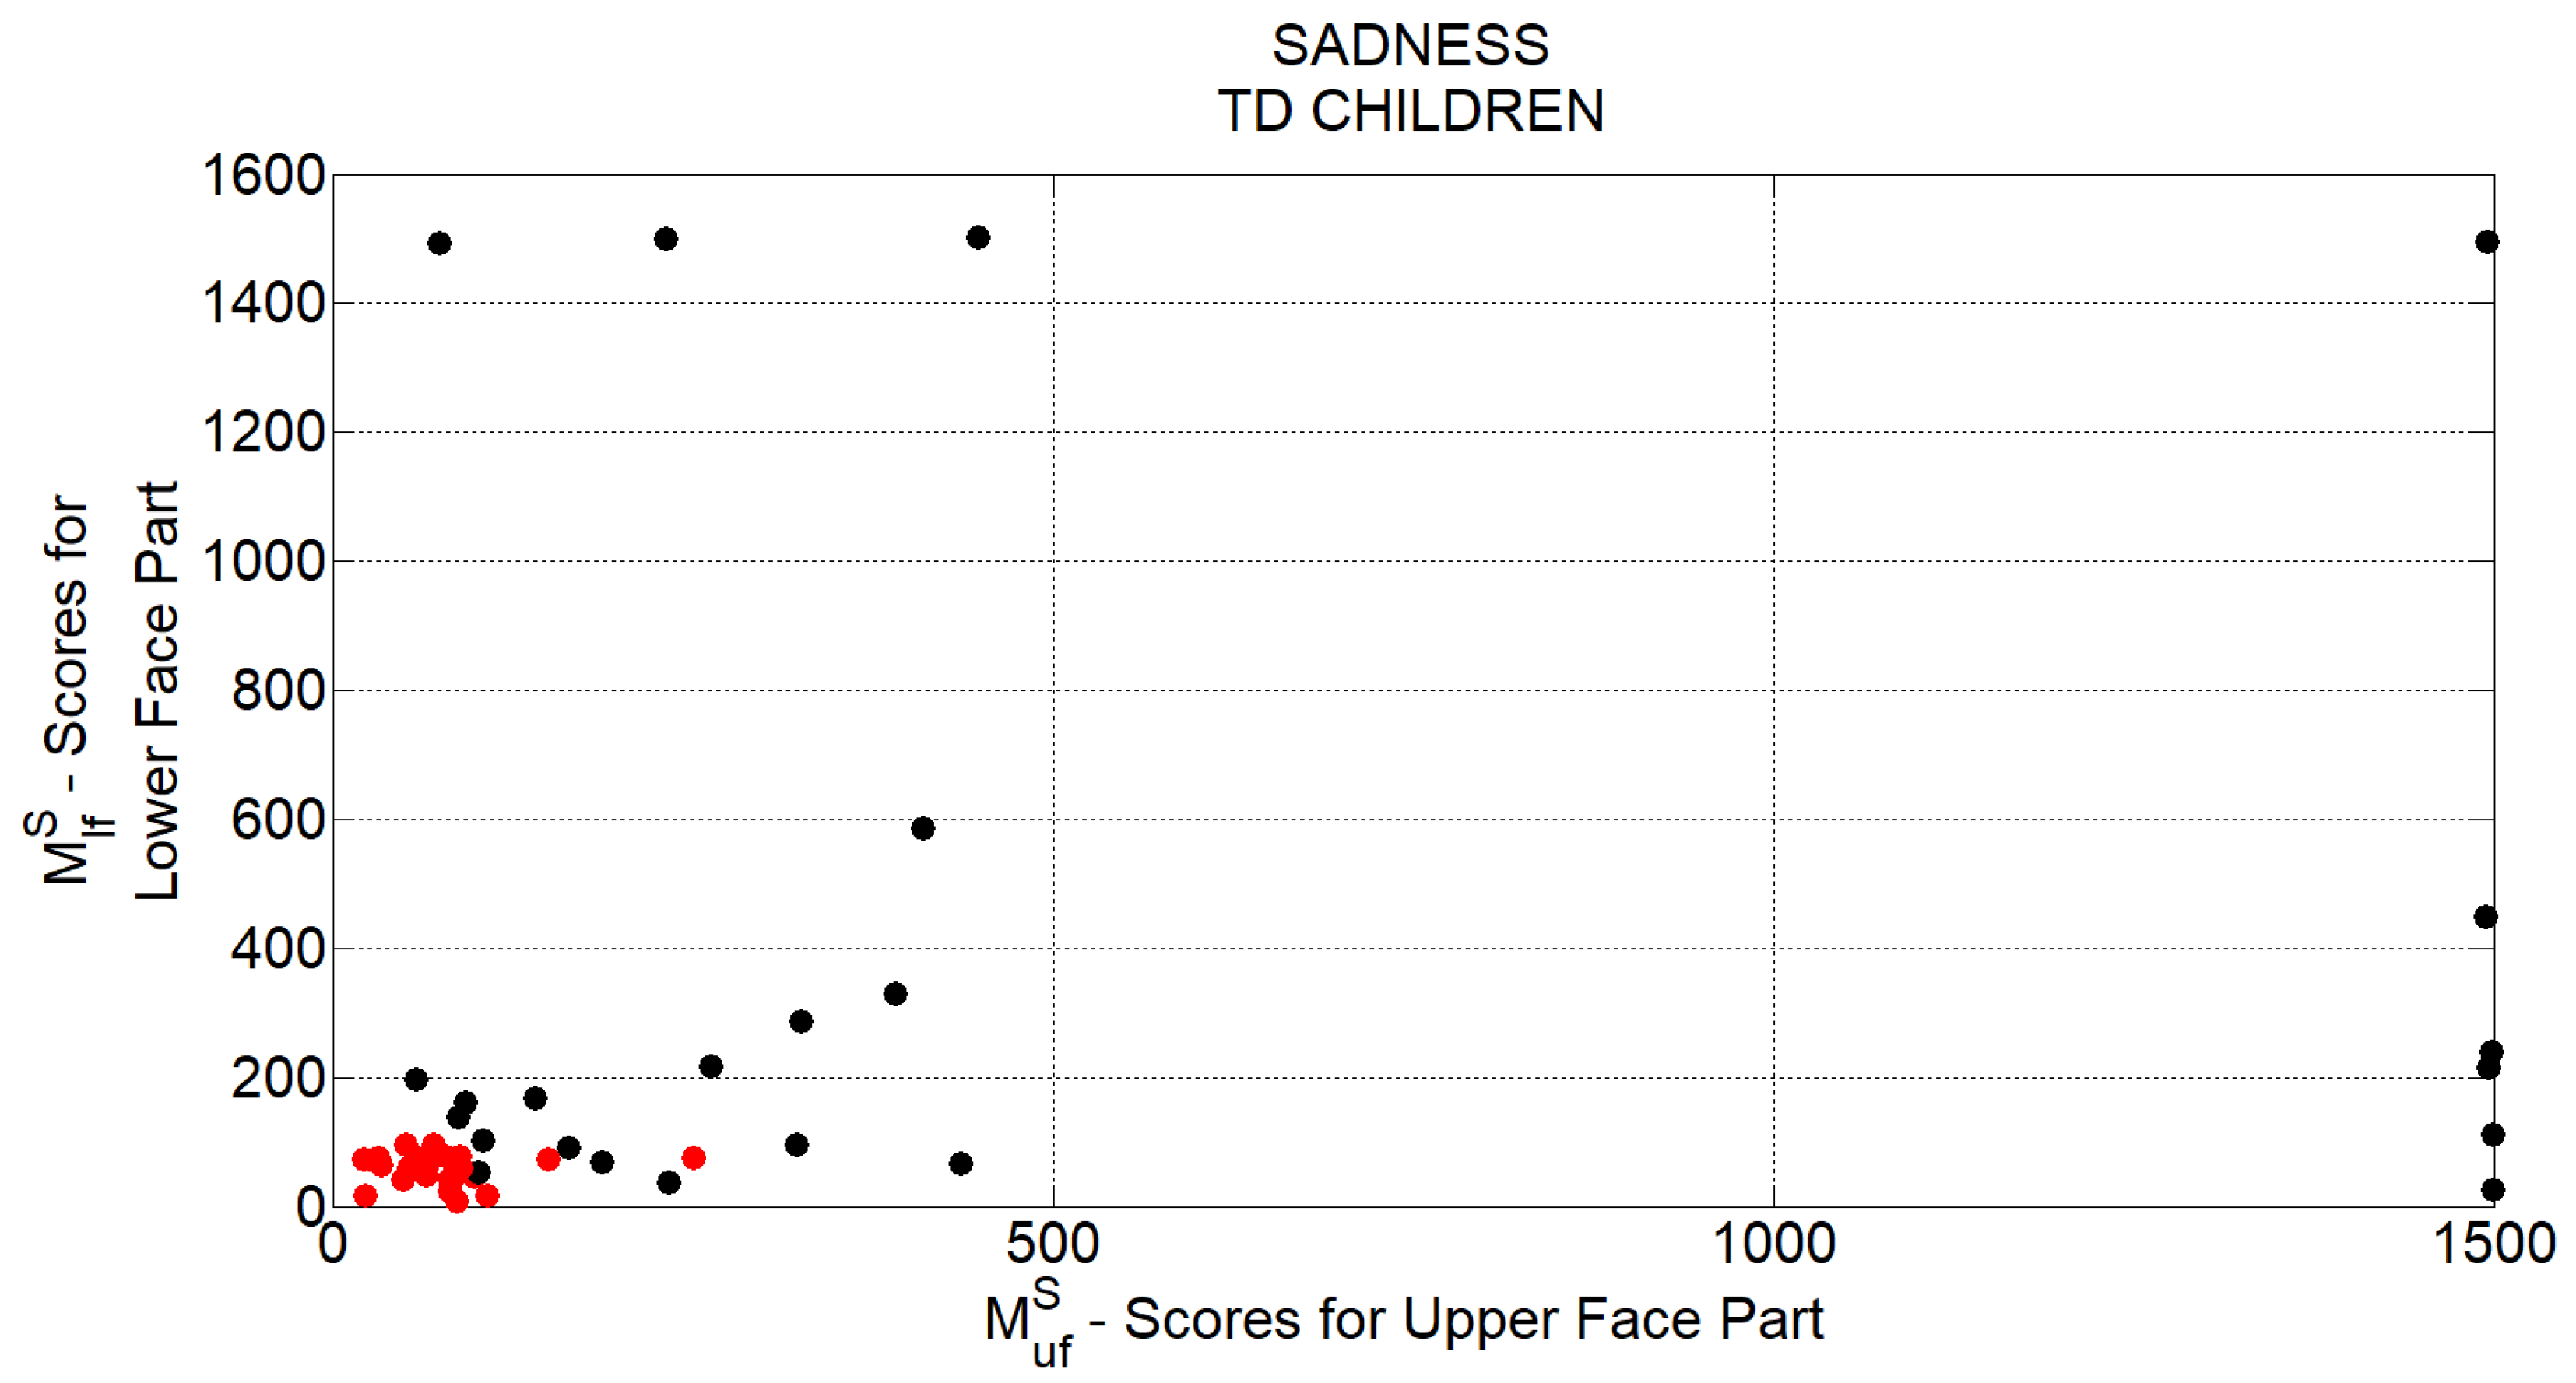
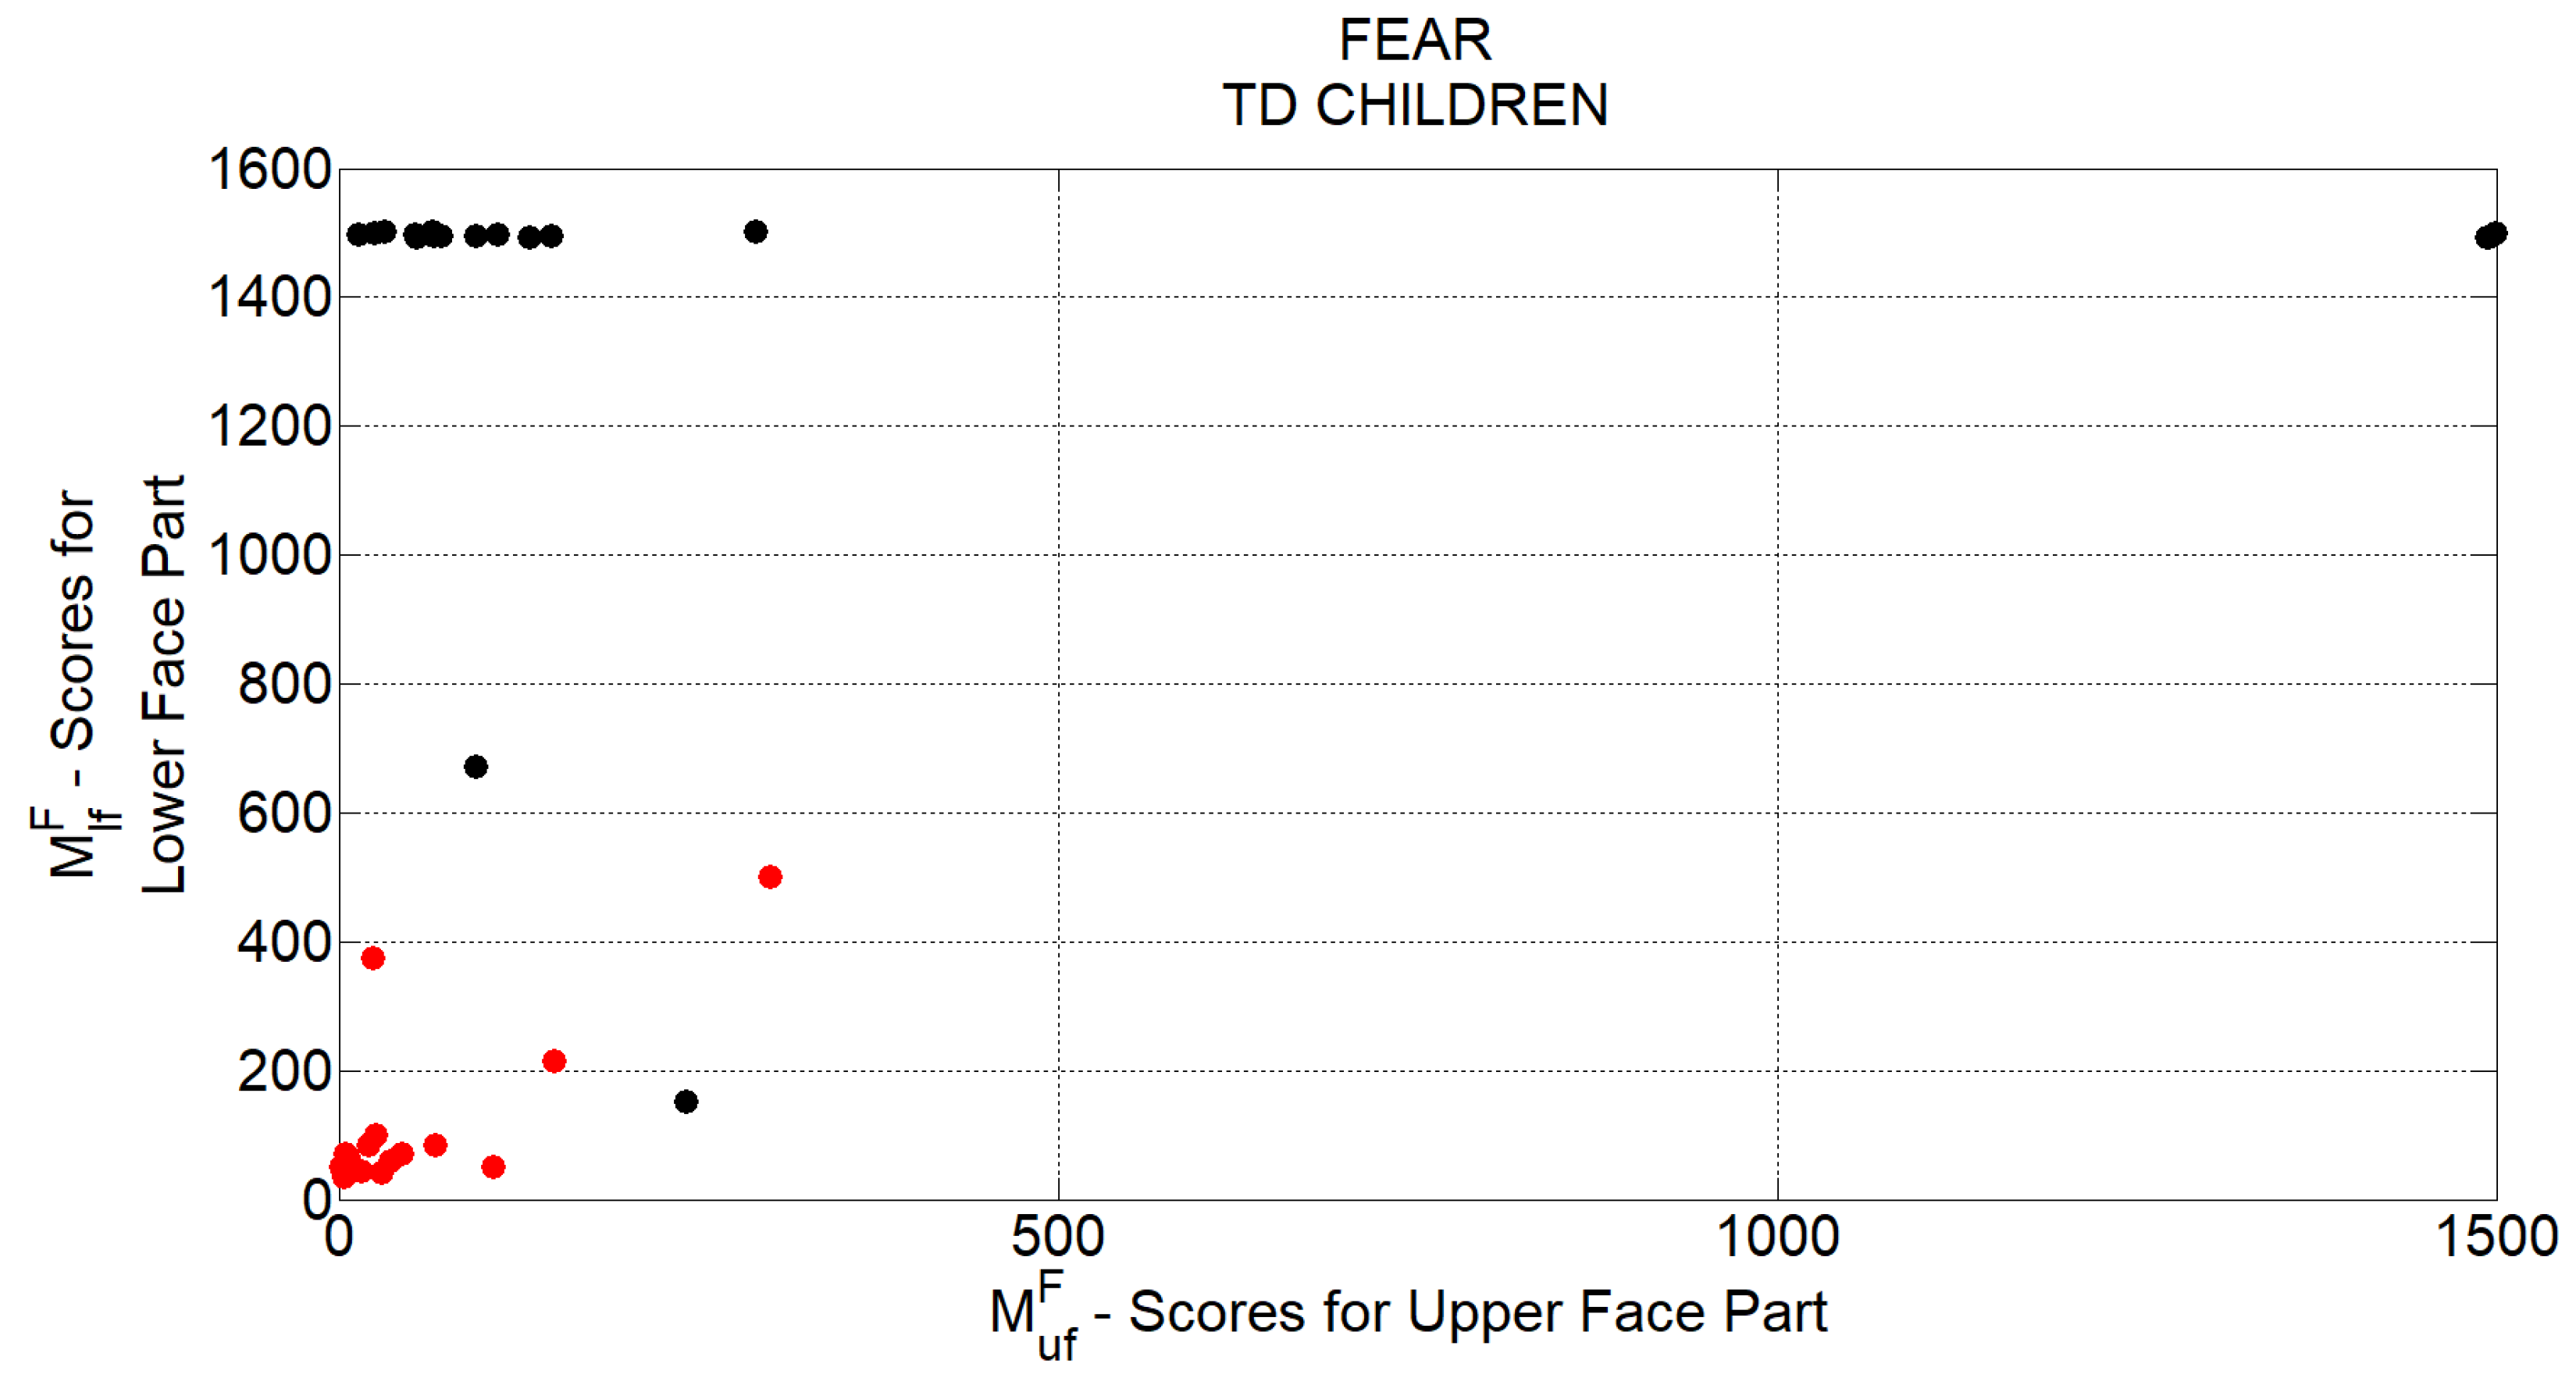
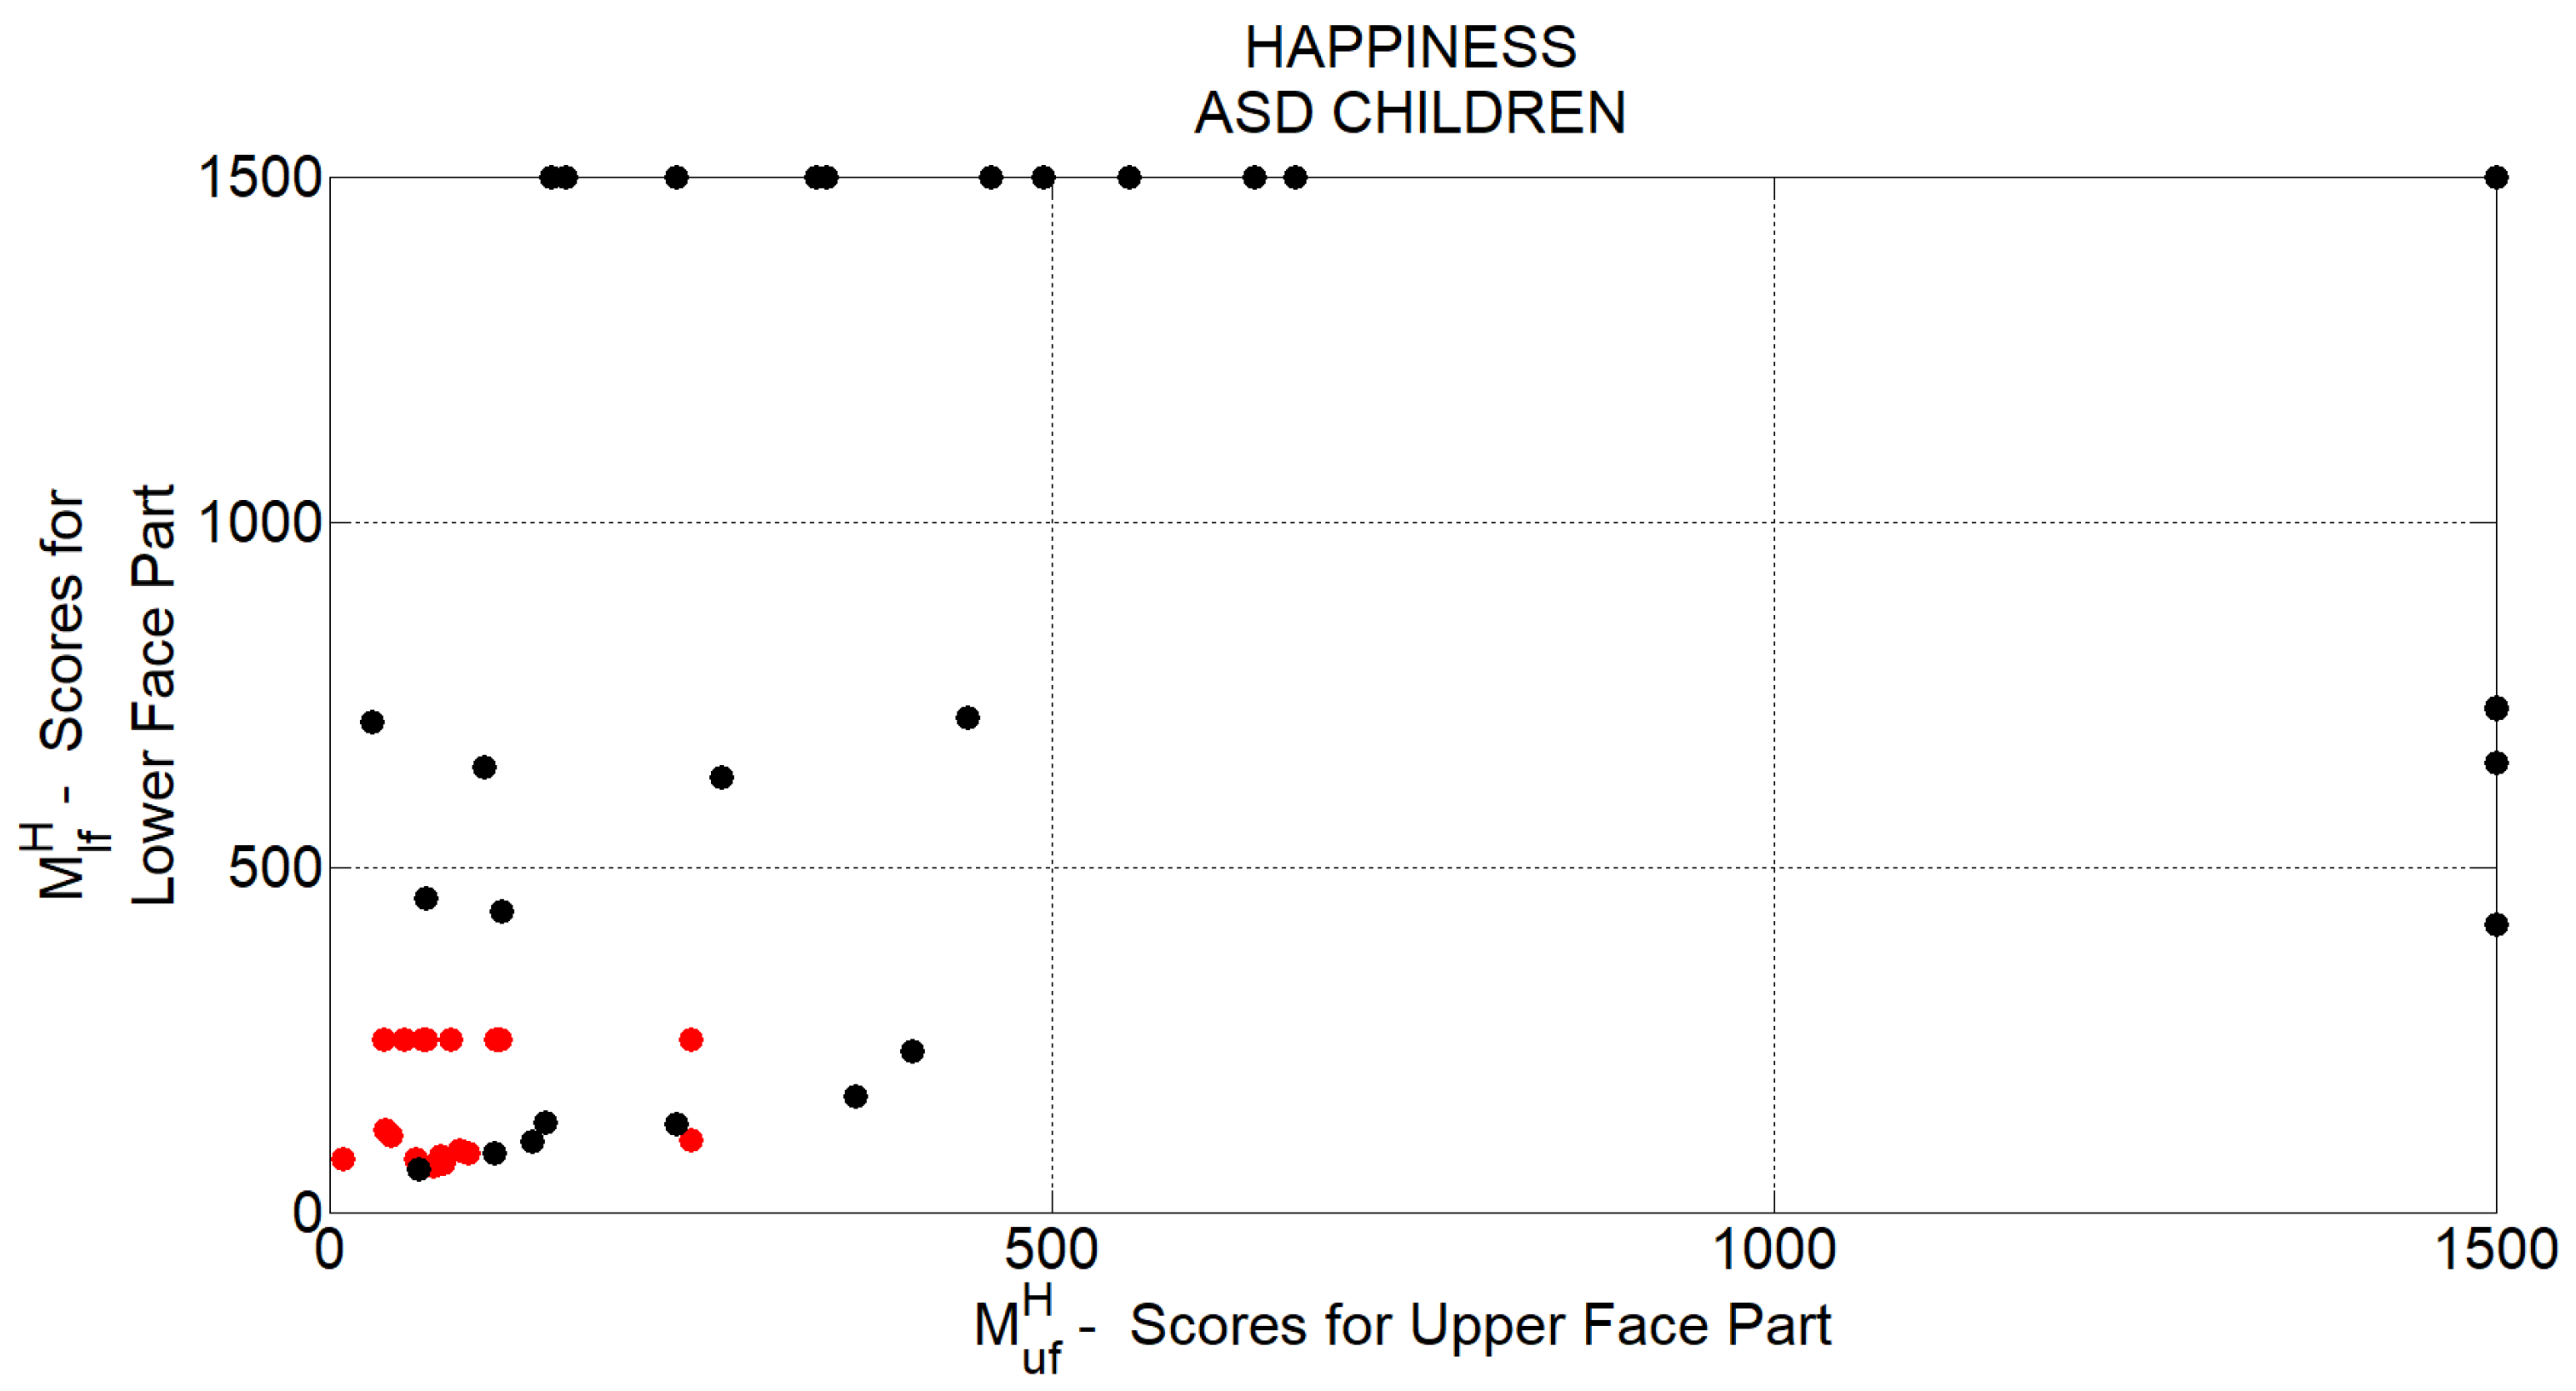
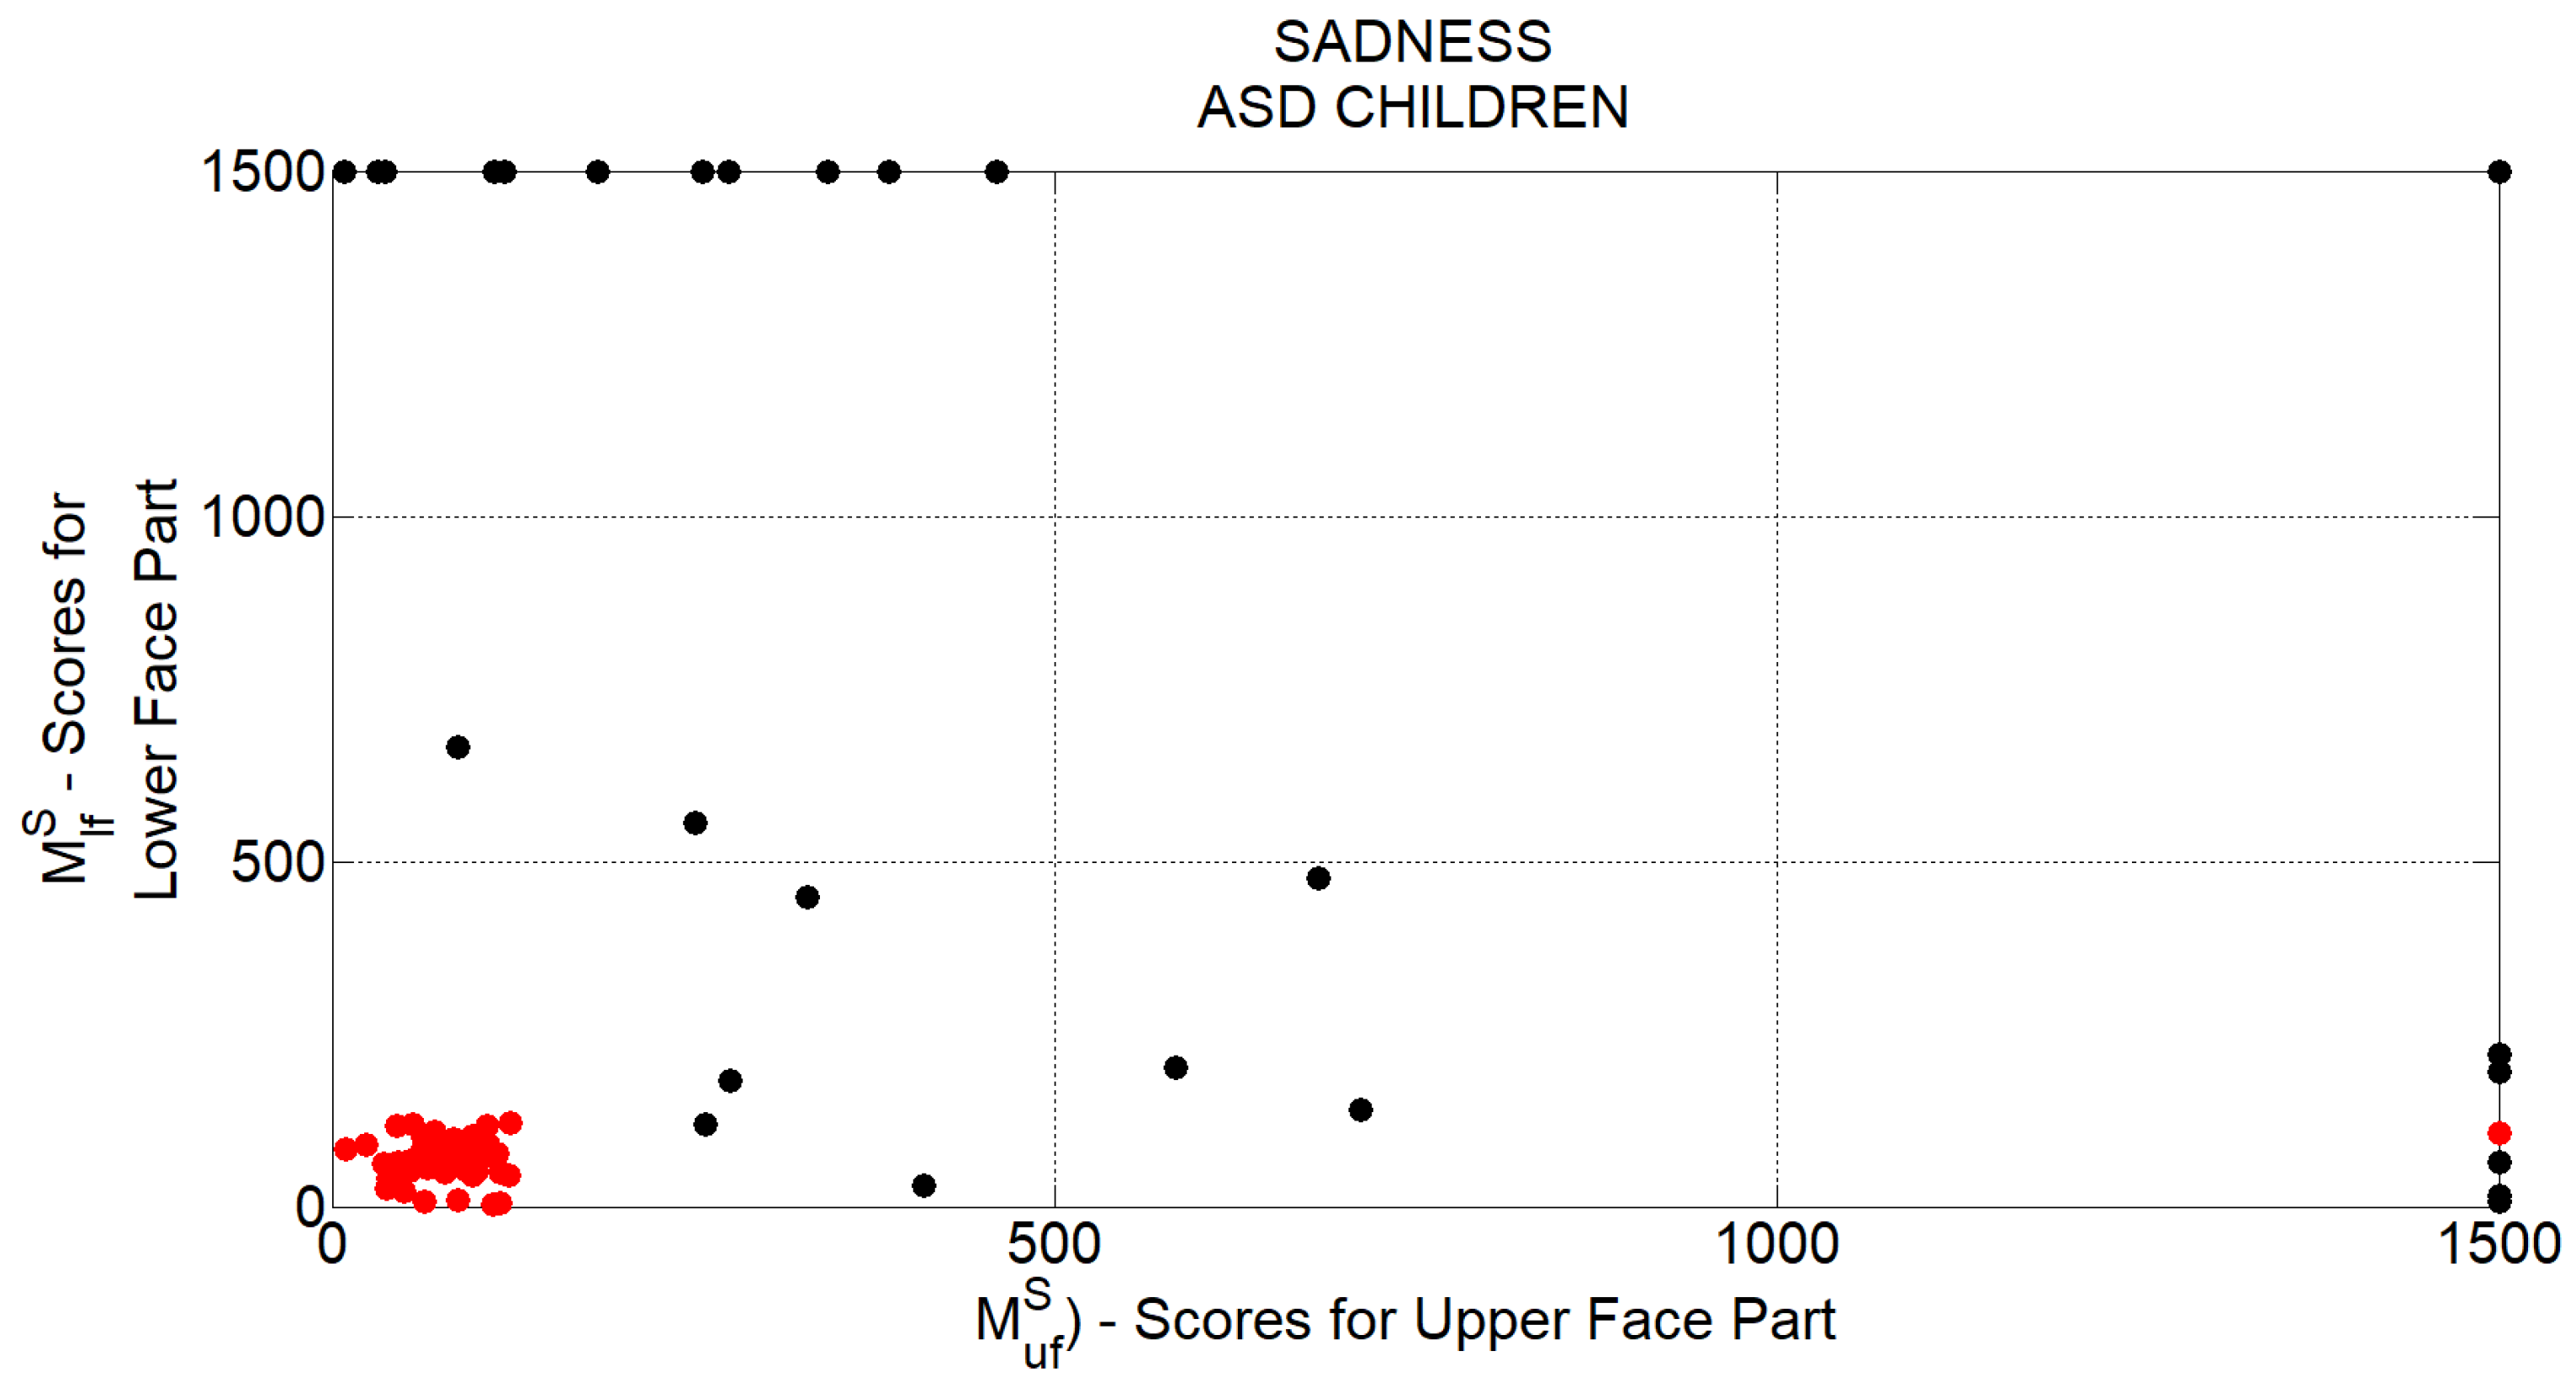
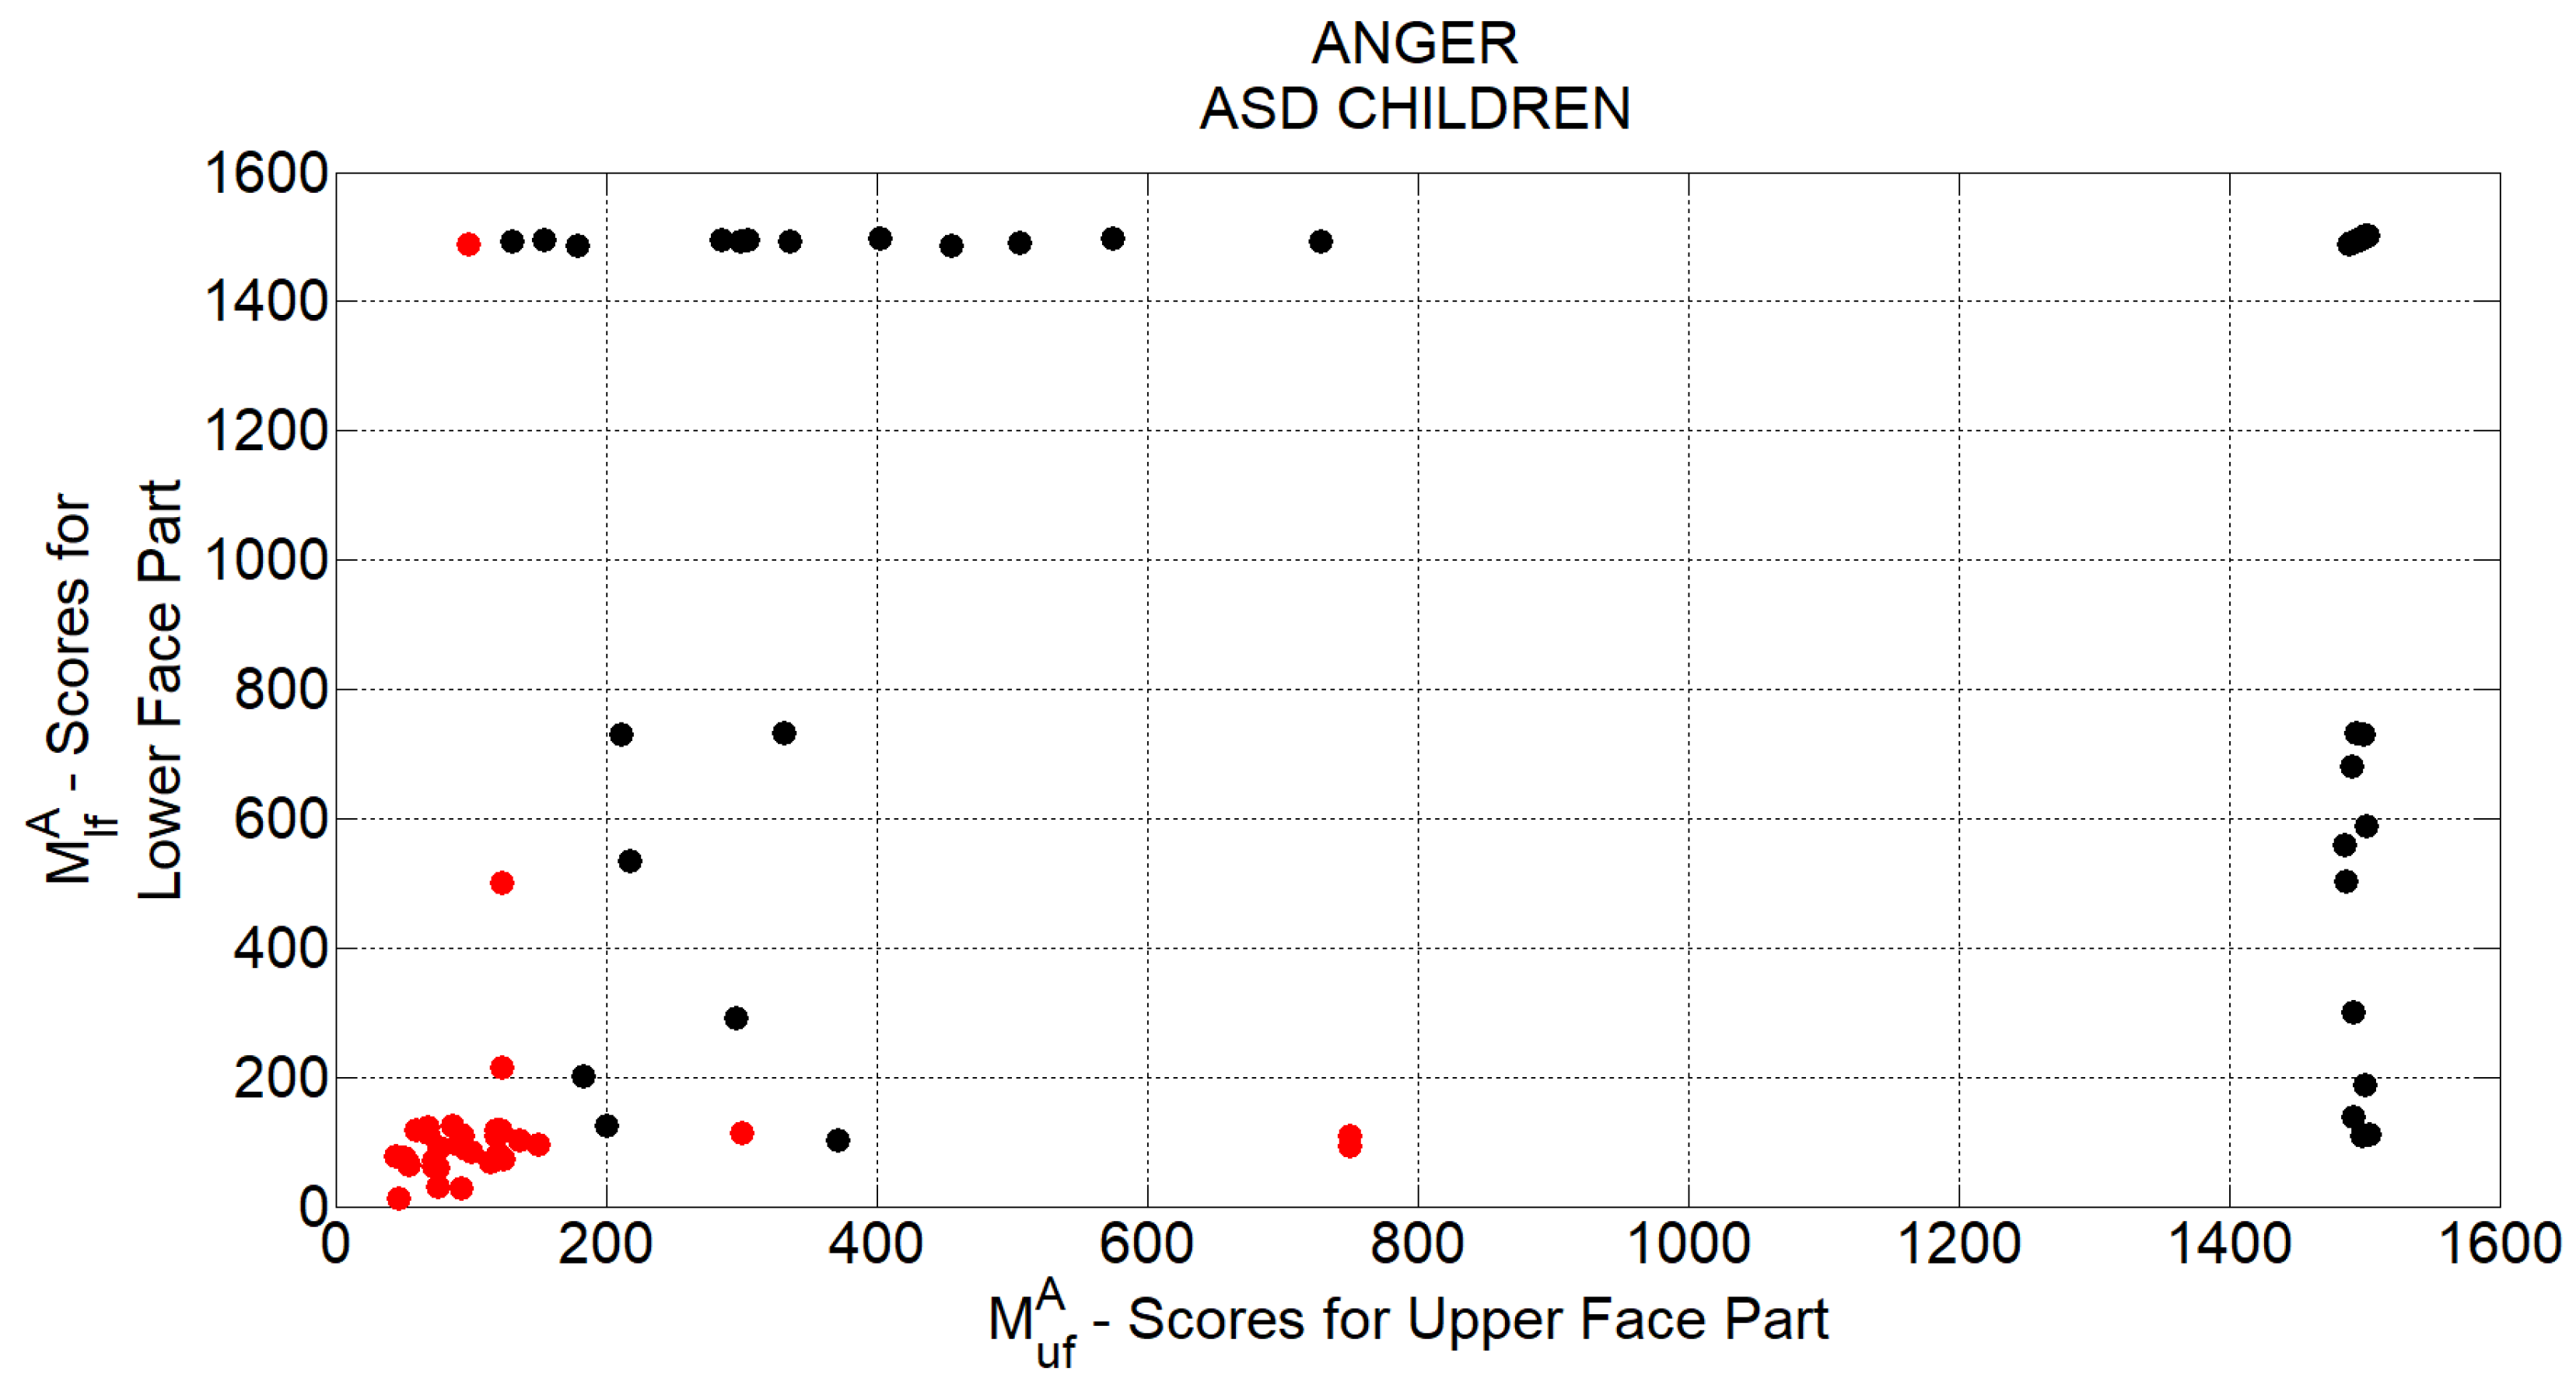
The values V A U i are finally exploited to compute the production scores M y x ( t ) with x [ H , S , F , A ] and y [ u f , l f ] that are the outcomes of the proposed algorithm pipeline in each time instant 
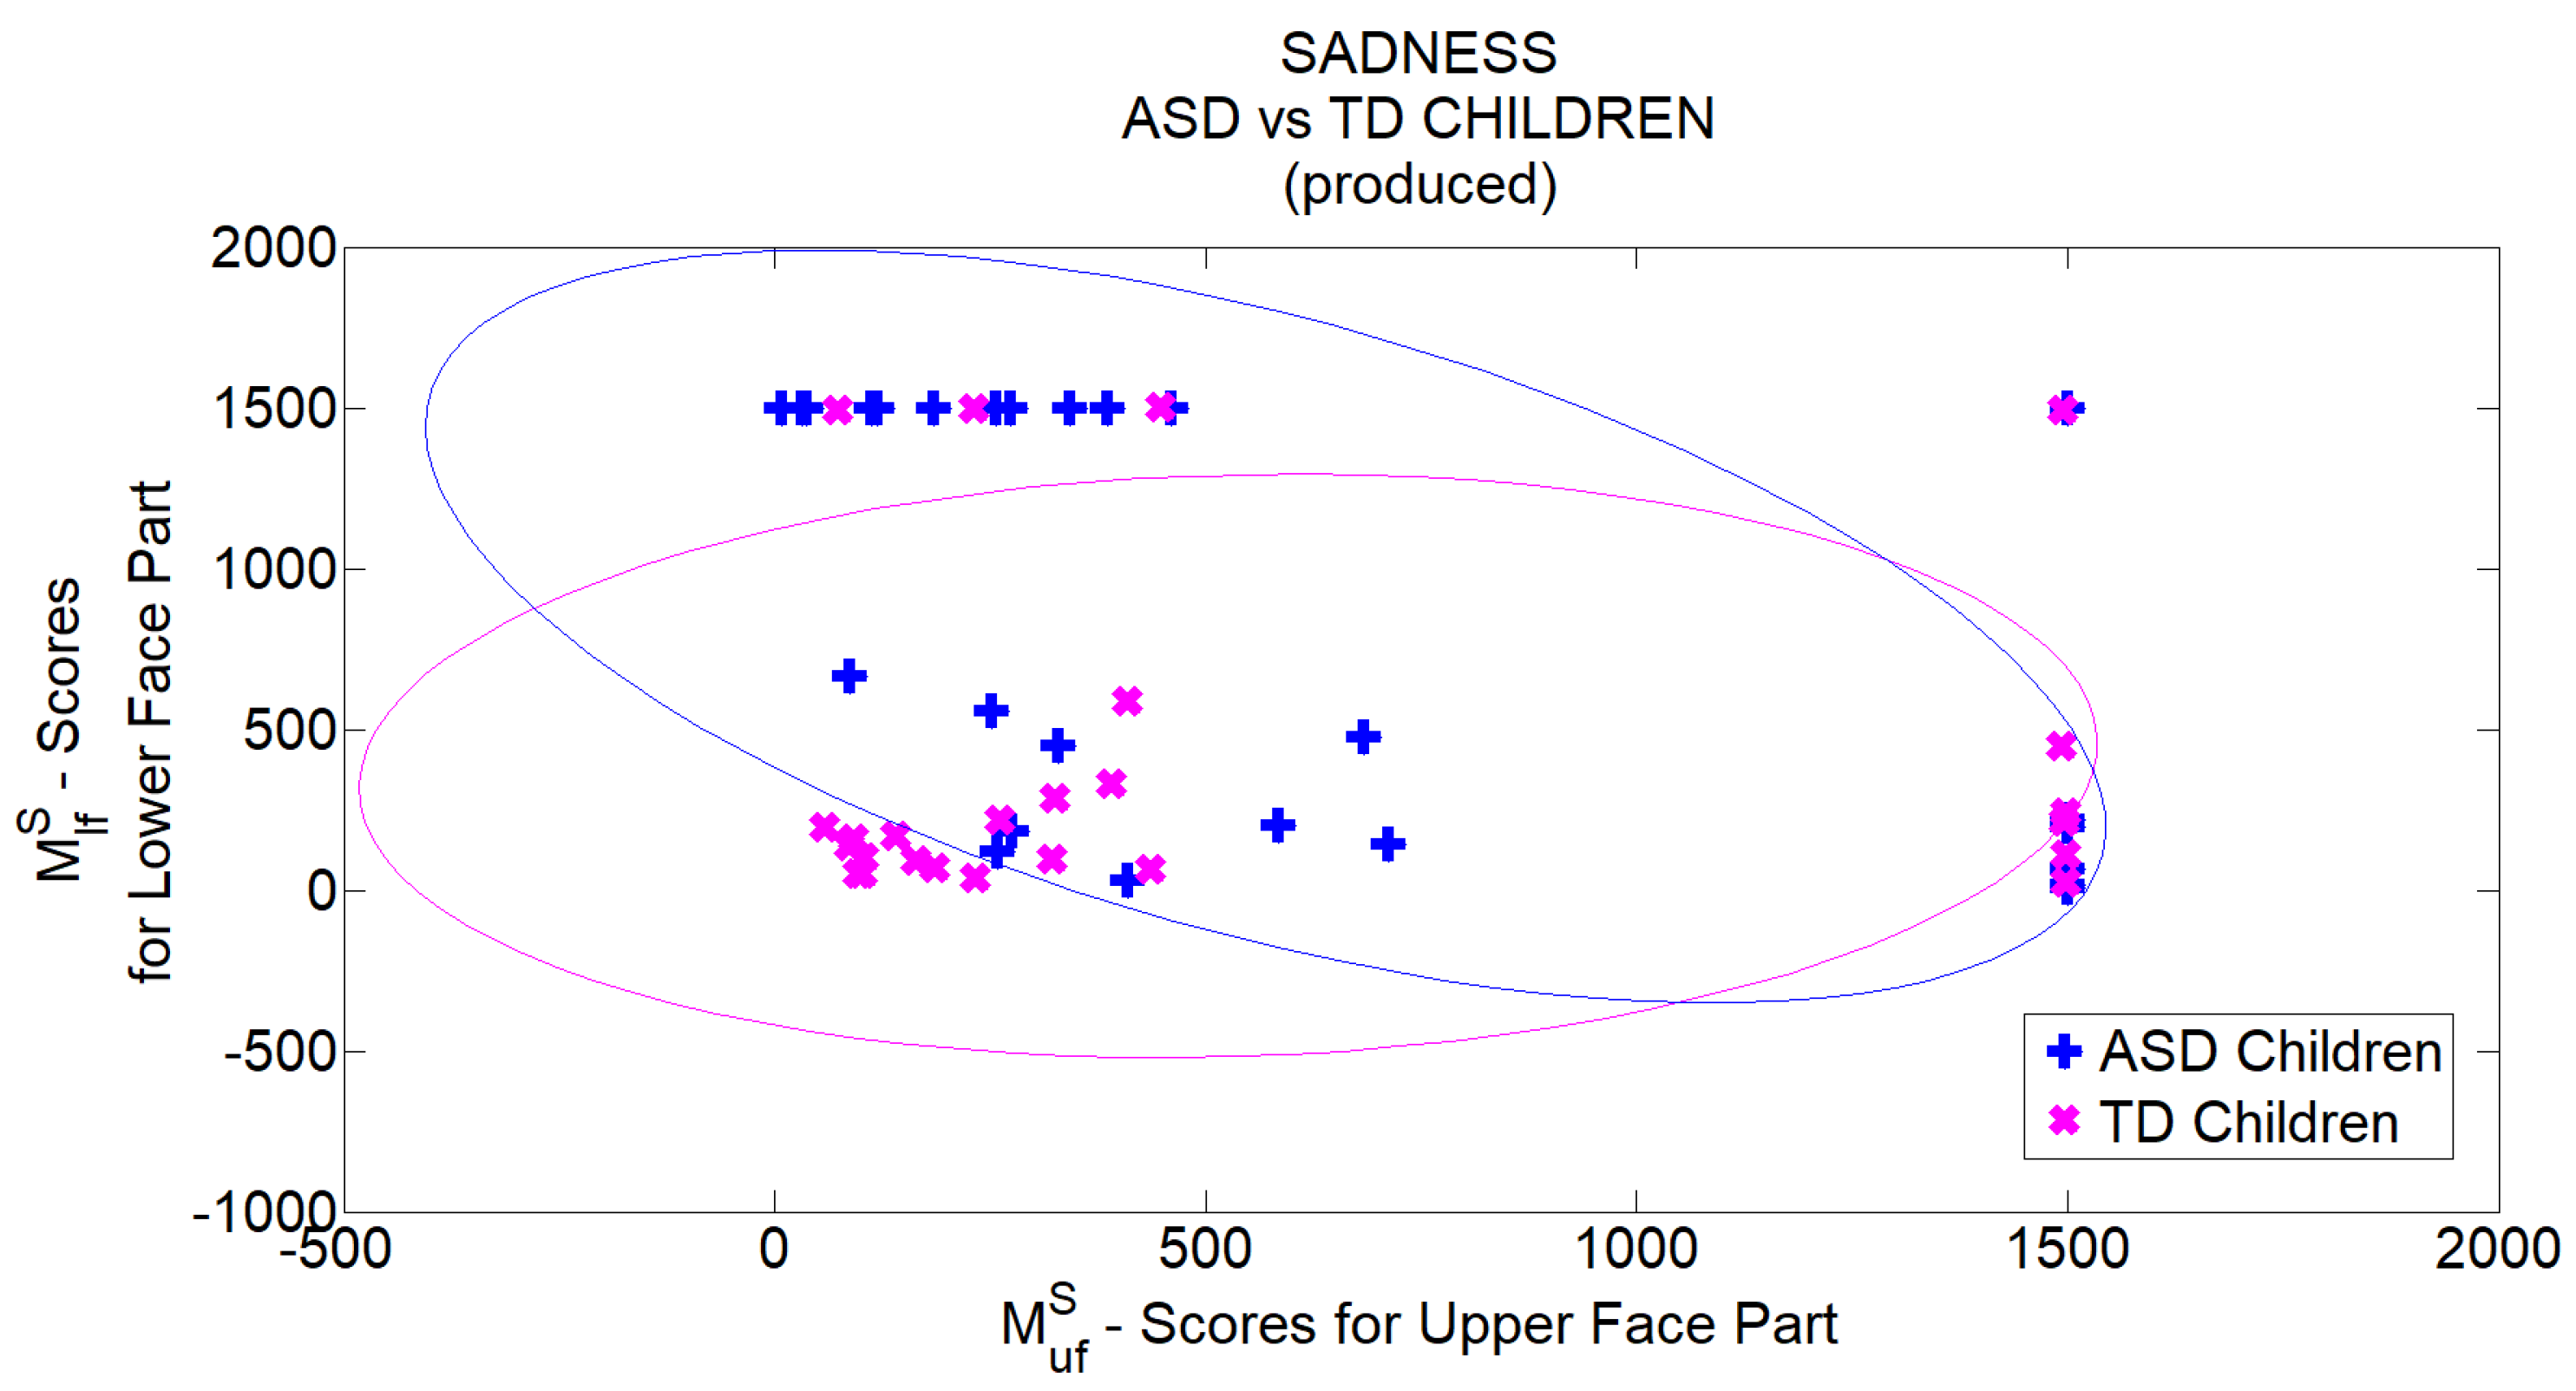
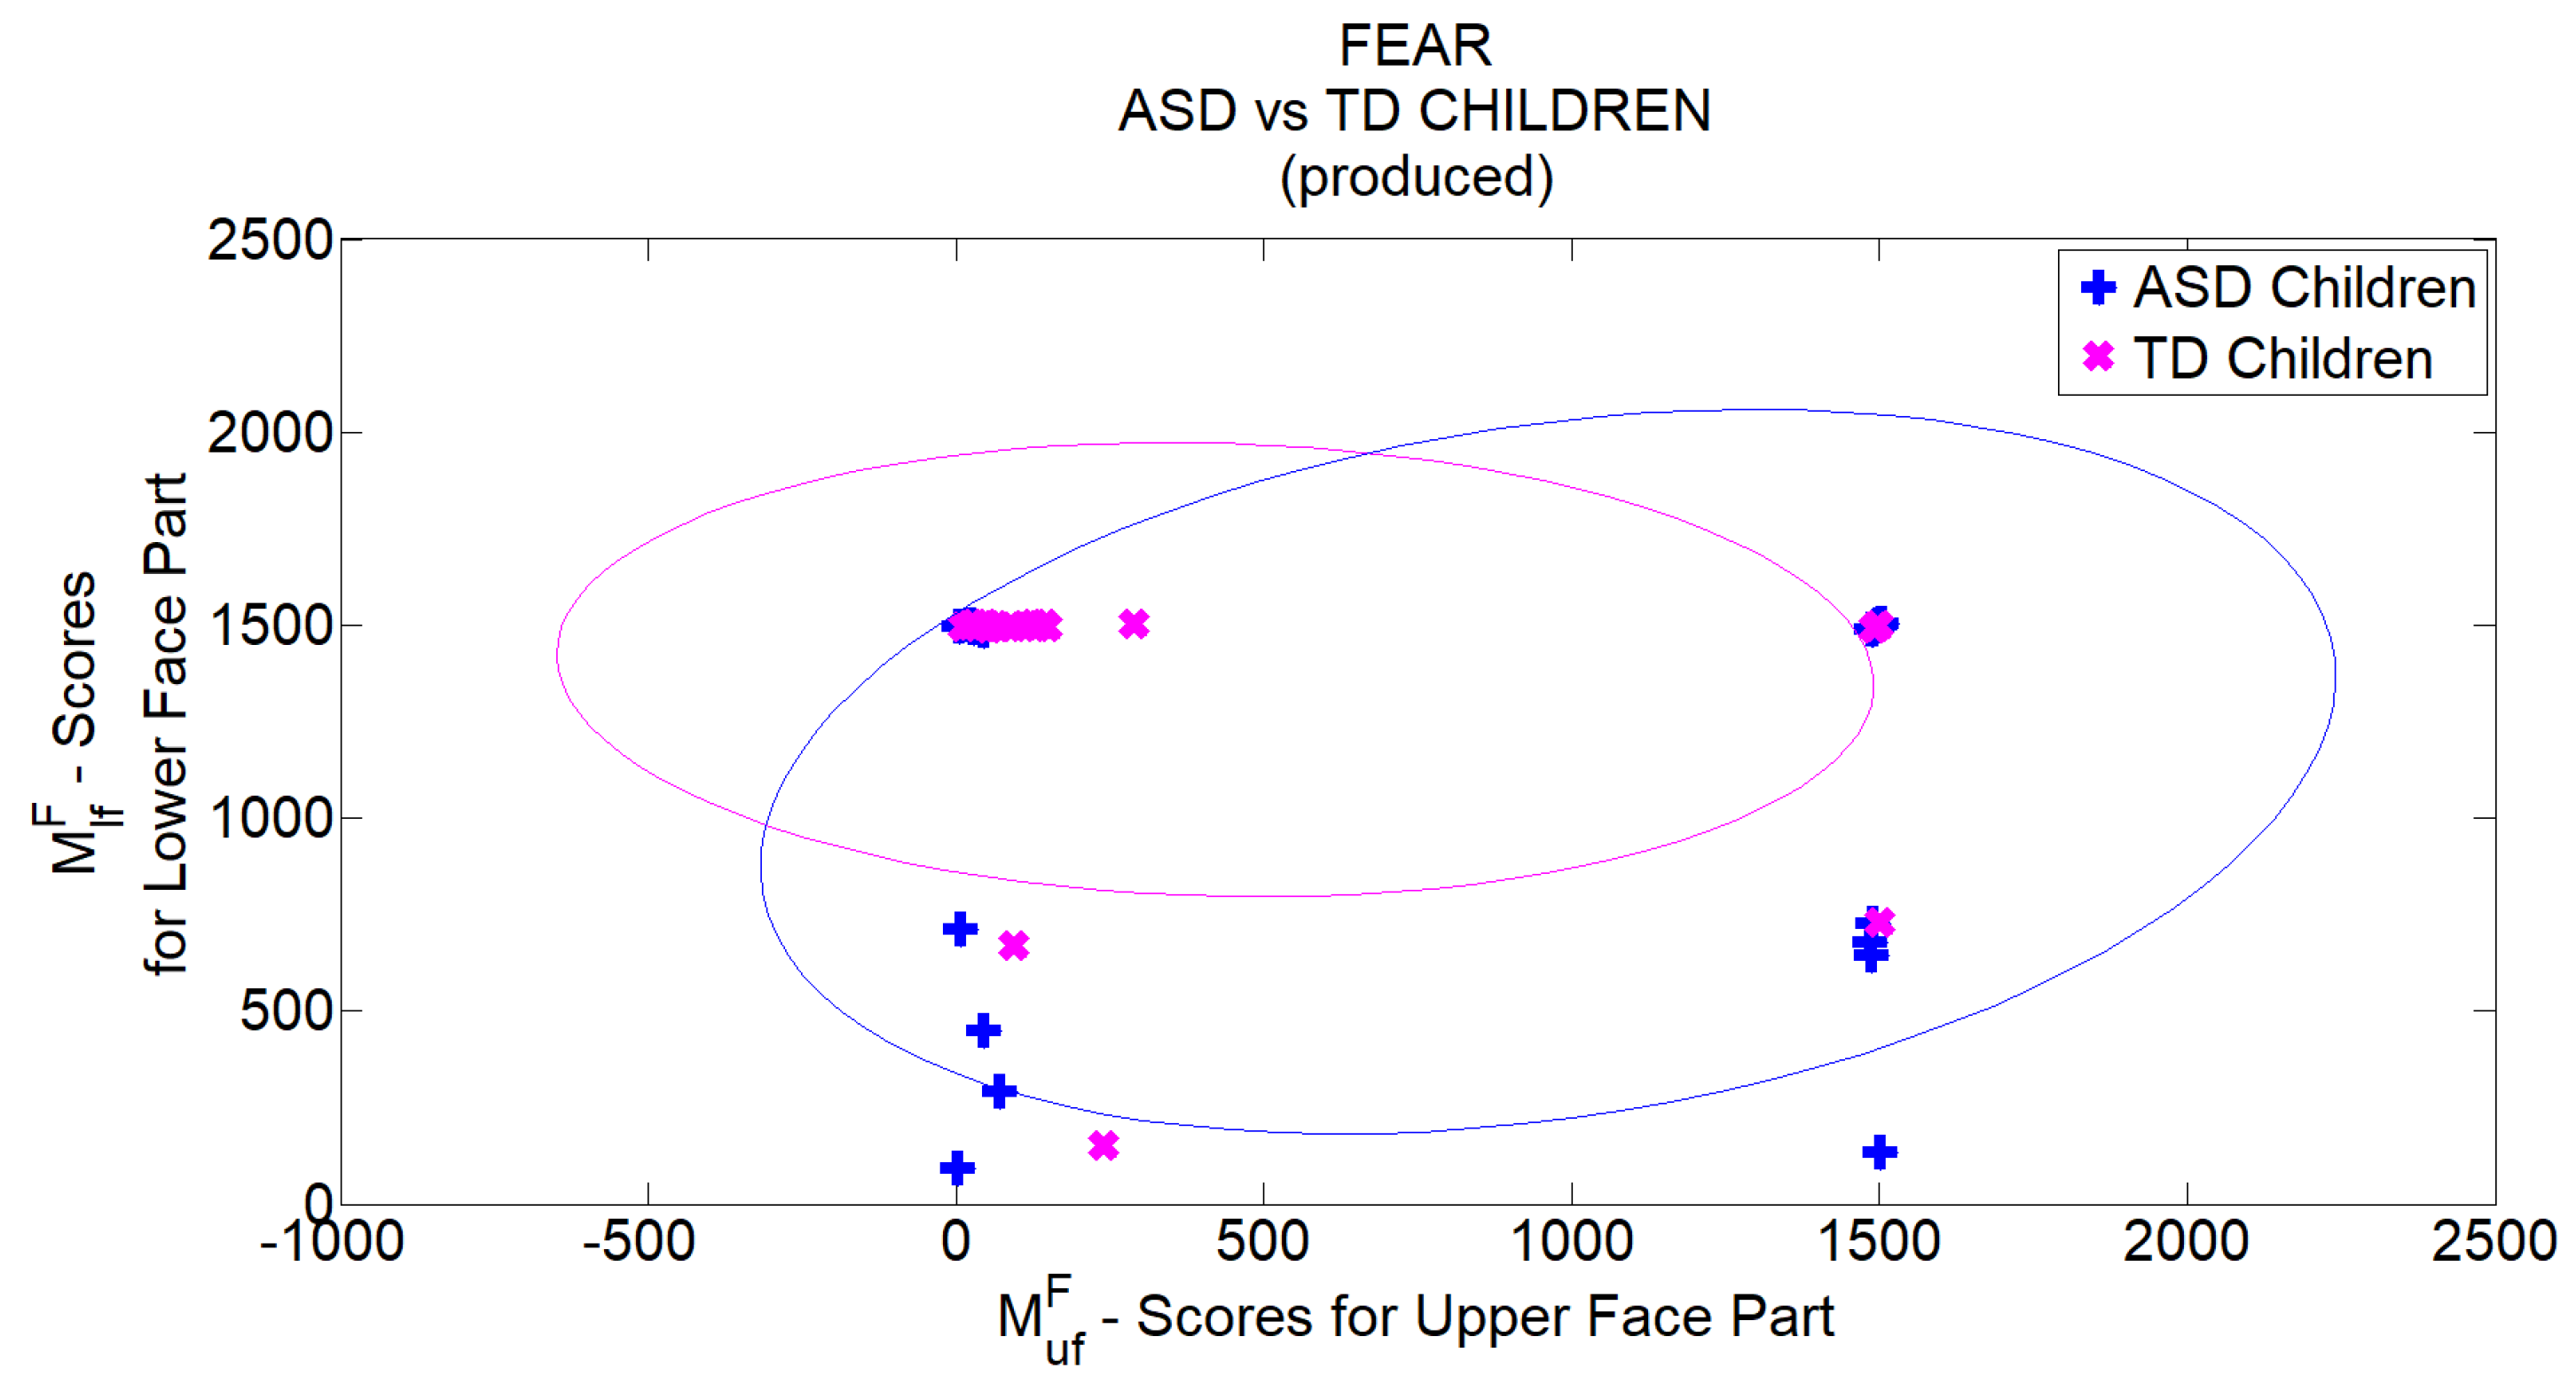
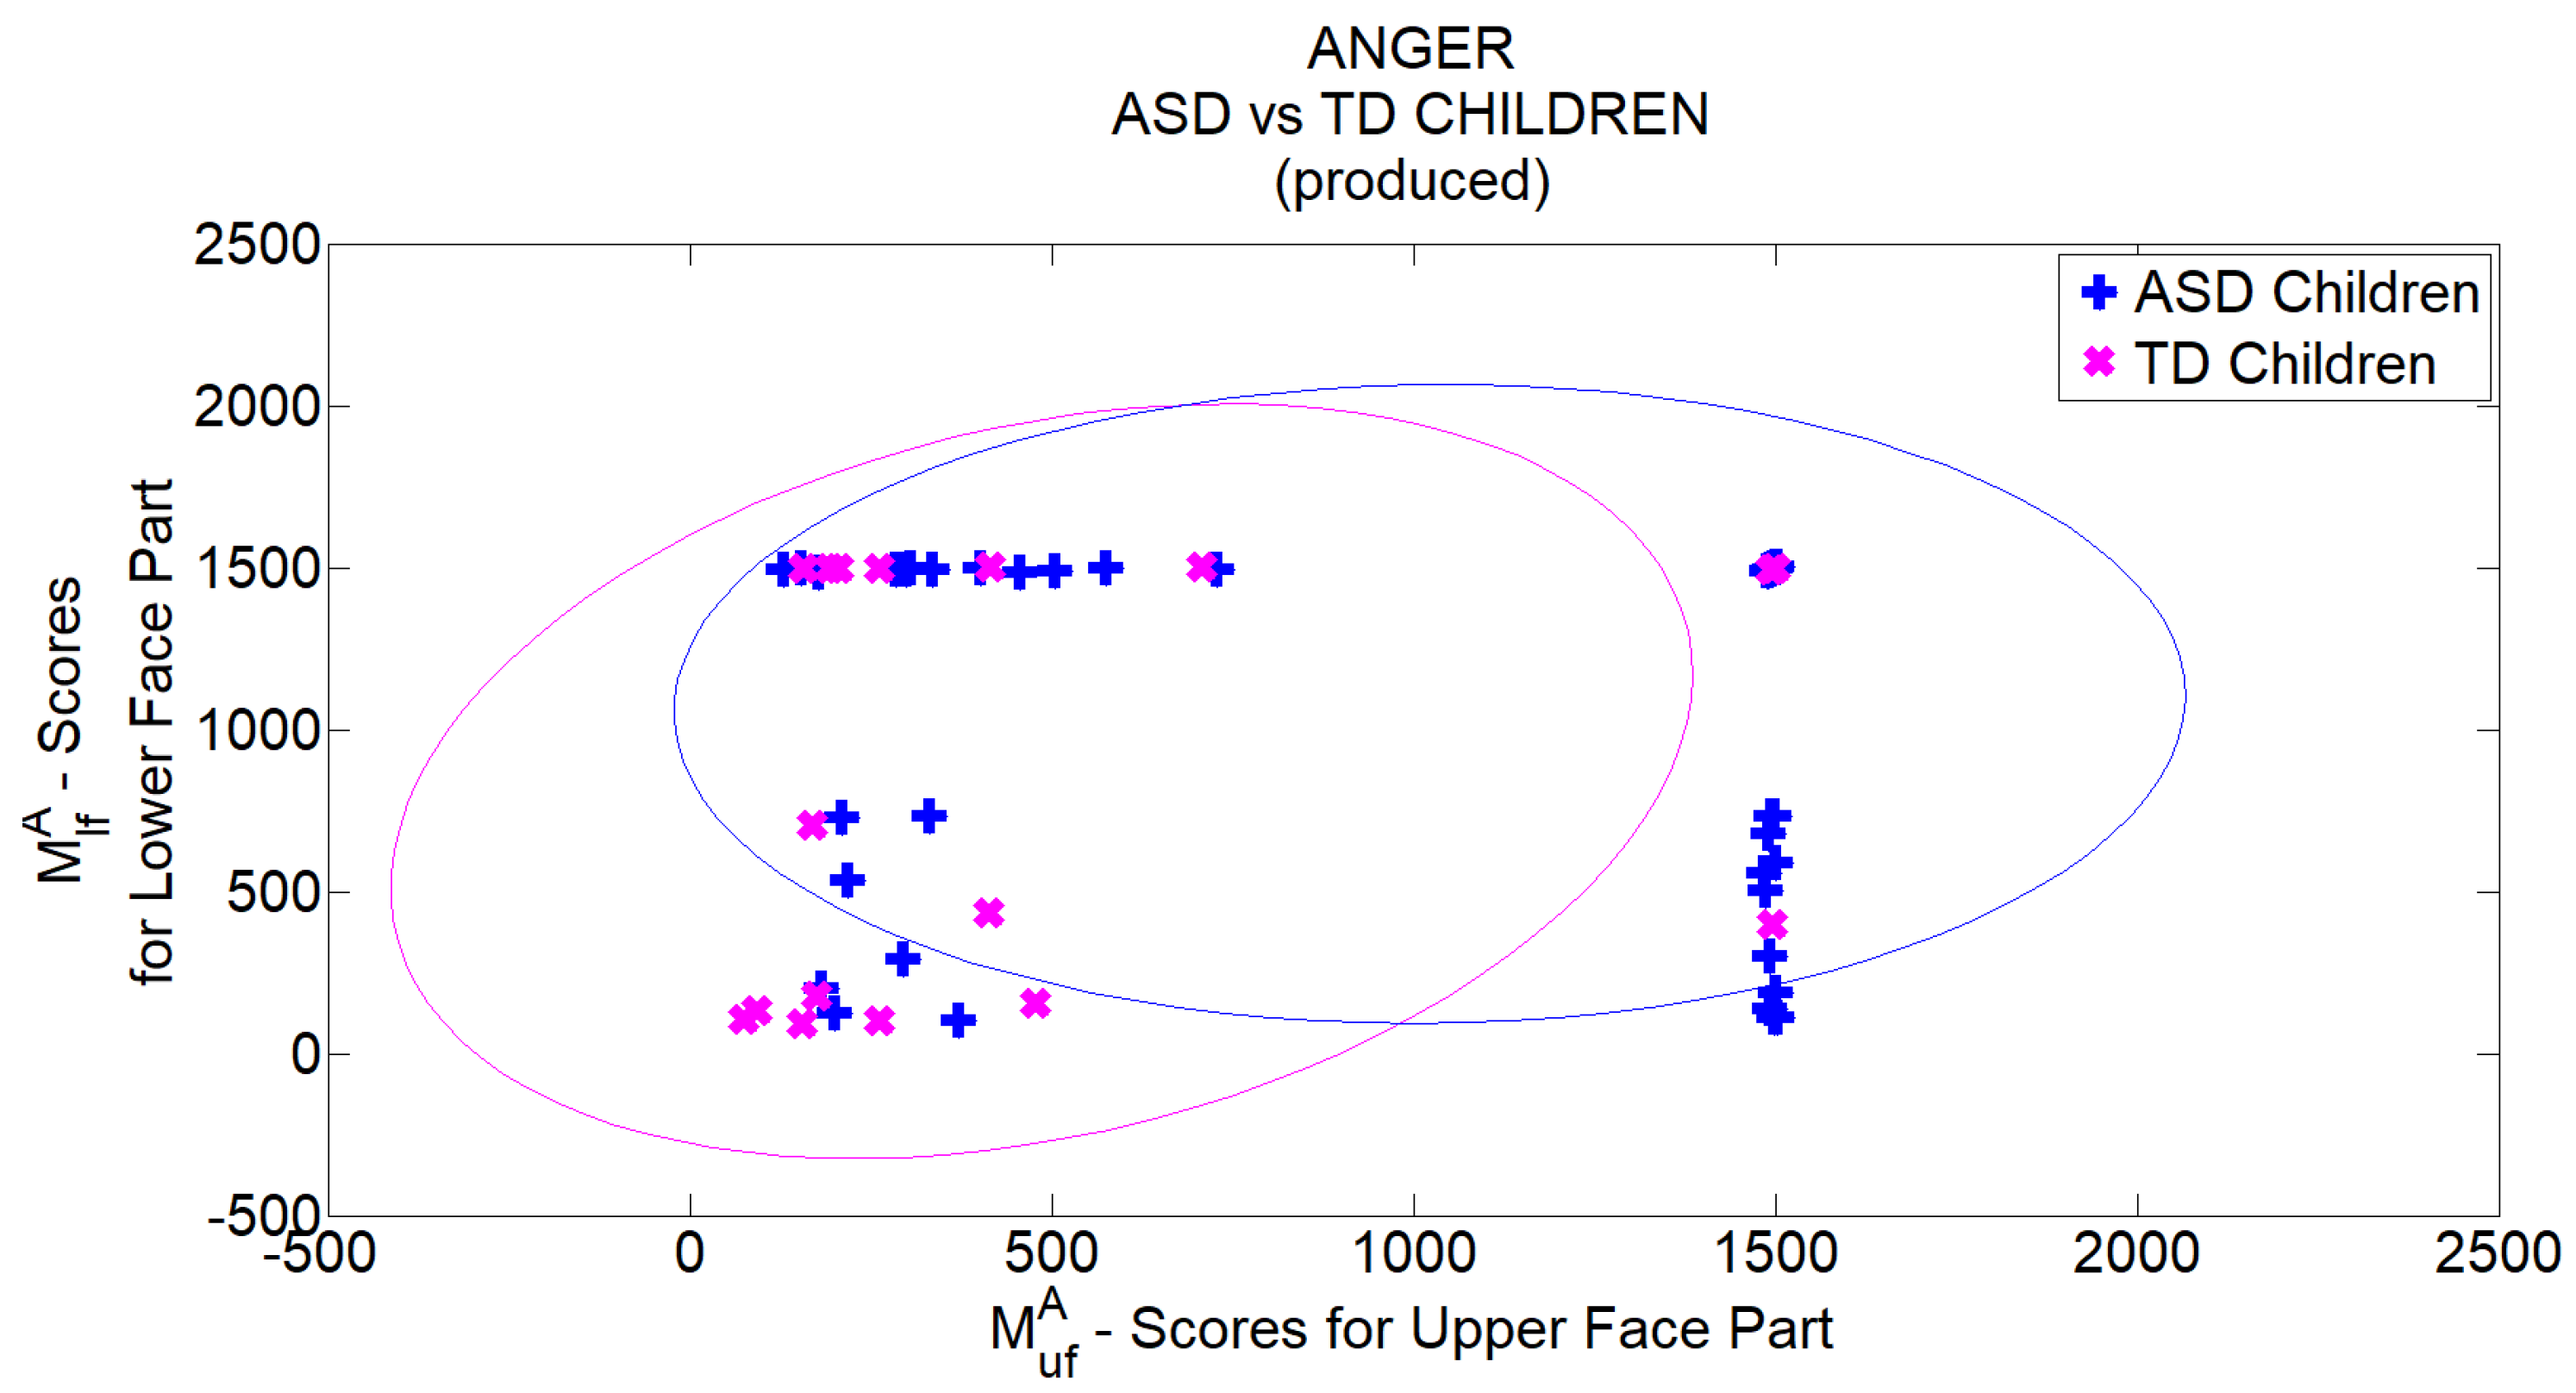
t. For each of the 4 basic facial expressions taken into consideration, at each time instant, a measure of production ability is separately computed for lower and upper facial part (indicated by u f and l f subscripts respectively) as reported in Table 2.

4. Participants and Method

Participants. Twenty-seven children were recruited for this study: 17 were children with ASD recruited at two diagnosis and treatment associations in the South of Italy and 10 were typically developing children recruited at a daycare in a little city of South of Italy. For this research Ethical Committee of the Local Health Service gave its approval and informed consent was obtained from children’s parents. All children’s families were contacted to obtain agreement and they received a cover letter with the project research description and the signed informed consent. ASD group. This group is equivalent to the one used in [8]. It included 14 males and 3 females children aged 6–13 years (mean = 8.94; standard deviation = 2.41) and who received a High Functioning—ASD diagnoses by local health service using Autism Diagnostic Observation Schedule (ADOS) scores [51]. Their IQ was assessed by Raven’s Colored Progressive Matrices [52] and the scores were on average level (mean = 105; standard deviation = 10.98; range = 90–120). Furthermore, all children followed a behavioral intervention program using the Applied Behavioral Analysis (ABA). TD group. This group included 10 children (6 males) aged 26–35 months of life (Mean = 31.3; Standard Deviation = 3.1) who were not referred for any developmental disability. Children were voluntarily recruited aged between the second and third year of life since that age range is the crucial moment in which children start developing the ability to name and recognize facial expression (e.g., [9,10,11]) of basic emotions (happiness, sadness, fear, and anger). Table 3 describes the sample divided by children’s group.
Here it could be useful to make a clarification: the main aim of the paper is to quantify facial expression production while it is not completely developed. For this reason, the experimental setup involved 2–3 years old TD children. Evaluation of TD children of the same age of ASD ones would bring to pointless results since all the scores would tend to the maximum in subjects having the facial expression production skills fully acquired. What really matters in the considered application context is the level of development of competences, not the chronological age of the involved individuals. In light of this, for both groups, the clinical baseline was assessed by the Facial Emotion Recognition (FER) task [53,54] which evaluated the child’s ability to recognize each emotion between four visual stimuli. A point is awarded to a child if he recognizes the stimulus. Since there are four visual stimuli (each associate to a basic emotion) and each stimulus is supplied 5 times to each child, the total score ranges from 0 to 20 (i.e., from 0 to 5 for each basic emotion). Table 4 and Table 5 show grouped FER scores for TD and ASD children respectively. In each table, the first column indicates the emotion to which the visual stimulus was related to, whereas the second column reports the total number of recognized emotions for the related group. In the second column also the percentage of correct executions of the recognition task with respect to the total number of supplied stimuli is reported. In each table, the last row reports the overall scores. Tables point out that the development of the TD group’s competence was still in progress since the percentage of correct recognition was on average the 62%. On the other hand, ASD children obtained very good performances in basic emotion recognition task (on average correct recognition of 94%). This could be associated with their higher chronological age than children in the TD group. Besides, for both groups, the most recognized emotion was happiness (in particular all ASD children succeeded in recognizing it), whereas negative emotions were less recognized. This is further evidence of the homogeneity between groups related to the competence in facial emotion recognition. According to this homogeneity, it is possible to assert the fairness in comparing the two groups on the subsequent and evolutionary emotion competence, which is the production of basic emotions.
Method. To evaluate children’s ability to produce a specific basic emotion, the Basic Emotion Production Test [55] was administered. Each child was tested while seated in front of a therapist who asks him/her to produce one of the basic facial expressions. The requests of the production of facial expressions were provided sequentially to the child as happiness-sadness-fear-anger and the sequence was repeated five times. This way, each child was asked to produce 20 facial expressions and a psychologist assigned 1 point if the emotion was correctly produced and 0 points if the child refused or did not produce the requested emotion. The total score for each child thus ranged from 0 to 20. A video was recorded for each child so that, at the end of the acquisition phase 17 + 10 = 27 videos became available for further processing. Videos were acquired from an off-the-shelf camera (image resolution 1920 × 1080 pixels, 25 fps) and each video was accompanied by information regarding the time instants in which the requests were provided to the child. Each video had a different duration (minimum 1.30 min, maximum 6 min) depending on the degree of collaboration of the child and then on time spent to attract his attention at the beginning or even between one request and another. For all children, the requests were anyway provided to the child with a minimum interval of 4 s from each other. Videos were manually annotated by a team of professionals (3 psychologists with advanced knowledge on issues related to ASD). The professionals watched recorded videos and pointed out, for each request, if the child either performed or not the related facial expression. Table 6 and Table 7 report the annotations carried out by experts for TD and ASD children respectively. Each row indicates the number of correct (second column) and incorrect (third column) productions of the facial expressions according to the items in the first column.

5. Experimental Results

This section reports experimental outcomes gathered by processing acquired videos by the algorithmic pipeline described in Section 3. In particular, a modeling window W m = 2 s and an observation window W o = 4 s were used. The observation window depends on the experimental setting. The interval between two consecutive requests has been set to 4 s by the clinicians. This means that the caregiver has to wait 4 s before moving to the following request for facial expression. The modeling window was consequently set to half of the observation window since lower values were experimentally proved to be not sufficient to model the neutral expression whereas higher values could include the offset of the previous facial expression. The experimental proofs were carried out in different phases. In the first phase, videos related to the TD children were processed and quantitative comparison with the annotations provided by professionals was then performed. In the second phase, the videos related to the ASD children were processed and outputs were subsequently compared with human annotations. As a final experimental phase, outcomes extracted on TD and ASD groups were put together to draw some conclusions from the different distribution of related numerical values.

5.1. Assessment on TD Children

In the first experimental phase, production scores on the group of TD children were computed and their graphic representations are reported in Figure 2, Figure 3, Figure 4 and Figure 5. Please be aware that the highest scores were kept at a value of 1500 in order to increase graph readability.
It is worth to point out that scores come from negative logarithmic functions of likelihood values (see Equation (4)). When the likelihood values become very close to zero (in the case of a modification of action unit during a proper facial expression production) related logarithmic functions tend to very high values. The outcomes greater than 1500 are equivalent to probability values so small that can be considered as 0 (and their logarithms kept as a large constant) for the considered application purposes. In addition, the figures have a different scale on the axes since the gathered scores have a more uniform distribution when related to the upper face part than when related to the lower face part. This is not surprising since the use of the upper face part in emotion production is more difficult and then this can lead to man different levels of ability. For the lower face part, when children start reacting to the request usually their production level goes in saturation to the maximum allowed score. As a consequence, the x-axis has a larger scale to point out that.
In figures, black circles refer to cases in which the team of psychologists labeled facial expressions as compliant with the supplied request (i.e., expressions correctly performed by the child), whereas red circles refer to cases in which the professionals labeled the related facial expressions as not compliant with the supplied requests (i.e., expressions not performed by the child). At first glance, it is quite clear that highest scores were properly associated with occurrences that professionals annotated as expression performed whereas lowest scores were associated with occurrences that professionals annotated as expressions not performed. Going into details, it is of interest to observe that, in correspondence of some requests of the happy face that psychologists annotated as performed, the automatic system gave low outcomes (either for lower or upper face part). This is the case, for example, of the two black spots that are close to the origin of the reference system in Figure 2.
This evident misalignment between manual annotations and automatic scores depended on a wrong positioning of facial landmarks due to occlusions of the mouth (and deformation of cheeks and consequently of eye regions) caused by the hands of the child touching his face. Concerning sad expression there were, once again, some misalignment occurred in case of mouth occlusion (resulting in low scores for lower face part in Figure 3) but, in addition, there were also some occurrences (manually annotated as performed) that experienced low scores only for lower face part (with very high scores for upper face part instead). These happened since, in correspondence to the requests of sad expression, some children occluded the mouth but without affecting the upper face part.
Similar conclusions can be drawn for some spots corresponding to requests of fear expressions (Figure 4) whereas this problem was never encountered during requests of anger expression (Figure 5).
Some clippings in children’s faces corresponding to the aforementioned situations, in which the system was not able to produce reliable results in landmark positioning, are shown in Figure 6. In the reported patches, the landmarks were wrong positioned due to the presence of the hands in front of the mouth. In particular, in Figure 6a,b, two examples in which the child affected the positioning of landmarks for both upper and lower face (for happy and sad expression respectively) are shown. Please observe as the child’s fingers press on his cheeks largely changing his facial features. In Figure 6c,d two examples in which the occlusions by the hands affected only the lower part of the face are reported instead.
To better evaluate the automatic classification of the ability in producing facial expressions, a quantitative comparison with the annotations provided by professionals was performed. It easy to understand that the classification of videos in input, as containing the expected expression or not, depends on the decision threshold on gathered numerical scores for lower and upper face parts. As a consequence, a study related to this crucial parameter of the automatic classification model was preliminary made. Figure 7 reports, in the topmost graphs, the precision and recall curves for the classification of expressions while varying decision threshold. Each figure is related to a different expression and, in each of them, bottom graphs represent the corresponding curves for the F1-score. The best value for the decision threshold, i.e., the value that maximized the related F1-score, is indicated on the x-axis.
According to the above, Table 8 reports classification performance for TD children when the best decision threshold (in terms of F1-score) for each expression was used.
Values in Table 8 demonstrate that the proposed pipeline provides very affordable outcomes, i.e., that computed scores are strictly correlated with annotations provided by professionals. It is very encouraging to observe the overall performance in terms of F1-score (0.84), precision (0.85) and recall (0.83) considering the situational difficulties due to non-collaborative behaviors of children. Moreover, in the evaluation of the system, the occurrence of some subtle executions should be considered in which even the psychologists made a decision for the annotations only after an inter-judge agreement given the initial divergence in judgment. This adds value to the automatic classification system as it highlights its usefulness in the specific application context. This aspect will be further discussed later in Section 7.

5.2. Assessment on ASD Children

In the second experimental phase, the proposed algorithmic pipeline was exploited to gather scores for facial expression production on the group of ASD diagnosed children. The numeric outcomes are graphically reported in Figure 8, Figure 9, Figure 10 and Figure 11.
In this case, the correlation between the scores provided by the system and the psychologists’ manual annotations is even more evident than in the case of TD children. This results by the fact that ASD children were used to not occlude their face while producing facial expression. In the worst cases, the children moved the head or the whole body (even in a stereotyped fashion) but those behaviors were handled by the algorithms that kept a correct positioning and tracking of facial landmarks even in those critical circumstances. What stated above, better emerges by quantitatively comparing the system’s outcomes with the annotations provided by psychologists. Similarly to what reported for TD children, Figure 12 reports, in the topmost graphs, the precision and recall curves for classification of expressions of ASD children while varying decision threshold whereas, in each figure, bottom graphs represent the corresponding curves for the F1-score. The best value for the decision threshold, i.e., the value that maximized the related F1-score, is indicated on the x-axis.
Table 9 reports classification performance for ASD children when using the best decision threshold (in terms of F1-score) for each expression as pointed out in previous figures.
Values in Table 9 demonstrate that, for ASD children, the proposed pipeline provides even more robust outcomes than for TD children, since computed scores showed even higher correlated with annotation provided by psychologists. In particular, the excellent F1-score (0.87), precision (0.90) and recall 0.85) values stand out. Although in this experimental phase subtle executions of facial expressions frequently occurred, from values in the table, it emerged that they were handled by the system in a very robust way.

5.3. TD vs. ASD: How Do the Scores Differ?

As a final experimental phase, outcomes produced by TD and ASD were compared. Figure 13, Figure 14, Figure 15 and Figure 16 merge the scores for TD and ASD children for each of the 4 basic expressions.
In each figure, only spots related to correctly produced (according to annotation by professionals) facial expressions are shown. The ellipses indicate the spreading of the values computed for TD (in magenta) and ASD (in blue) group respectively. They were drawn by using as a spread indicator the eigenvalues of the covariance matrix. The eigenvalues represent the spread in the direction of the eigenvectors, which are the variances under a rotated coordinate system. By definition, a covariance matrix is positive definite therefore all eigenvalues are positive and can be seen as a linear transformation to the data. The actual radii of the ellipse are then the square root of the first two eigenvalues of the scaled covariance matrix. Looking at the figures, it is possible to focus on the strength of emotion production and on which facial part was used by ASD and TD children. It is worth noting that ASD children produced all basic emotions with greater strength than TD children. Furthermore, ASD children were able to use upper and lower facial parts together when they produced happiness, fear and anger expressions. They used instead mainly lower part of the face when producing sadness. TD children integrated upper and lower facial parts when they produced happiness, sadness, and anger expressions whereas they used less the lower part than the upper one when producing anger expression. Further discussion about findings arising from experimental tests will be provided in Section 7.

6. Comparison with Leading Approaches and Technical Discussion

In this section, the outcomes of the performance comparison on the same set of videos with some of the leading approaches in the literature are reported. The comparison concerned three approaches in the literature. The first comparing approach is the one in [8], that shares with the proposed one the same modules for AU intensity estimation and facial expressions quantification but it uses shallow methods instead of convolutional approaches for face detection and facial landmark positioning. In addition two leading approaches performing FER by deep neural networks to process dynamic image sequences were compared: the first one is based on Recurrent Neural Networks (https://github.com/saebrahimi/Emotion-Recognition-RNN) [56] whereas the second one is based cascaded networks (code retrieved from https://github.com/ebadawy/EmotiW2017) [57]. The approach in [56] is a two-step approach that models emotion as the spatio-temporal evolution of image structure. In the first step, CNN is trained to classify static images containing emotions. In the second step, an RNN is trained on the higher layer representation of the CNN inferred from individual frames to predict a single emotion for the entire video. The core module of the system in [57] is a hybrid network that combines a recurrent neural network (RNN) and 3D convolutional networks (C3D). RNN takes appearance features extracted by a convolutional neural network (CNN) over individual video frames as input and encodes motion later, while C3D models appearance and motion of video simultaneously.
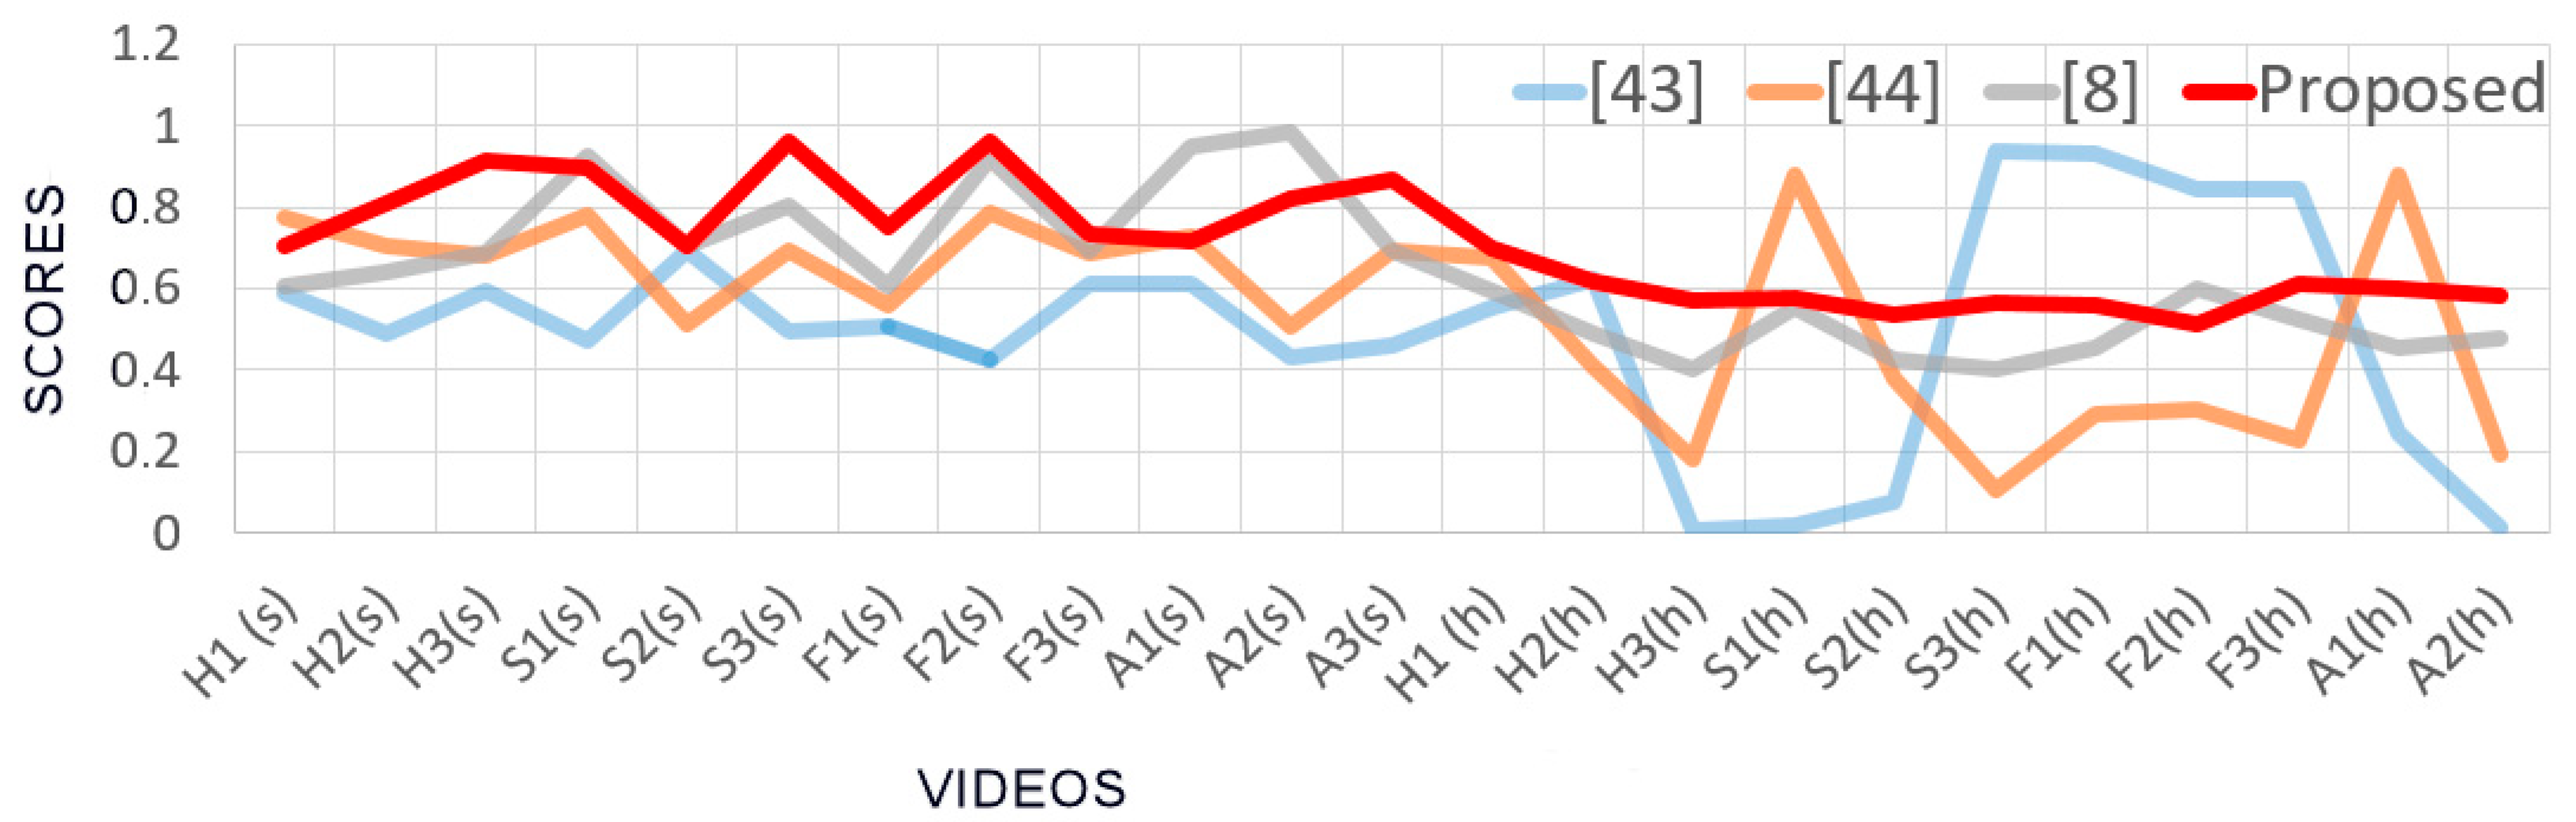
The comparison was accomplished in two steps: the first step was aimed to verify the reliability of the outputs to quantify the ability in producing basic emotions in the considered application context, whereas the second step compares computational outcomes to manual annotations provided by the team of psychologists. In the first step, two subsets of videos concerning ASD children were considered: the first subset consists of 12 videos in which children showed a strong production of required expressions (3 videos for each of the 4 considered basic expressions) whereas the second subset consists of 12 videos in which children reacted with a just hinted production of the required expressions (again 3 for each of the 4 considered basic expressions). In other words, the former videos were selected among those on which the team of psychologists immediately agreed during the annotation process whereas the second subset of videos was built taking sample videos among them in which the team of experts has resorted to an inter-annotator agreement due to the initial disagreement. All the comparing approaches were tested on the selected videos and all the outputs were normalized in [0.0, 1.0] followed by per 4 class re-scaling so that the related scores sum up to 1. In Figure 17 the scores computed by the comparing approaches on the selected videos are reported.
Labels on the x-axis indicate the performed expression (H,S,F,A), the related cardinal number (from 1 to 3) and, in brackets, the belonging subset (s for strong executions and h for hinted executions). What we would like in this case, at the very least, is that highest scores are associated to strongest executions of facial expressions and lowest scores to just hinted executions but, unfortunately, it is possible to observe that for approaches in [56] and [57] this not happened. Sometimes, hinted expressions even drew to scores higher than those obtained for strongly executed expressions. It follows that outcomes of classical approaches (blue and orange lines) are not suitable to quantify the abilities in facial expression production since both approaches showed no significant correlation the strength of the facial expression production and the automatically gathered scores. On the other hand, the approach in [8] (grey line) showed an appreciable level of correlation and the proposed approach a desirable very high level of correlation.
In the second comparison step, the aforementioned approaches were evaluated in terms of accuracy with respect to manual annotations provided by the team of psychologists (on both ASD and TD videos). Table 10 reports the accuracy values related to each comparing method in terms of matching between gathered scores and manual annotations.
At a first glance, from the table, It is evident that CNN based approaches, i.e., the ones in [56,57], perform worse than approaches based on statistical modeling of non-emotional face configurations like the one proposed in this paper and the one introduced in [8]. In fact, besides to provide output scores strictly correlated to the ability in producing a required expression (as the previous comparison proved), the statistical modeling of non-emotional face configurations makes the related frameworks able to adapt their internal parameters to the individual behaviors. Through this desirable feature they can then embed stereotyped movements and to highlight even subtle voluntary movements of facial muscles with respect to the inexpressive facial model, continuously updated, that the system uses as a reference baseline. However, 
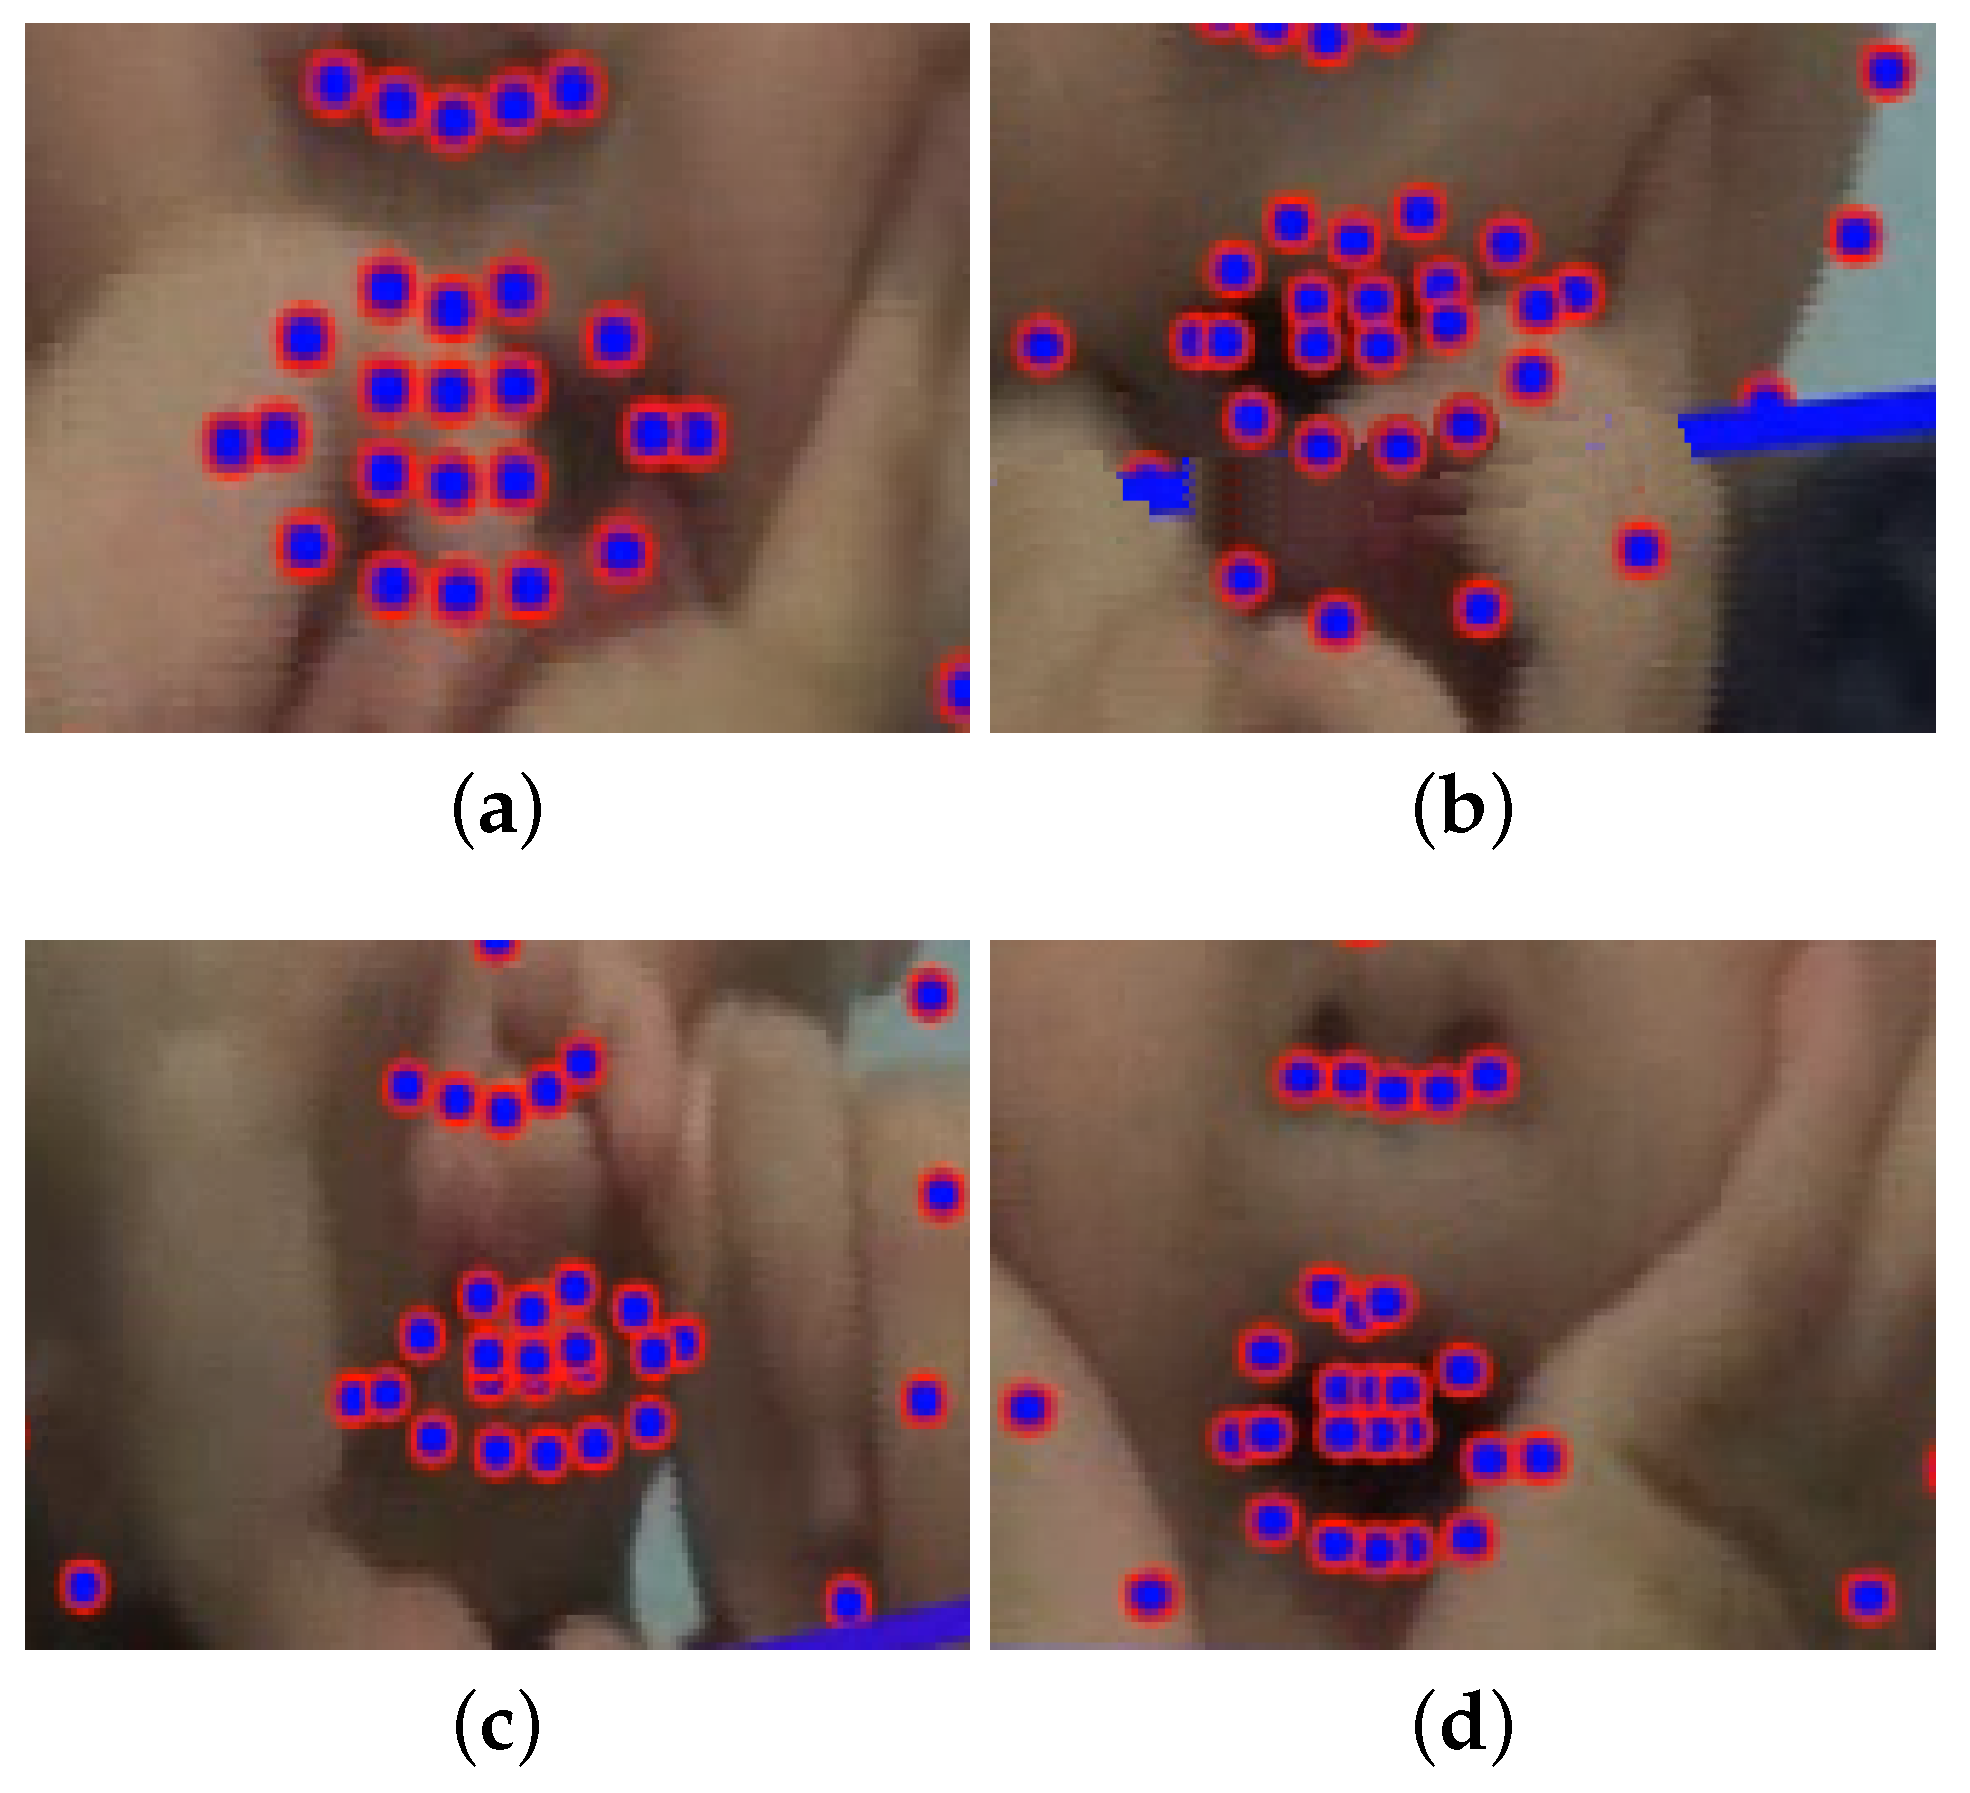
Table 10 shows also that the improved pipeline proposed in this paper is able to better understand actual emotional dynamics of the face by exploiting the capability of introduced convolutional approaches for accurately detect face and to precisely positioning facial landmarks even under severe occlusions and extreme poses. Certainly not all critical situations have been resolved (as reported in Figure 6), but the comparisons make is possible to state that a step forward has been made towards the alignment between the human annotations and the automatic scores provided by an automatic system.
In light of the encouraging experimental results, it is useful to discuss how each component in the proposed pipeline affects the overall performance. The most practical way to derive some useful considerations about this important issue is to deeply analyze the results of the above experimental comparisons. From the first comparison step, it emerged that the face analysis based on a personalized, continuously updated, model of the non-expressive face is a fundamental step to make possible a convincing quantification of the ability in performing facial expression. Besides, given that detecting the face is not a particularly complex task in this context (very few faces, not a cluttered scene, zoomed images), from the second comparing step, it is possible to derive that a key role is played by the landmark detection and tracking step. This is particularly evident by observing outcomes of the proposed approach with respect to the one in [8] in which the same strategy was used to perform the subsequent face analysis. Facial landmark detection algorithms can be categorized into three major categories [58]: holistic methods, Constrained Local Model (CLM) methods, and regression-based methods. Holistic methods require models to represent facial appearance and shape information. CLMs require instead a global shape model but they learn local appearance. Finally, the regression-based methods do not require any information and capture facial shape and appearance information from data. Comparisons made in this paper proved that the use of Convolutional Experts Constrained Local Model introduced a very effective local detector able to model the very complex individual landmark appearance bringing together the advantages of neural architectures and mixtures of experts in an end-to-end framework. This way an individual model of the appearance of each landmark is introduced making it possible to accomplish the landmark detection and tracking tasks in a robust way with respect to occlusions and changes in pose, which are two of the main challenging issues to be addressed in the considered application context.
Besides, experiments proved that Constrained Local Model (CLM) methods can be a more effective solution than regression-based methods, at least for those exploited in [56] and [57]. The last technical consideration relates to processing times. The system in the current version processes about 20 frames per second ( images having HD resolution) on a notebook equipped with an Intel i-7 processor, 32 GB of RAM and GPU RTX 2080. In particular, the face detection module takes on average 50 ms, face landmark positioning takes 5 ms and facial expression analysis takes about 40 ms. To speed up the processing, in order to achieve the aforementioned rate of 20 fps, face detection is carried out only every 8 frames (the tracking trick is used in the meanwhile making the hypothesis very likely to have no abrupt changes of position between one frame and another). It follows that the actual bottleneck is the calculation of Gaussian mixtures for the definition of the non-emotional facial model. It follows that, although the software was designed primarily for offline processing of videos acquired during training sessions, the current implementation of the algorithms could also be exploited to process videos in real-time, for example, to provide positive feedback to the individual receiving therapy (as recommended in some efficient strategies in Applied Behavioral Analysis).

7. Clinical Evaluation of Gathered Outcomes

The purpose of this study was to assess the performance of an automatic system to computationally quantify the children’s ability to produce facial expression of basic emotions. The reference baseline of this evaluation consisted of the manual annotations made by a team of psychologists. Experimental outcomes highlighted a high accuracy in the automatic evaluation for both TD group and ASD group with overall f 1 s c o r e T D = 0.84 and f 1 s c o r e A S D = 0.87 respectively (see Table 8 and Table 9). It is worth noting and discussing here the differences in accuracy and scores distribution for TD (see Figure 2, Figure 3, Figure 4 and Figure 5) and ASD groups (see Figure 8, Figure 9, Figure 10 and Figure 11). First of all, it is possible to observe that the automatic system gathered higher accuracy for ASD children than for TD children. Also, graphical distributions of scores in figures look clearer for ASD group than for TD group in terms of separation among points associated by the psychologists to performed (black spots) and not performed expressions (red spots). This evidence can be explained considering that, in general, TD children produce facial expressions emphasizing them by non-verbal communication (i.e., using hand gestures). According to this, also in the experimental setting, they produced facial expressions in the same way as they are usual to act daily, that is by integrating gesture and facial changes. On the contrary, ASD children, in general, show a deficit or a delay in gestural communication and, above all, in the integration of them with facial expressions. Thus, performances of the automatic system were worse for TD children than for ASD children since gestures used by TD children generated occlusions and altered the appearance of the face, making more complex the detection of facial expressions for the automatic system. An additional purpose of this study was the evaluation of differences in the production of facial expression within groups. Thanks to the use of the automatic system, this evaluation step-up from being dichotomous (performed vs not performed) to a computational level where the two key issues (i.e., the strength of facial expression and level of involvement of facial parts) can be easily detected and evaluated.

8. Conclusions

This paper proposed a novel framework to computationally analyze how both ASD and TD children produce facial expressions. The proposed pipeline was applied to evaluate competence in the production of basic emotions. This competence was evaluated both when it is starting to be acquired in typically developing children and when it is a deficit in ASD children. Numerical outcomes highlighted how the pipeline is accurate (more than existing approaches), quick and objective to evaluate both the strength of facial expressions and how much each facial part is involved in facial expression. The reference baseline consisted of the manual annotations made by a team of psychologists.
It is worth noting how this automatic system could have important implications in the treatment of children who are a deficit in emotional competence (e.g., ASD children) since it is able to identify both facial movements which are not detected by human eyes and their strength. Therefore, it could help professionals to understand (a) if child is starting to produce a specific facial expression, (b) which facial part (upper or lower) is starting to be involved in facial expression and thus enhance it, and finally (c) which facial part is not involved by child in facial expression and thus focus intervention on it. All the above considerations allow concluding that the automatic system could be useful for professionals who treat ASD child to obtain a learning trend of acquisition and production of facial expression of basic emotions.
A limitation of the present study is the sample size. Future works will also deal with the monitoring of the evolution of children’s skills over time to objectively highlight the improvements, for example by comparing the individual ability to produce specific facial expression before and after targeted therapies. Another issue concerns the computation of facial landmarks that, in the proposed approach, were computed without any prior knowledge about the final goal (facial expression recognition) to be accomplished. Several researchers are trying to improve landmark positioning accuracy [59] using different metrics (root mean squared error on ground truth data, some application objective function, landmark detection rate) and different competitions on this topic are hosted in top computer vision conferences [60] revealing excellent performance on the reference datasets. However, there is also a research area that is studying how to specify the landmarks (virtual electromyography sensors) to detect and monitor the facial muscles movements depending on the application context. This is a very interesting perspective and the idea of using size variant patches for landmark detection [61] could help to further improve computational analysis of facial expression production abilities. Learning active landmarks for each AU, i.e., finding the best representative patch size for each landmark in a unified framework is the research line to be pursued. The preliminary experiments have shown that the subtle muscle movements belonging to the upper face require smaller landmark patches while the lower face AUs are detected better in larger patches. How this could impact the outcomes of the proposed pipeline will be investigated in future works.

Author Contributions

Conceptualization, M.L., C.D. and F.L.; Data curation, M.L., P.C., P.S., P.L.M. and A.L.; Formal analysis, M.L. and P.C.; Investigation, M.L., P.C., A.L. and F.L.; Methodology, M.L., P.C., S.P. and A.L.; Project administration, C.D. and F.L.; Resources, A.C.R. and C.P.; Software, M.L., P.C., P.S. and P.L.M.; Supervision, C.D.; Validation, M.L. and P.C.; Visualization, M.L., P.C. and P.S.; Writing—original draft, M.L.; writiing—review and editing, P.C., C.D., P.L.M., A.L., S.P., and F.L.

Funding

This research received no external funding.

Acknowledgments

We are grateful to two no-profit associations (Amici di Nico and L’Adelfia) and to day care (Giocando s’impara) where children were recruited. Furthermore, we are grateful to association therapist’s collaboration. Specifically, the authors would like to thank the psychologists Anna Chiara Rosato, Chiara Pellegrino, Muriel Frascella, Filomena De Lumè, and Giuseppe Antonioli; the educationalists Claudia De Luca e Maria Grazia Rosato to their collaboration in project implementation. We are grateful to all children’s parents who agreed to study. Finally, it is worth highlighting that this study was approved by the L’Adelfia Ethics Committee.

Conflicts of Interest

The authors declare no conflict of interest.

References

  1. Leo, M.; Furnari, A.; Medioni, G.G.; Trivedi, M.; Farinella, G.M. Deep Learning for Assistive Computer Vision. In European Conference on Computer Vision; Springer: Berlin, Germany, 2018; pp. 3–14. [Google Scholar]
  2. Sapiro, G.; Hashemi, J.; Dawson, G. Computer vision and behavioral phenotyping: An autism case study. Curr. Opin. Biomed. Eng. 2019, 9, 14–20. [Google Scholar] [CrossRef]
  3. American Psychiatric Association. Diagnostic and Statistical Manual of Mental Disorders (DSM-5®); American Psychiatric Pub: Washington, DC, USA, 2013. [Google Scholar]
  4. Baio, J.; Wiggins, L.; Christensen, D.L.; Maenner, M.J.; Daniels, J.; Warren, Z.; Kurzius-Spencer, M.; Zahorodny, W.; Rosenberg, C.R.; White, T.; et al. Prevalence of autism spectrum disorder among children aged 8 years—Autism and developmental disabilities monitoring network, 11 sites, United States, 2014. MMWR Surveill. Summaries 2018, 67, 1. [Google Scholar] [CrossRef] [PubMed]
  5. Trevisan, D.A.; Hoskyn, M.; Birmingham, E. Facial Expression Production in Autism: A Meta-Analysis. Autism Res. 2018, 11, 1586–1601. [Google Scholar] [CrossRef] [PubMed]
  6. Weiss, E.M.; Rominger, C.; Hofer, E.; Fink, A.; Papousek, I. Less differentiated facial responses to naturalistic films of another person’s emotional expressions in adolescents and adults with High-Functioning Autism Spectrum Disorder. Progr. Neuro-Psychopharmacol. Biol. Psychiatry 2019, 89, 341–346. [Google Scholar] [CrossRef]
  7. Zhang, S.; Zhang, S.; Huang, T.; Gao, W.; Tian, Q. Learning Affective Features With a Hybrid Deep Model for Audio–Visual Emotion Recognition. IEEE Trans. Circuits Syst. Video Technol. 2018, 28, 3030–3043. [Google Scholar] [CrossRef]
  8. Leo, M.; Carcagnì, P.; Distante, C.; Spagnolo, P.; Mazzeo, P.; Rosato, A.; Petrocchi, S.; Pellegrino, C.; Levante, A.; De Lumè, F.; et al. Computational Assessment of Facial Expression Production in ASD Children. Sensors 2018, 18, 3993. [Google Scholar] [CrossRef]
  9. Bullock, M.; Russell, J.A. Further evidence on preschoolers’ interpretation of facial expressions. Int. J. Behav. Dev. 1985, 8, 15–38. [Google Scholar] [CrossRef]
  10. Cutting, A.L.; Dunn, J. Theory of mind, emotion understanding, language, and family background: Individual differences and interrelations. Child Dev. 1999, 70, 853–865. [Google Scholar] [CrossRef]
  11. Hughes, C.; Dunn, J. Understanding mind and emotion: longitudinal associations with mental-state talk between young friends. Dev. Psychol. 1998, 34, 1026. [Google Scholar] [CrossRef]
  12. Sapiro, G.; Hashemi, J.; Dawson, G. Computer Vision Applications to Computational Behavioral Phenotyping: An Autism Spectrum Disorder Case Study. Curr. Opin. Biomed. Eng. 2018. [Google Scholar] [CrossRef]
  13. Campbell, K.; Carpenter, K.L.; Hashemi, J.; Espinosa, S.; Marsan, S.; Borg, J.S.; Chang, Z.; Qiu, Q.; Vermeer, S.; Adler, E.; et al. Computer vision analysis captures atypical attention in toddlers with autism. Autism 2019, 23, 619–628. [Google Scholar] [CrossRef] [PubMed]
  14. Dawson, G.; Campbell, K.; Hashemi, J.; Lippmann, S.J.; Smith, V.; Carpenter, K.; Egger, H.; Espinosa, S.; Vermeer, S.; Baker, J.; et al. Atypical postural control can be detected via computer vision analysis in toddlers with autism spectrum disorder. Sci. Rep. 2018, 8, 17008. [Google Scholar] [CrossRef] [PubMed]
  15. Rehg, J.M. Behavior Imaging: Using Computer Vision to Study Autism. MVA 2011, 11, 14–21. [Google Scholar]
  16. Hashemi, J.; Spina, T.V.; Tepper, M.; Esler, A.; Morellas, V.; Papanikolopoulos, N.; Sapiro, G. A computer vision approach for the assessment of autism-related behavioral markers. In Proceedings of the 2012 IEEE International Conference on Development and Learning and Epigenetic Robotics (ICDL), San Diego, CA, USA, 7–9 November 2012; pp. 1–7. [Google Scholar]
  17. Walecki, R.; Rudovic, O.; Pavlovic, V.; Schuller, B.; Pantic, M. Deep structured learning for facial expression intensity estimation. Image Vis. Comput. 2017, 259, 143–154. [Google Scholar]
  18. Tie, Y.; Guan, L. A Deformable 3-D Facial Expression Model for Dynamic Human Emotional State Recognition. IEEE Trans. Circuits Syst. Video Technol. 2013, 23, 142–157. [Google Scholar] [CrossRef]
  19. Guha, T.; Yang, Z.; Grossman, R.B.; Narayanan, S.S. A computational study of expressive facial dynamics in children with autism. IEEE Trans. Affect. Comput. 2018, 9, 14–20. [Google Scholar] [CrossRef]
  20. Del Coco, M.; Leo, M.; Carcagnì, P.; Spagnolo, P.; Mazzeo, P.L.; Bernava, G.M.; Marino, F.; Pioggia, G.; Distante, C. A Computer Vision Based Approach for Understanding Emotional Involvements in Children with Autism Spectrum Disorders. In Proceedings of the ICCV Workshops, Venice, Italy, 22–29 October 2017; pp. 1401–1407. [Google Scholar]
  21. Egger, H.L.; Dawson, G.; Hashemi, J.; Carpenter, K.L.; Espinosa, S.; Campbell, K.; Brotkin, S.; Schaich-Borg, J.; Qiu, Q.; Tepper, M.; et al. Automatic emotion and attention analysis of young children at home: A ResearchKit autism feasibility study. npj Digit. Med. 2018, 1, 20. [Google Scholar] [CrossRef]
  22. Samad, M.D.; Diawara, N.; Bobzien, J.L.; Taylor, C.M.; Harrington, J.W.; Iftekharuddin, K.M. A pilot study to identify autism related traits in spontaneous facial actions using computer vision. Res. Autism Spectr. Disord. 2019, 65, 14–24. [Google Scholar] [CrossRef]
  23. Hashemi, J.; Dawson, G.; Carpenter, K.L.; Campbell, K.; Qiu, Q.; Espinosa, S.; Marsan, S.; Baker, J.P.; Egger, H.L.; Sapiro, G. Computer vision analysis for quantification of autism risk behaviors. IEEE Trans. Affect. Comput. 2018. [Google Scholar] [CrossRef]
  24. Li, B.; Mehta, S.; Aneja, D.; Foster, C.E.; Ventola, P.; Shic, F.; Shapiro, L.G. A Facial Affect Analysis System for Autism Spectrum Disorder. arXiv, 2019; arXiv:abs/1904.03616. [Google Scholar]
  25. Zeng, N.; Zhang, H.; Song, B.; Liu, W.; Li, Y.; Dobaie, A.M. Facial expression recognition via learning deep sparse autoencoders. Neurocomputing 2018, 273, 643–649. [Google Scholar] [CrossRef]
  26. Kollias, D.; Tzirakis, P.; Nicolaou, M.A.; Papaioannou, A.; Zhao, G.; Schuller, B.; Kotsia, I.; Zafeiriou, S. Deep affect prediction in-the-wild: Aff-wild database and challenge, deep architectures, and beyond. Int. J. Comput. Vis. 2019, 127, 907–929. [Google Scholar] [CrossRef]
  27. Georgescu, M.I.; Ionescu, R.T.; Popescu, M. Local learning with deep and handcrafted features for facial expression recognition. IEEE Access 2019, 7, 64827–64836. [Google Scholar] [CrossRef]
  28. Kong, F. Facial expression recognition method based on deep convolutional neural network combined with improved LBP features. Pers. Ubiquitous Comput. 2019, 23, 1–9. [Google Scholar] [CrossRef]
  29. Chang, F.J.; Tran, A.T.; Hassner, T.; Masi, I.; Nevatia, R.; Medioni, G. ExpNet: Landmark-free, deep, 3D facial expressions. In Proceedings of the 2018 13th IEEE International Conference on Automatic Face & Gesture Recognition (FG 2018), Xi’an, China, 15–19 May 2018; pp. 122–129. [Google Scholar]
  30. Miao, Y.; Dong, H.; Jaam, J.M.A.; Saddik, A.E. A Deep Learning System for Recognizing Facial Expression in Real-Time. ACM Trans. Multimed. Comput. Commun. Appl. (TOMM) 2019, 15, 33. [Google Scholar] [CrossRef]
  31. Zong, Y.; Huang, X.; Zheng, W.; Cui, Z.; Zhao, G. Learning from hierarchical spatiotemporal descriptors for micro-expression recognition. IEEE Trans. Multimed. 2018, 20, 3160–3172. [Google Scholar] [CrossRef]
  32. Li, S.; Deng, W. Deep facial expression recognition: A survey. arXiv, 2018; arXiv:1804.08348. [Google Scholar]
  33. Ko, B. A brief review of facial emotion recognition based on visual information. Sensors 2018, 18, 401. [Google Scholar] [CrossRef]
  34. Zhao, R.; Gan, Q.; Wang, S.; Ji, Q. Facial Expression Intensity Estimation Using Ordinal Information. In Proceedings of the IEEE Conference on Computer Vision and Pattern Recognition (CVPR), Las Vegas, NV, USA, 27–30 June 2016. [Google Scholar]
  35. Zhang, K.; Zhang, Z.; Li, Z.; Qiao, Y. Joint face detection and alignment using multitask cascaded convolutional networks. IEEE Signal Process. Lett. 2016, 23, 1499–1503. [Google Scholar] [CrossRef]
  36. Baltrusaitis, T.; Zadeh, A.; Lim, Y.C.; Morency, L. OpenFace 2.0: Facial Behavior Analysis Toolkit. In Proceedings of the 2018 13th IEEE International Conference on Automatic Face Gesture Recognition (FG 2018), Xi’an, China, 15–19 May 2018; pp. 59–66. [Google Scholar] [CrossRef]
  37. Yang, S.; Luo, P.; Loy, C.C.; Tang, X. WIDER FACE: A Face Detection Benchmark. In Proceedings of the IEEE Conference on Computer Vision and Pattern Recognition (CVPR), Las Vegas, NV, USA, 27–30 June 2016. [Google Scholar]
  38. Liu, Z.; Luo, P.; Wang, X.; Tang, X. Deep Learning Face Attributes in the Wild. In Proceedings of the International Conference on Computer Vision (ICCV), Tampa, FL, USA, 7–13 December 2015. [Google Scholar]
  39. Zadeh, A.; Chong Lim, Y.; Baltrusaitis, T.; Morency, L.P. Convolutional experts constrained local model for 3d facial landmark detection. In Proceedings of the IEEE International Conference on Computer Vision, Venice, Italy, 22–29 October 2017; pp. 2519–2528. [Google Scholar]
  40. Saragih, J.M.; Lucey, S.; Cohn, J.F. Deformable model fitting by regularized landmark mean-shift. Int. J. Comput. Vis. 2011, 91, 200–215. [Google Scholar] [CrossRef]
  41. Smola, A.J.; Schölkopf, B. A tutorial on support vector regression. Stat. Comput. 2004, 14, 199–222. [Google Scholar] [CrossRef] [Green Version]
  42. Baltrušaitis, T.; Mahmoud, M.; Robinson, P. Cross-dataset learning and person-specific normalisation for automatic action unit detection. In Proceedings of the 2015 11th IEEE International Conference and Workshops on Automatic Face and Gesture Recognition (FG), Ljubljana, Slovenia, 4–8 May 2015; Volume 6, pp. 1–6. [Google Scholar]
  43. Felzenszwalb, P.F.; Girshick, R.B.; McAllester, D.; Ramanan, D. Object detection with discriminatively trained part-based models. IEEE Trans. Pattern Anal. Mach. Intell. 2010, 32, 1627–1645. [Google Scholar] [CrossRef] [PubMed]
  44. Mavadati, S.M.; Mahoor, M.H.; Bartlett, K.; Trinh, P.; Cohn, J.F. Disfa: A spontaneous facial action intensity database. IEEE Trans. Affect. Comput. 2013, 4, 151–160. [Google Scholar] [CrossRef]
  45. McKeown, G.; Valstar, M.F.; Cowie, R.; Pantic, M. The SEMAINE corpus of emotionally coloured character interactions. In Proceedings of the 2010 IEEE International Conference on Multimedia and Expo (ICME), Suntec City, Singapore, 19–23 July 2010; pp. 1079–1084. [Google Scholar]
  46. Zhang, X.; Yin, L.; Cohn, J.F.; Canavan, S.; Reale, M.; Horowitz, A.; Liu, P.; Girard, J.M. Bp4d-spontaneous: A high-resolution spontaneous 3d dynamic facial expression database. Image Vis. Comput. 2014, 32, 692–706. [Google Scholar] [CrossRef]
  47. Acharya, D.; Rani, A.; Agarwal, S.; Singh, V. Application of adaptive Savitzky–Golay filter for EEG signal processing. Perspect. Sci. 2016, 8, 677–679. [Google Scholar] [CrossRef]
  48. Wang, Z.; Li, Y.; Wang, S.; Ji, Q. Capturing global semantic relationships for facial action unit recognition. In Proceedings of the 2013 IEEE International Conference on Computer Vision (ICCV), Sydney, Australia, 1–8 December 2013; pp. 3304–3311. [Google Scholar]
  49. Lucey, P.; Cohn, J.F.; Kanade, T.; Saragih, J.; Ambadar, Z.; Matthews, I. The Extended Cohn-Kanade Dataset (CK+): A complete dataset for action unit and emotion-specified expression. In Proceedings of the 2010 IEEE Computer Society Conference on Computer Vision and Pattern Recognition—Workshops, San Francisco, CA, USA, 13–18 June 2010; pp. 94–101. [Google Scholar] [CrossRef]
  50. Ekman, P.; Friesen, W.V.; Ellsworth, P. Emotion in the Human Face: Guide-lines for Research and an Integration of Findings: Guidelines for Research and an Integration of Findings; Pergamon Press: Pergamon, Turkey, 1972. [Google Scholar]
  51. Gotham, K.; Risi, S.; Pickles, A.; Lord, C. The Autism Diagnostic Observation Schedule: revised algorithms for improved diagnostic validity. J. Autism Dev. Disord. 2007, 37, 613. [Google Scholar] [CrossRef]
  52. Raven, J.C. Guide to Using the Coloured Progressive Matrices; HK Lewis & Co.: London, UK, 1958. [Google Scholar]
  53. Gong, X.; Huang, Y.X.; Wang, Y.; Luo, Y.J. Revision of the Chinese facial affective picture system. Chin. Ment. Health J. 2011, 25, 40–46. [Google Scholar]
  54. Lecciso, F.; Levante, A.; Petrocchi, S.; De Lumé, F. Facial Emotion Recognition, Italian Adaptation; Technical Report; Department of History, Society, and Human Studies, University of Salento: Salento, Italy, 2017. [Google Scholar]
  55. Lecciso, F.; Levante, A.; Petrocchi, S.; De Lumé, F. Basic Emotion Production Test; Technical Report; Department of History, Society, and Human Studies, University of Salento: Salento, Italy, 2017. [Google Scholar]
  56. Ebrahimi Kahou, S.; Michalski, V.; Konda, K.; Memisevic, R.; Pal, C. Recurrent neural networks for emotion recognition in video. In Proceedings of the 2015 ACM on International Conference on Multimodal Interaction, Seattle, WA, USA, 9–13 November 2015; pp. 467–474. [Google Scholar]
  57. Fan, Y.; Lu, X.; Li, D.; Liu, Y. Video-based Emotion Recognition Using CNN-RNN and C3D Hybrid Networks. In Proceedings of the 18th ACM International Conference on Multimodal Interaction, Tokyo, Japan, 12–16 November 2016; ACM: New York, NY, USA, 2016; pp. 445–450. [Google Scholar] [CrossRef]
  58. Wu, Y.; Ji, Q. Facial landmark detection: A literature survey. Int. J. Comput. Vis. 2019, 127, 115–142. [Google Scholar] [CrossRef]
  59. Johnston, B.; de Chazal, P. A review of image-based automatic facial landmark identification techniques. EURASIP J. Image Video Process. 2018, 2018, 86. [Google Scholar] [CrossRef] [Green Version]
  60. Zafeiriou, S.; Trigeorgis, G.; Chrysos, G.; Deng, J.; Shen, J. The menpo facial landmark localisation challenge: A step towards the solution. In Proceedings of the IEEE Conference on Computer Vision and Pattern Recognition Workshops, Honolulu, HI, USA, 21–26 July 2017; pp. 170–179. [Google Scholar]
  61. Cakir, D.; Arica, N. Size variant landmark patches for Facial Action Unit detection. In Proceedings of the 2016 IEEE 7th Annual Information Technology, Electronics and Mobile Communication Conference (IEMCON), Vancouver, BC, Canada, 13–15 October 2016; pp. 1–4. [Google Scholar] [CrossRef]
Figure 1. The proposed algorithmic pipeline. The figure points out, by the horizontal dotted line and the blocks differently colored, that the two modules (face detection and facial landmark detection and tracking) above the dotted line (colored in light orange) are the ones heavily improved with regards to the former work in [8].
Applsci 09 04542 g001
Figure 2. Scores computed for the production of Happy expressions by TD children.
Applsci 09 04542 g002
Figure 3. Scores computed for the production of Sad expressions by TD children.
Applsci 09 04542 g003
Figure 4. Scores computed for the production of Fear expressions by TD children.
Applsci 09 04542 g004
Figure 5. Scores computed for the production of Anger expressions by TD children.
Applsci 09 04542 g005
Figure 6. Some situations that generated miss matches between the outcomes of the system and the annotations of experts: (a) the child affected the positioning of landmarks for both upper and lower face parts while performing a happy expression; (b) the child affected the positioning of landmarks for both upper and lower face parts while performing a sad expression; (c) the child affected the positioning of landmarks for only the lower part of the face while performing an anger expression; (d) the child affected the positioning of landmarks for only the lower part of the face while performing a fear expression.
Applsci 09 04542 g006
Figure 7. Expressions by TD children: classification accordance between system and experts while varying decision threshold.
Applsci 09 04542 g007
Figure 8. Scores computed for the production of Happy expressions by ASD children.
Applsci 09 04542 g008
Figure 9. Scores computed for the production of Sad expressions by ASD children.
Applsci 09 04542 g009
Figure 10. Scores computed for the production of Fear expressions by ASD children.
Applsci 09 04542 g010
Figure 11. Scores computed for the production of Anger expressions by ASD children.
Applsci 09 04542 g011
Figure 12. Expressions by ASD children: Classification accordance between system and experts while varying decision threshold.
Applsci 09 04542 g012
Figure 13. Comparison of the scores computed for the production of Happy expressions by ASD and TD children.
Applsci 09 04542 g013
Figure 14. Comparison of the scores computed for the production of Sad expressions by ASD and TD children.
Applsci 09 04542 g014
Figure 15. Comparison of the scores computed for the production of Fear expressions by ASD and TD children.
Applsci 09 04542 g015
Figure 16. Comparison of the scores computed for the production of Anger expressions by ASD and TD children.
Applsci 09 04542 g016
Figure 17. Comparison of the scores computed by different approaches on two subsets of videos containing strongly and hinted execution of facial expressions.
Applsci 09 04542 g017
Table 1. The most relevant prior works in the literature.
Prior WorksHeadGaze andMotorBodyFaceValidation
MovementAttentionAnalysisMotionAnalysis
[16]x xx expert clinician
[15] x manual annotation
[13]xx human rater
[14]x ASD vs. TD
[19] xASD vs. TD
[20] xASD vs. TD
[21] xASD vs. TD
[22] xASD vs. TD
[24] xdiagnostic labels
(ASD/non-ASD)
[23]x xexpert human raters
(smiling/not smiling)
[8] xexpert psychologists
(only on ASD Group)
Table 2. Computational measures of production ability for H = Happiness; S = Sadness; F = Fear; A = Anger. lower and upper facial part are indicated by u f and l f subscripts respectively. Time index has been omitted for better table readability.
ExpressionMeasures
H M u f H = V A U 6
M l f H = V A U 12
S M u f S = m a x ( V A U 1 , V A U 4 )
M l f S = V A U 15
F M u f F = m i n ( m a x ( V A U 1 , V A U 2 ) , V A U 4 , V A U 5 )
M l f F = m a x ( V A U 20 , V A U 26 )
A M u f A = m a x ( V A U 4 , V A U 5 , V A U 7 )
M l f A = m a x ( m a x ( V A U 9 , V A U 23 ) , m i n ( V A U 17 , V A U 25 ) )
Table 3. Description of the sample divided by children’s group. Standard deviation is in the bracket. Note that for the level of education “high” means at least 13 years of education whereas “low” indicates 5–8 years of education.
VariablesASD GroupTD Group
Children’s genderM = 13; F = 4M = 6: F = 4
Average children’s age8.9 years (2.47)31.35 (3.11)
Children’s birth orderFirst born = 10First born = 6
Second-born and more = 5Second-born and more = 4
Mother’s mean age *43.3 (4.6)36.9 (4.95)
Father’s mean age *47.3 (3.9)41 (7.45)
Level of maternal educationHigh = 15; Low = 2High = 9; Low = 1
Level of paternal educationHigh = 14; Low = 3High = 7; Low = 3
* Variables showing standard deviation values are marked with an asterisk.
Table 4. Scores achieved by the typically developing (TD) group in the Facial Emotion Recognition (FER) task.
EmotionRecognizedNot Recognized
Happiness35 (70%)15 (30%)
Sadness31 (62%)19 (38%)
Fear29 (57.9%)21 (42.1%)
Anger29 (57.9%)21 (42.1%)
TOT.124 (62%)76 (38%)
Table 5. Scores achieved by the Autism Spectrum Disorders (ASD) group in the FER task.
EmotionRecognizedNot Recognized
Happiness85 (100%)-
Sadness79 (92.9%)6 (7.1%)
Fear76 (89.4%)9 (10.6%)
Anger80 (94.1%)5 (5.9%)
TOT.320 (94.1%)20 (5.9%)
Table 6. Overview of the annotations carried out by the team of experts for TD children.
Facial ExpressionPerformedNot Performed
Happy35 (70%)15 (30%)
Sad25 (50%)25 (50%)
Fear26 (52%)24 (48%)
Anger17 (34%)33 (66%)
TOTAL103 (51%)97 (49%)
Table 7. Overview of the annotations carried out by the team of experts for ASD children.
Facial ExpressionPerformedNot Performed
Happy57 (67%)28 (33%)
Sad26 (31%)59 (69%)
Fear22 (26%)63 (74%)
Anger47 (55%)38 (45%)
TOTAL152 (45%)188 (55%)
Table 8. Accuracy of the automatic system with respect to manual annotations for TD children when the best decision threshold (in terms of F1-score) for each expression was used.
TD ChildrenThF1PRTPFPFNTN
H630.870.840.9132/356/153/359/15
91%40%9%60%
S780.8010.6817/250/258/2525/25
68%1%32%100%
F450.790.710.8823/269/243/2615/24
88%38%12%62%
A1080.8610.7613/170/334/1733/33
76%0%24%100%
Overall rating 0.840.850.8383%15%17%85%
Table 9. Accuracy of the automatic system with respect to manual annotations for ASD children when the best decision threshold (in terms of F1-score) for each expression was used.
ASD ChildrenThf1PRTPFPFNTN
H1160.9410.8951/570/286/5728/28
89%0%10%100%
S1080.760.850.6918/263/598/2656/59
69%5%31%95%
F930.710.820.6314/223/638/2260/63
64%5%36%95%
A1230.910.850.9746/478/381/4730/38
98%21%2%79%
Overall rating 0.870.900.8585%7%15%93%
Table 10. Quantitative comparison with some state-of-the-art approaches.
Methodf1PRTPFPFNTN
[56]0.800.790.8179%17%21%83%
[57]0.810.820.8080%15%20%85%
[8]0.820.830.8282%14%18%86%
Proposed0.860.880.8584%10%16%90%

