Featured Application
The proposed framework is capable of analyzing the flow of numerous objects in real time on the basis of a new process anomaly detection approach that considers the manufacturing process of an autonomous and adaptive smart factory.
Abstract
Factories of the future are foreseen to evolve into smart factories with autonomous and adaptive manufacturing processes. However, the increasing complexity of the network of manufacturing processes is expected to complicate the rapid detection of process anomalies in real time. This paper proposes an architecture framework and method for the implementation of the Scalable On-line Anomaly Detection System (SOADS), which can detect process anomalies via real-time processing and analyze large amounts of process execution data in the context of autonomous and adaptive manufacturing processes. The design of this system architecture framework entailed the derivation of standard subsequence patterns using the PrefixSpan algorithm, a sequential pattern algorithm. The anomalies of the real-time event streams and derived subsequence patterns were scored using the Smith-Waterman algorithm, a sequence alignment algorithm. The excellence of the proposed system was verified by measuring the time for deriving subsequence patterns and by obtaining the anomaly scoring time from large event logs. The proposed system succeeded in large-scale data processing and analysis, one of the requirements for a smart factory, by using Apache Spark streaming and Apache Hbase, and is expected to become the basis of anomaly detection systems of smart factories.
1. Introduction
The fourth industrial revolution represented by Big Data, artificial intelligence, and Internet of Things (IoT) technologies is dramatically transforming global industries. Particularly in the manufacturing industry, many countries including Germany, the United States, and Japan are striving to achieve competitive advantage in manufacturing by establishing future-oriented and advanced manufacturing paradigms such as “Industry 4.0,” “Smart Manufacturing,” and “Smart Factory” [1,2]. Factories designed to support the automation of defined production processes are foreseen to become the smart factories of the future by evolving into next-generation autonomous and adaptive factories capable of real-time production monitoring, real-time process optimization, customized flexible production, and real-time quality diagnosis and prediction by analyzing the Big Data collected via the IoT [3,4,5].
The production paradigm is changing from low variety high-volume production to high variety low-volume production, and to customized, personalized production owing to the increasingly versatile customer needs, resulting market fluctuations, and extreme competition in the global environment. Accordingly, manufacturers need to introduce the concepts of flexibility and variability to respond to various changes [6]. Typical examples of next-generation smart factories preparing for future production paradigms are the Adidas speed factory [7] and the EU’s F3 (Flexible, Fast, Future) factory [7]. In particular, the F3 factory is a smart factory that implements modular equipment and constructs and operates the production line similar to assembling Lego blocks in accordance with customer needs. A factory with modular production equipment for variability and flexibility and the ability to immediately implement an optimized production system through the integration of Big Data and artificial intelligence could be referred to as an autonomous and adaptive smart factory that satisfies customized, personalized production.
However, the actualization of an autonomous and adaptive smart factory would be expected to complicate the process operation and management because of the increased variation of the process. In addition, it would be difficult to determine whether the composition of the dynamic production line and scheduling and dispatching results are optimal in the long run. Likewise, anomalies of the current process would be difficult to identify. This is because to determine a process anomaly would require the predefined process model to be compared with the process that is actually implemented; however, in an autonomous and adaptive process, it is difficult to define or derive a standard process model from start to finish, and anomalies cannot be detected by the traditional method.
Traditionally, for process anomaly detection, structural or property differences (e.g., lead time, bottlenecks) of the process are discovered by comparing the predefined process or the process model derived from logs with the actually implemented process instances (or cases) [8,9,10,11]. At this time, the process mining technique could be used appropriately. Process mining is an activity that derives a process model from logs accumulated in the operational database and compares the predefined process model with the actually implemented process log (conformance checking), and enhances the process model by identifying bottlenecks or anomalous aspects of the process [12]. Recent studies have developed methods to derive a process model in real time [13,14,15] and discover anomalies by aligning on-stream data with the process model in real time [16,17]. However, applying these results to autonomous and adaptive manufacturing processes is problematic. This is because process anomaly detection using the process mining technique targets various process instances (cases) that have actually been performed in situations where the start and finish positions of the process are mostly identical as the object of analysis.
However, in autonomous and adaptive manufacturing processes, even the same products may have different start and finish positions and the material process flows are diverse. As a result, different cases are unlikely to converge to a certain path, and a spaghetti-like process model [18] with a very complex network, instead of a well-structured process model, is likely to be derived. Furthermore, from a computing perspective, it would be highly unreasonable to determine an anomalous situation by alignment with the spaghetti-like process model while recording the path of each product in a factory in which several thousands of products flow.
This motivated us to propose the Scalable Online Anomaly Detection System (SOADS). This system is capable of analyzing the flow of numerous objects in real time on the basis of a new process anomaly detection approach that considers the manufacturing process of an autonomous and adaptive smart factory. Our proposed approach derives multi-frequency subsequence patterns by analyzing the actually implemented process log and determines the overall process anomaly in a smart factory at every moment by comparing the subsequence patterns with the behavior of the flow of each object (that is, sequence) acquired from real-time event streams. The proposed system satisfies the requirements of a large-scale system by using a Big Data processing and analysis framework and real-time distribution streaming technology to track numerous object IDs, derive subsequence patterns, and detect process anomalies in real time in a smart factory.
The remaining part of this paper is organized as follows. Section 2 reviews existing work related to anomaly detection using event logs. Section 3 explains the overall architecture, subsystems, and the components of the subsystems of the SOADS and describes the implementation methodology. Section 4 describes the subsequence pattern derivation speed according to the data storage quantity in a distributed cluster environment and the results of a real-time anomaly determination speed evaluation test. Finally, Section 5 presents the summary, contributions, and limitations of this study and alludes to future research plans.
2. Anomaly Detection from Event Log
Anomalies are data patterns that deviate from the defined normal data patterns [19]. Anomaly Detection is therefore intended to find data that show unexpected patterns. In the early years, Anomaly Detection involved specifying data thresholds and using inductive learning [20]. Later, methods to classify normality and anomalous behavior using classification techniques such as support vector machine (SVM) and neural network were used [21,22,23]. In the field of business process management, Anomaly Detection is used to identify abnormal flows by comparing the defined process model or the process model derived from the event log with the actual event log. For this purpose, conformance checking was used [24,25]. Furthermore, studies to derive high-frequency patterns and detect anomalies by using data such as object or material flows and trajectories have been conducted in manufacturing, transportation, and logistics as well as in the field of business process management [26,27].
2.1. Conformance Checking in a Business Process Area
Conformance Checking involves the comparison of event data generated in the process with the defined process model. Initially, the log replay method, which replays a token in the process model was used for conformance checking [8,28]. Later, the trace alignment method, which compares the symmetry between the modeled process and the event log recorded in the performance stage, was introduced and quickly established as the de facto standard in this field [10,29,30,31,32]. The traditional conformance checking method has been post-mortem analysis, which compares data collected for a certain period with the model. However, the recent emergence of Big Data and real-time data processing technology, prompted studies to detect anomalies online by comparing event logs generated in real time with the process model [16,17,33]. Furthermore, as the amount of data increases with the progress of the process, conformance checking by processing and analyzing large event logs has been researched [34,35,36]. Most studies on conformance checking have been conducted from the perspective of control flow, although a few of these studies have been conducted from the perspective of time, data properties, and data flow [37,38,39,40,41].
2.2. Anomaly Detection Beyond the Business Process
Similar to conformance checking in the field of business processes, many studies have investigated anomaly detection by comparing process patterns and event logs derived from a variety of fields including manufacturing, transportation, logistics, and information communication networks. Škulj et al. [42] modeled material flow using a dynamic network model to manage material flow at work sites. They proposed an algorithm to detect the flow of materials that move out of the network and verified its performance by using industrial data. Ladiges et al. [43] suggested a method to automatically derive the material flow of a manufacturing system by using input and output signals and expressing them in a petri net. They then detected anomalies using a token replay method. To test whether airplanes keep to their specified routes, Reynolds and Hansman [44] proposed a model-based anomaly detection framework and verified it based on airplane operation scenarios of airplanes that follow their intended trajectory, inappropriate airplanes, and vague airplanes. Zhouyu et al. [45] extracted the trajectories of vehicles from transportation CCTVs, derived a normal trajectory using the spectrum clustering method, and suggested an anomaly detection method that can identify vehicles that deviate from the trajectory. Zhou et al. [46] proposed an algorithm that can detect when moving objects have an abnormal trajectory after deriving a normal trajectory of objects in a monitoring video using spectrum clustering. To verify this, they conducted an experiment to detect anomalies using indoor and outdoor CCTV images. Zhang et al. [47] proposed a method for detecting isolation-based anomalies after grouping traces with the same origin and detection by using data from the GPS device mounted in taxis. They conducted an experiment to verify the proposed anomaly detection algorithm using actual taxi operation records in China. Camossi et al. [48] suggested an algorithm for detecting the transportation of suspicious containers in the transportation schedules by learning general container transportation schedules using SVM. Then they conducted an experiment to verify the algorithm by using the container transportation records for a period of 3 years. Kwon et al. [49] proposed a framework that detects abnormal behavior of the network process after learning the general network process in the field of network security by using deep learning algorithms such as a recurrent neural network (RNN) and deep neural network (DNN). They verified the performance of this algorithm using the KDDCup 1999 dataset.
3. Scalable On-line Anomaly Detection System (SOADS)
This section presents the architecture framework of the Scalable On-line Anomaly Detection System (SOADS). In addition, the subsystems of this system, the roles of major components in the subsystems, the input and output data flow of each component, the concrete algorithm, and its implementation method are described.
3.1. Architecture of SOADS
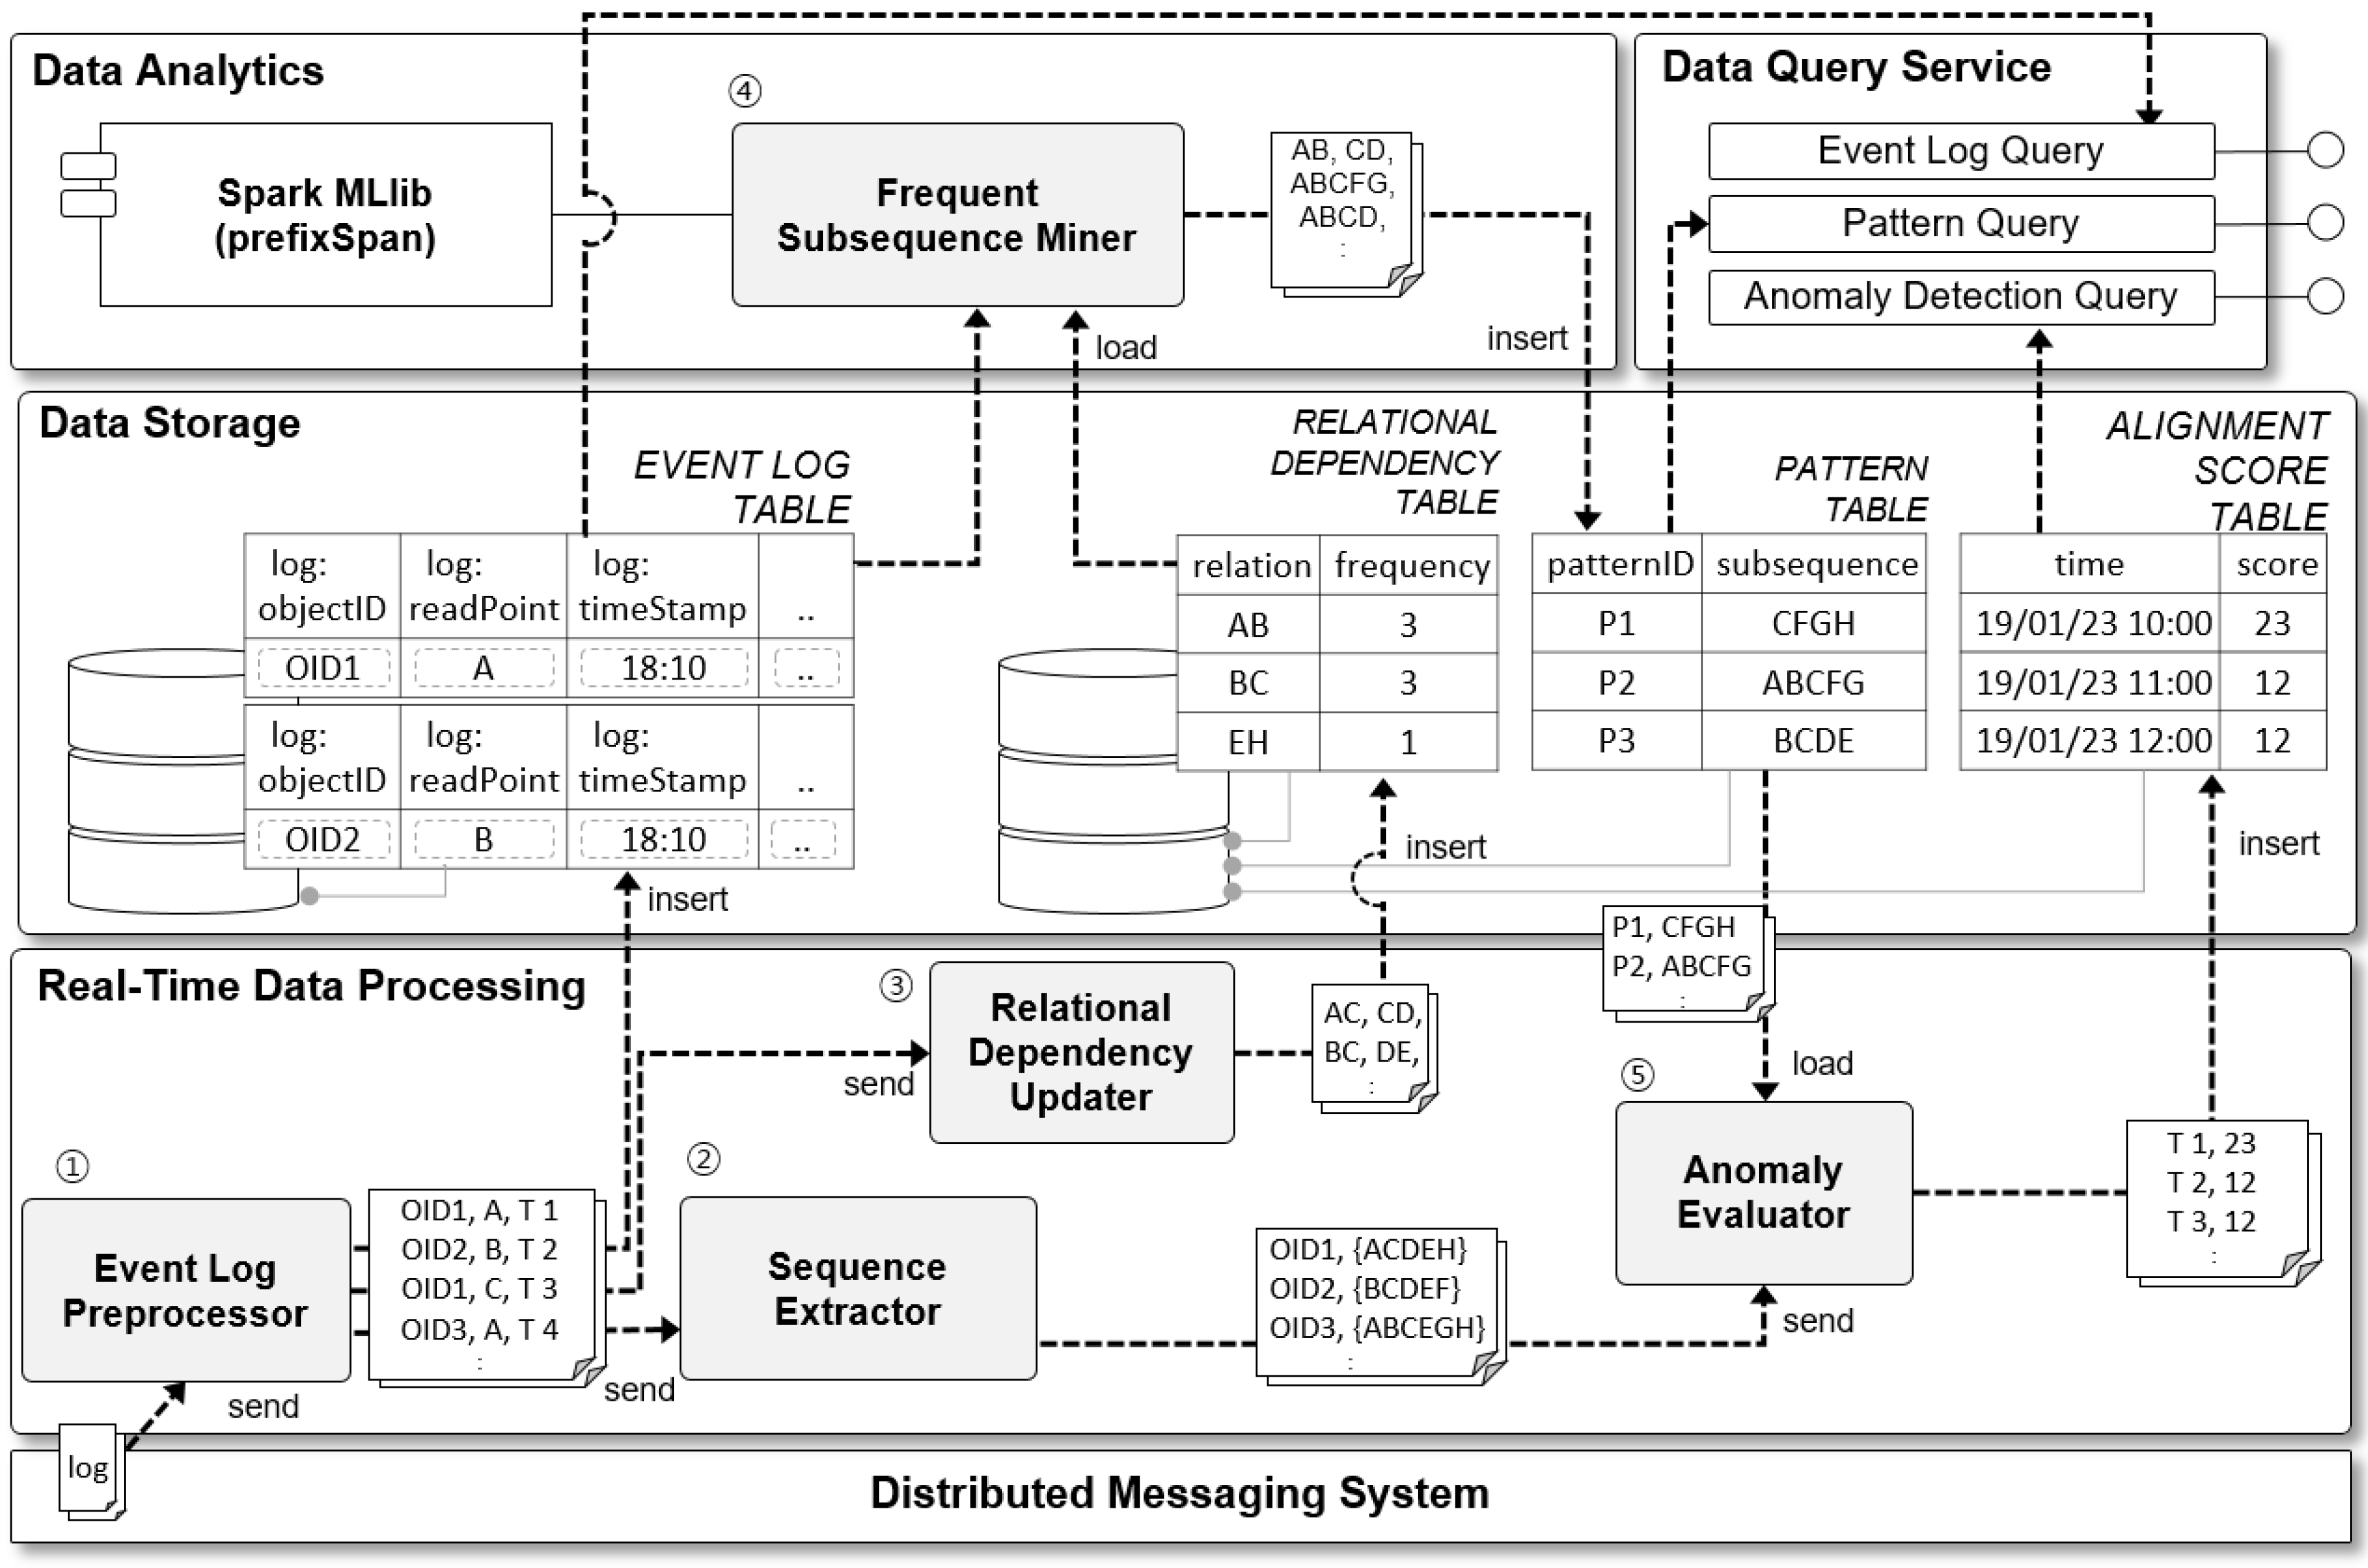
The SOADS is composed of five subsystems as shown in Figure 1. The name of each subsystem is, from the bottom layer, Distributed Messaging System, Real-Time Data Processing, Data Storage, Data Analytics, and Data Query Service.
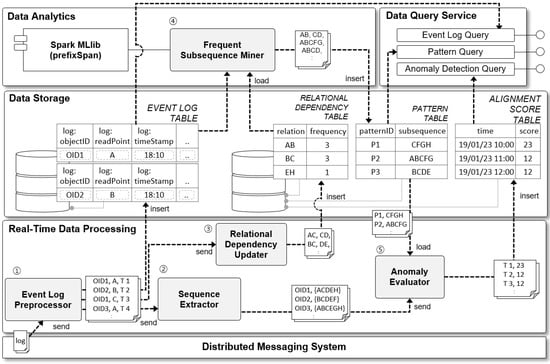
Figure 1.
Scalable On-line Process Anomaly Detection System Architecture.
The Distributed Messaging subsystem plays the role of collecting large event logs generated in the manufacturing process in an autonomous and adaptive smart factory and delivering them to the Real-Time Data Processing subsystem. The collected event logs include all data generated when objects move in the autonomous and adaptive manufacturing processes such as object ID, time, read point, and sensor data. The collected event logs are delivered to the Real-Time Data Processing subsystem in the upper level in XML, JSON, and other formats.
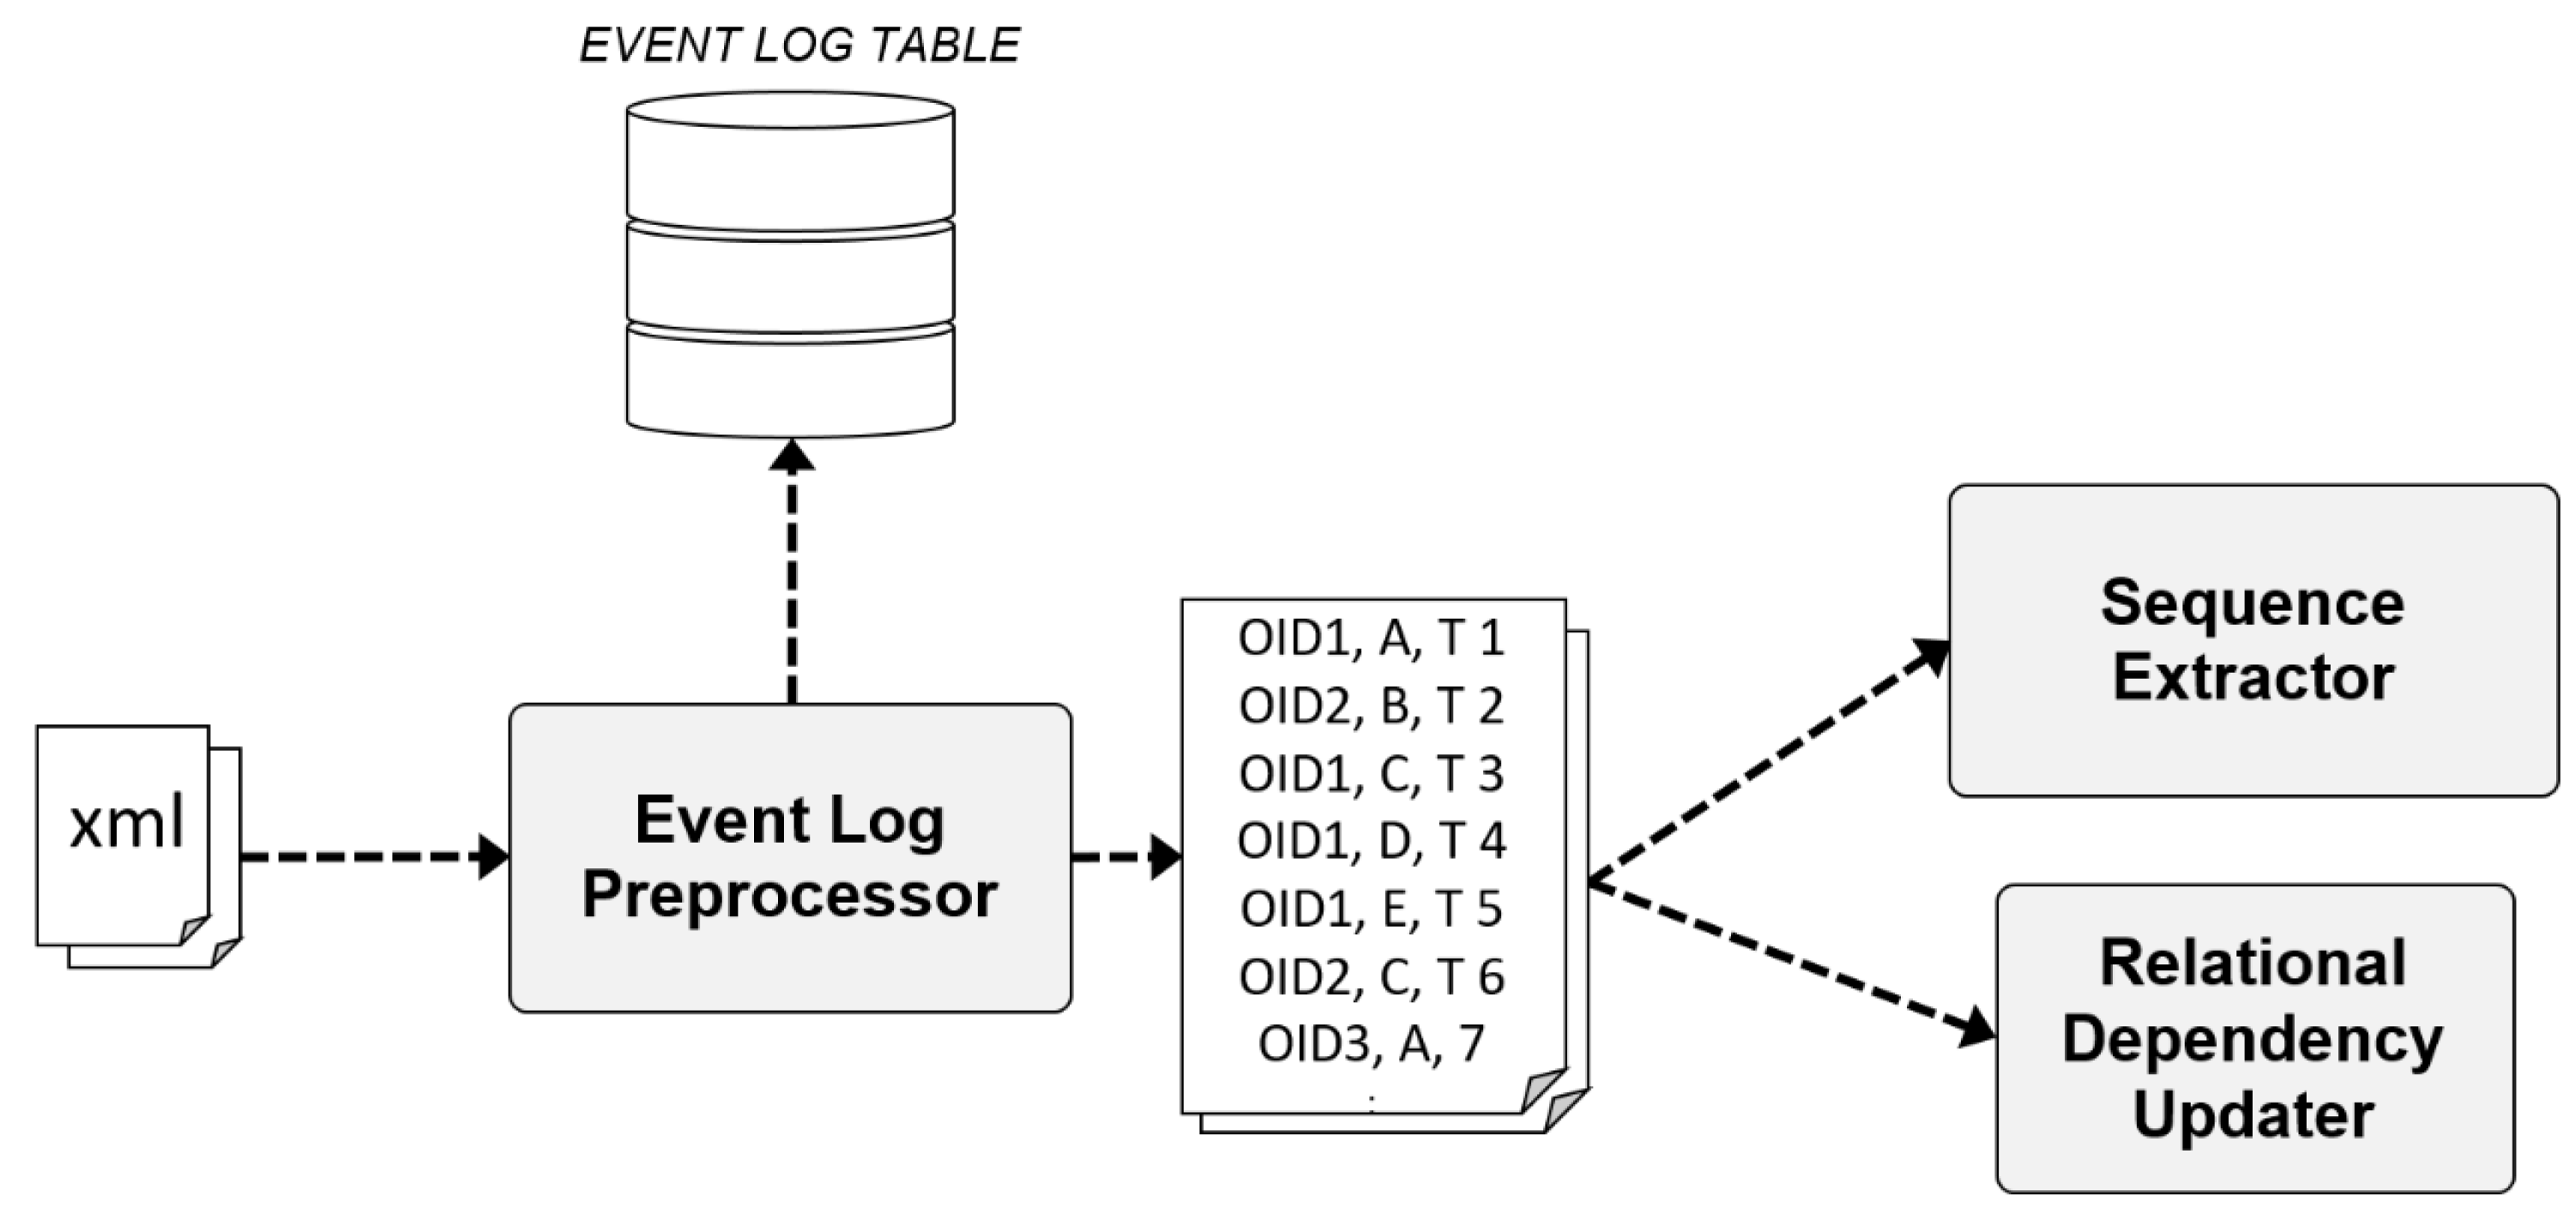
The Real-Time Data Processing subsystem plays the role of storing event logs delivered from the Distributed Messaging subsystem in the database, extracting the necessary information and delivering it to each subsystem and component. The Real-Time Data Processing subsystem consists of four components. The first is the Event Log Preprocessor, which plays the role of filtering collected data and storing it in the database. The second is the Sequence Extractor, which extracts the activity sequence (sequence of read points from the material flow perspective) for each object ID from the pretreated event logs. The third is the Relational Dependency Updater, which extracts casually related read point pairs (e.g., AB, BC, CD) from the pretreated event logs and stores them in the database. Lastly, the Anomaly Evaluator evaluates the anomaly of material flow by comparing the subsequence pattern derived from the Data Analytics subsystem with the sequence data in the real-time event stream extracted from the Sequence Extractor.
The Data Storage subsystem is a database system that consists of the following tables: EVENT LOG TABLE, RELATIONAL DEPENDENCY TABLE, PATTERN TABLE, and ALIGNMENT SCORE TABLE. Each table stores the process event log, relations (causally related read point pairs), subsequence patterns, and hourly anomaly evaluation records. The EVENT LOG TABLE stores all large event logs generated in real time, and does not modify or update the recorded events. Thus, the use of a NoSQL database [50], which can quickly store and retrieve large volumes of data, is recommended. Unlike this table, the other three tables generate frequent updates. Therefore, a relational database system, which is advantageous for consistent updates and fast data search, is recommended.
The Data Analytics subsystem derives high-frequency subsequence patterns from the process event logs stored in the EVENT LOG TABLE. The relations between read points recorded in the RELATIONAL DEPENDENCY TABLE and the frequency of each relation are used to raise the speed at which subsequence patterns are derived. The principle is detailed below in the Frequent Sequence Miner and in Section 3.2.
Finally, the Data Query Service provides an interface that allows internal and external users to access and retrieve data stored in the Data Storage subsystem.
3.1.1. Event Log Preprocessor
The Event Log Preprocessor parses large event logs generated from the manufacturing process in the autonomous and adaptive smart factory and stores them in the EVENT LOG TABLE. Simultaneously, it extracts and delivers data to the Sequence Extractor and Relational Dependency Updater. The event logs stored in the EVENT LOG TABLE include all information about the objects. The data delivered to the Sequence Extractor and Relational Dependency Updater partially consists of the event properties extracted and converted to the flat format. The extracted data are the object ID, read point, and event time. The object ID is the ID of the material flowing in the factory, and read point is an element that forms a sequence consisting of places at which the object has been recognized. The event time is the time when the object is recognized by the Automatic Identification and Data Capture (AIDC) system. Figure 2 shows an example of a virtual process model expressed in a petri net and flat-formatted event log generated according to the process model.
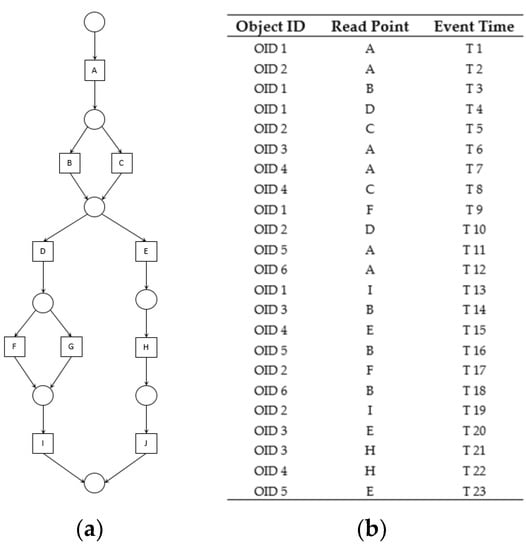
Figure 2.
Example of process model and flat-formatted event log. (a) process model; (b) flat-formatted event log.
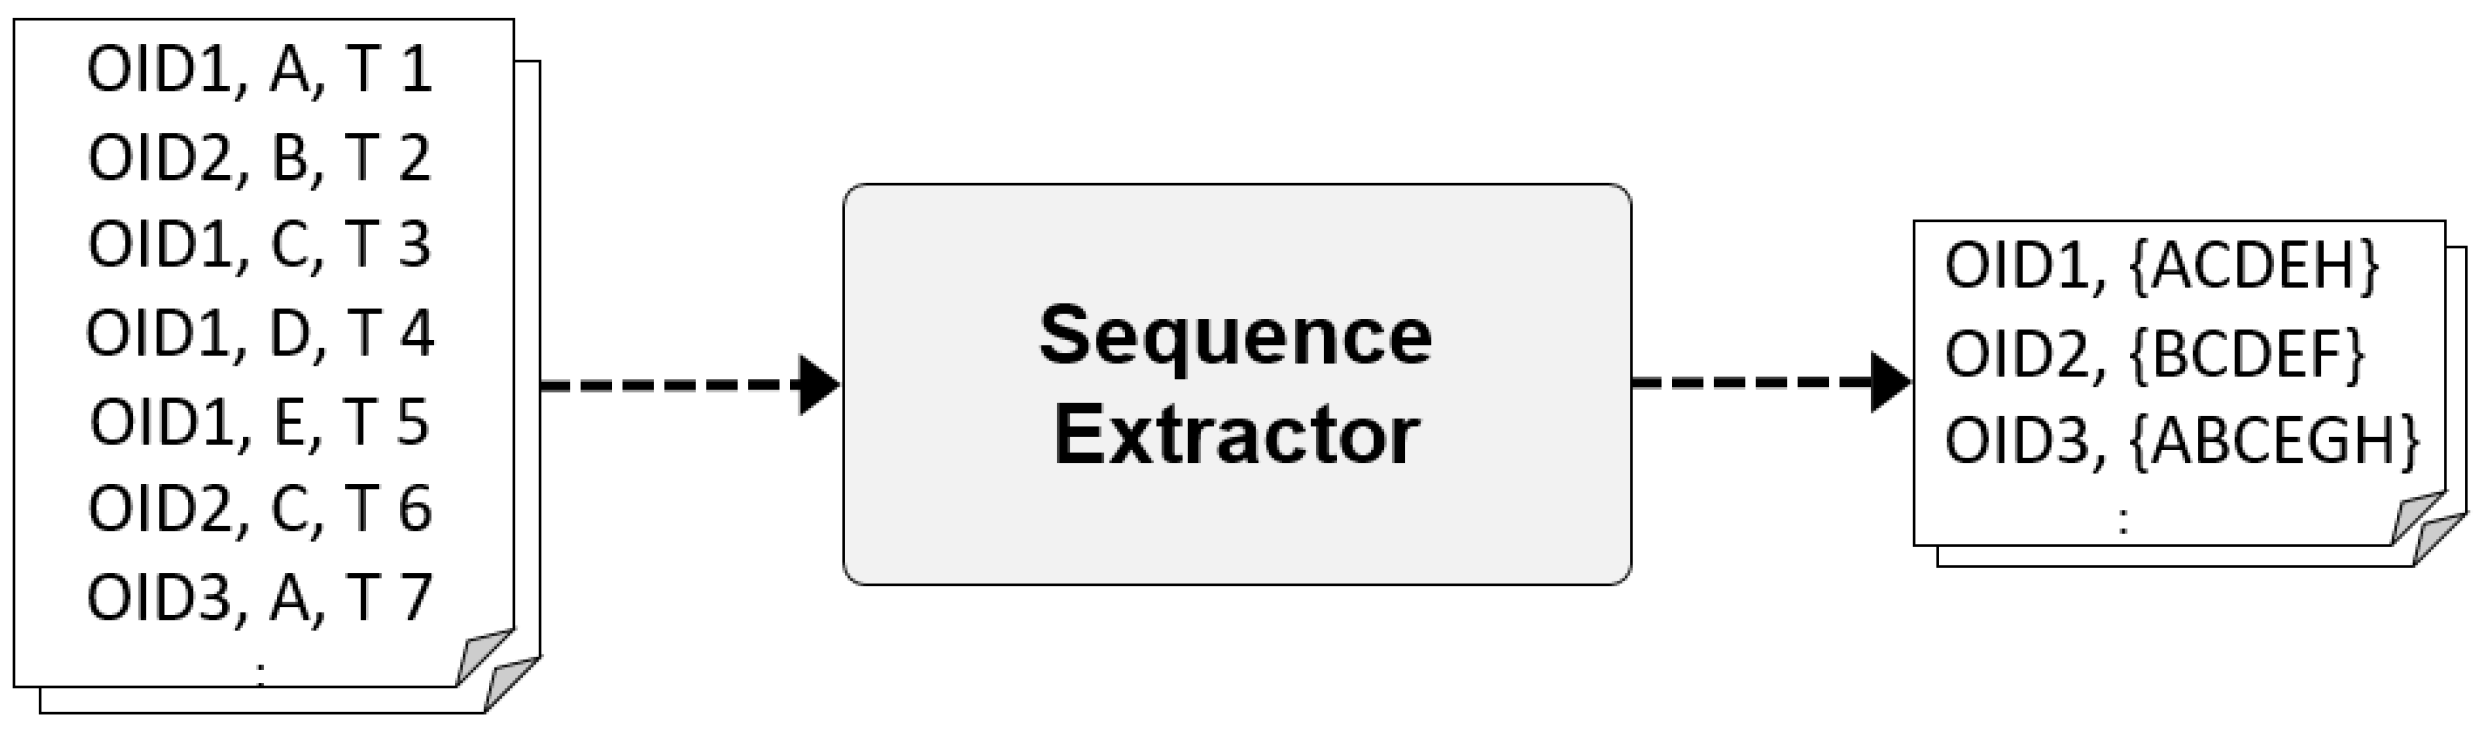
3.1.2. Sequence Extractor
The Sequence Extractor groups recognized read points for each object ID from the flat formatted event logs delivered from the Event Log Preprocessor, and generates [object-(read point list)] pairs that list read points in the order of time. The generated object-(read point list) pairs are delivered to the Anomaly Evaluator. Figure 3 shows examples of object-(read point list) pairs generated from event logs.

Figure 3.
Example of input and output data for Sequence Extractor.
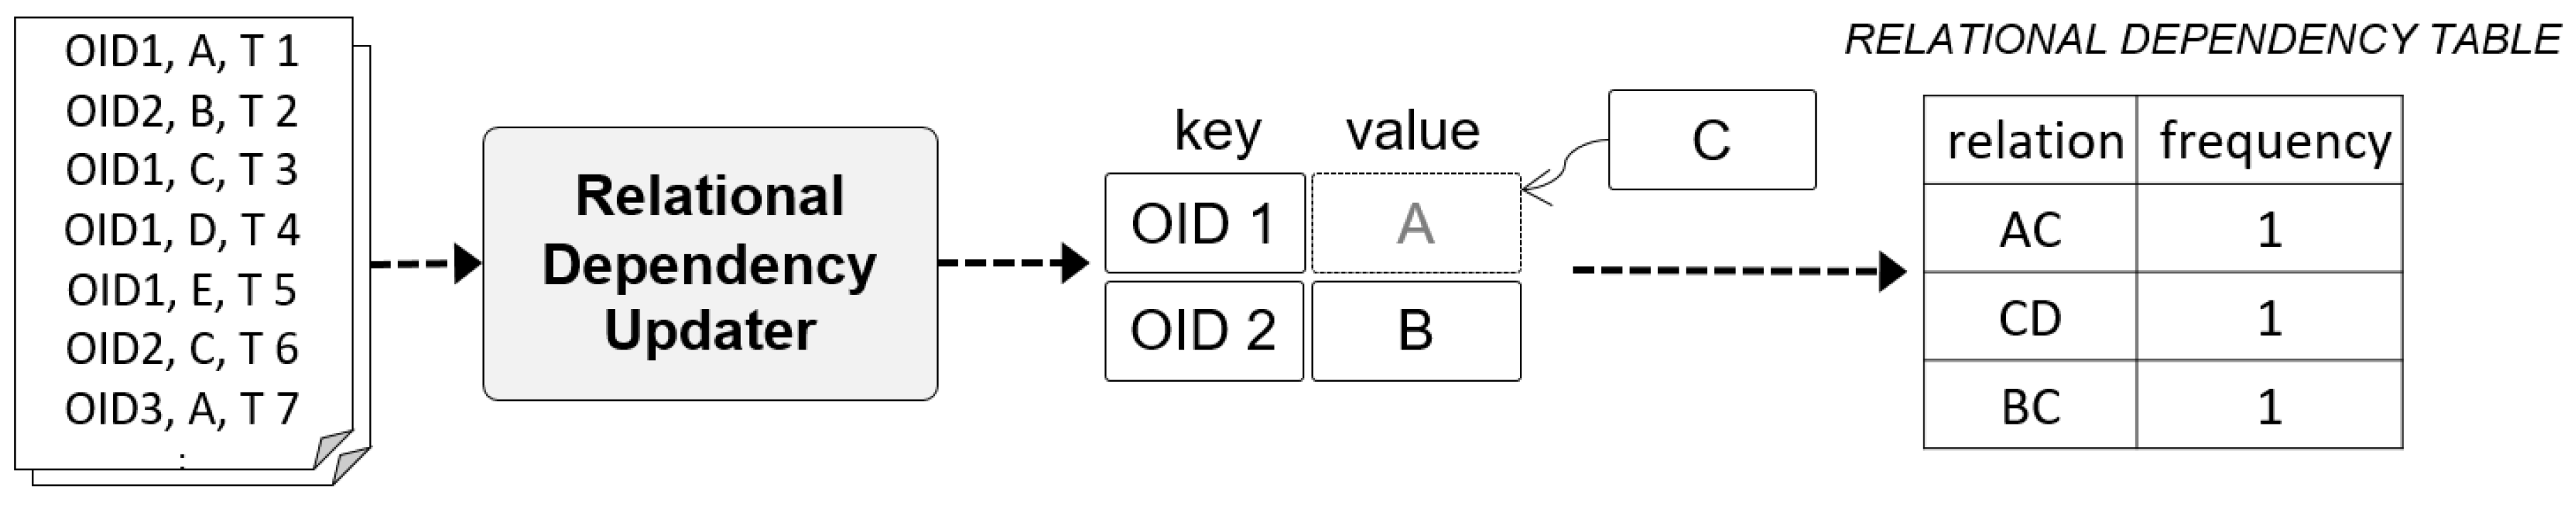
3.1.3. Relational Dependency Updater
The Relational Dependency Updater records the latest read points for each object ID based on the flat-formatted event logs delivered from the Event Log Preprocessor, identifies the relational dependency between read points, and records the results in the RELATIONAL DEPENCENCY TABLE. This table is composed of relations, which are read point pairs, and the frequency of the corresponding relations.
In general, when patterns are derived using the sequential pattern mining algorithm, it takes considerable time to search an item set above a specific minimum support in the early stage of the algorithm. To shorten this time, our approach is to record relations and frequencies in real time in the RELATIONAL DEPENCENCY TABLE whenever an event occurs, thus supporting the fast search of length-2 patterns above a specific support whenever a subsequence pattern is derived in the future. Figure 4 shows a conceptual diagram of the Relational Dependency Updater.

Figure 4.
Example of input and output data for Relational Dependency Updater.
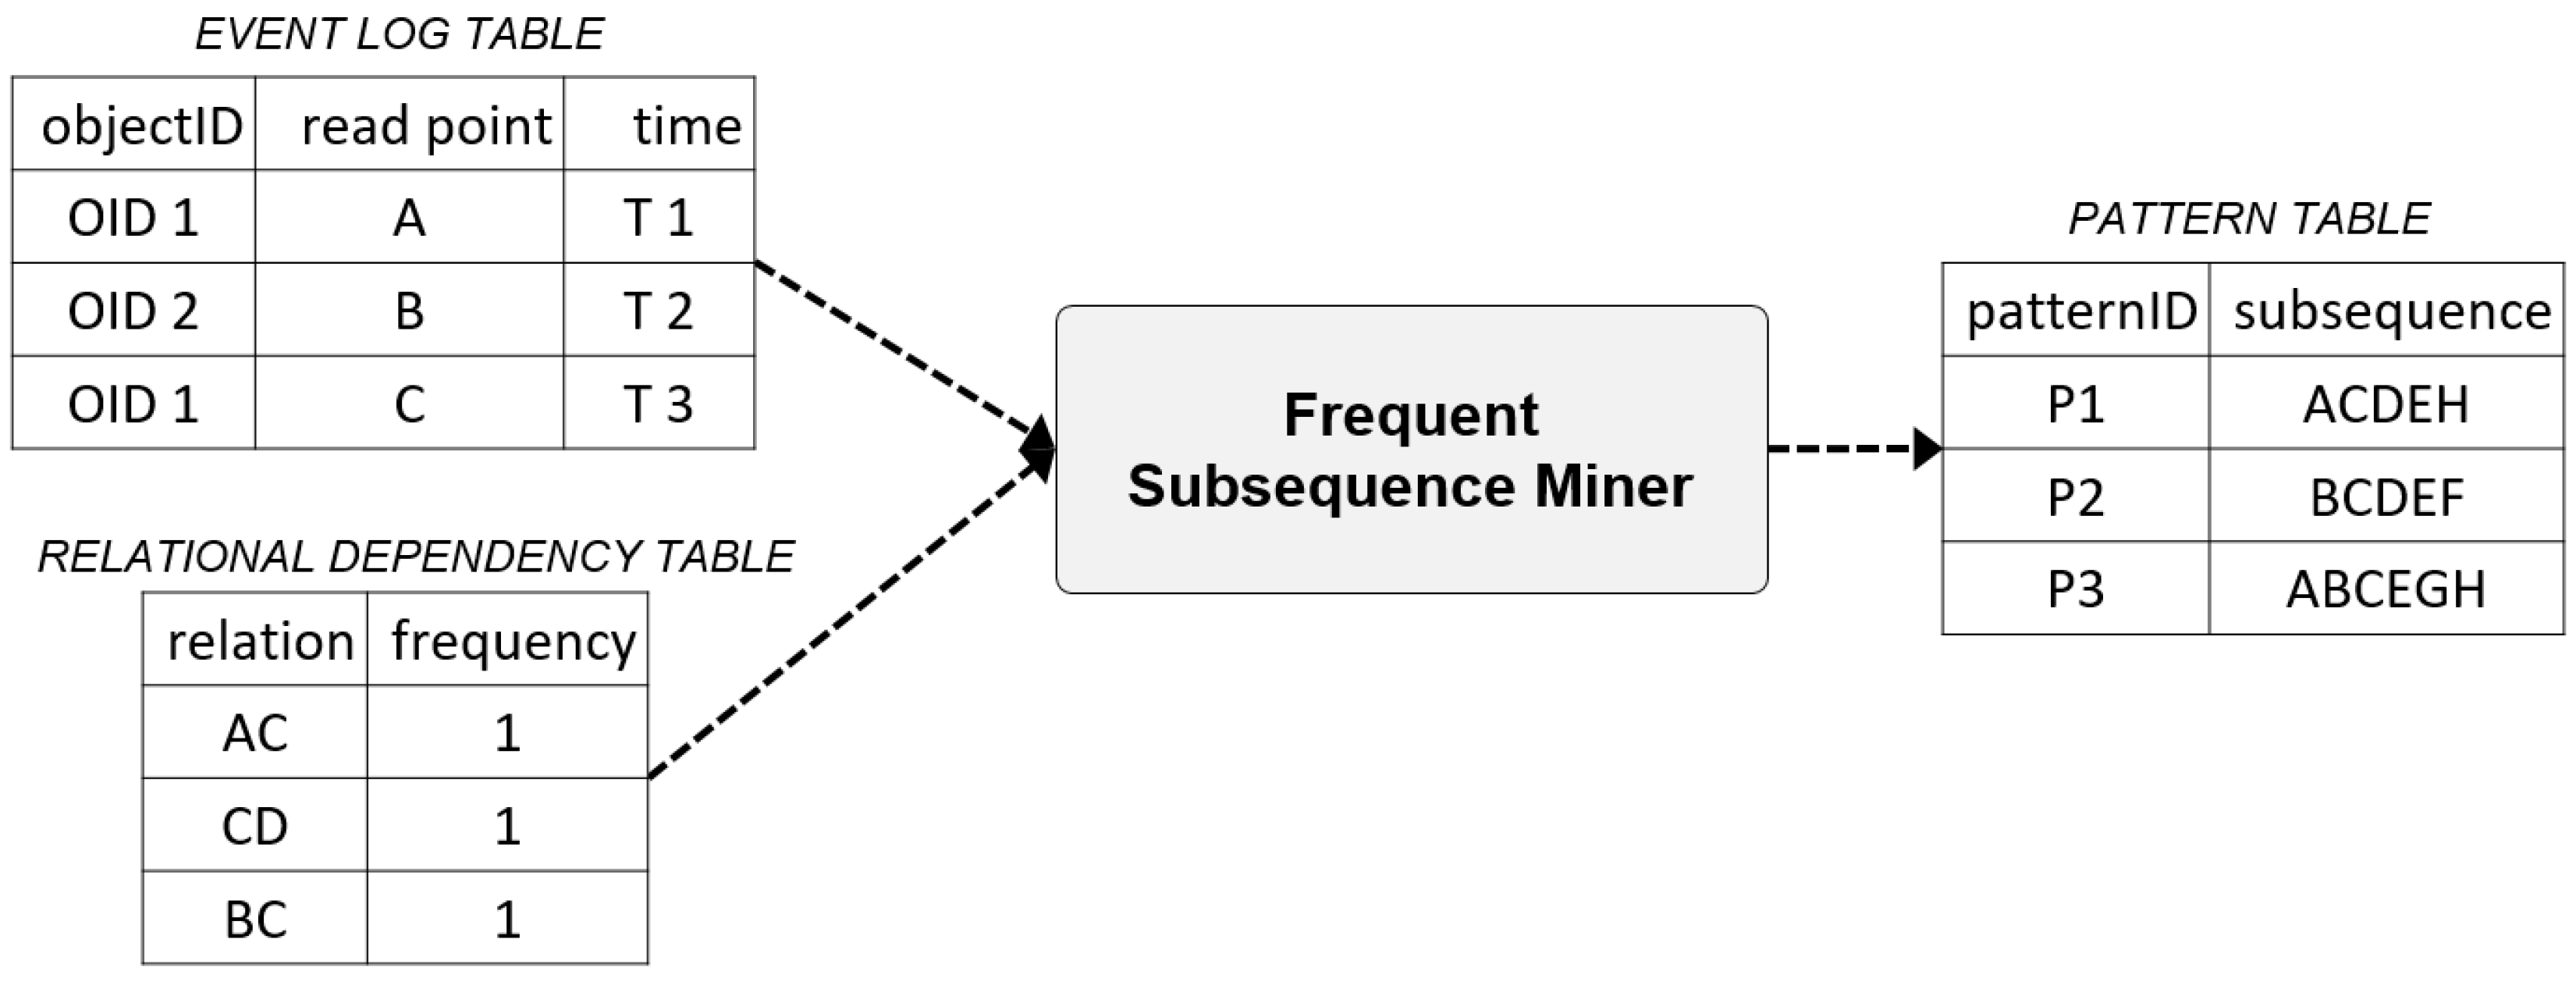
3.1.4. Frequent Subsequence Miner
The Frequent Subsequence Miner derives high-frequency subsequence patterns using the sequential pattern algorithm. The sequential pattern is also referred to as a sequential association rule, and it identifies sequential patterns that commonly appear in the data by adding the concept of time to the association rules [51]. The sequential patterns can be largely separated into Apriori series and Pattern-Growth series. The representative algorithm of the Apriori series is the GSP (Generalized Sequential Pattern) developed by IBM Research [52]. For the Pattern-Growth series, PrefixSpan [53] developed by Simon Fraser University is a typical example. This study uses the PrefixSpan algorithm, which improves the speed of performance by omitting the process of generating candidate patterns.
Figure 5 shows examples of the input and output data of the Frequent Subsequence Miner.
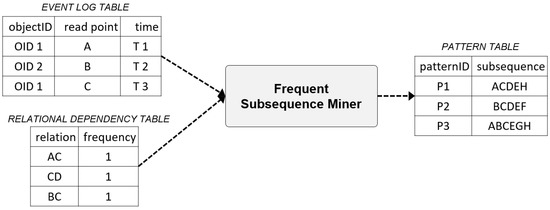
Figure 5.
Examples of input and output data of the Frequent Subsequence Miner.
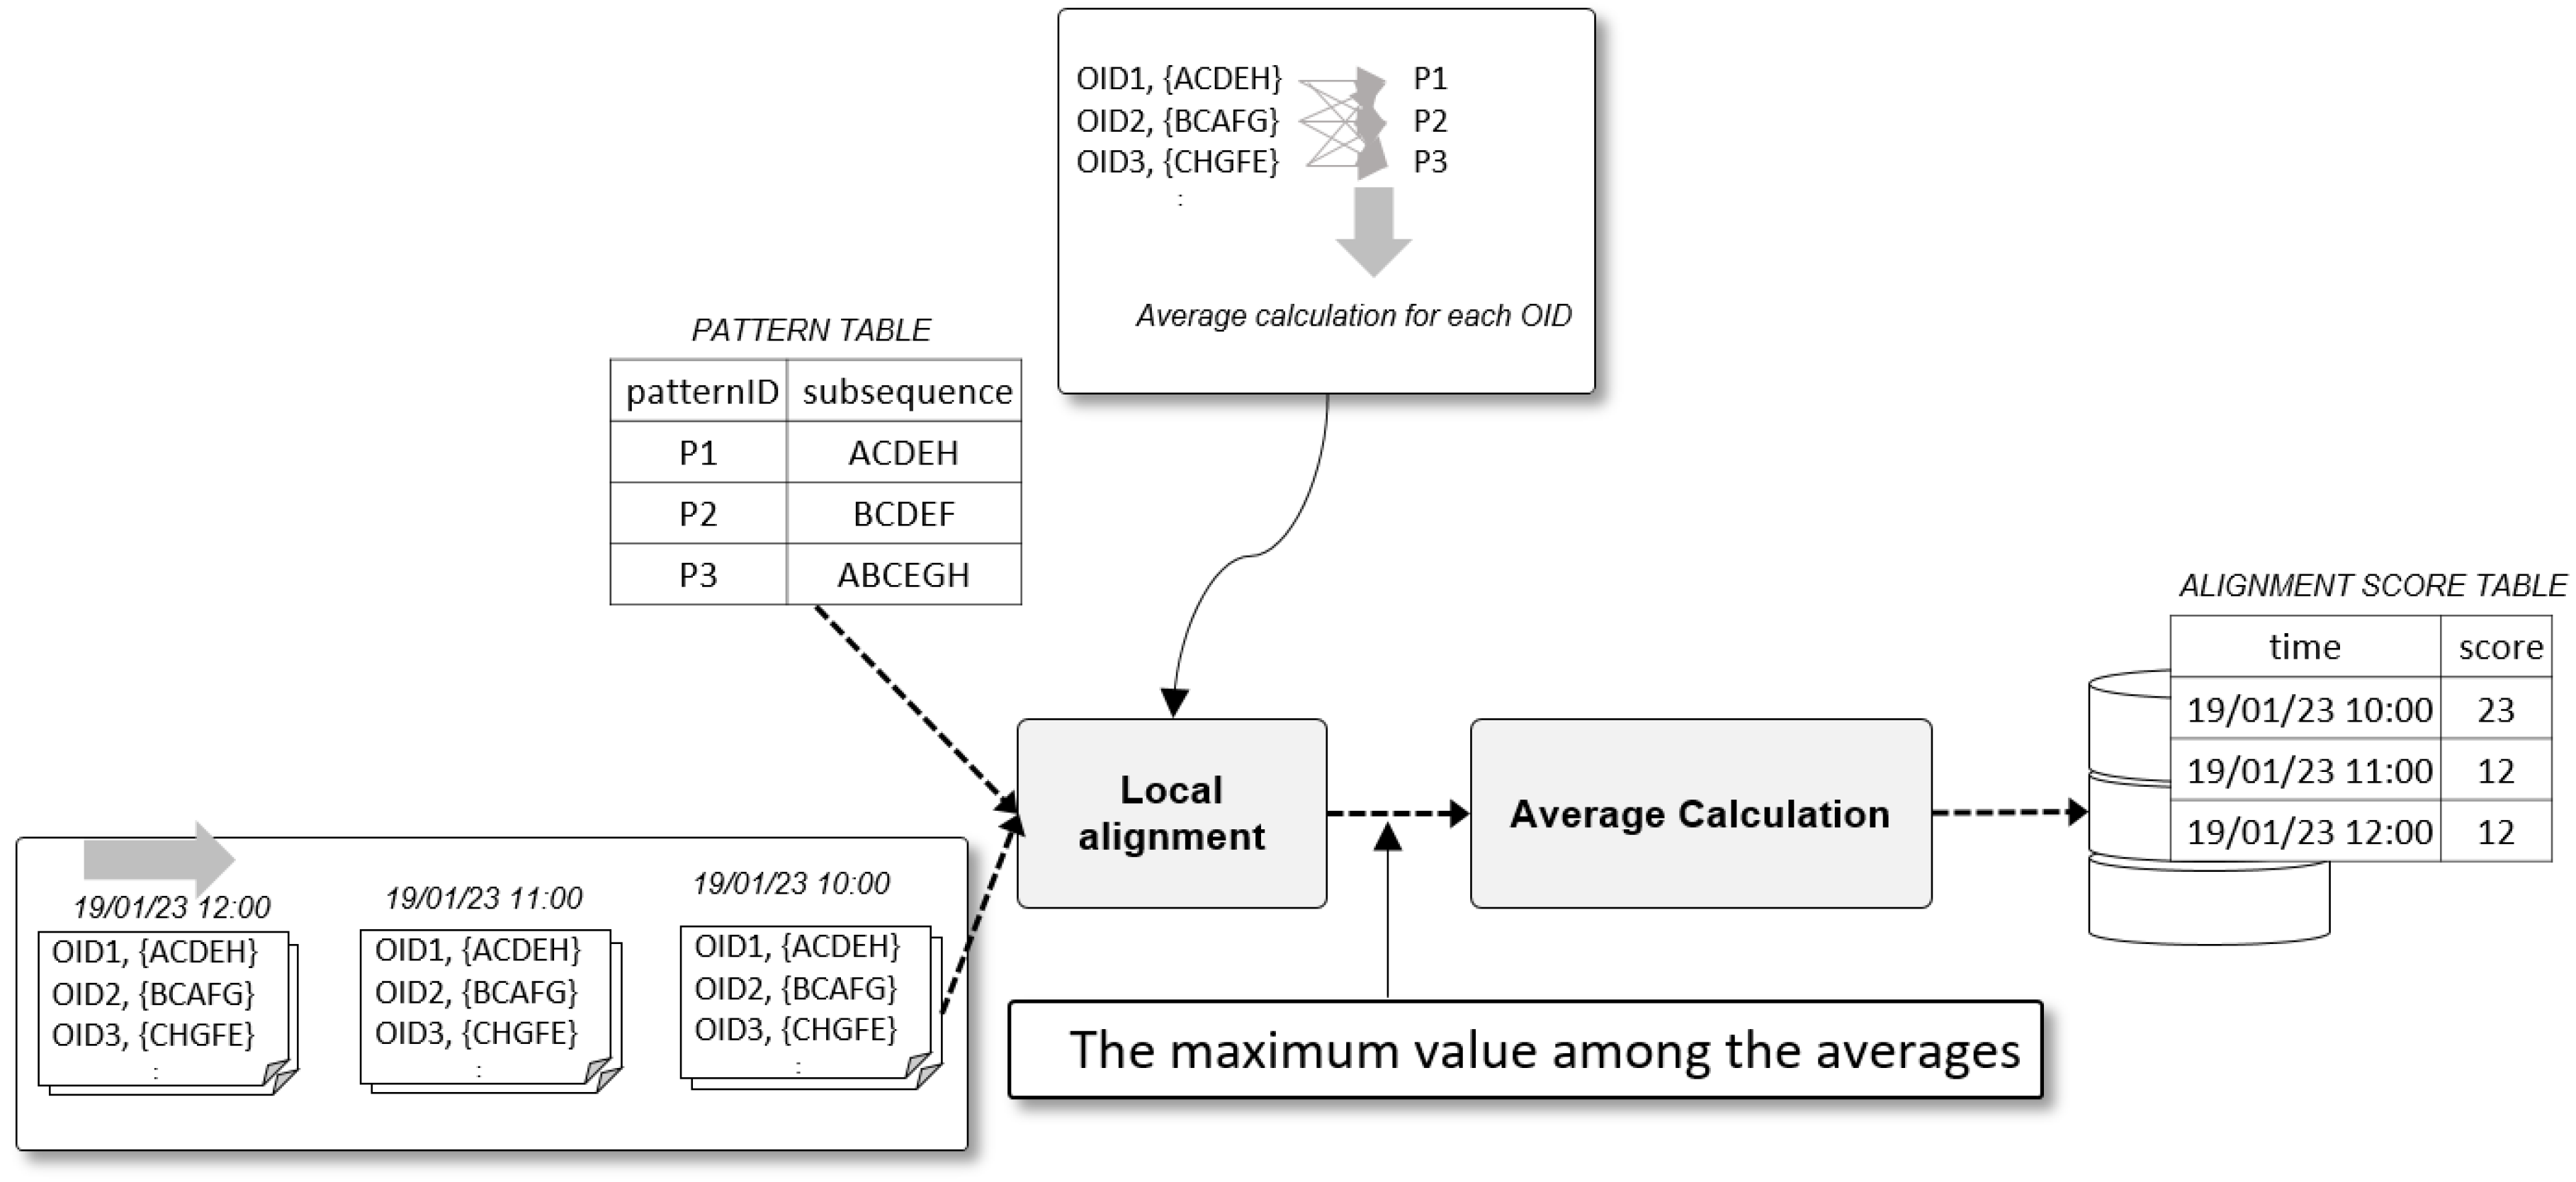
3.1.5. Anomaly Evaluator
The Anomaly Evaluator scores the degree of anomaly by comparing the sequence of each object ID extracted from the real-time events with the subsequence patterns derived from the Frequent Subsequence Miner. The Sequence alignment algorithm is often used to analyze rank and find similarity such as Deoxyribonucleic acid (DNA) and Ribonucleic acid (RNA) in the bioinformatics field [54].
In the present study, local alignment [55] is used to identify which part of two sequences with different lengths shows a higher homology in the sequence alignment algorithm. This approach is appropriate because the length of the subsequence pattern is likely to be different from the length of the sequence entered in real time. The anomaly of the total process can be monitored by recording the average of the alignment score of sequences extracted from the event stream at each moment or for specific intervals.
Figure 6 shows the scoring process of the Anomaly Evaluator by comparing the time event stream with the subsequence pattern of the PATTERN TABLE.
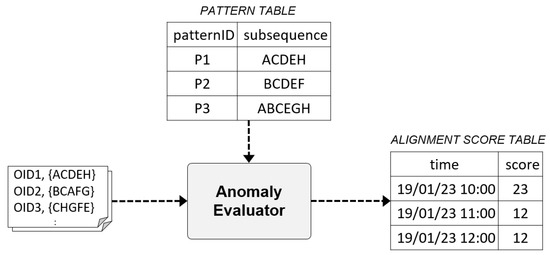
Figure 6.
Example of input and output data for the Anomaly Evaluator.
3.2. Implementation
To implement the Scalable On-line Anomaly Detection System (SOADS) proposed in this study, we used the distributed messaging technology Kafka, the real-time event processing technology Apache Spark streaming, the machine-learning library of Apache Spark, Spark MLlib, the NoSQL database system Apache Hbase, and the relational database MySQL. The components of each subsystem were implemented using Python.
3.2.1. Event Log Preprocessor
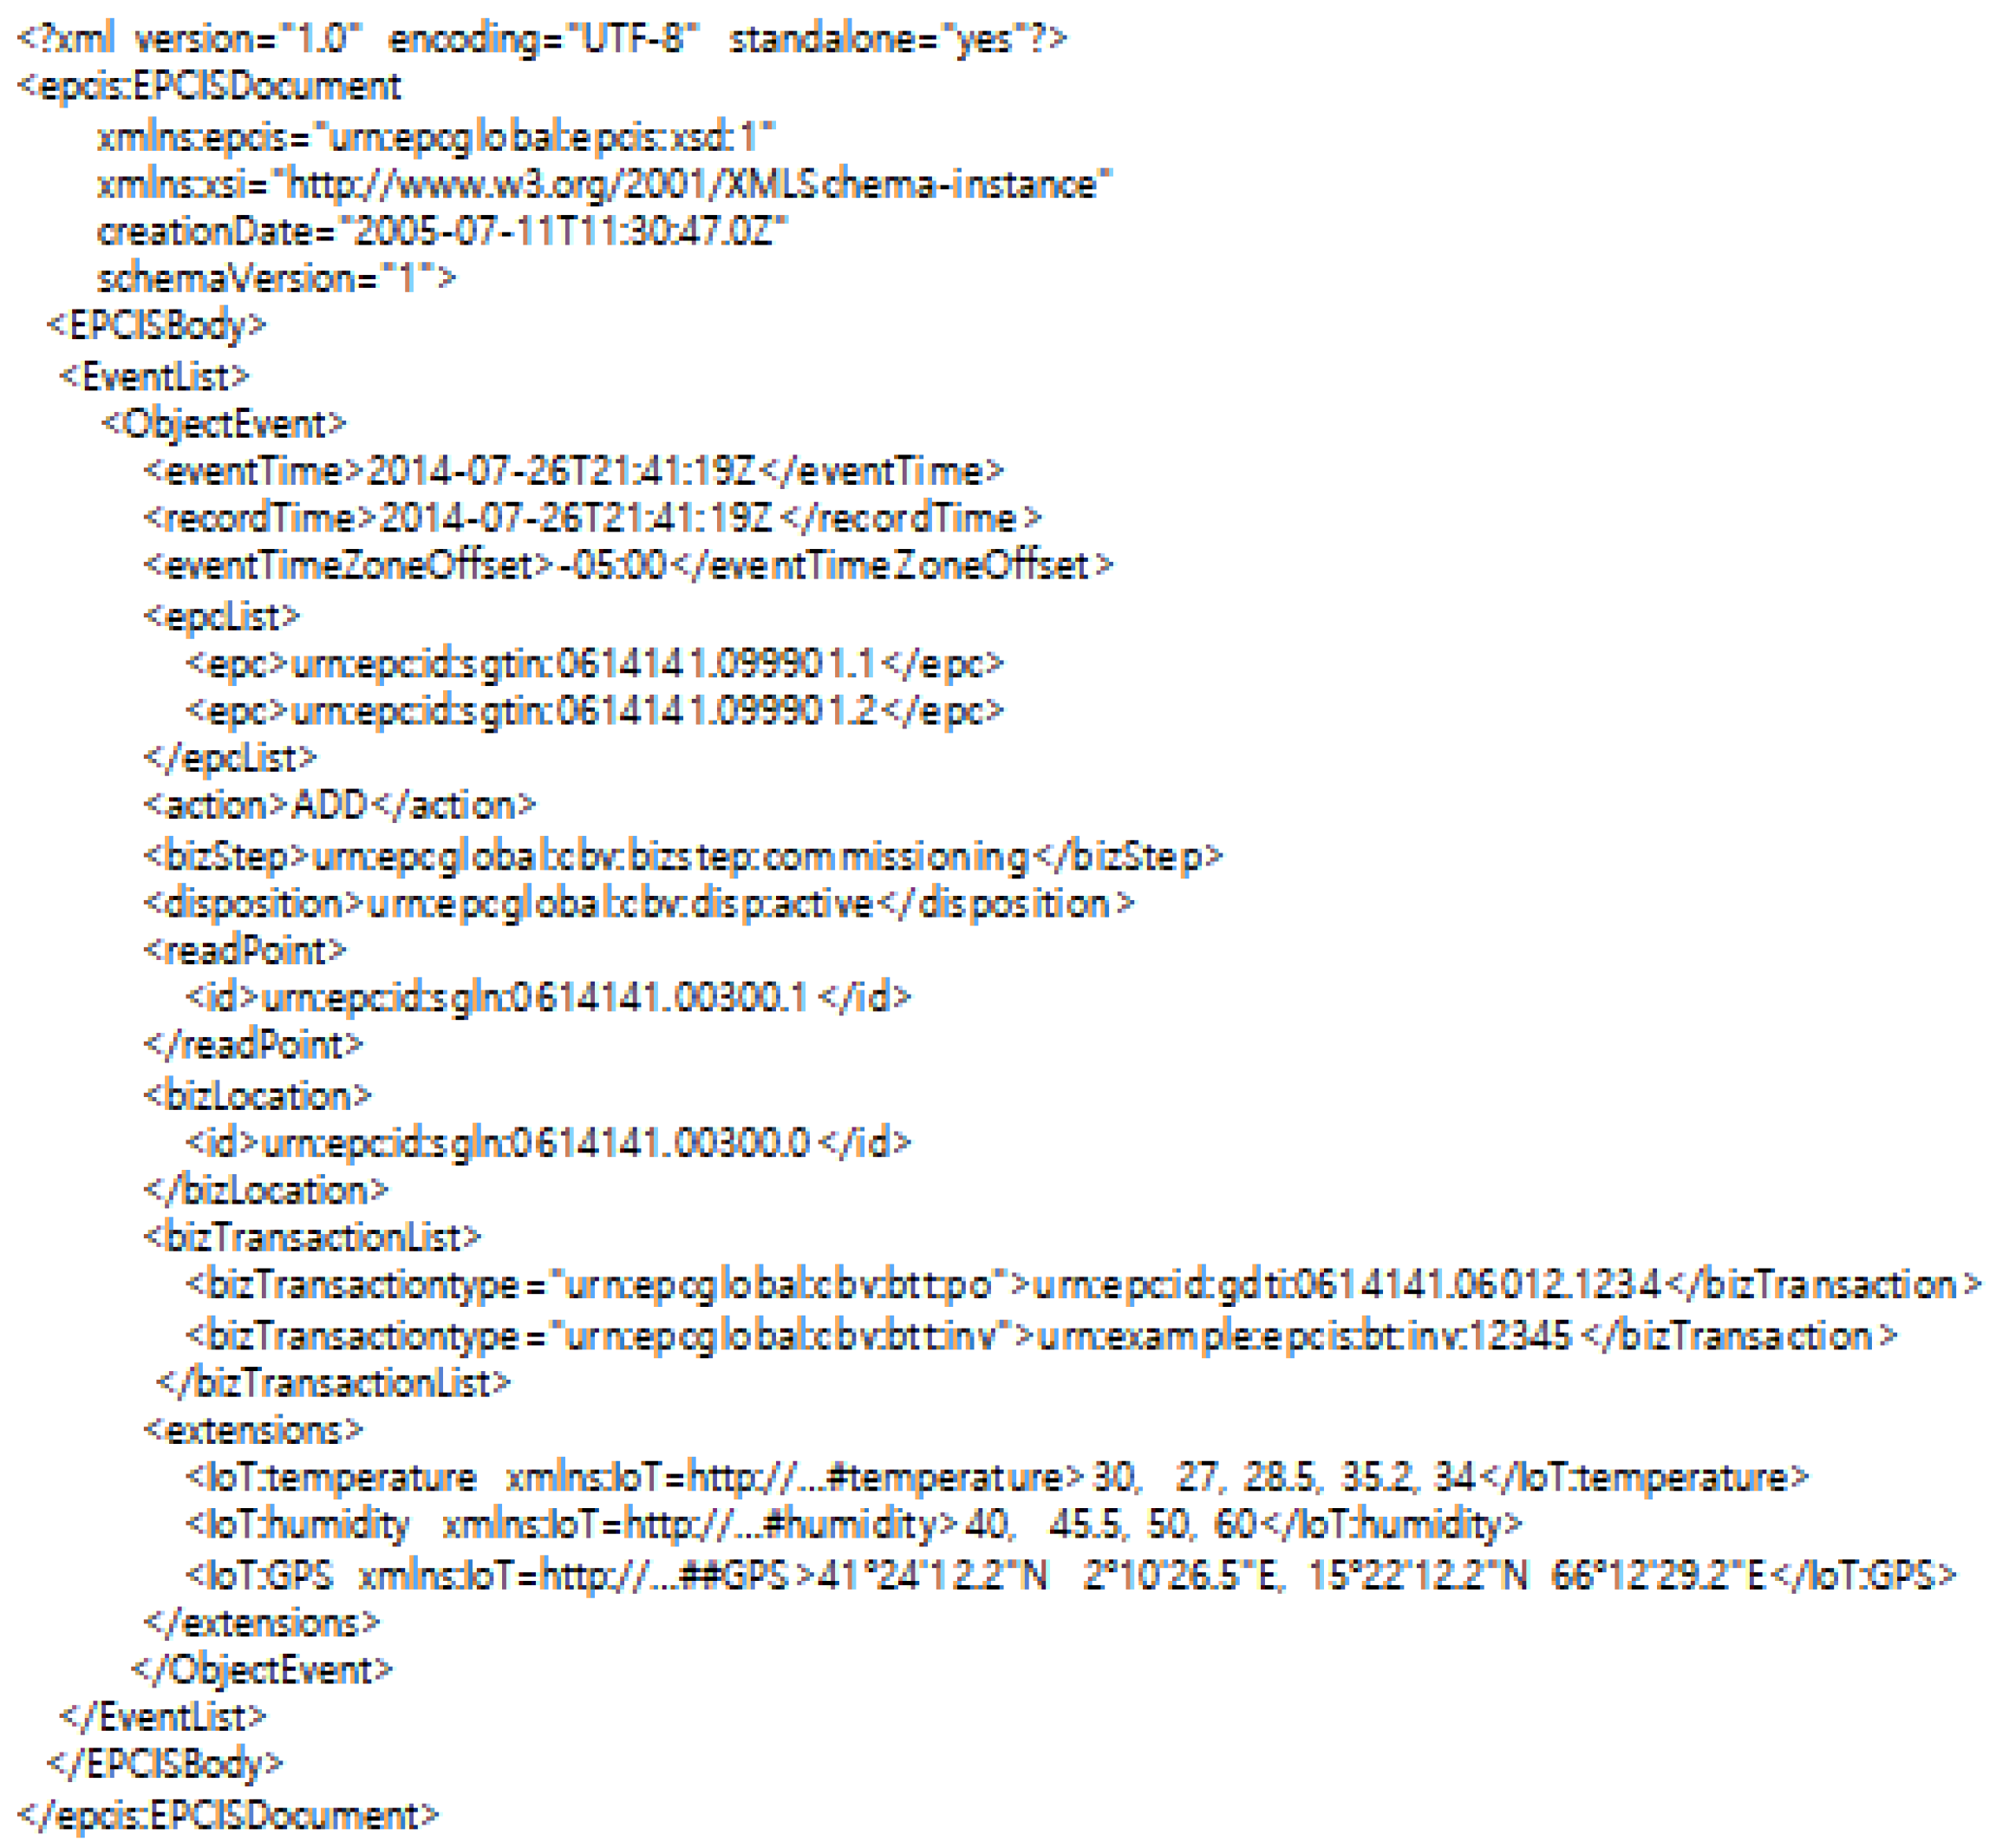
In this study, programs were implemented using Python and embedded in Spark Streaming. The format of the event log delivered from the Distributed Messaging System followed the RFID/Sensor data XML format defined by Kang et al. [56]. Figure 7 shows an example event log of the XML format. Here, “epc” is an acronym for electronic product code, which corresponds to the object ID in this study.
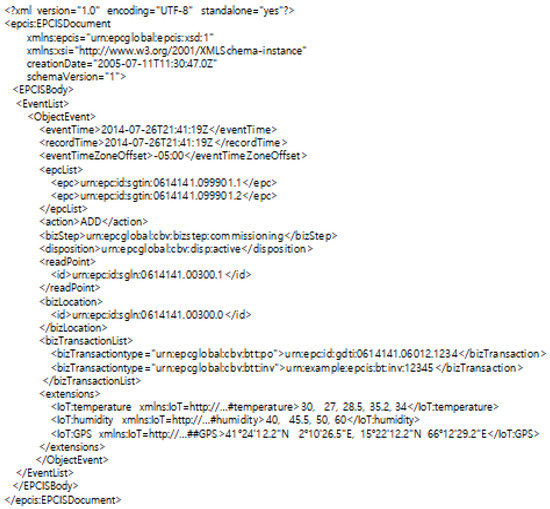
Figure 7.
Example of XML event log data.
To parse the event log in XML format, we used xml.etree.ElementTree, which is a library that can accommodate XML, and which is provided by default in Python. The XML tags in the data are found using the find function, and data corresponding to each tag is extracted and converted to flat text format. Later, the system sends the tag data to track and manage to the EVENT LOG TABLE, and the object ID, read point, and event timetag data to the Sequence Extractor and Relational Dependency Updater. Figure 8 illustrates the process of converting the event log in XML format to flat format data and sending it.
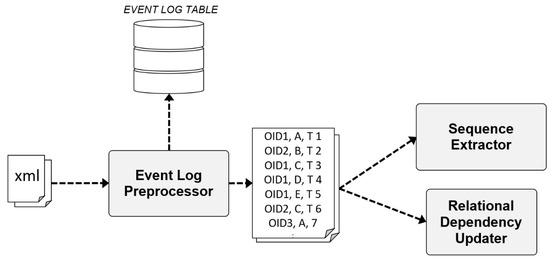
Figure 8.
Examples of input and output data for the Event Log Preprocessor process.
3.2.2. Sequence Extractor
The Sequence Extractor was implemented in Python using the PySpark package. Figure 9 shows the directed acyclic graph (DAG) related to the Spark RDD transformation. First, (read point, event time) pairs are extracted based on the object ID by using the groupByKey function from the flat formatted event logs delivered from the Event Log Preprocessor. The (read point, event time) pairs collected from the distributed storage are not sorted in chronological order. Therefore, the (read point, event time) pairs are sorted according to the event time. Then, the event time is removed from the (read point, event time) pairs for each object ID by using the map. Lastly, a list of read points for each object ID is extracted by grouping the read points for each object ID into object ID-(read point list) pairs using the map.
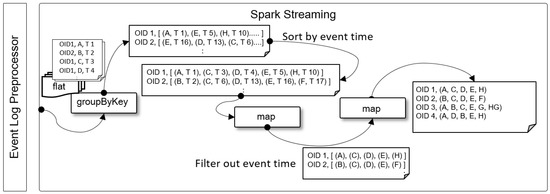
Figure 9.
Spark DAG of Sequence Extractor.
3.2.3. Relational Dependency Updater
The logical flow for implementing the Relational Dependency Updater is illustrated in Figure 10.
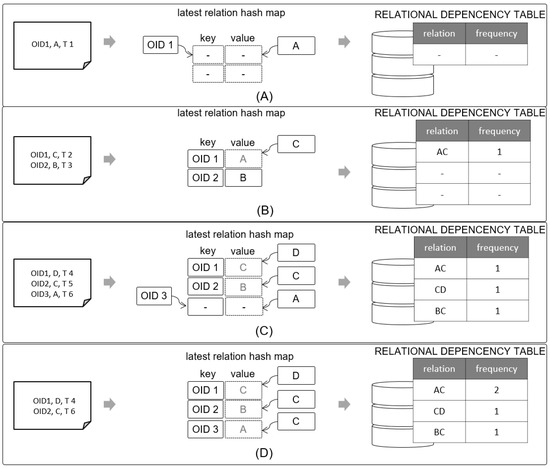
Figure 10.
Process of Relational Dependency Updater.
The Relational Dependency Updater uses the latest read point hash map, which has the object ID as key and the read points as values, as an internal storage space. First, to examine (A) which is the situation in which the first event occurred in the system, OID1 was captured at read point A and time T1. Because the latest read point hash map does not contain a key with the object ID, the object ID is inserted in the key and the read point A is inserted in the value. No insert occurs in the RELATIONAL DEPENCENCY TABLE because this is before the discovery of relational dependency between read points. Next, in part (B), OID 1 was recognized at read point C and time T2. Because OID1 already exists in the latest relation hash map, read point C is updated in the value of OID1. At this time, A and C are in successive relation for OID1, and (AC, 1) is inserted in the RELATIONAL DEPENDENCY TABLE. Another ID, OID 2, is located at read point B at time T3, but there is no information about OID2 in the latest relation hash map; thus, (OID 2, B) is inserted. The same process is repeated for part (C) to find the relational dependency between the read points of OIDs and these are inserted in the RELATIONAL DEPENDENCY TABLE. If the same relation already exists in the RELATIONAL DEPENDENCY TABLE, the frequency is increased by 1.
3.2.4. Frequent Subsequence Miner
The Frequent Subsequence Miner uses the PrefixSpan algorithm to derive subsequences. The PrefixSpan algorithm generates a pattern of the tree structure while omitting the process of generating candidate patterns in the database. Therefore, it is faster than the general sequential pattern algorithm. The PrefixSpan algorithm expands the tree of sequences that appear frequently in the projectedDB in which all sequences are stored by using depth-first search. In this study, to use the relation and frequency information of the RELATIONAL DEPENDENCY TABLE, the pyspark.mllib.fpm API source of the Spark MLlib was modified and used. Algorithm 1 shows the pseudocode of the modified PrefixSpan algorithm proposed in this study.
| Algorithm 1: prefixSpan for SOADS |
| A = { a|a∈A is a set of read points } t = { a1,a2,a3…an|a1..an∈A, a1..an is a sequence of read points } S = { s|s∈S is a set of sequences } R = { (ai,ao)|ai,ao∈A, ai is a input activity, ao is a output read points} RF = { (r,f)|r∈R, f is a frequency of r in T} 1: Function prefixSpanForSOADS(RF, S, minsup) 2: foreach RF do 3: if f ≥ minsup then 4: P ← P ∪ r//r∈ RF 5: return prefixSpan(P, minsup, ProjectedDB(R, S)) 6: 7: SubFunction prefixSpan(prefix, minsup, DB) 8: <b> ← extractPrefix(minsup, DB) 10: for each b do 11: prefix’ ← prefix + b 12: P ← P ∪ prefix’ 13: P ← P ∪ prefixSpan(prefix’, minsup, ProjectedDB(prefix’, DB)) 14: return P |
The inputs of this algorithm are RF, T, and minsup. RF is a set of relations and frequency pairs, and means the (relation-frequency) data of the RELATIONAL DEPENDENCY TABLE in this study. S is a set of sequences, which is the read point list for each OID, that is, sequences extracted from the EVENT LOG TABLE. The extraction method is to use the RDD transformation, which is used in the Sequence Extractor. Minsup is the minimum support defined by the user.
PrefixSpan finds the length-1 sequential patterns above the minsup, and generates a projectedDB that takes the patterns as prefix. Then the length-2 pattern above the minsup is found in the projectedDB, and a project DB that makes the corresponding patterns as prefix is generated. This process is repeated until length-N. The time required to find the length-2 pattern can be reduced by using the data of the RELATIONAL DEPENDENCY TABLE proposed in this study, that is, RF, because length-2 patterns above the minsup can be searched immediately.
3.2.5. Anomaly Evaluator
The Anomaly Evaluator is implemented by using the Smith-Waterman algorithm [55], which is the most frequently used among the local alignment algorithms. A comparison of long sequences of DNA and RNA has the disadvantage that the amount of sequence calculation increases. To address this, recent studies introduced distributed processing methods for the Smith-Waterman algorithm using Spark [57,58,59]. However, the lengths of the subsequence patterns derived from the autonomous and adaptive manufacturing processes and the sequences in the event stream are expected to be shorter than those of DNA and RNA. Hence, their comparison would require little time. Therefore, in this study, the Anomaly Evaluator was implemented by using the biopython library of Python, which is based on the Smith-Waterman algorithm.
The Anomaly Evaluator receives a list of read points, that is, the sequence for each object and performs local alignment with the sequence patterns stored in the database. All patterns are circulated 1:1 and the highest alignment score means the abnormality or normality of the sequence. The average of the scores of objects in the same stream and the stream occurrence time are stored in the ANOMALY SCORE TABLE. Figure 11 shows the process of operation of the Anomaly Evaluator.
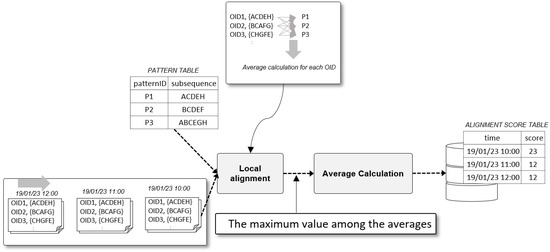
Figure 11.
Result of Local alignment.
4. Performance Test of SOADS
Two experiments were conducted to evaluate the performance of the SOADS proposed in this study. The first is an experiment to determine the pattern derivation speed of the Frequent Subsequence Miner. The pattern derivation speed was determined with and without using the RELATIONAL DEPENDENCY TABLE for each event log size. The second is a stress experiment of the Anomaly Evaluator. The anomaly scoring speed was measured by adjusting the number of sequences in the event stream. The event log used in the experiment is simulation data for a battery manufacturing process with a high degree of freedom of process logistics.
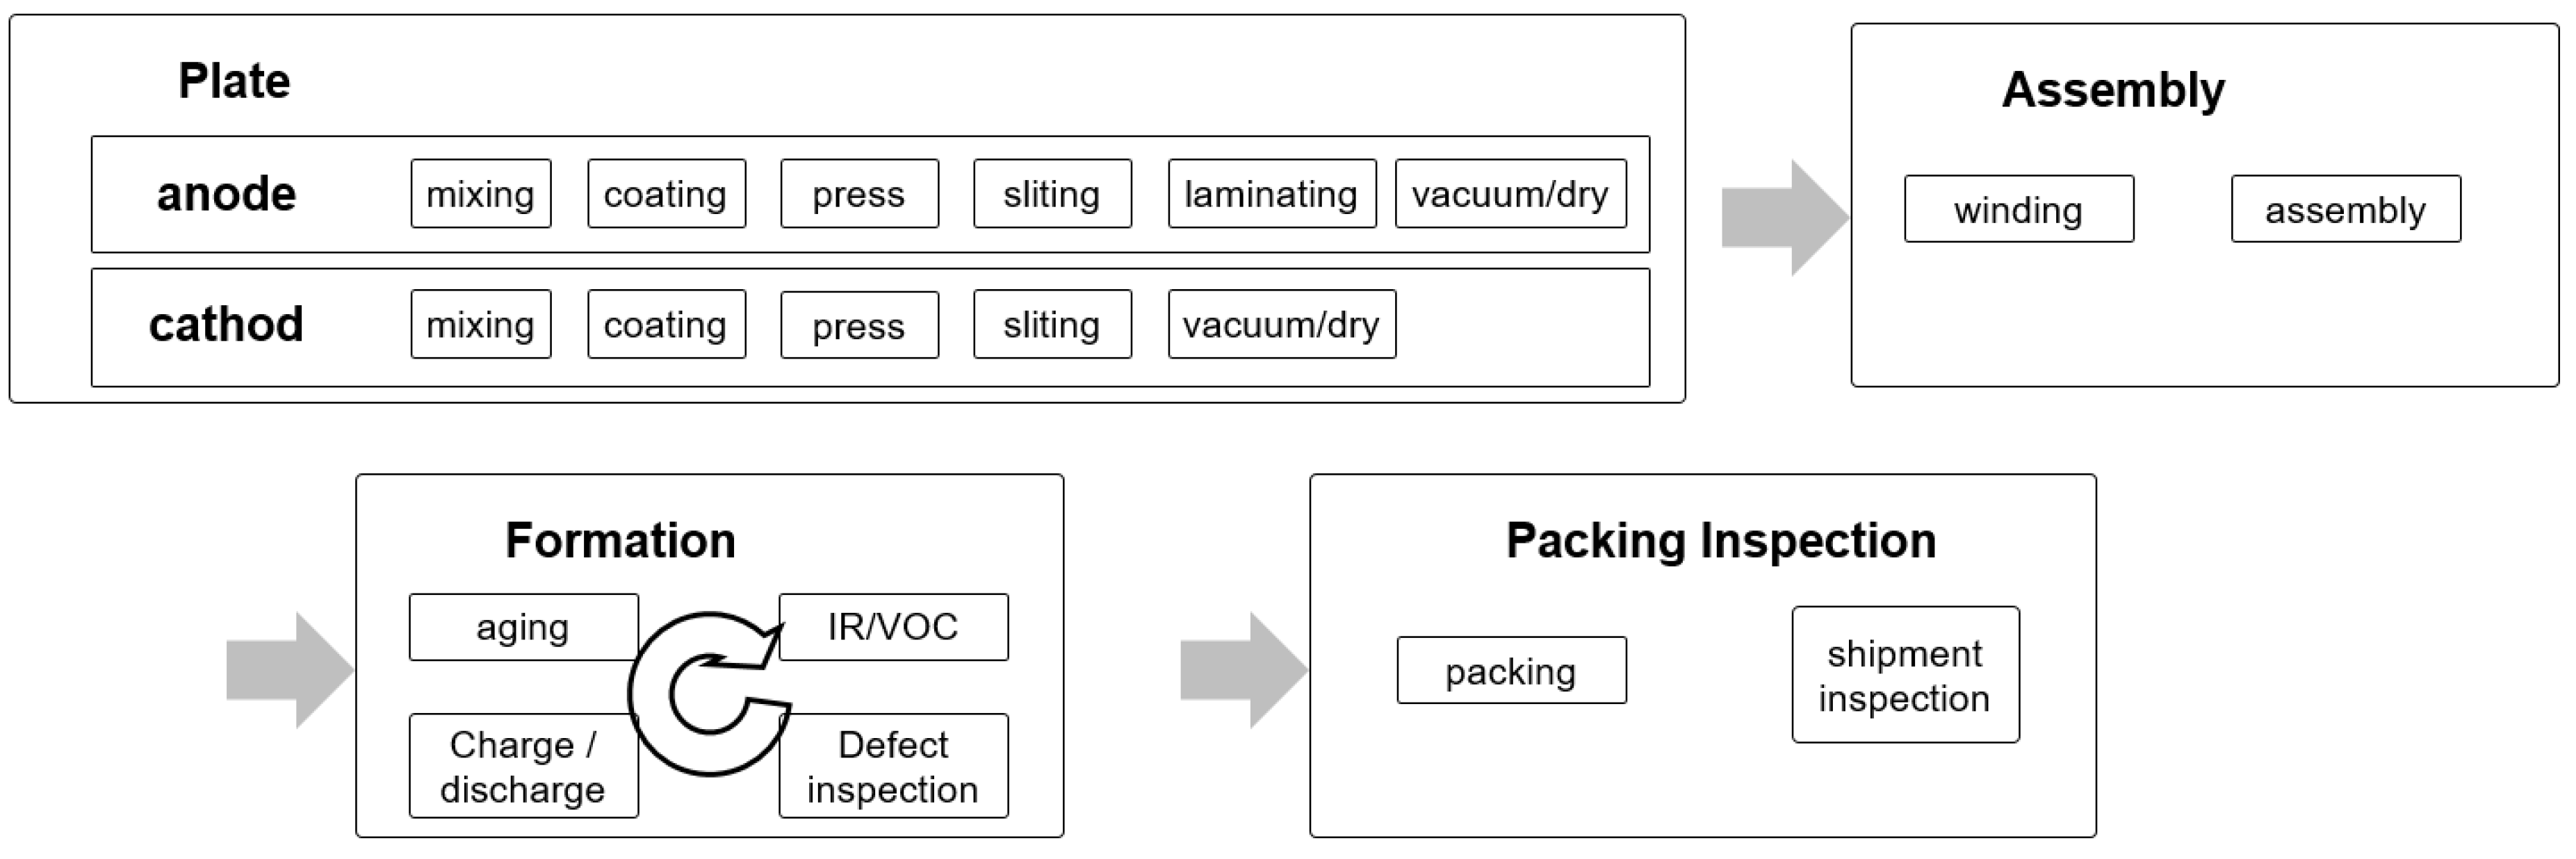
4.1. Overall Processes of Battery Manufacturing
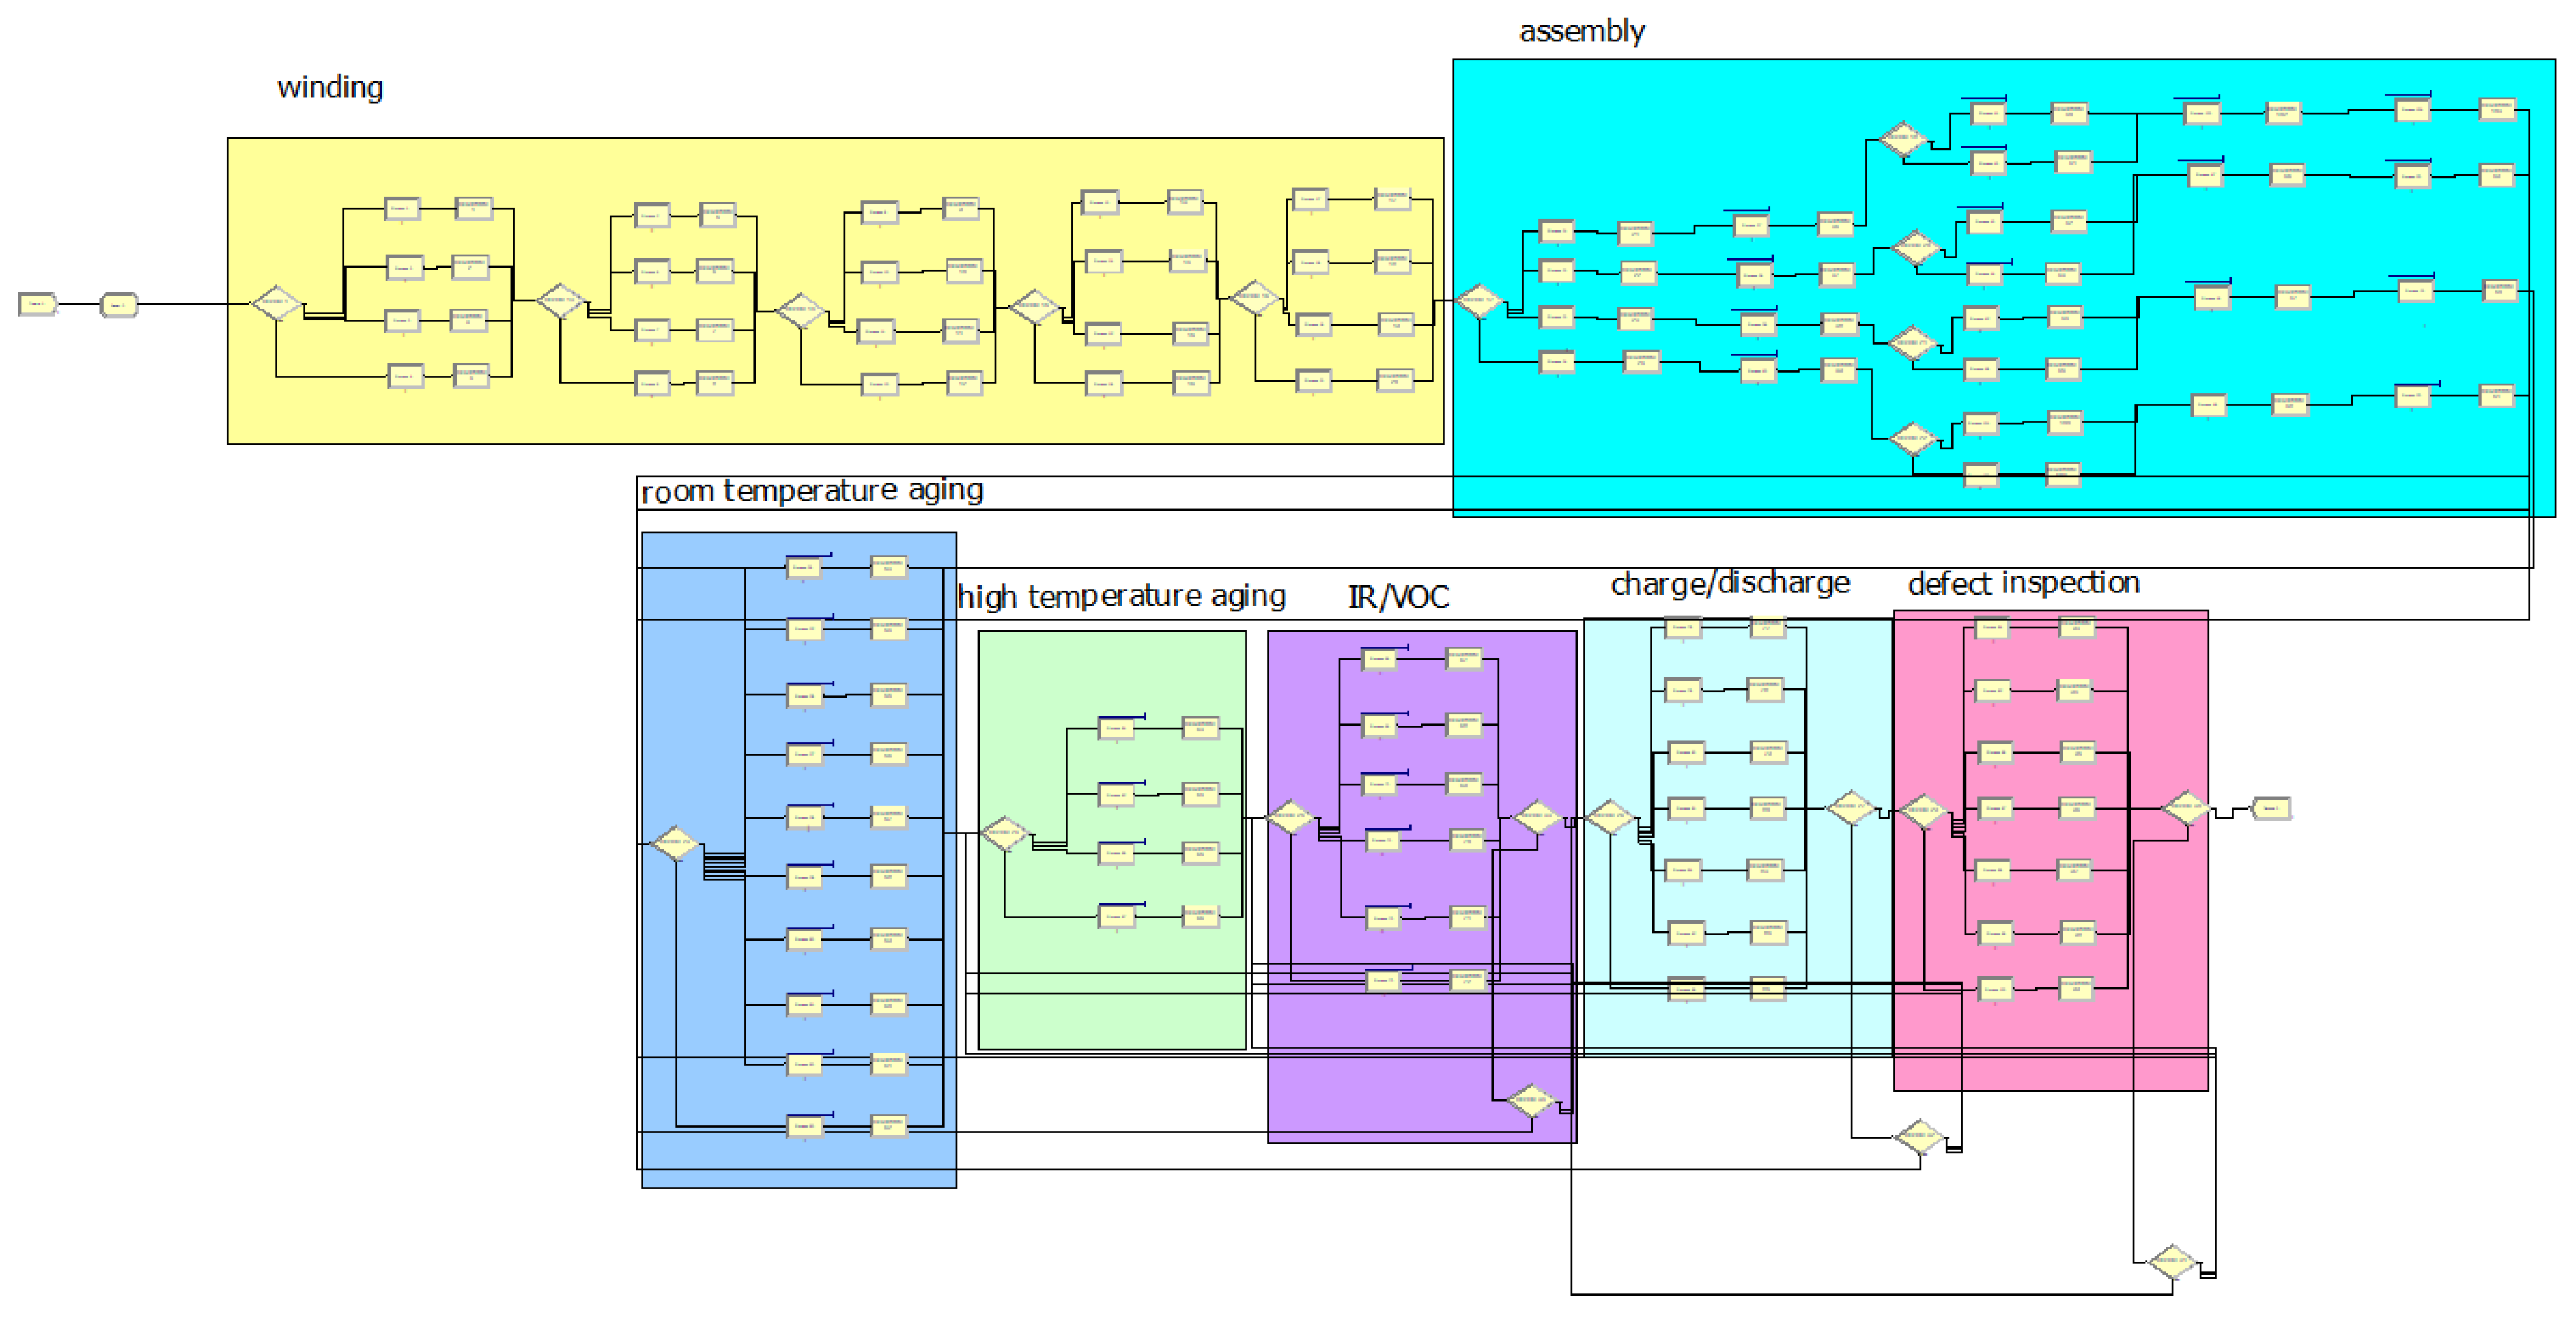
The battery manufacturing process largely consists of plate, assembly, and formation processes as shown in Figure 12.

Figure 12.
Battery manufacturing process.
The plate process is the process of producing filling material for insertion into the battery. This process consists of mixing, which produces the filling material in the form of slurry, coating, in which the slurry is applied to the copper plate, press, which rolls the coated plate, slitting, which cuts the main roll of copper plate into multiple plates to produce a reel, and vacuum/dry. In the case of a positive plate, laminating is added. The assembly process consists of winding the reel produced in the plate process and assembling it with the battery case. Because of the nature of these processes, the plate process uses routing of the job shop type whereas the assembly process uses routing of the flow shop type. The formation process, which involves charging and testing the assembled battery, consists of room-temperature aging, high-temperature aging, charge/discharge, Intensity current/Resistance (IR), Open Circuit Voltage (VOC) inspection, and defect screening. However, this sequence varies depending on the product. This is a highly complex process of which the path is changed by the production status, logistics situation, line operation status, and the existence/absence of defect. Basically, the products are transported by an automatic conveyor, but when a problem occurs, a worker intervenes and determines the logistics route with non-long-term and limited information. Therefore, pattern derivation and anomaly detection from past data can be used in this process. In future, it is likely to evolve into an autonomous and adaptive process by using smart sensors and automated guided vehicles (AGVs). The experiment to assess the performance of SOADS is targeted at the event logs from the assembly process in which the lot number is generated to the formation process.
4.2. Simulation Modeling
To test the performance of the proposed SOADS, the formation process was simulation-modeled to generate event logs. Figure 13 shows the simulation modeling of the battery assembly process and formation process using Arena version 15.1.
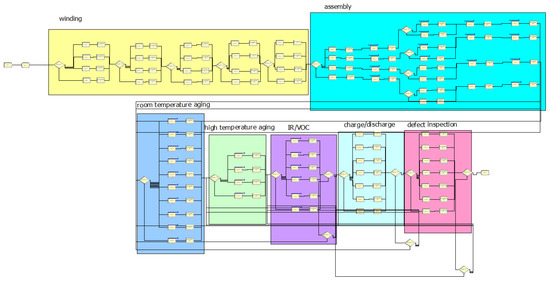
Figure 13.
Illustration of the network used to simulate the battery manufacturing process.
The assembly process consisted of a winding with twenty facilities and an assembly with twenty-four facilities on a dedicated line. In order to derive the high frequency subsequence pattern, the strong path can be shown by setting the probability that the object moves to one facility every quarter to 50% for one dedicated line. The formation process is composed of eight room-temperature aging facilities, four high-temperature aging facilities, six IR test facilities, seven charge/discharge facilities, and seven defect inspection facilities. The basic sequence of the formation process consists of storing all the batteries that have been produced in room temperature and high-temperature aging facilities, IR inspection, charge/discharge, and defect inspection. For IR inspection and charge/discharge, once each process is finished, the battery is inspected for defects and, if found to be defective, it is returned to the previous process. In the last defect inspection, if the battery does not satisfy the criteria, it is returned to the previous process to address the cause of the defect. The anomaly detection process of this study is centered on control flow. Thus, the time required for each process was set to be identical to the travel time between processes. The probability for allocating objects to one of the facilities of each process was varied as 50% to provide a strong path to prevent the attempt to discover the high-frequency subsequence pattern from failing. And the rest of the facilities was set as between 5% and 25% randomly. The defect rate of IR inspection, charge/discharge, and defect inspection was set to 5%. When an object defaults in IR inspection, the probability of returning to the room temperature and high-temperature aging facilities was set 50%, 27% which are the previous process and that before the previous process, and the reprocessing probability was set 23%. When an object defaults in IR inspection, the probability of returning to the room temperature and high-temperature aging facilities was set 50%, 27% and probability of reprocessing and move to IR inspection was set 15%, 8%. In the case of inspection for defects, the probability of returning to the previous process when there are four defective products was set to 32% of room temperature aging, 21% of high temperature aging, 12% of IR inspection, and 35% of charge/discharge.
4.3. Test Environment
The benchmark test of the proposed SOADS was carried out by configuring Hadoop and Spark Cluster using four servers. Among them, three have the same specifications and play the role of data node, and one server plays the configuration role. For this test, Apache Hadoop, Apache Hbase, and Apache Spark were installed on every server. Table 1 lists the specifications of the configuration server and data node servers. It also allocated 20 cores per executor created when running Spark and configured the cluster to use 60 GB of memory.

Table 1.
Specification of servers.
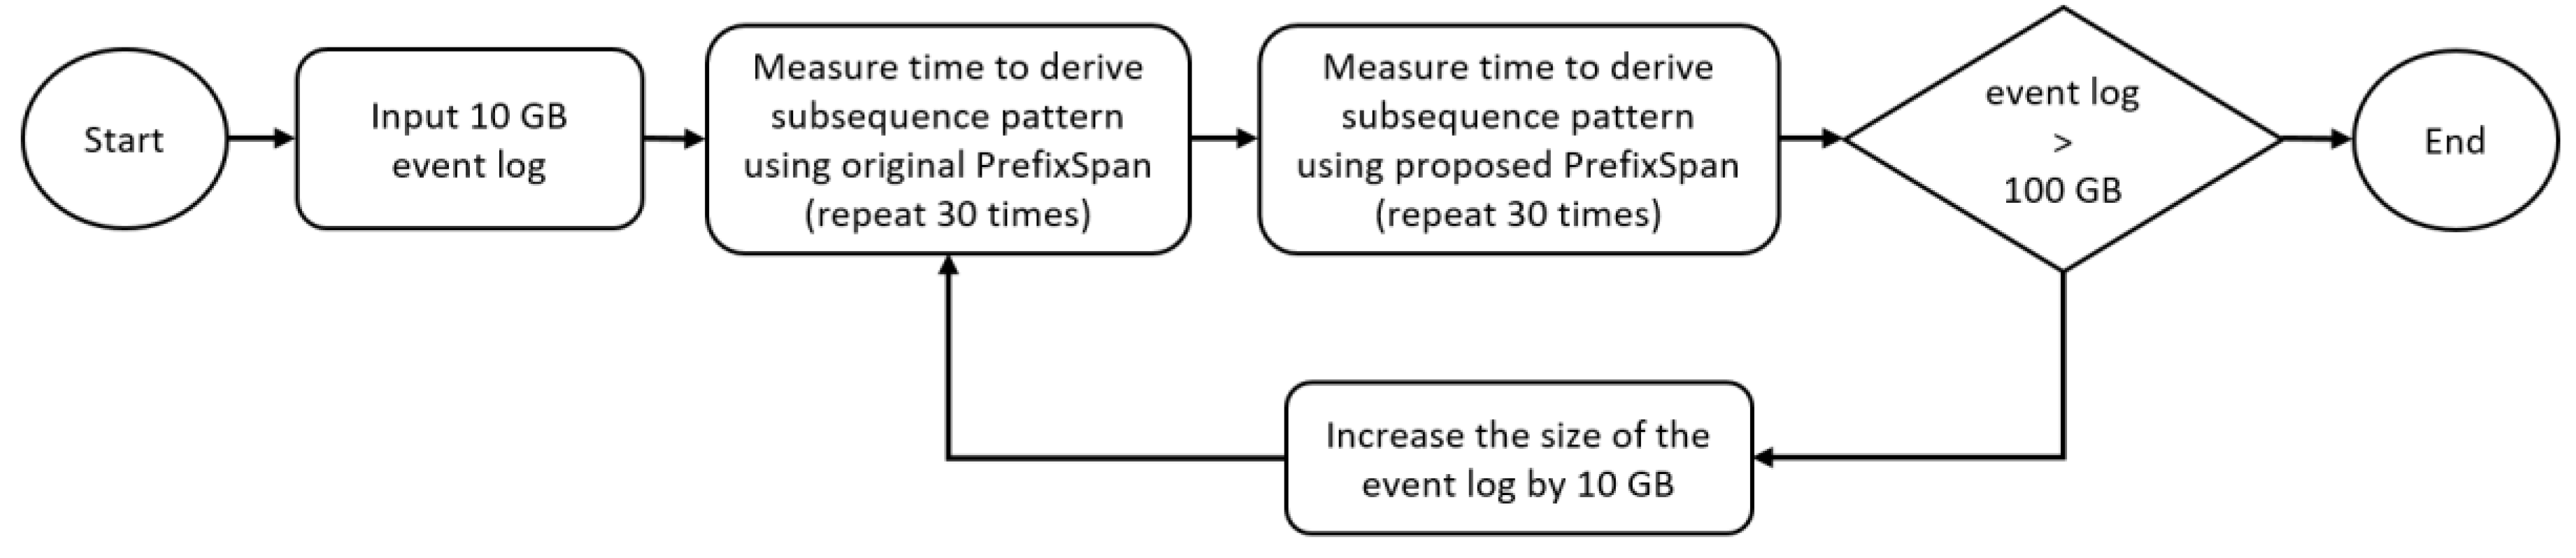
4.4. Performance Test of Frequent Subsequence Miner
To evaluate the performance of the Frequent Subsequence Miner, the 10 GB event log, which stores about 9 million events, is increased to 500 GB, and the time for discovering subsequence patterns were measured at every 100 GB increase. First, 10 GB of event logs was stored in Hbase. The processing time for deriving the subsequence pattern from event logs using the original PrefixSpan algorithm was measured. Next, the processing time for deriving the subsequence pattern using the PrefixSpan algorithm with the RELATIONAL DEPENDENCY TABLE was measured. Each measurement was repeated 30 times and the average processing time was recorded. Figure 14 summarizes the performance experiment of the Frequent Subsequence Miner.

Figure 14.
Process of experiment to assess the performance of the Frequent Subsequence Miner.
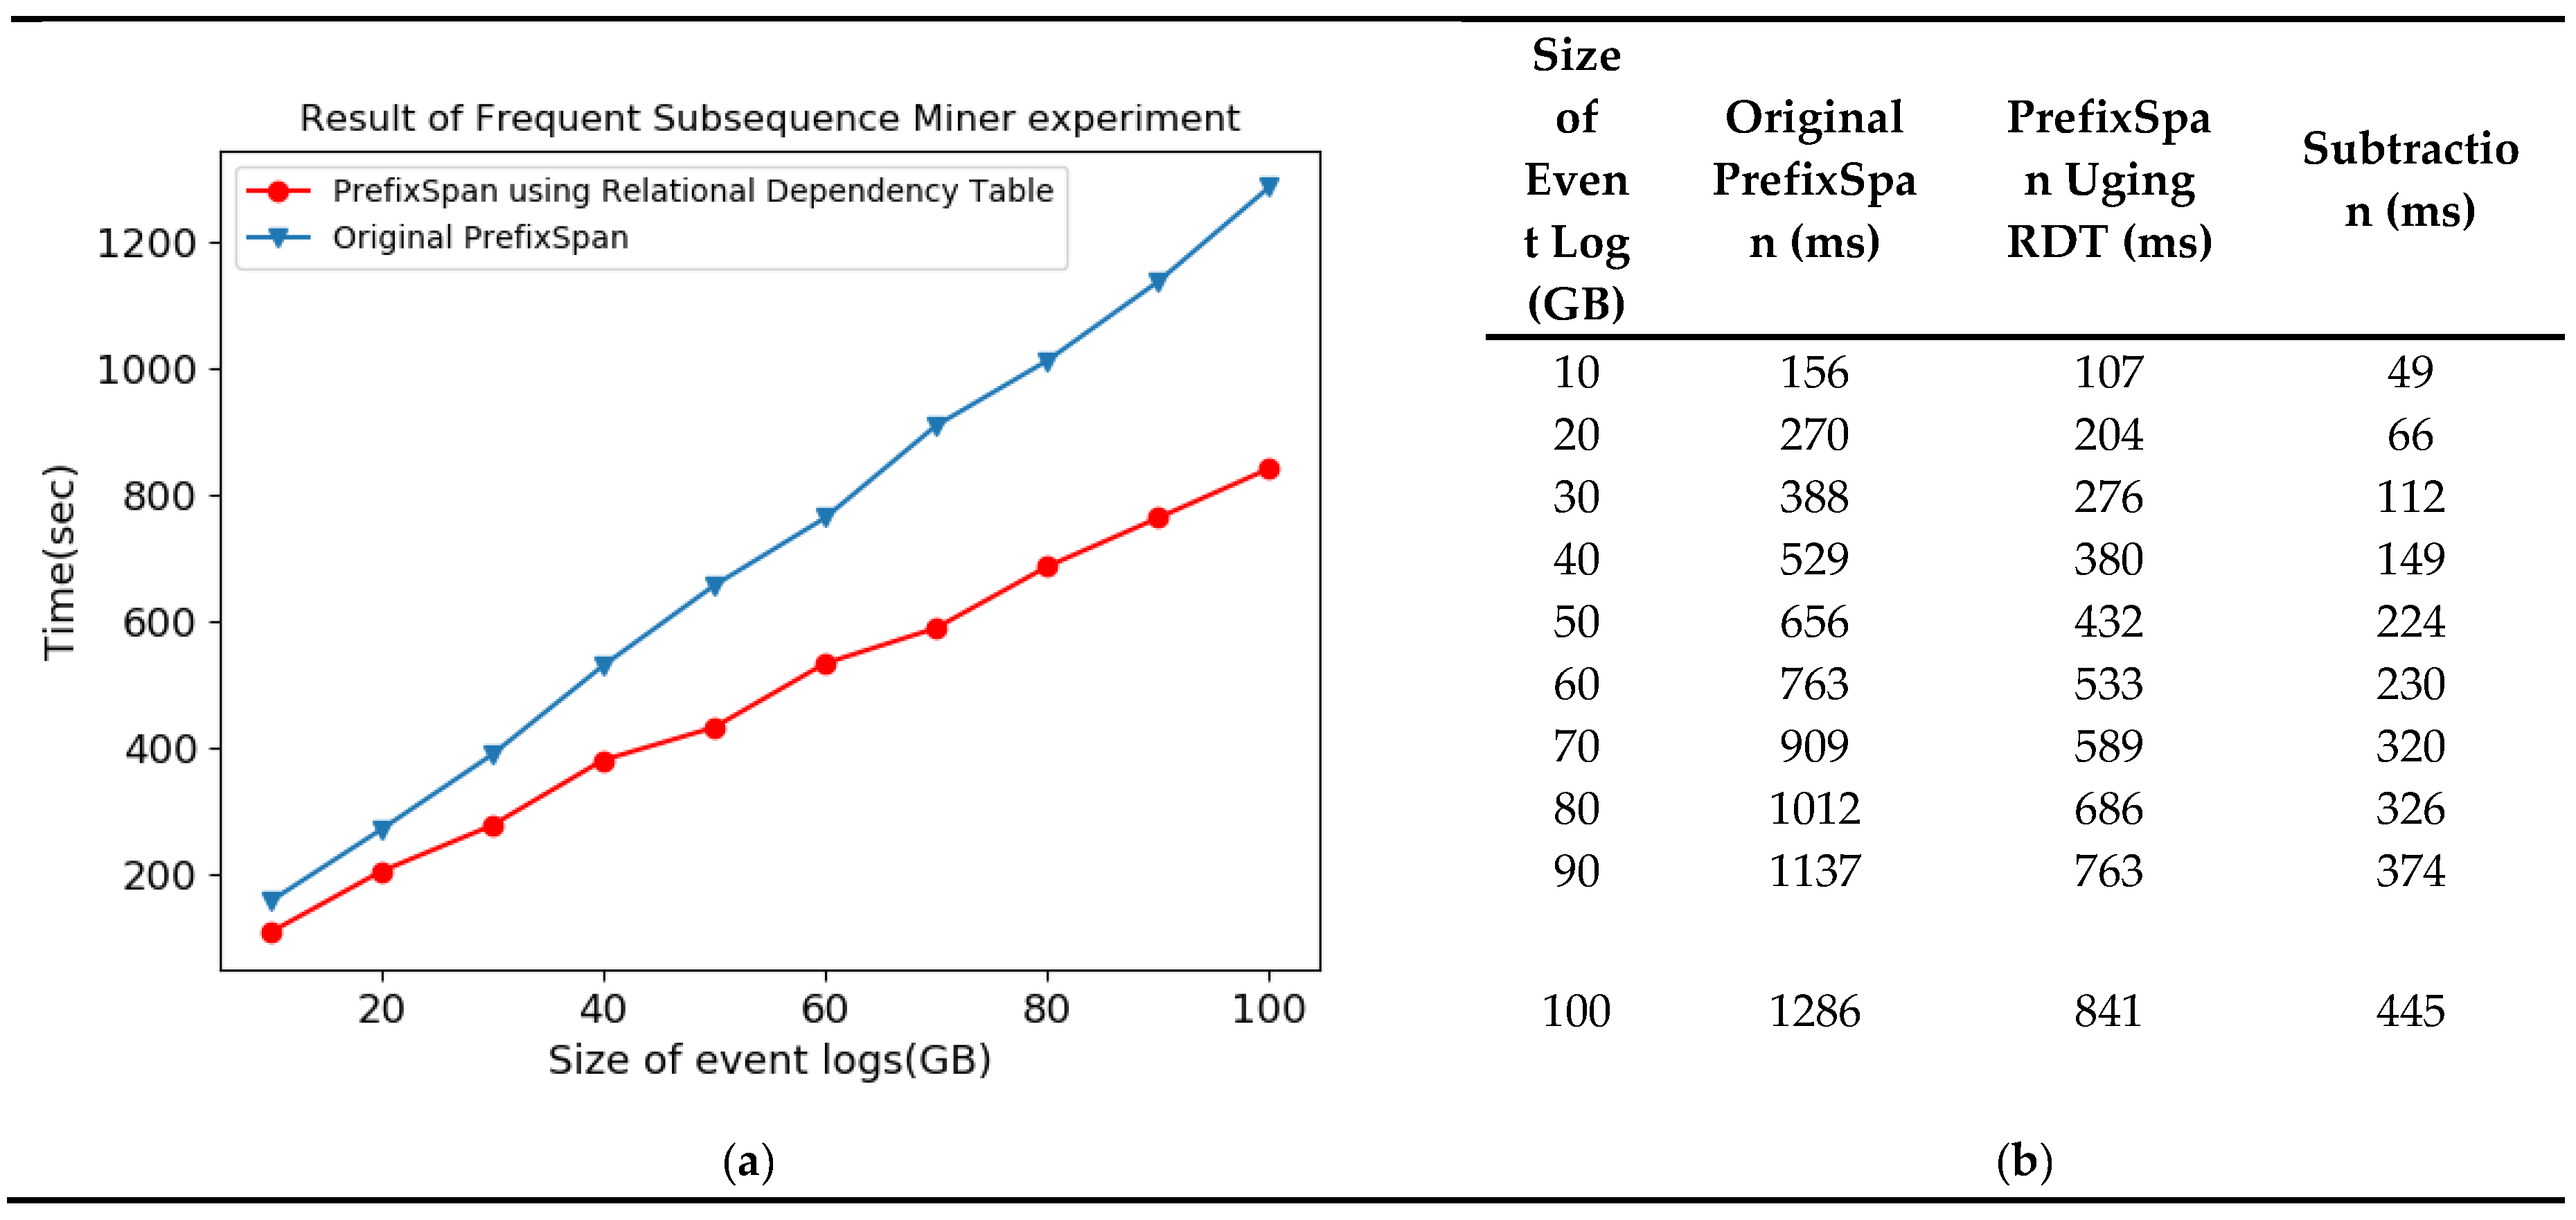
The test results show that the PrefixSpan algorithm using RELATIONAL DEPENDENCY TABLE outperforms the original PrefixSpan algorithm to derive the subsequence pattern, as shown in Figure 15a. Also in Figure 15a,b shows, the gap in subsequence pattern derivation time increases linearly as the size of the event log increases. This means that as the amount of data increases, prefixspan using RELATIONAL DEPENDENCY TABLE is more advantageous.
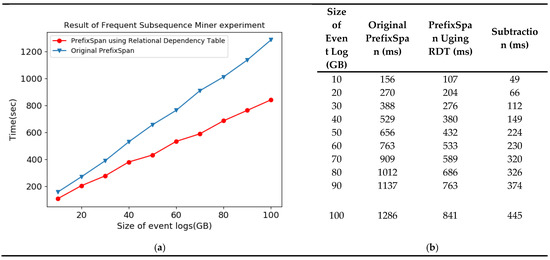
Figure 15.
Result of Frequent Subsequence Miner experiment. (a) Result of frequent subsequence miner test; (b) Details of test result.
4.5. Performance Test of Anomaly Evaluator
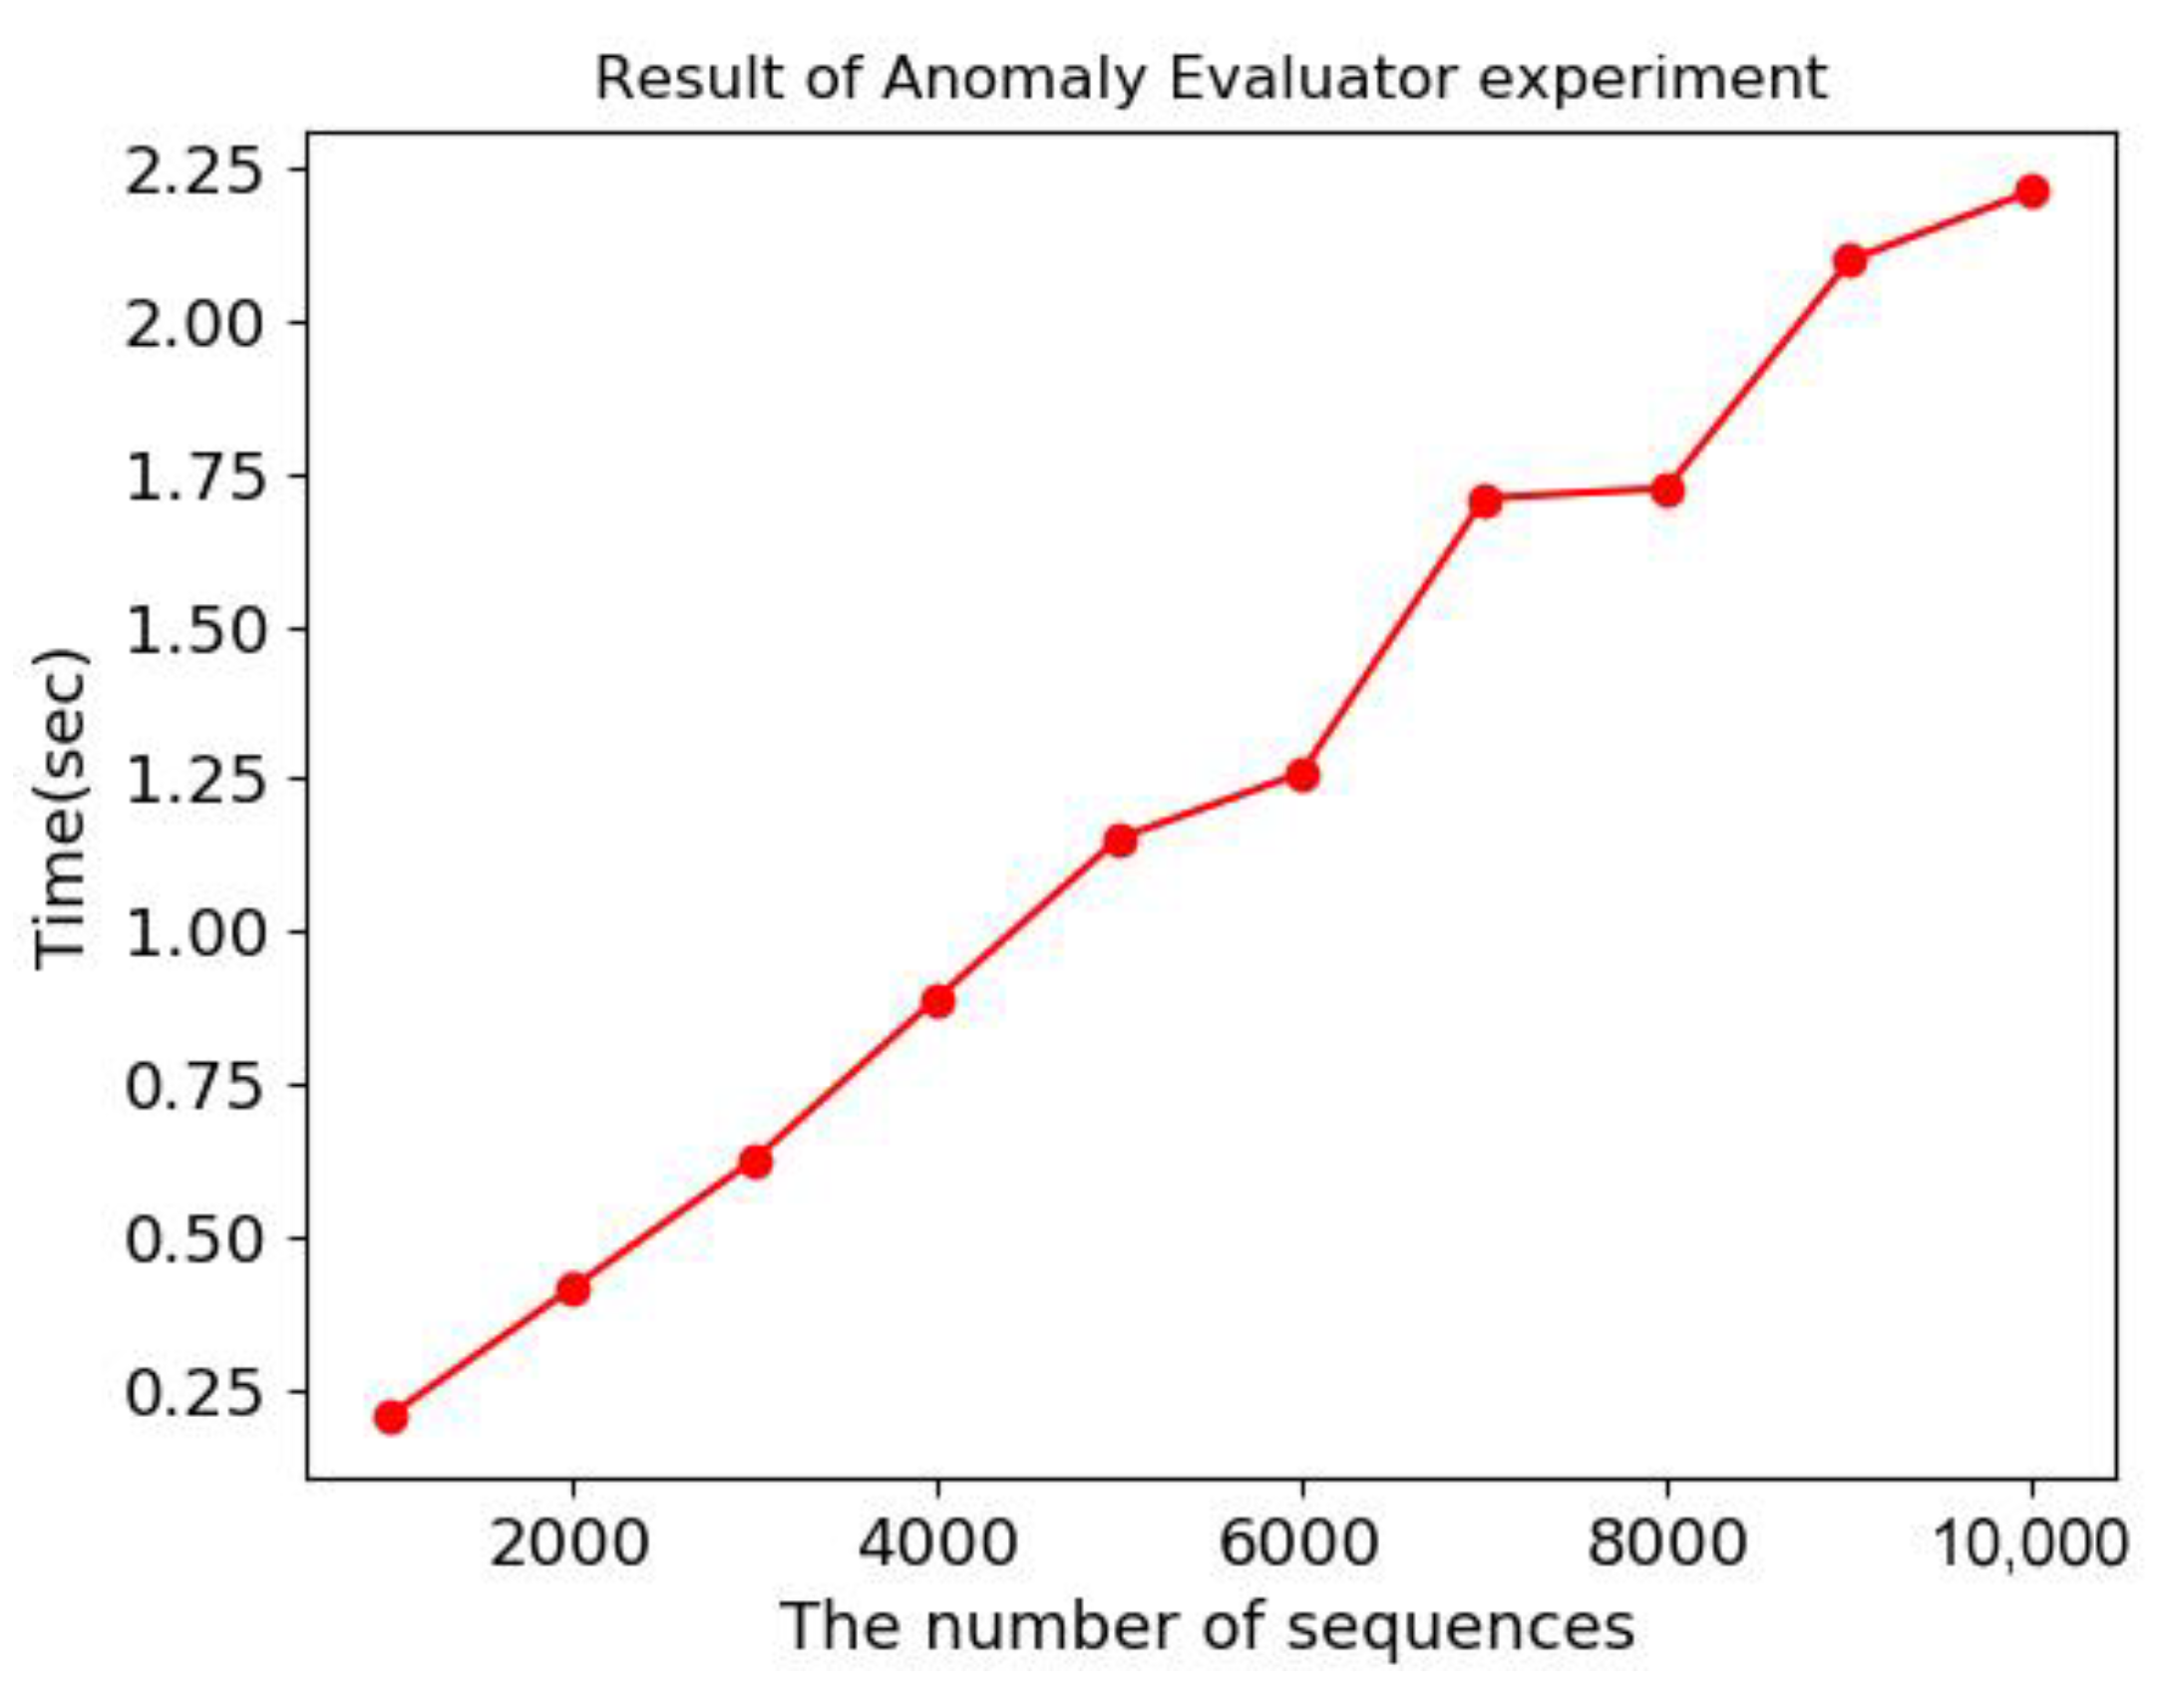
In order to evaluate the performance of anomaly scoring, the number of sequences in the event stream was increased from 1000 to 10,000 by 1000, and sequence alignment was performed on the sequences in the stream and 11 prepared patterns shown in Table 2. The sequence length in the event stream was randomly generated from 15 to 20 corresponding to the process model. The prepared patterns were extracted from the previous experiments described in Sub-Section 4.4.
Table 2.
Subsequence patterns for Anomaly Evaluator experiment.
Experimental results show that the anomaly scoring time increases linearly with the number of sequences in the stream, as shown in Figure 16 below. Increasing linearly rather than exponentially means ensuring stable performance as server resources expand. In addition, it is very good to use sequence alignment for anomaly scoring because it is very fast in less than 3 s to analyze 10,000 sequences even in a small number of clusters.
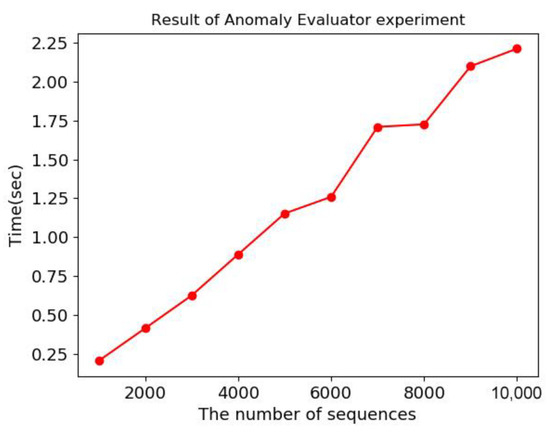
Figure 16.
Result of Anomaly Evaluator experiment.
5. Conclusions and Future Work
This paper proposed the architecture of the Scalable On-line Anomaly Detection System (SOADS), which can be used to detect anomalies of the manufacturing flow by considering the manufacturing process of an autonomous and adaptive smart factory. The goodness of the system was verified via implementation and experimentation. The first advantage of the SOADS is that it satisfies the large-scale system requirement, which is the ability to analyze the flow of objects that are generated in large volumes in an autonomous and adaptive smart factory. This advantage is attributable to the use of Spark streaming and Hbase as subsystems, which are distributed processing technologies. The second advantage is that the method employed for subsequence pattern derivation using the RELATIONAL DEPENCENCY TABLE of the SOADS is efficient in terms of the pattern search time relative to the existing PrefixSpan algorithm, which searches from the length-1 pattern.
Most studies related to smart factories in academic and industrial circles are abstract studies from a high-level perspective, such as from the viewpoint of architecture, reference models, and future prospects, or they address current problems such as automation, failure diagnosis, and quality prediction for unit processes. The main contribution of this study is that it proposed, implemented, and proved a priori a system that can solve problems that may occur in future autonomous and adaptive smart factories for all processes by merging manufacturing (domain), information and communication technology (ICT), and engineering analysis (methodology) unlike previous studies. Furthermore, theories that have been used for data mining and gene sequence analysis were applied to the smart factory (new territory) using distributed computing technology (new computer environment), thus demonstrating that Big Data technology, which is a next-generation technology, can further evolve existing theories, which can be applied to various fields.
The anomaly detection perspective in this study is centered on control flow, and anomaly detection studies from more diverse perspectives are required. Therefore, in the future, we would need to expand this study to more intensively investigate process anomaly detection by considering multiple perspectives including the time perspective, such as processing time and movement time, the data perspective by considering the properties, types, and cost of objects, and the contextual perspective such as temperature and humidity changes in the manufacturing flow. Furthermore, the simulation data used in this study did not consider the noise, which is inevitably generated when barcodes, RFID, and sensors are used in the actual manufacturing process. Therefore, research on the derivation of subsequence pattern and anomaly scoring after refinement of noise of event logs by smoothing, noise filtering, etc. using a method like Bayesian network will be needed.
In the future, this research could be extended to not only deriving material flow patterns in smart factories, but also deriving worker movement and patterns in factories using techniques such as crowd sensing [60,61]. In addition, this research could be integrated with numerous Smart X studies, including smart logistics, smart cities and smart streets [62,63,64], beyond smart factory fields.
Author Contributions
Conceptualization, Y.-S.K. and S.C.; methodology, Y.-S.K.; implementation, S.C.; validation, S.Y. and Y.-S.K.; formal analysis, S.C. and Y.-S.K.; investigation, S.C. and Y.-S.K.; writing—original draft preparation, S.C. and Y.-S.K.; writing—review and editing, Y.-S.K.; visualization, S.C.; supervision, Y.-S.K.; project administration, S.Y. and Y.-S.K.; funding acquisition, Y.-S.K.
Funding
This study was supported by the Basic Science Research Program through the National Research Foundation of Korea (NRF) funded by the Ministry of Education (grant number: NRF-2016R1A6A3A11930205).
Conflicts of Interest
The authors declare no conflict of interest.
References
- Rubmann, M.; Lorenz, M.; Gerber, P.; Waldner, M.; Justus, J.; Engel, P.; Harnisch, M. Industry 4.0: The Future of Productivity and Growth in Manufacturing Industries. BCG Online Article. April 2015. Available online: https://www.bcg.com/enkr/publications/2015/engineered_products_project_business_industry_4_future_productivity_growth_manufacturing_industries.aspx (accessed on 2 May 2018).
- Kang, H.S.; Lee, J.Y.; Choi, S.; Kim, H.; Park, J.H.; Son, J.Y.; Noh, S.D. Smart manufacturing: Past research, present findings, and future directions. Int. J. Precis. Eng. Manuf. Green Technol. 2016, 3, 111–128. [Google Scholar] [CrossRef]
- Radziwon, A.; Bilberg, A.; Bogers, M.; Madsen, E.S. The smart factory: Exploring adaptive and flexible manufacturing solutions. Procedia Eng. 2014, 69, 1184–1190. [Google Scholar] [CrossRef]
- Lee, J.; Bagheri, B.; Kao, H.A. A cyber-physical systems architecture for industry 4.0-based manufacturing systems. Manuf. Lett. 2015, 3, 18–23. [Google Scholar] [CrossRef]
- Wang, S.; Wan, J.; Li, D.; Zhang, C. Implementing smart factory of industrie 4.0: An outlook. Int. J. Distrib. Sens. Netw. 2016, 2016, 3159805. [Google Scholar] [CrossRef]
- Weiss, R. Adidas Brings the Fast Shoe Revolution One Step Closer. 5 October 2017. Available online: https://www.bloomberg.com/news/articles/2017-10-05/adidas-brings-the-fast-shoe-revolution-one-step-closer (accessed on 25 September 2019).
- Fast, Flexible, Modular Production Technology Provides Platform for Future European Growth. Available online: https://cordis.europa.eu/docs/results/228867/final1-f3-factory-keymessages-and-casestudy-summaries.pdf (accessed on 25 September 2019).
- Rozinat, A.; van der Aalst, W.M.P. Conformance checking of processes based on monitoring real behavior. Inf. Syst. 2008, 33, 64–95. [Google Scholar] [CrossRef]
- Bezerra, F.; Wainer, J. Algorithms for anomaly detection of traces in logs of process aware information systems. Inf. Syst. 2013, 38, 33–44. [Google Scholar] [CrossRef]
- Adriansyah, A. Aligning Observed and Modeled Behavior. Ph.D. Thesis, Eindhoven University of Technology, Department of Mathematics and Computer Science, Eindhoven, Paises Baixos, 1 January 2014. [Google Scholar]
- Myers, D.; Suriadi, S.; Radke, K.; Foo, E. Anomaly detection for industrial control systems using process mining. Comput. Secur. 2018, 78, 103–125. [Google Scholar] [CrossRef]
- van der Aalst, W.M.P. Process Mining—Data Science in Action, 2nd ed.; Springer: Berlin/Heidelberg, Germany, 2016. [Google Scholar] [CrossRef]
- Burattin, A.; Cimitile, M.; Maggi, F.M.; Sperduti, A. Online discovery of declarative process models from event streams. IEEE Trans. Serv. Comput. 2015, 8, 833–846. [Google Scholar] [CrossRef]
- Hassani, M.; Siccha, S.; Richter, F.; Seidl, T. Efficient process discovery from event streams using sequential pattern mining. In Proceedings of the 2015 IEEE Symposium Series on Computational Intelligence, Cape Town, South Africa, 7–10 December 2015; pp. 1366–1373. [Google Scholar]
- van Zelst, S.J.; van Dongen, B.F.; van der Aalst, W.M. Event stream-based process discovery using abstract representations. Knowl. Inf. Syst. 2018, 54, 407–435. [Google Scholar] [CrossRef]
- van Zelst, S.J.; Bolt, A.; Hassani, M.; van Dongen, B.F.; van der Aalst, W.M. Online conformance checking: Relating event streams to process models using prefix-alignments. Int. J. Data Sci. Anal. 2017, 27, 1–16. [Google Scholar] [CrossRef]
- Burattin, A.; van Zelst, S.J.; Armas-Cervantes, A.; van Dongen, B.F.; Carmona, J. Online conformance checking using behavioural patterns. In Proceedings of the International Conference on Business Process Management, Sydney, Australia, 9–14 September 2018; Springer: Cham, Switzerland, 2018; pp. 250–267. [Google Scholar]
- Fuzzy mining: Adaptive process simplification based on multi-perspective metrics BPM’07. In Proceedings of the Business Process Management, Brisbane, Australia, 24–28 September 2007; pp. 328–343.
- Varun, C.; Banerjee, A.; Kumar, V. Anomaly detection: A survey. ACM Comput. Surv. 2009, 41, 15. [Google Scholar]
- Denning, D.E. An intrusion-detection model. IEEE Trans. Softw. Eng. 1987, 2, 222–232. [Google Scholar] [CrossRef]
- De Stefano, C.; Sansone, C.; Vento, M. To reject or not to reject: That is the question—An answer in case of neural classifiers. IEEE Trans. Syst. Man Cybern. Syst. C 2000, 30, 84–94. [Google Scholar] [CrossRef]
- Schölkopf, B.; Platt, J.C.; Shawe-Taylor, J.; Smola, A.J.; Williamson, R.C. Estimating the support of a high-dimensional distribution. Neural Comput. 2001, 13, 1443–1471. [Google Scholar] [CrossRef]
- Hawkins, S.; He, H.; Williams, G.; Baxter, R. Outlier detection using replicator neural networks. In Proceedings of the International Conference on Data Warehousing and Knowledge Discovery, Aix-en-Provence, France, 4–6 September 2002; Springer: Berlin/Heidelberg, Germany, 2002; pp. 170–180. [Google Scholar]
- Van Der Aalst, W. Process Mining: Discovery, Conformance and Enhancement of Business Processes; Springer: Berlin/Heidelberg, Germany, 2011; Volume 2. [Google Scholar]
- Van der Aalst, W.; Adriansyah, A.; van Dongen, B. Replaying history on process models for conformance checking and performance analysis. Wiley Interdiscip. Rev. Data Min. Knowl. Discov. 2012, 2, 182–192. [Google Scholar] [CrossRef]
- Aleskerov, E.; Freisleben, B.; Rao, B. Cardwatch: A neural network based database mining system for credit card fraud detection. In Proceedings of the IEEE/IAFE 1997 Computational Intelligence for Financial Engineering (CIFEr), New York, NY, USA, 24–25 March 1997. [Google Scholar]
- Fujimaki, R.; Yairi, T.; Machida, K. An approach to spacecraft anomaly detection problem using kernel feature space. In Proceedings of the Eleventh ACM SIGKDD International Conference on Knowledge Discovery in Data Mining, Chicago, IL, USA, 21–24 August 2005. [Google Scholar]
- van der Aalst, W.M.P. Process Mining: Overview and Opportunities. ACM Trans. Manag. Inf. Syst. 2012, 3, 1–17. [Google Scholar] [CrossRef]
- Carmona, J.; van Dongen, B.F.; Solti, A.; Weidlich, M. Part II. A Deep Dive into Conformance Checking. In Conformance Checking—Relating Processes and Models; Springer: Berlin/Heidelberg, Germany, 2018; pp. 95–210. [Google Scholar]
- Carmona, J.; van Dongen, B.F.; Solti, A.; Weidlich, M. Part III. Conformance Checking Applications. In Conformance Checking—Relating Processes and Models; Springer: Berlin/Heidelberg, Germany, 2018; pp. 211–263. [Google Scholar]
- Van den Broucke, S.K.L.M.; Munoz-Gama, J.; Carmona, J.; Baesens, B.; Vanthienen, J. Event-based real-time decomposed conformance analysis. In OTM Confederated International Conferences, On the Move to Meaningful Internet Systems 2014; Springer: Berlin/Heidelberg, Germany, 2014; Volume 8841, pp. 345–363. [Google Scholar]
- van Zelst, S.J.; Bolt, A.; van Dongen, B.F. Tuning alignment computation: An experimental evaluation. In Proceedings of the International Workshop on Algorithms & Theories for the Analysis of Event Data (ATAED), Zaragoza, Spain, 26–27 June 2017; pp. 6–20. [Google Scholar]
- Teng, H.S.; Chen, K.; Lu, S.C. Adaptive real-time anomaly detection using inductively generated sequential patterns. In Proceedings of the IEEE Computer Society Symposium on Security and Privacy, Oakland, CA, USA, 6–8 May 1990. [Google Scholar]
- Leemans, S.J.J.; Fahland, D.; Van der Aalst, W.M.P. Scalable process discovery and conformance checking. Soft. Syst. Mod. 2018, 17, 599–631. [Google Scholar] [CrossRef]
- Reißner, D.; Conforti, R.; Dumas, M.; La Rosa, M.; Armas-Cervantes, A. Scalable conformance checking of business processes. In Proceedings of the OTM Confederated International Conferences On the Move to Meaningful Internet Systems, Rhodes, Greece, 23–27 October 2017; pp. 607–627. [Google Scholar]
- van der Aalst, W.; Damiani, E. Processes meet big data: Connecting data science with process science. IEEE Trans. Serv. Comput. 2015, 8, 810–819. [Google Scholar] [CrossRef]
- Alizadeh, M.; Lu, X.; Fahland, D.; Zannone, N.; van der Aalst, W.M.P. Linking data and process perspectives for conformance analysis. Comput. Secur. 2018, 73, 172–193. [Google Scholar] [CrossRef]
- Borrego, D.; Barba, I. Conformance checking and diagnosis for declarative business process models in data-aware scenarios. Expert Syst. Appl. 2014, 41, 5340–5352. [Google Scholar] [CrossRef]
- Burattin, A.; Maggi, F.M.; Sperduti, A. Conformance checking based on multi-perspective declarative process models. Expert Syst. Appl. 2016, 65, 194–211. [Google Scholar] [CrossRef] [Green Version]
- De Leoni, M.; Van Der Aalst, W.M.P.; Van Dongen, B.F. Data-and resource-aware conformance checking of business processes. In Proceedings of the International Conference on Business Information Systems, Vilnius, Lithuania, 21–23 May 2012; Springer: Berlin/Heidelberg, 2012; pp. 48–59. [Google Scholar]
- Mannhardt, F.; De Leoni, M.; Reijers, H.A.; Van Der Aalst, W.M.P. Balanced multi-perspective checking of process conformance. Computing 2016, 98, 407–437. [Google Scholar] [CrossRef]
- Škulj, G.; Butala, P. Anomaly detection in shop floor material flow: A network theory approach. CIRP Ann. 2013, 62, 487–490. [Google Scholar]
- Ladiges, J.; Fülber, A.; Arroyo, E.; Fay, A.; Haubeck, C.; Lamersdorf, W. Learning material flow models for manufacturing plants from data traces. In Proceedings of the IEEE 13th International Conference on Industrial Informatics (INDIN), Cambridge, UK, 22–24 July 2015; pp. 294–301. [Google Scholar]
- Reynolds, T.G.; Hansman, R.J. Proceedings of the IEEE 21st Digital Avionics Systems Conference, Irvine, CA, USA, 27–31 October 2002; p. 2.
- Fu, Z.; Hu, W.; Tan, T. Similarity based vehicle trajectory clustering and anomaly detection. In Proceedings of the IEEE International Conference on Image Processing, Genova, Italy, 14 September 2005; p. 2. [Google Scholar]
- Zhou, Y.; Yan, S.; Huang, T.S. Detecting anomaly in videos from trajectory similarity analysis. In Proceedings of the IEEE International Conference on Multimedia and Expo, Beijing, China, 2–5 July 2007. [Google Scholar]
- Zhang, D.; Li, N.; Zhou, Z.H.; Chen, C.; Sun, L.; Li, S. iBAT: Detecting anomalous taxi trajectories from GPS traces. In Proceedings of the 13th International Conference on Ubiquitous Computing ACM, Beijing, China, 17–21 September 2011; pp. 99–108. [Google Scholar]
- Camossi, E.; Dimitrova, T.; Tsois, A. Detecting anomalous maritime container itineraries for anti-fraud and supply chain security. In Proceedings of the 2012 European Intelligence and Security Informatics Conference, Odense, Denmark, 22–24 August 2012; pp. 76–83. [Google Scholar]
- Kwon, D.; Kim, H.; Kim, J.; Suh, S.C.; Kim, I.; Kim, K.J. A survey of deep learning-based network anomaly detection. Cluster Comput. 2017, 22, 1–13. [Google Scholar] [CrossRef]
- Cattell, R. Scalable SQL and NoSQL data stores. ACM SIGMOD Rec. 2011, 39, 12–27. [Google Scholar] [CrossRef] [Green Version]
- Agrawal, R.; Srikant, R. Mining sequential patterns. In Proceedings of the 11th Conference on Data Engineering (ICDE), Taipei, Taiwan, 6–10 March 1995; pp. 3–14. [Google Scholar]
- Hirate, Y.; Yamana, H. Generalized Sequential Pattern Mining with Item Intervals. J. Comput. 2006, 1, 51–60. [Google Scholar] [CrossRef]
- Pei, J.; Han, J.; Mortazavi-Asl, B.; Pinto, H.; Chen, Q.; Dayal, U.; Hsu, M.C. Prefixspan: Mining sequential patterns efficiently by prefix-projected pattern growth. In Proceedings of the 17th International Conference on Data Engineering, Heidelberg, Germany, 2–6 April 2001; pp. 215–224. [Google Scholar]
- Mount, D.W. Bioinformatics: Sequence and Genome Analysis, 2nd ed.; Cold Spring Harbor Laboratory Press: New York, NY, USA, 2004; Volume 692. [Google Scholar]
- Smith, T.F.; Waterman, M.S. Identification of common molecular subsequences. J. Mol. Biol. 1981, 147, 195–197. [Google Scholar] [CrossRef]
- Kang, Y.S.; Park, I.H.; Youm, S. Performance prediction of a MongoDB-based traceability system in smart factory supply chains. Sensors 2016, 16, 2126. [Google Scholar] [CrossRef]
- Zhao, G.; Ling, C.; Sun, D. SparkSW: Scalable distributed computing system for large-scale biological sequence alignment. In Proceedings of the 15th IEEE/ACM International Symposium on Cluster, Cloud and Grid Computing, Shenzen, China, 4–7 May 2015; pp. 845–852. [Google Scholar]
- Xu, B.; Li, C.; Zhuang, H.; Wang, J.; Wang, Q.; Zhou, X. Efficient distributed Smith-Waterman algorithm based on Apache Spark. In Proceedings of the 2017 IEEE 10th International Conference on Cloud Computing (CLOUD), Honolulu, HI, USA, 25–30 June 2017; pp. 608–615. [Google Scholar]
- Al-Ars, Z.; Mushtaq, H. Scalability Potential of BWA DNA Mapping Algorithm on Apache Spark. In Proceedings of the 2nd Annual International Symposium on Information Management and Big Data—SIMBig, Cusco, Peru, 2–4 September 2015; pp. 85–88. [Google Scholar]
- Dardari, D.; Pasolini, G.; Zabini, F. An efficient method for physical fields mapping through crowdsensing. Pervasive Mob. Comput. 2018, 48, 69–83. [Google Scholar] [CrossRef]
- Ma, H.; Zhao, D.; Yuan, P. Opportunities in mobile crowd sensing. IEEE Commun. Mag. 2014, 52, 29–35. [Google Scholar] [CrossRef]
- Lee, C.K.M.; Lv, Y.; Ng, K.K.H.; Ho, W.; Choy, K.L. Design and application of Internet of things-based warehouse management system for smart logistics. Int. J. Prod. Res. 2018, 56, 2753–2768. [Google Scholar] [CrossRef]
- Lom, M.; Pribyl, O.; Svitek, M. Industry 4.0 as a part of smart cities. In Proceedings of the 2016 Smart Cities Symposium Prague (SCSP), Prague, Czech Republic, 26–27 May 2016. [Google Scholar]
- Petritoli, E.; Leccese, F.; Botticelli, M.; Pizzuti, S.; Pieroni, F. A RAMS analysis for a precision scale-up configuration of “Smart Street” pilot site: An Industry 4.0 Case Study. ACTA IMEKO 2019, 8, 3–11. [Google Scholar] [CrossRef]


© 2019 by the authors. Licensee MDPI, Basel, Switzerland. This article is an open access article distributed under the terms and conditions of the Creative Commons Attribution (CC BY) license (http://creativecommons.org/licenses/by/4.0/).