Article

Stretched Exponential Survival Analysis for South Korean Females

by
Byung Mook Weon
1,2,3
1
Soft Matter Physics Laboratory, School of Advanced Materials Science and Engineering, SKKU Advanced Institute of Nanotechnology (SAINT), Sungkyunkwan University, Suwon 16419, Korea
2
Research Center for Advanced Materials Technology, Sungkyunkwan University, Suwon 16419, Korea
3
Department of Biomedical Engineering, Johns Hopkins University, Baltimore, MD 21218, USA
Appl. Sci. 2019, 9(20), 4230; https://doi.org/10.3390/app9204230
Submission received: 7 September 2019 / Revised: 27 September 2019 / Accepted: 30 September 2019 / Published: 10 October 2019
(This article belongs to the Special Issue Medical Informatics and Data Analysis)

Abstract

:

Featured Application

The stretched exponential survival analysis enables quantitative and comparative study of female lifespan between South Korea and other countries, particularly quantifying the survival rate, the characteristic life, and the maximum lifespan.

Abstract

South Korea has recently exhibited a remarkable rapid increase in female lifespan. Here, a mathematical analysis is suggested for a clear interpretation of current trends in female lifespan in South Korea. To mathematically analyze life tables, a modified stretched exponential function is employed and demonstrated to estimate current trends of female lifespan in South Korea based on reliable life tables from 1987 to 2016 taken from the Korean Statistical Information Service. This methodology enables us to perform quantitative and comparative analyses of female lifespan in South Korea with representative industrialized countries such as Japan, France, Australia, Switzerland, UK, Sweden, and USA. This analysis provides quantitative and comparative evidence that South Korea has the highest increase rate of female lifespan over the past three decades. Further application would be feasible for a better estimation of human aging statistics.

1. Introduction

Statistical analysis of human lifespan is a central topic in demography and gerontology. Life expectancy of humans has risen steadily and rapidly over the past 150 years in most countries and keeps increasing in the 21st century [1,2,3]. A recent study of 35 industrialized countries shows an interesting projection: there is more than 50% probability that by 2030, female life expectancy is likely to break the 90-year barrier [4]. Interestingly, South Korea is predicted to have the highest female life expectancy at birth by 2030 [4]. This prediction is achieved by applying a mathematical ensemble of 21 forecasting models to reliable statistics data about life tables for humans [4]. South Korean females are an important model to understand current trends in human lifespan and a better survival analysis is required for a better understanding of human lifespan.
To achieve a more reliable prediction, a mathematical model of human survival curves is helpful in quantifying current trends in human lifespan for human aging and demography research [5,6,7,8]. In fact, many mathematical models for survival curves have been proposed, including the Gompertz, Weibull, Heligman-Pollard, Kannisto, quadratic, and logistic models [5]. In a recent work, a mathematical model has been suggested owing to a usefulness to describe survival curves with complexity in shape by adopting a modified function from the stretched exponential (Weibull or Kohlrausch–Williams–Watts) function [9,10,11,12,13,14]. Flexibility of a modified stretched exponential function, originating from an age-dependent stretched exponent, enables us to mathematically describe plasticity and rectangularity of survival curves [5,13]. In this work, by incorporating this mathematical model to the reliable life table datasets taken from the Korean Statistical Information Service (KOSIS, http://kosis.kr/eng), a practical application is demonstrated to quantify current trends in female lifespan for South Korea over three recent decades, from 1987 to 2016. This analysis for South Korea is compared with that for Japan, France, Australia, Switzerland, UK, Sweden, and USA, which are the representative leading countries in longevity [4].
In this study, a mathematical analysis with a modified stretched exponential model is demonstrated to interpret the recent survival curves for South Korean female, taken from the Korean Statistical Information Service. The current trends for 1987–2016 are estimated from the female survival curves in South Korea based on the estimates of the characteristic life and the maximum lifespan.

2. Methods

The stretched exponential survival analysis is summarized as follows. The methodology is based on the modified stretched exponential function to describe the human survival curves, which has been developed for the past decade [5,12,13,14]. This section briefly introduces into the mathematical approach. The survival rate, s ( x ) , is a function of age, x. Mathematically the mortality rate (equivalently the hazard function or the force of mortality), μ ( x ) = d ln ( s ( x ) ) / d x , is the derivative of the survival rate with respect to age. As a mathematical constraint, s ( x ) is a monotonic decrease function with age, starting from 1 and ending to 0. To mathematically describe the survival curves, a modified stretched exponential function is quite flexible by applying a form of s ( x ) = exp ( ( x / α ) β ( x ) ) where the stretched exponent, β ( x ) , is an age-dependent term as β ( x ) = ln [ ln ( s ( x ) ) ] / ln ( x / α ) and the characteristic life, α , is a reference age, determined at s ( α ) = exp ( 1 ) that equals to the interception point between s ( x ) and s ( α ) = exp ( 1 ) [5,12,13,14]. The characteristic life is an alternative to the life expectancy at birth, ε [14,15]. The age dependence of the stretched exponent is the critical feature of the modified stretched exponential function, which is fundamentally different from the classical stretched exponential function [5,12,13,14]. The characteristic life and the stretched exponent are useful to respectively describe the scale effect (associated with living longer, characterized by α ) and the shape effect (associated with growing older, characterized by β ( x ) ) of the individual survival curve [14]. For old-age patterns, the quadratic formula of β ( x ) = β 0 + β 1 x + β 2 x 2 is applicable [5,12], which leads to the occurrence of the (mathematical) maximum lifespan, ω , which is obtained at the age for β ( x ) = x ln ( x / α ) d β ( x ) d x by the mathematical constraint of d s ( x ) d x 0 [12]. This methodology is beneficial in modeling the human mortality curves in very old age [5].

3. Results and Discussion

3.1. Survival Analysis

The survival curves for women were obtained at the complete life tables taken from the Korean Statistical Information Service (http://kosis.kr/eng). Figure 1 shows how we evaluate the survival curves for Korean female in the most recent decades, 1987–2016. The summarized survival curves in Figure 1a show the historic trends in the survival rates for Korean female over three recent decades. The survival curves for Korean female show that s ( x ) gradually decreases with age and historically shifts rightwards and towards a rectangular shape over three recent decades, as consistent with Swedish female [5,14].
The characteristic life, α , indicating the scale effect of the individual survival curve, was measured for each survival curve through the graphical analysis at s ( α ) = exp ( 1 ) 0.367879 . The recent historic trends in the α values were summarized in Figure 1b. The characteristic life for Korean female was depicted as a function of the calendar year (1987–2016) in Figure 1b. This result shows that the α value linearly increases at a constant rate of ∼2.88 years per decade (as marked by the solid line in Figure 1b). This steady increase rate for South Korean female is much higher than the rate of ∼1.20 years per decade for Swedish female in the previous analyses (data from the Human Mortality Database, http://www.mortality.org) [5,14]. The historic trends in the characteristic life clearly demonstrate that South Korean women have lived longer in the past three decades.
The β ( x ) value, indicating the shape effect of the individual survival curve, was obtained from β ( x ) = x ln ( x / α ) d β ( x ) d x as shown in Figure 1c. Particularly as demonstrated in Figure 1d, old-age patterns of β ( x ) at ages over 60 years could be empirically fitted with the quadratic formula as β ( x ) = β 0 + β 1 x + β 2 x 2 as suggested previously [5,12,13]. The modified stretched exponential function is successfully applicable to the survival curves and to the age-dependent stretched exponents for all ages (Figure 1c) and for old ages over 60 years (Figure 1d). Most remarkably, the β ( x ) curve smoothly varies with age at old ages over 60 years and old-age β ( x ) patterns over 90 years can be depicted with the quadratic function of age. As found previously, the β ( x ) patterns for old-age populations undergo the phase transition with age: β ( x ) increases with age at x < α and decreases with age at x > α [12]. The phase transition appears in South Korean female datasets after the calendar year of 1995: there are phase transitions for 1995–2016 and no transitions for 1987–1994, as separately marked in Figure 1d. Considering old-age β ( x ) patterns, the female lifespan of South Korea would experience the critical phase change through the calendar year of 1995. The historic trends in age dependence in β ( x ) clearly show how the female lifespan in South Korea has been growing older during 1987–2016.

3.2. Characteristic Life Analysis

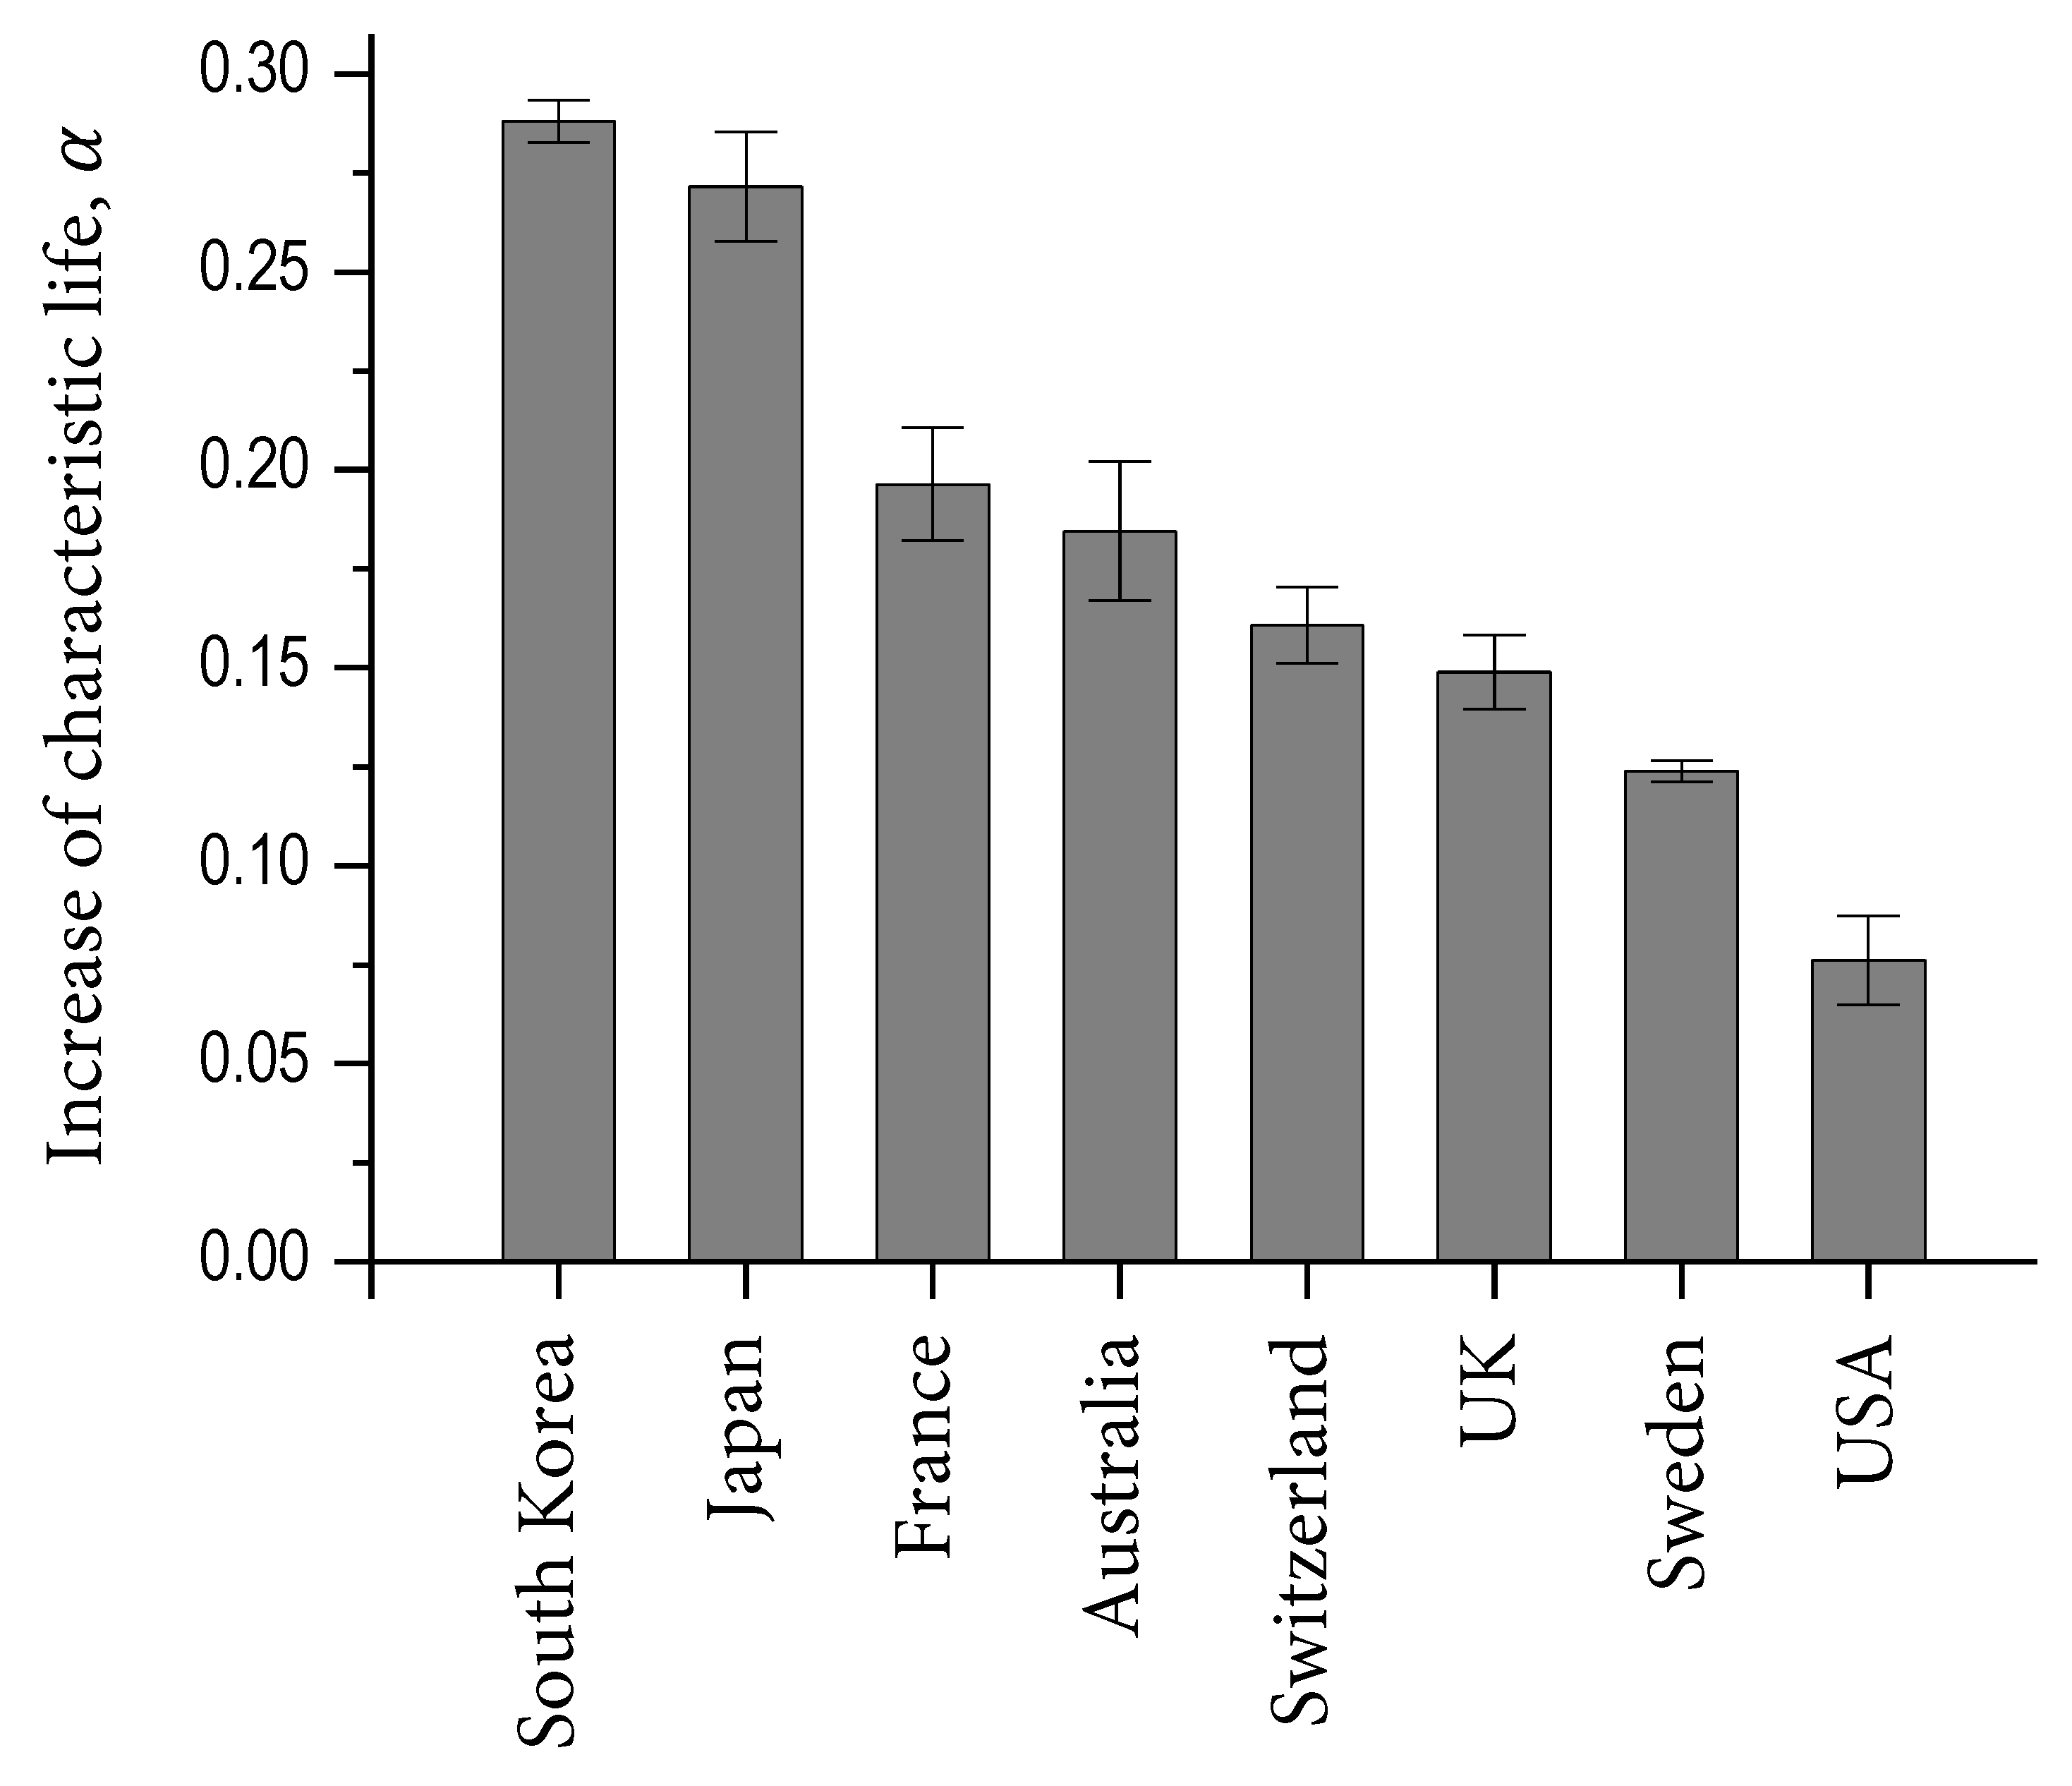
The comparison in the increase rate of α for South Korea with that for major industrialized countries is shown in Figure 2. The increase rate in α was obtained from Figure 1b for South Korea, 1987–2016 (data from the Korean Statistical Information Service, http://kosis.kr/eng), and from literature [14] for other countries, 1980–2010 (data from the Human Mortality Database, http://www.mortality.org). The error bars were taken from the standard errors by linear fits. The increase rate in α per decade was evaluated as ∼2.88 years for South Korea, ∼2.71 years for Japan, ∼1.96 years for France, ∼1.85 years for Australia, ∼1.61 years for Switzerland, ∼1.49 years for UK, ∼1.24 years for Sweden, and ∼0.76 years for USA. This analysis result confirms the highest increase rate of the characteristic life for women in South Korea among the representative high-income countries including Japan, France, Australia, Switzerland, UK, Sweden, and USA.
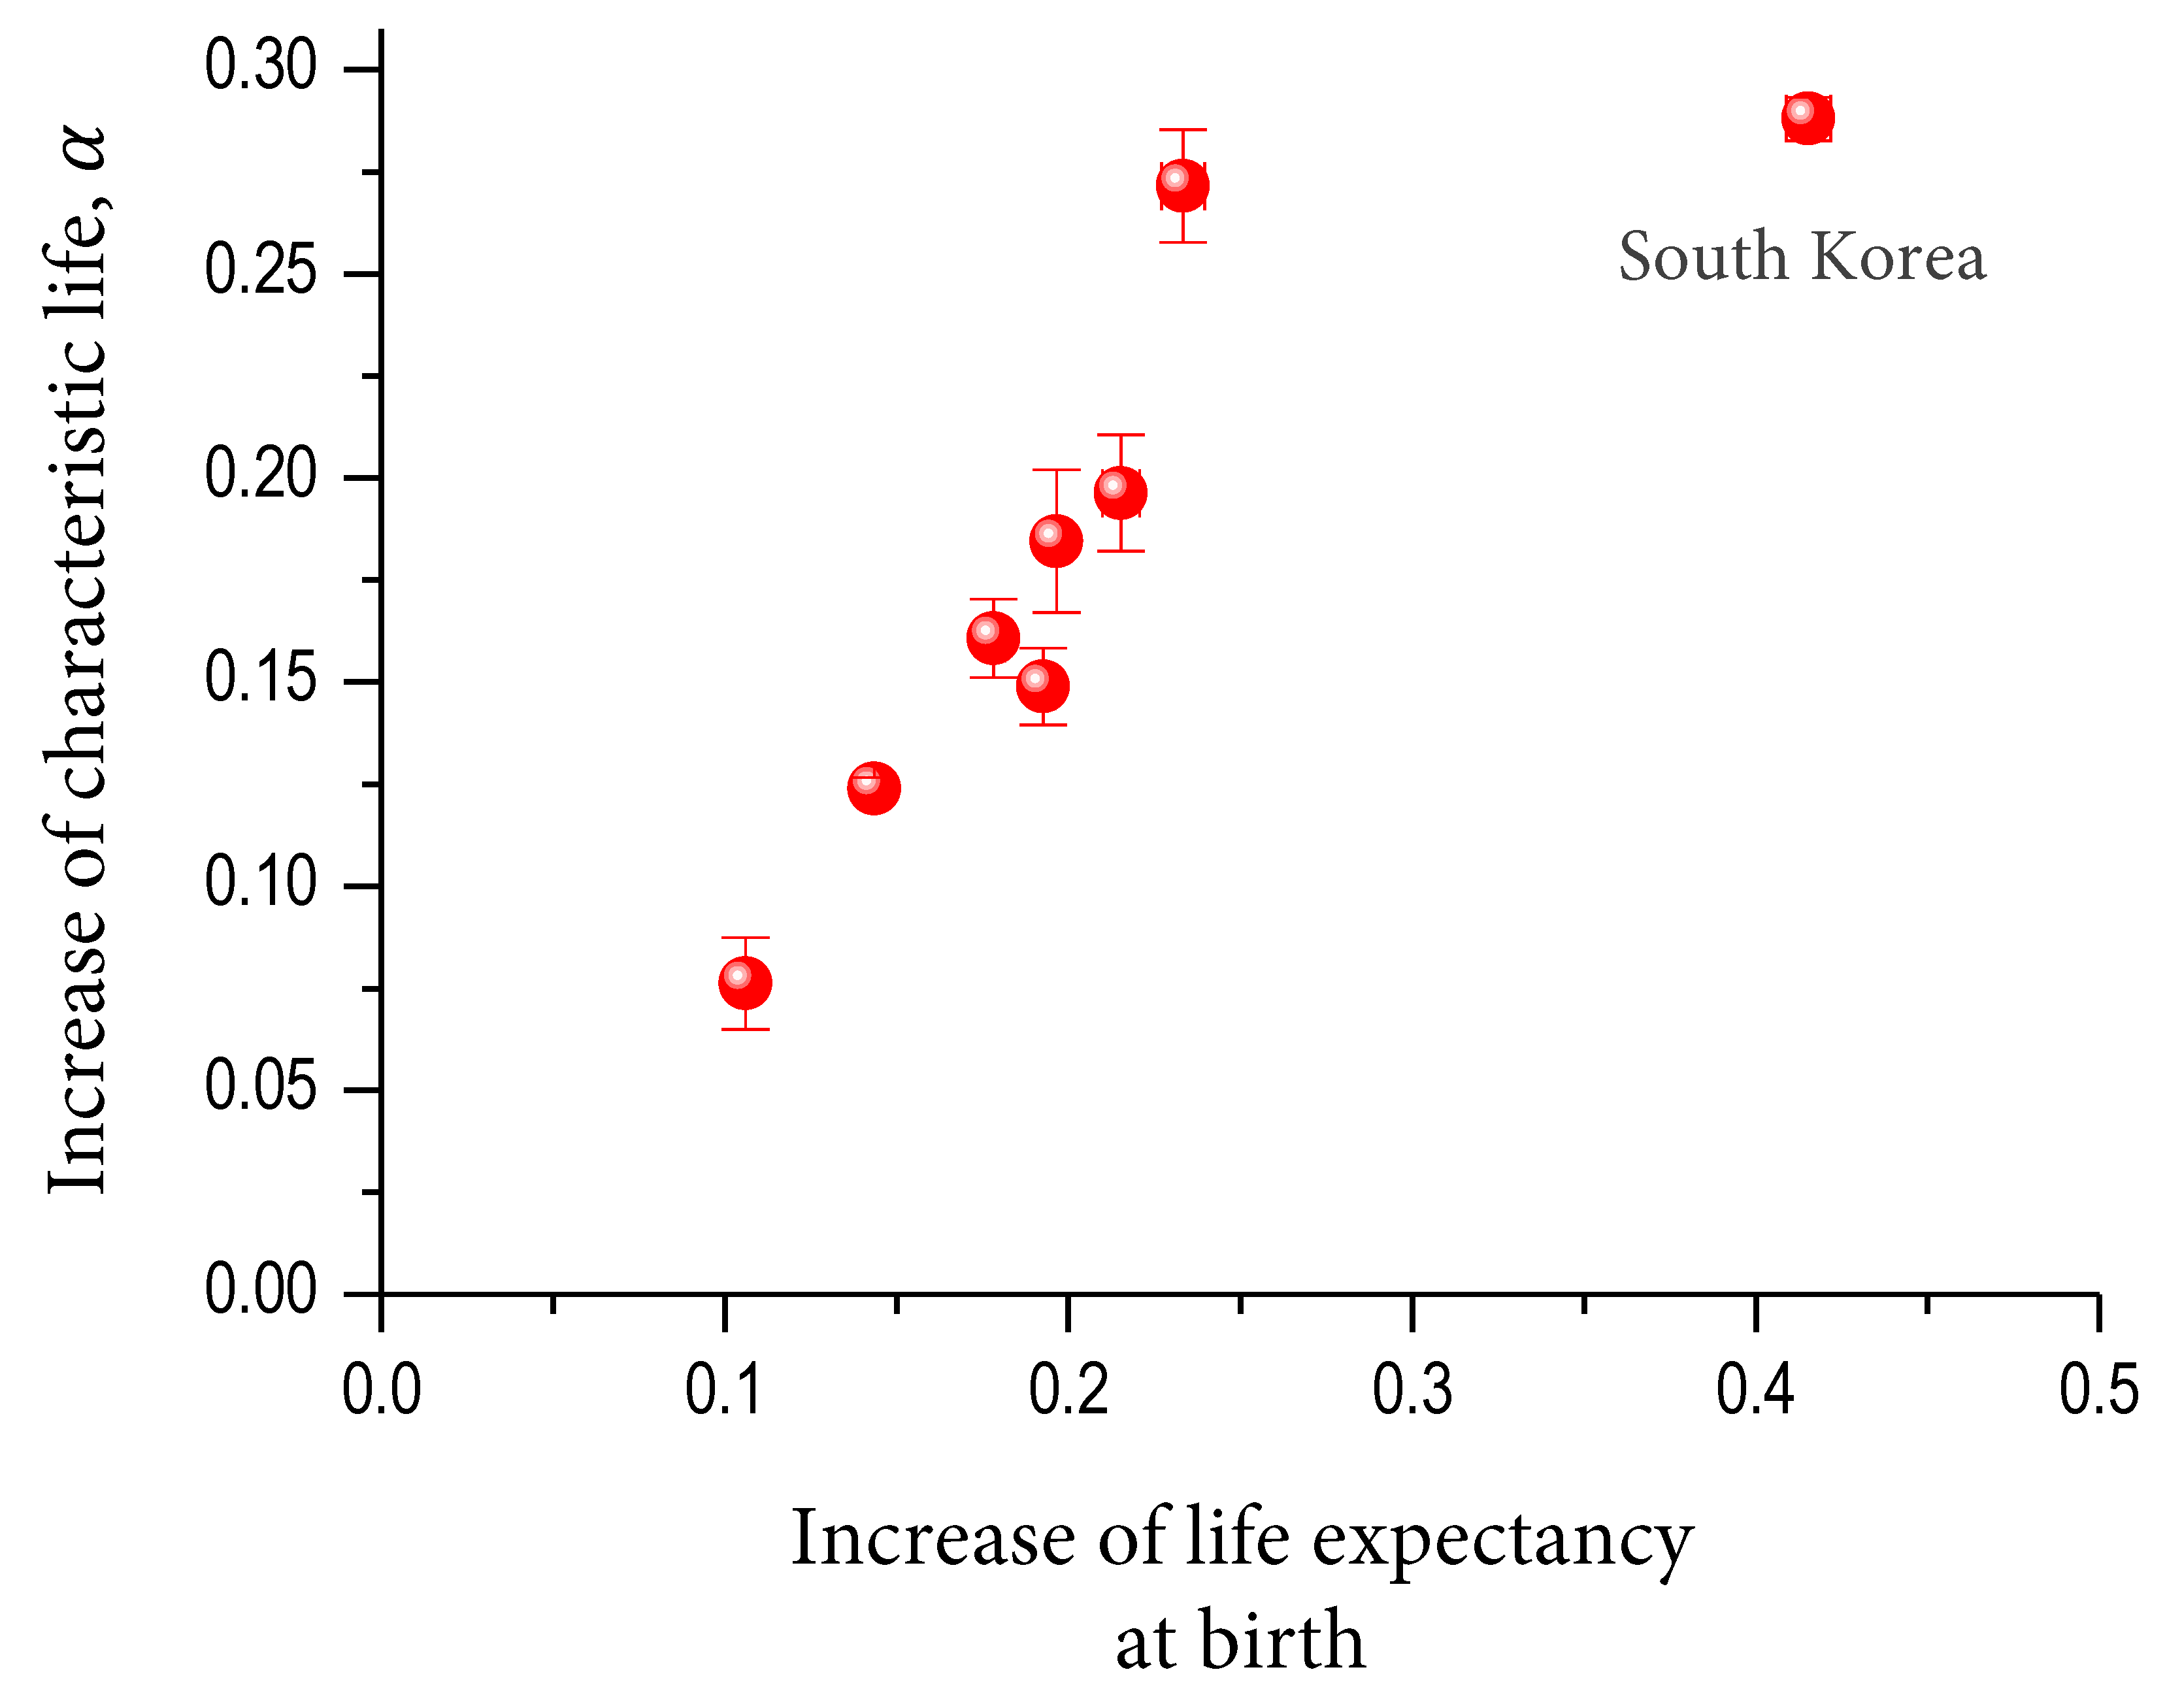
To demonstrate the association of the characteristic life ( α ), taken from Figure 2, with the life expectancy at birth ( ε ), the annual increase rates of α and ε are compared in Figure 3. The ε values for 1980–2015 were taken from the Organization for Economic Cooperation and Development [16] and the increase rates of the ε values were achieved by linear fits (the error bars taken from the standard errors: some of the error bars are smaller than the symbol sizes). The increase rates of the ε values per decade were evaluated as ∼4.15 years for South Korea, ∼2.33 years for Japan, ∼2.15 years for France, ∼1.96 years for Australia, ∼1.78 years for Switzerland, ∼1.93 years for UK, ∼1.43 years for Sweden, and ∼1.06 years for USA. The annual increase rate of the ε values (marked by m) is proportionally correlated with the annual increase rate of the α values (marked by n) as n 1.173 m 0.046 (adj. R 2 0.85243 ) except for South Korea. This analysis result suggests that the annual increase rate of the ε values for South Korea looks an extraordinary case among the representative high-income countries.
The highest increase rate in the female lifespan (in both α and ε ) for South Korea in Figure 3 is consistent with that the female life expectancy at birth in South Korea is the sixth ranked in 2010 and expected to be the first ranked in 2030 among the 35 industrialized countries [4]. So far, little attention has been given to South Korea in research on human health and longevity except for a few reports [4]. This analysis supports that South Korea has the highest increase rate in the female lifespan in the world in the past three decades.

3.3. Maximum Lifespan Analysis

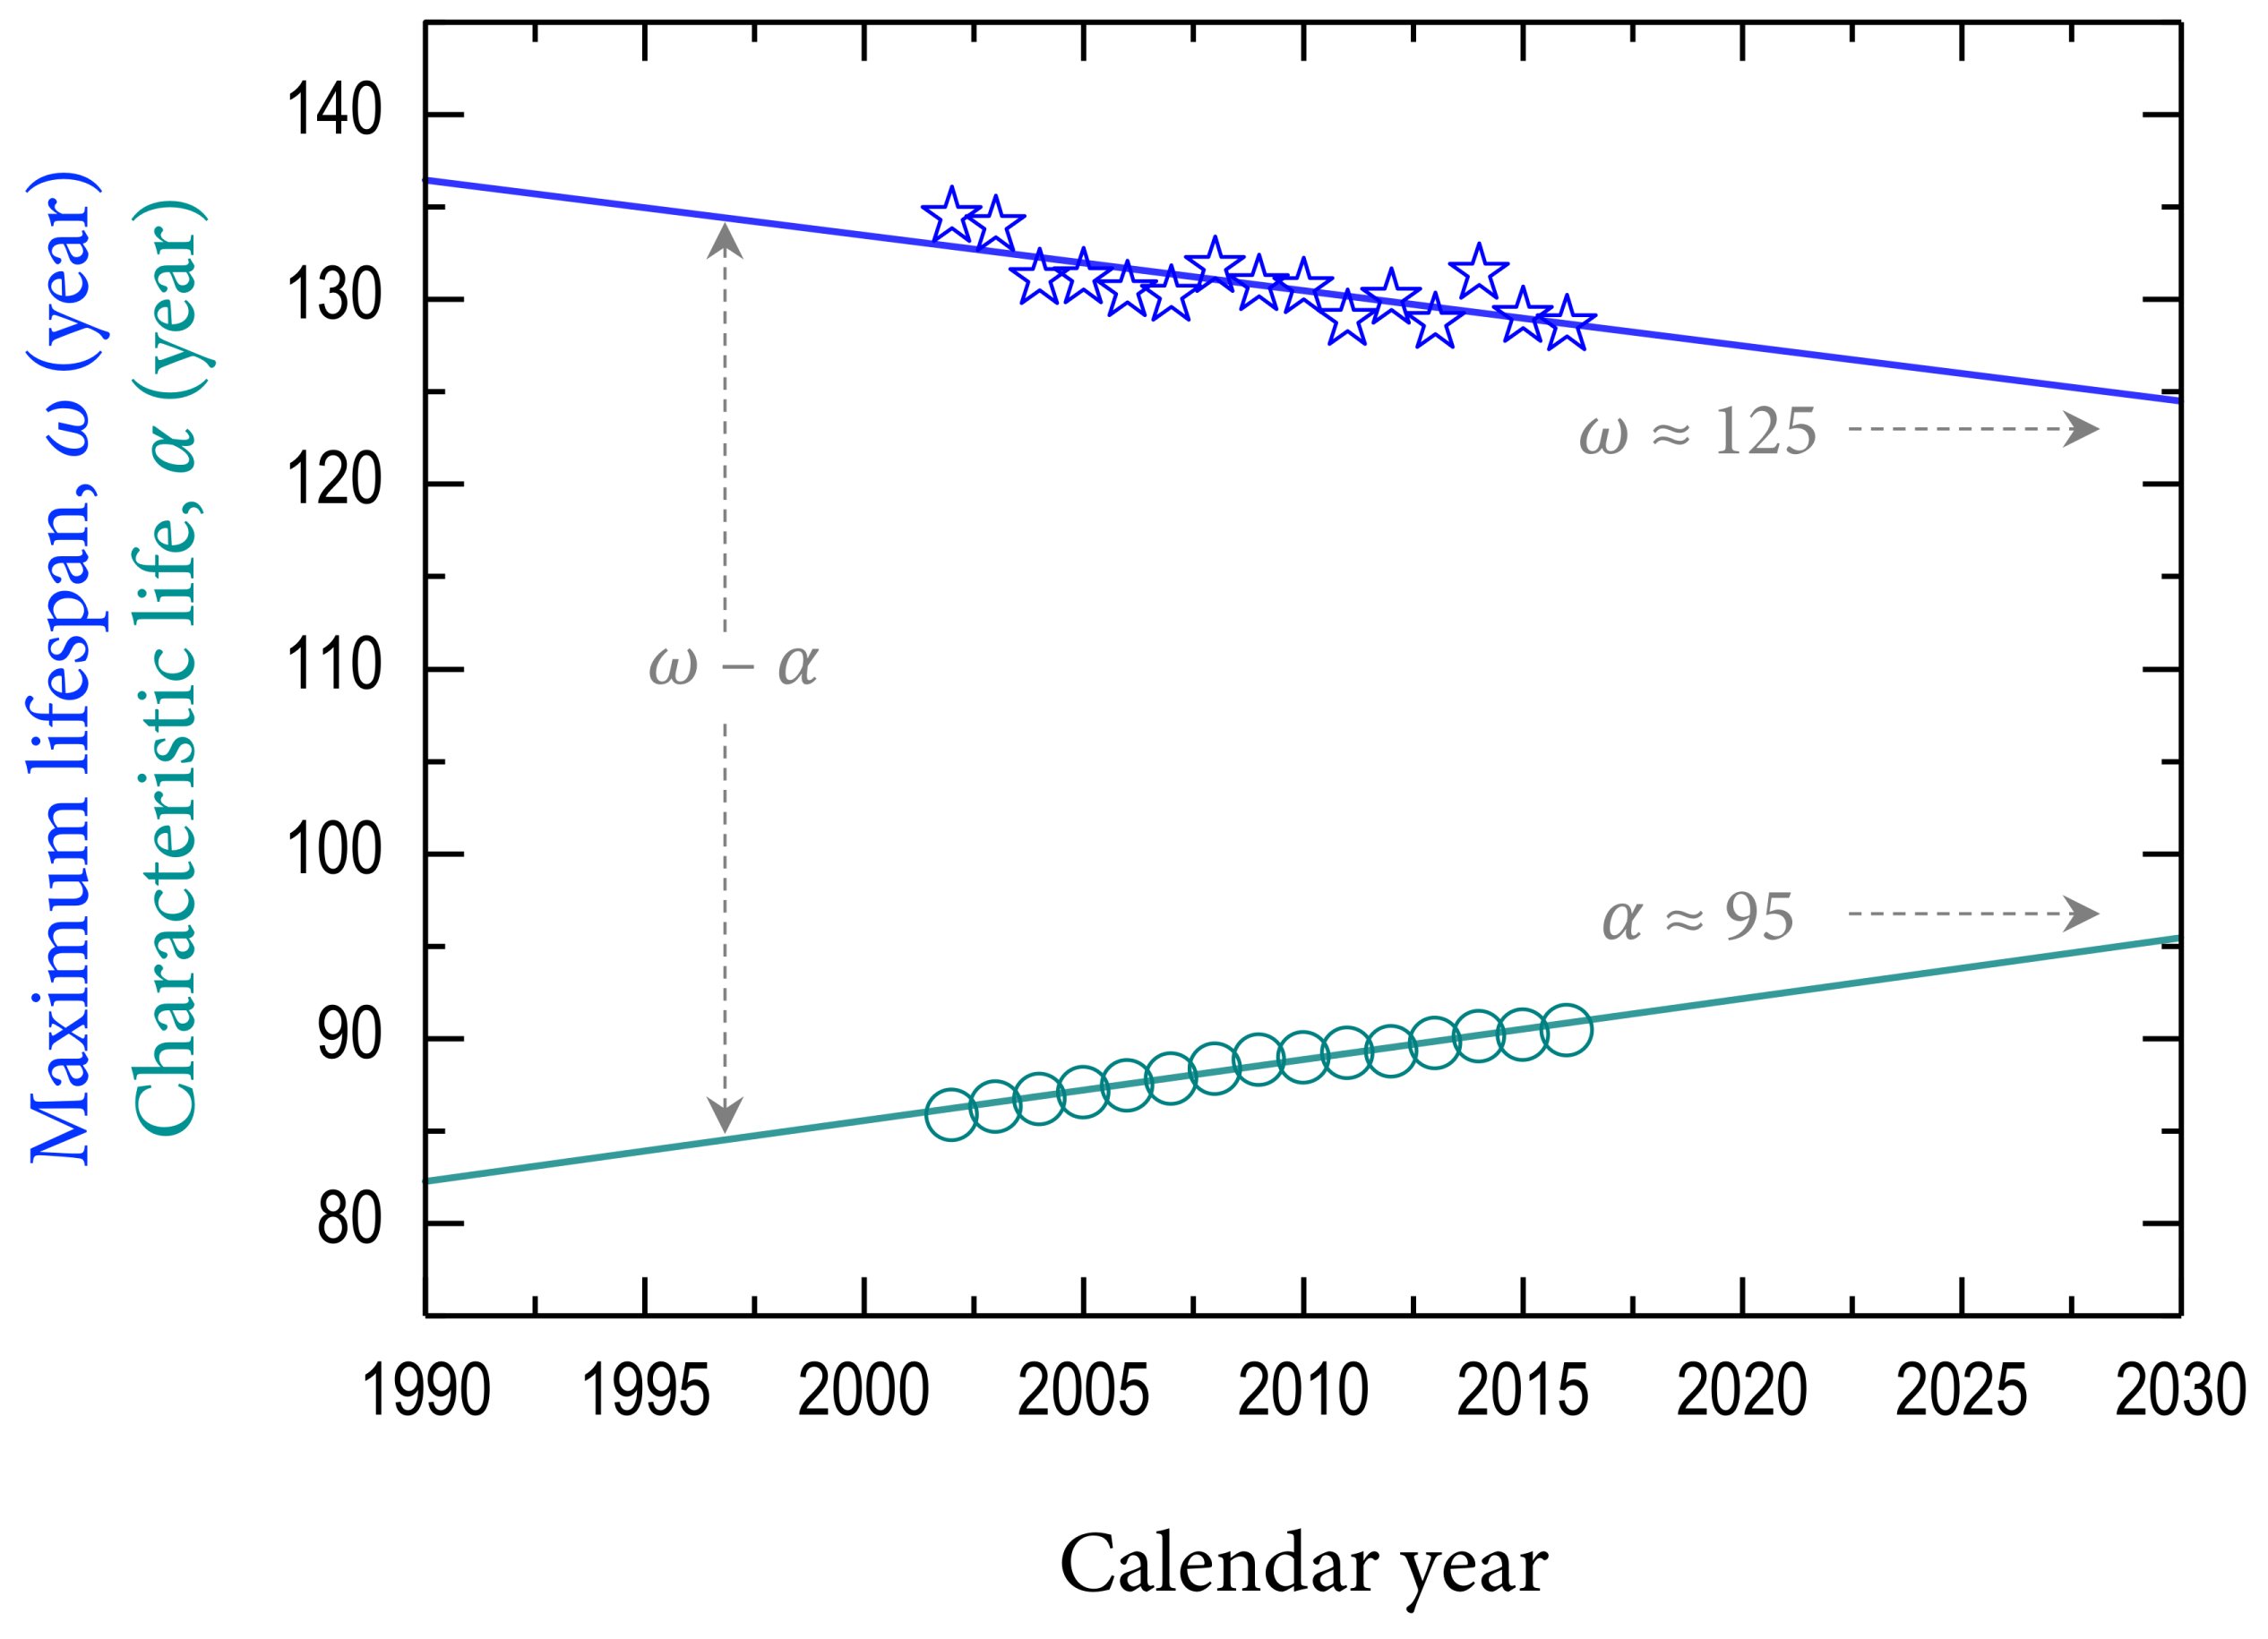
The term lifespan describes how long an individual can live and the (observed) maximum lifespan is the age reached by the longest-lived member of a species, while the life expectancy is a population-based estimate of expected duration of life for individuals at any age, based on a statistical life table [3]. Our methodology enables us to estimate the characteristic life ( α ) and the (mathematical) maximum lifespan ( ω ) as good measures of the human lifespan. The estimates of α and ω for Korean female (data from the Korean Statistical Information Service, http://kosis.kr/eng) are summarized in Figure 4. The estimates of ω are obtained by the mathematical constraint of d s ( x ) d x 0 [5,14]. The fitting of β ( x ) with the quadratic formula enables us to determine the estimates of ω at the specific age of γ ( x ) = x ln ( x / α ) d β ( x ) d x which corresponds to the intercept point β ( x ) = γ ( x ) [5]. This estimation is practically available if and only if the phase transition exists in old-age β ( x ) curves. Indeed, the estimates of ω are significant over the calendar year of 2002, as shown in Figure 4.
Looking at the recent trends in ω and α for the South Korean female in Figure 4, the estimates of ω gradually decrease at a constant rate of ∼2.99 years per decade and the estimates of α gradually increase at a constant rate of ∼3.30 years per decade. Assuming continuity in the increments, the estimates of ω and α are predicted to reach ∼125 years and ∼95 years respectively around 2030. The change rates for South Korean female are much higher than those of ∼1.6 years per decade in the ω values and ∼1.2 years per decade in the α values for Swedish female [5]. The estimates of ω and α eventually become closer together over time: this tendency for South Korean female is consistent with Swedish female [5]. This result indicates that the survival curves have been increasingly concentrated at old ages, demonstrating the population aging [17,18]. As α becomes closer to ω (Figure 4), the survival curves tend to become strongly concentrated at very old ages, corresponding to the retangularization of survival curves [13,19]. This result would be relevant to the compression of morbidity, which is responsible for the accumulation of the very old populations in the population configuration [5].

3.4. Discussion

Now, it is noteworthy that the stretched exponential survival analysis enables the quantitative and comparative study of female lifespan between South Korea and other countries, particularly quantifying the survival rate, the characteristic life, and the maximum lifespan. All evidence suggests that South Korea has a remarkable rapid increase in female lifespan during the three recent decades (from 1987 to 2016), as demonstrated from the characteristic life analysis in Figure 2 and Figure 3. An interesting question is why South Korea exhibits the highest increase rate in female lifespan. Economic development in South Korea is supposed to be beneficial to health care improvement, presumably provoking many potential social or cultural changes that are favorable for healthy daily habits and welfare. Obviously, health is the result of a combination of individual, social, and environmental factors [20]. In general, the recent increase in the numbers of older people in developed countries is a consequence of advances in hygiene and biomedicine as well as an artefact of human civilization [21]. In particular, South Korea has experienced rapid economic development and a substantial increase in life expectancy in an extremely short period, between 1970 and 2010, mainly due to the rapid processes of industrialization and urbanization [22,23].
Specifically, South Korea is expected to become the first country where the life expectancy at birth will exceed 90 years for women [24]. The recent industrialization and the subsequent improvements in living standards, nutrition, and health care have often been cited as major contributions to the remarkable improvements in health for South Korea [25]. The rapid increases in life expectancy in South Korea could be mostly achieved by reductions in infant mortality and in decreases related to infections and blood pressure [25]. More recent gains in South Korea have been largely due to postponement of death from chronic diseases [25]. These gains were mainly due to broad-based inclusive improvements in economic status and social capital (including education), which improved childhood and adolescent nutrition [26], expanded access to primary and secondary health care, and facilitated rapid scale-up of new medical technologies [25]. South Korea has also maintained lower body-mass index and blood pressure than other industrialized countries [27,28], and lower smoking in women. Additionally, South Korea might have lower health inequalities (for cancer and cardiovascular disease mortality, and for self-reported health status) than some of their western counterparts, especially for women [24,29,30]. The death rates from all causes in South Korea decreased significantly in both genders in the last three decades except for a period following the economic crisis in the late 1990s [31]. Looking at the trends in infectious disease mortality for South Korea, 1983−2015, infant mortality caused by infectious diseases has substantially decreased, while death rates from infectious disease for elderly populations with lower education levels and subgroups susceptible to respiratory infections and sepsis has not decreased overall [32]. The potential reasons for South Korea may be plausible but not for other countries.
Finally, the lifespan trends for Korean female may give a clue for the question regarding if there is a biological or social limit to human lifespan [3,33,34,35,36]. The heterogeneity in population and the dynamics of heterogeneous populations would become important in interpreting human lifespan [37,38]. The question about whether the upper limit to the maximum lifespan is fixed or flexible has been topics of continuous debate [34,39,40,41,42,43,44,45]. The decrease of the ω estimate in Figure 4 means that more people can reach the biological lifespan limit as expected to be 125 years [12]. The mathematical evaluation for female survival curves would be useful in achieving reliability and reproducibility in aging research [6,7,8] as well as in demonstrating the effectiveness of anti-aging therapies to slow the aging process [46]. Finding the appropriate mathematical model is quite important to accurately evaluate the human survival curves that exhibit a variety of heterogeneity and complexity. The practical implication of this study is that the potential reasons of South Korea may be useful to improve human lifespan, suggesting a further application of the stretched exponential survival analysis to identify personal, social, and environmental factors on human lifespan.

4. Conclusions

A steady increase in female lifespan is obvious in recent decades for most industrialized countries. This study shows the quantitative and comparative evidence for a remarkable rapid increase of female lifespan in South Korea during three recent decades, from 1987 to 2016, by applying the stretched exponential survival analysis. Based on the estimation of the increase rate of female lifespan for South Korea, the comparative analysis with Japan, France, Australia, Switzerland, UK, Sweden, and USA implies that South Korea would have the highest increase rate of female lifespan during recent three decades. This result suggests that Korean female datasets would be a representative population dataset for further study on what contributions would be essential to human longevity. Further application would be feasible for a better estimation of human aging statistics, which will be useful for future population prediction and policy making.

Funding

This research was supported by Basic Science Research Program through the National Research Foundation of Korea (NRF) funded by the Ministry of Education (Grant No. NRF-2016R1D1A1B01007133 and Grant No. 2019R1A6A1A03033215).

Conflicts of Interest

The author declares no conflict of interest. The funders had no role in the design of the study; in the collection, analyses, or interpretation of data; in the writing of the manuscript, or in the decision to publish the results.

References

  1. Wilmoth, J.R.; Deegan, L.J.; Lundström, H.; Horiuchi, S. Increase of maximum life-span in Sweden, 1861–1999. Science 2000, 289, 2366–2368. [Google Scholar] [CrossRef] [PubMed]
  2. Oeppen, J.; Vaupel, J.W. Broken limits to life expectancy. Science 2006, 296, 1029–1031. [Google Scholar] [CrossRef] [PubMed]
  3. Olshansky, S.J. Ageing: Measuring our narrow strip of life. Nature 2016, 538, 175–176. [Google Scholar] [CrossRef] [PubMed]
  4. Kontis, V.; Bennett, J.E.; Mathers, C.D.; Li, G.; Foreman, K.; Ezzati, M. Future life expectancy in 35 industrialised countries: Projections with a Bayesian model ensemble. Lancet 2017, 389, 1323–1335. [Google Scholar] [CrossRef]
  5. Weon, B.M. A solution to debates over the behavior of mortality at old ages. Biogerontology 2015, 16, 375–381. [Google Scholar] [CrossRef] [PubMed]
  6. Petrascheck, M.; Miller, D.L. Computational analysis of lifespan experiment reproducibility. Front. Genet. 2017, 8, 92. [Google Scholar] [CrossRef] [PubMed]
  7. Ruby, J.G.; Smith, M.; Buffenstein, R. Naked mole rat mortality rates defy Gompertzian laws by not increasing with age. eLife 2018, 7, e31157. [Google Scholar] [CrossRef] [PubMed]
  8. Beltrán-Sánchez, H.; Finch, C. Life expectancy: Age is just a number. eLife 2018, 7, e34427. [Google Scholar] [CrossRef] [PubMed]
  9. Weibull, W.A. A statistical distribution function of wide applicability. J. Appl. Mech. 1951, 18, 293–297. [Google Scholar]
  10. Kohlrausch, R. Theorie des elektrischen rückstandes in der leidener flasche. Pogg. Ann. Phys. Chem. 1854, 91, 179–214. [Google Scholar] [CrossRef]
  11. Williams, G.; Watts, D.C. Non-symmetrical dielectric relaxation behavior arising from a simple empirical decay function. Trans. Faraday Soc. 1970, 66, 80–85. [Google Scholar] [CrossRef]
  12. Weon, B.M.; Je, J.H. Theoretical estimation of maximum human lifespan. Biogerontology 2009, 10, 65–71. [Google Scholar] [CrossRef] [PubMed]
  13. Weon, B.M.; Je, J.H. Plasticity and rectangularity in survival curves. Sci. Rep. 2011, 1, 104. [Google Scholar] [CrossRef] [PubMed] [Green Version]
  14. Weon, B.M.; Je, J.H. Trends in scale and shape of survival curves. Sci. Rep. 2012, 2, 504. [Google Scholar] [CrossRef] [PubMed] [Green Version]
  15. Wrycza, T.; Baudisch, A. The pace of aging: Intrinsic time scales in demography. Demogr. Res. 2014, 30, 1571–1590. [Google Scholar] [CrossRef] [Green Version]
  16. OECD. Health at a Glance 2017: OECD Indicators; OECD Publishing: Paris, France, 2017. [Google Scholar] [CrossRef]
  17. Anderson, G.F.; Hussey, P.S. Population aging: A comparison among industrialized countries. Health Aff. 2000, 19, 191–203. [Google Scholar] [CrossRef] [PubMed]
  18. Robine, J.M.; Michel, J.P. Looking forward to a general theory on population aging. J. Gerontol. A Biol. Sci. Med. Sci. 2004, 59, 590–597. [Google Scholar] [CrossRef]
  19. Fries, J.F. Aging, natural death, and the compression of morbidity. N. Engl. J. Med. 1980, 303, 130–135. [Google Scholar] [CrossRef]
  20. Shkrabtak, N.; Frolova, N.; Kiseleva, T.; Sergeeva, I.; Pomozova, V. Impact of environmental conditions on the health of the Far Eastern region population. Appl. Sci. 2019, 9, 1354. [Google Scholar] [CrossRef]
  21. Hayflick, L. The future of ageing. Nature 2000, 408, 267–269. [Google Scholar] [CrossRef]
  22. Kim, I.K.; Liang, J.; Rhee, K.O.; Kim, C.S. Population aging in Korea: Changes since the 1960s. J. Cross Cult. Gerontol. 1996, 11, 369–388. [Google Scholar] [CrossRef] [PubMed]
  23. Bahk, J.; Lynch, J.W.; Khang, Y.H. Forty years of economic growth and plummeting mortality: The mortality experience of the poorly educated in South Korea. J. Epidemiol. Community Health 2017, 71, 282–288. [Google Scholar] [CrossRef] [PubMed]
  24. Khang, Y.H.; Bahk, J.; Yi, N.; Yun, S.C. Age- and cause-specific contributions to income difference in life expectancy at birth: Findings from nationally representative data on one million South Koreans. Eur. J. Public Health 2016, 26, 242–248. [Google Scholar] [CrossRef] [PubMed]
  25. Yang, S.; Khang, Y.H.; Harper, S.; Davey Smith, G.; Leon, D.A.; Lynch, J. Understanding the rapid increase in life expectancy in South Korea. Am. J. Public Health 2010, 100, 896–903. [Google Scholar] [CrossRef] [PubMed]
  26. NCD-RisC. A century of trends in adult human height. eLife 2016, 5, e13410. [Google Scholar] [CrossRef] [PubMed]
  27. NCD-RisC. Trends in adult body-mass index in 200 countries from 1975 to 2014: A pooled analysis of 1698 population-based measurement studies with 19.2 million participants. Lancet 2016, 387, 1377–1396. [Google Scholar] [CrossRef]
  28. NCD-RisC. Worldwide trends in blood pressure from 1975 to 2015: A pooled analysis of 1479 population-based measurement studies with 19.1 million participants. Lancet 2017, 389, 37–55. [Google Scholar] [CrossRef]
  29. Di Cesare, M.; Khang, Y.H.; Asaria, P.; Blakely, T.; Cowan, M.J.; Farzadfar, F.; Guerrero, R.; Ikeda, N.; Kyobutungi, C.; Msyamboza, K.P.; et al. Inequalities in non-communicable diseases and effective responses. Lancet 2013, 381, 585–597. [Google Scholar] [CrossRef] [Green Version]
  30. OECD. Health at a Glance 2015: OECD Indicators; OECD Publishing: Paris, France, 2015. [Google Scholar] [CrossRef]
  31. Lim, D.; Ha, M.; Song, I. Trends in the leading causes of death in Korea, 1983–2012. J. Korean Med. Sci. 2014, 29, 1597–1603. [Google Scholar] [CrossRef]
  32. Choe, Y.J.; Choe, S.A.; Cho, S.I. Trends in infectious disease mortality, South Korea, 1983–2015. Emerg. Infect. Dis. 2018, 24, 320–327. [Google Scholar] [CrossRef]
  33. Carnes, B.A.; Witten, T.M. How long must humans live? J. Gerontol. A Biol. Sci. Med. Sci. 2014, 69, 965–970. [Google Scholar] [CrossRef]
  34. Dong, X.; Milholland, B.; Vijg, J. Evidence for a limit to human lifespan. Nature 2016, 538, 257–259. [Google Scholar] [CrossRef] [PubMed]
  35. Newman, S.; Easteal, S. The dynamic upper limit of human lifespan [version 1; referees: 1 approved, 1 approved with reservations]. F1000Research 2017, 6, 569. [Google Scholar] [CrossRef] [PubMed]
  36. Marck, A.; Antero, J.; Berthelot, G.; Saulière, G.; Jancovici, J.M.; Masson-Delmotte, V.; Boeuf, G.; Spedding, M.; Le Bourg, E.; Toussaint, J.F. Are we reaching the limits of homo sapiens? Front. Physiol. 2017, 8, 812. [Google Scholar] [CrossRef] [PubMed]
  37. Carnes, B.A.; Olshansky, S.J. Heterogeneity and its biodemographic implications for longevity and mortality. Exp. Gerontol. 2001, 36, 419–430. [Google Scholar] [CrossRef]
  38. Vaupel, J.W. Biodemography of human ageing. Nature 2010, 464, 536–542. [Google Scholar] [CrossRef] [Green Version]
  39. Ben-Haim, M.S.; Kanfi, Y.; Mitchel, S.J.; Maoz, N.; Vaughan, K.; Amariglio, N.; Lerrer, B.; de Cabo, R.; Rechavi, G.; Cohen, H.Y. Breaking the ceiling of human maximal lifespan. J. Gerontol. A Biol. Sci. Med. Sci. 2018, 73, 1465–1471. [Google Scholar] [CrossRef]
  40. Brown, N.J.L.; Albers, C.J.; Ritchie, S.J. Contesting the evidence for limited human lifespan. Nature 2017, 546, E6–E7. [Google Scholar] [CrossRef] [Green Version]
  41. De Beer, J.; Bardoutsos, A.; Janssen, F. Maximum human lifespan may increase to 125 years. Nature 2017, 546, E16–E17. [Google Scholar] [CrossRef] [Green Version]
  42. Hughes, B.G.; Hekimi, S. Many possible maximum lifespan trajectories. Nature 2017, 546, E8–E9. [Google Scholar] [CrossRef]
  43. Lenart, A.; Vaupel, J.W. Questionable evidence for a limit to human lifespan. Nature 2017, 546, E13–E14. [Google Scholar] [CrossRef] [PubMed]
  44. Rozing, M.P.; Kirkwood, T.B.L.; Westendorp, R.G.J. Is there evidence for a limit to human lifespan? Nature 2017, 546, E11–E12. [Google Scholar] [CrossRef] [PubMed]
  45. Rootzen, H.; Zholud, D. Human life is unlimited–but short. Extremes 2017, 20, 713–728. [Google Scholar] [CrossRef]
  46. De Magalhães, J.P.; Stevens, M.; Thornton, D. The business of anti-aging science. Trends Biotechnol. 2017, 35, 1062–1073. [Google Scholar] [CrossRef] [PubMed]
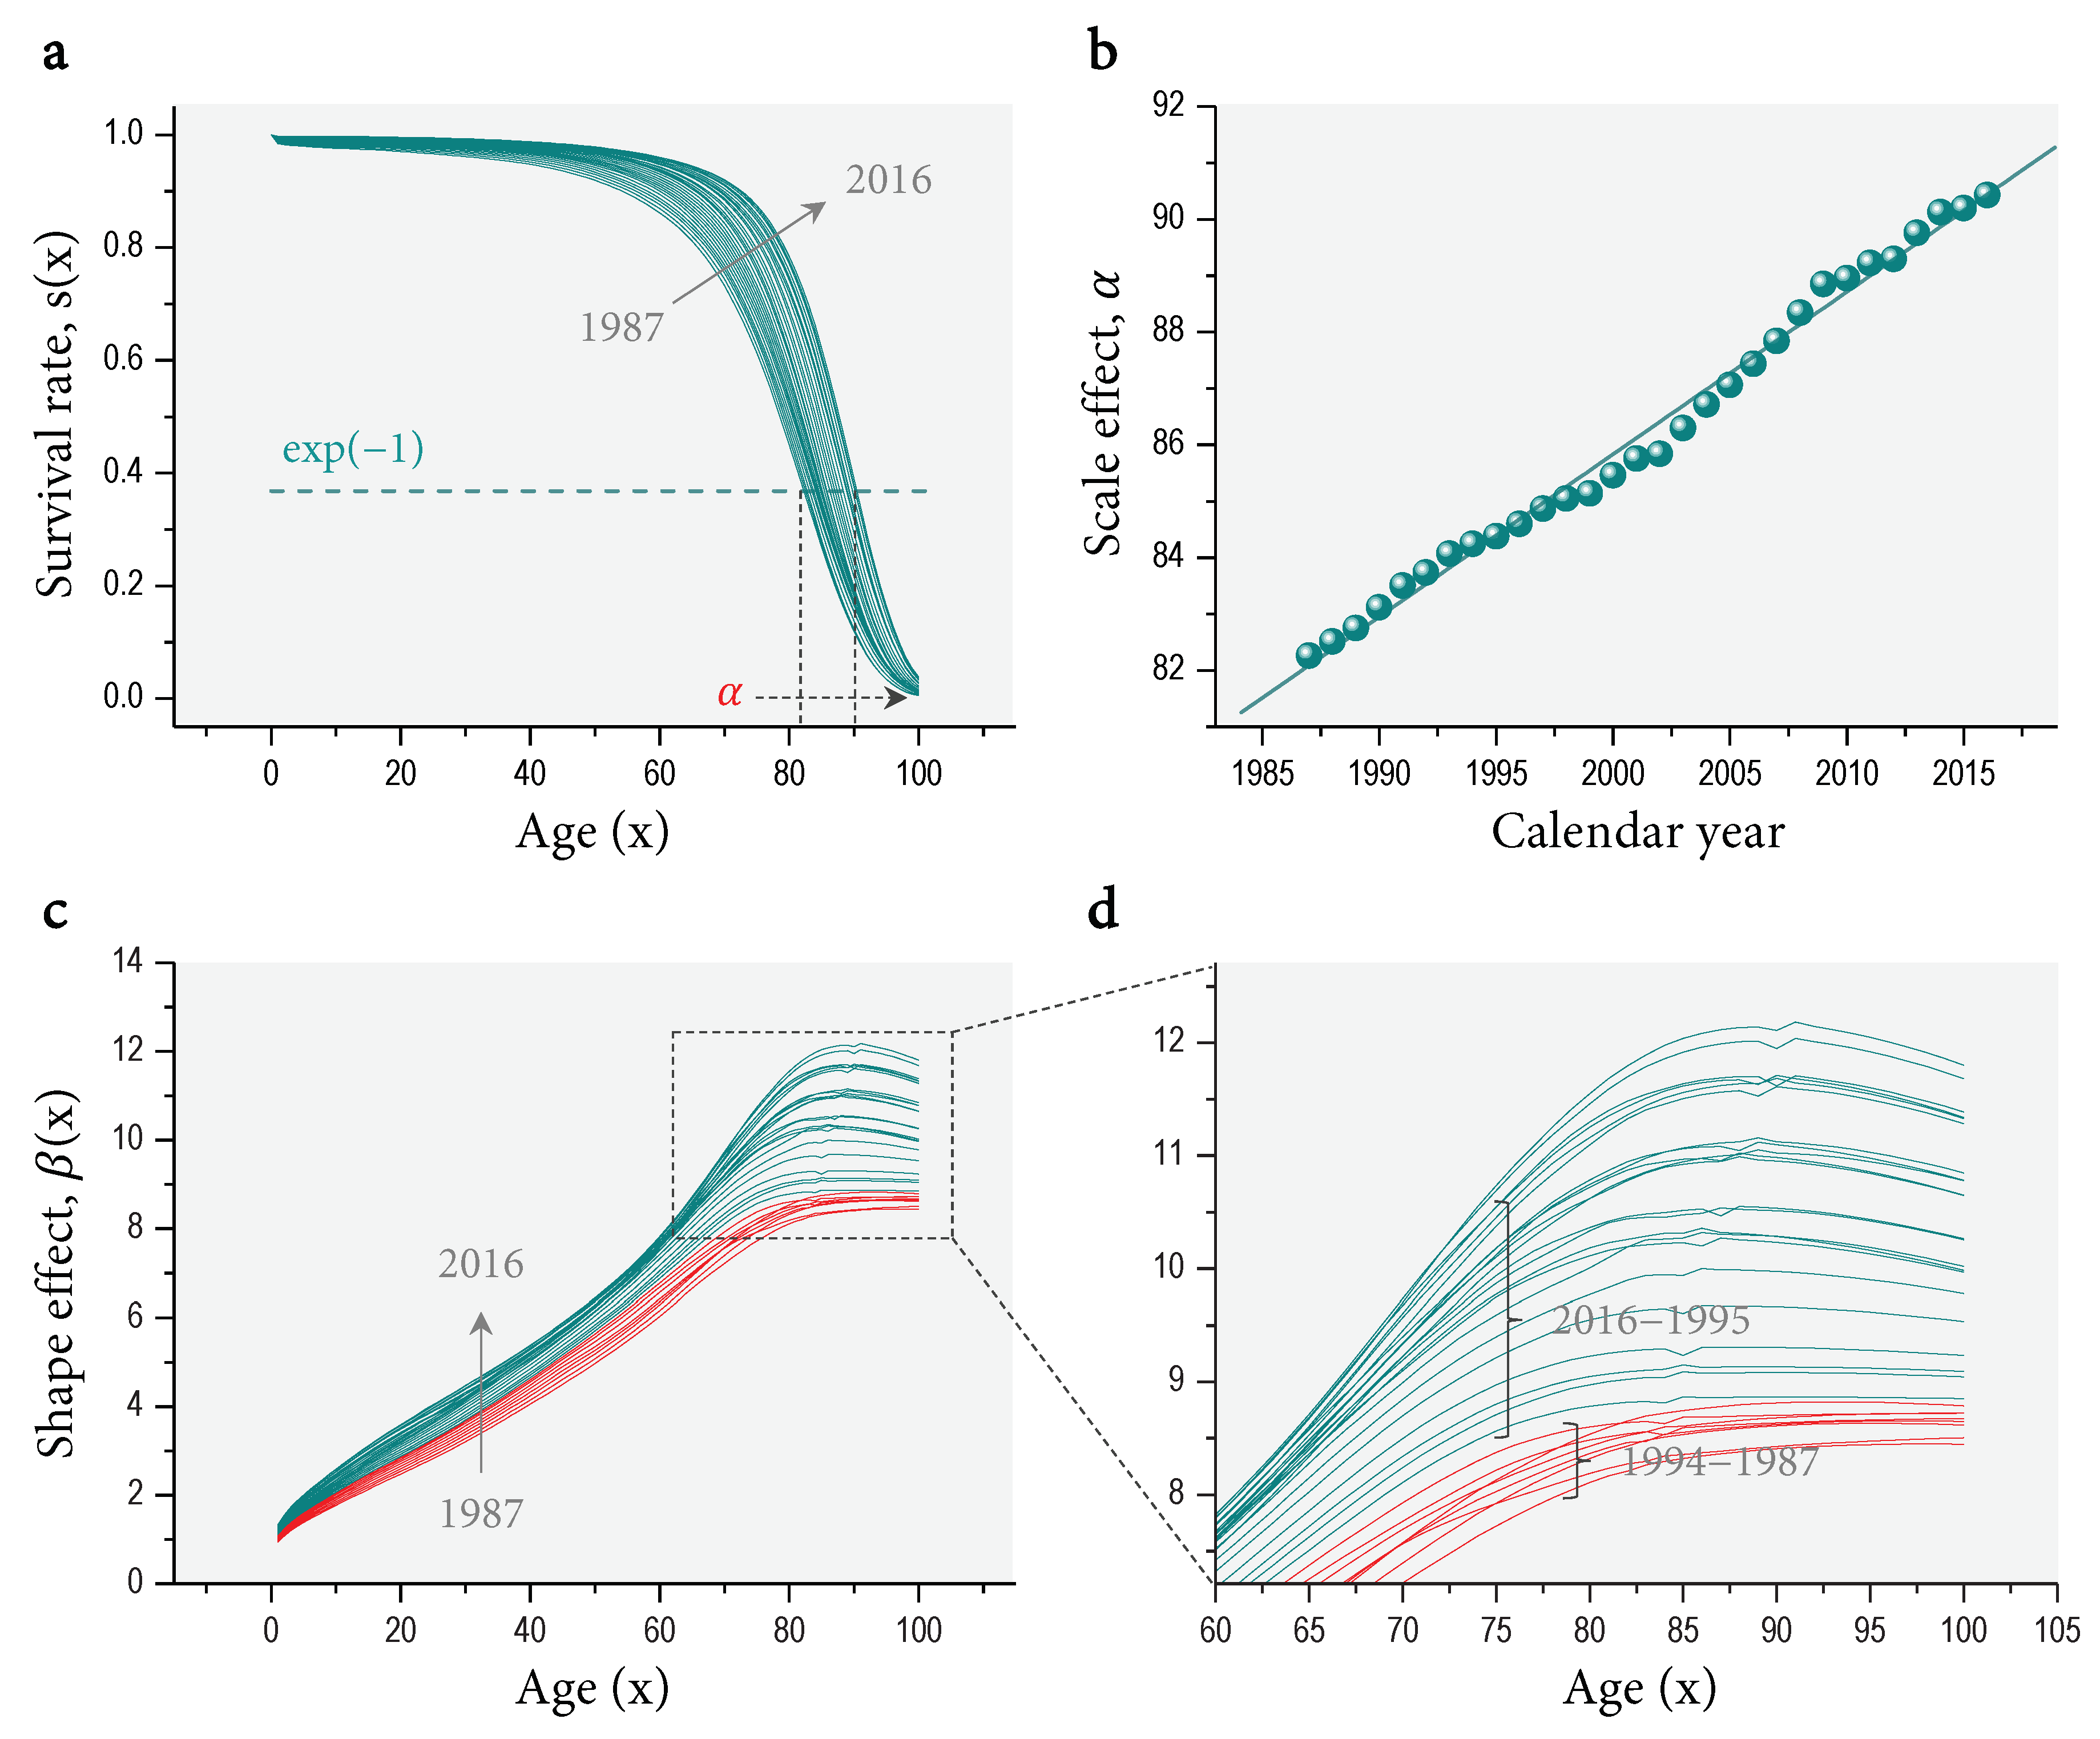
Figure 1. Survival analysis. (a) The survival curves for Korean female in recent decades, 1987–2016, were obtained at the complete life tables taken from the Korean Statistical Information Service (http://kosis.kr/eng). (b) The characteristic life of the given survival curve. (c) The age-dependent stretched exponent. (d) The old-age patterns of the stretched exponent at ages over 60 years could be fitted with the quadratic formula of age. The phase transition in the stretched exponent with age appears for 1995–2016 but not for 1987–1994.
Applsci 09 04230 g001
Figure 2. Comparison in the increase rate of the characteristic life per decade among representative industrialized countries. The data were taken for South Korea (1987–2016) from the Korean Statistical Information Service (http://kosis.kr/eng) and for other countries (1980–2010) from the Human Mortality Database (http://www.mortality.org).
Applsci 09 04230 g002
Figure 3. Association of the characteristic life, taken from Figure 2, with the life expectancy at birth per decade in representative industrialized countries, taken from the Organization for Economic Cooperation and Development [16].
Applsci 09 04230 g003
Figure 4. Estimation of the maximum lifespan and the characteristic life for Korean female (data from the Korean Statistical Information Service, http://kosis.kr/eng). The maximum lifespan gradually decreases at a constant rate of ∼2.99 years per decade and the characteristic life gradually increases at a constant rate of ∼3.30 years per decade.
Applsci 09 04230 g004