Article

The Ultrafast Laser Ablation of Li(Ni0.6Mn0.2Co0.2)O2 Electrodes with High Mass Loading

by
Penghui Zhu
1,*,
Hans Jürgen Seifert
1 and
Wilhelm Pfleging
1,2
1
Institute for Applied Materials—Applied Materials Physics (IAM-AWP), Karlsruhe Institute of Technology (KIT), 76344 Eggenstein-Leopoldshafen, Germany
2
Karlsruhe Nano Micro Facility, Karlsruhe Institute of Technology (KIT), 76344 Eggenstein-Leopoldshafen, Germany
*
Author to whom correspondence should be addressed.
Appl. Sci. 2019, 9(19), 4067; https://doi.org/10.3390/app9194067
Submission received: 30 August 2019 / Revised: 23 September 2019 / Accepted: 27 September 2019 / Published: 29 September 2019

Abstract

:
Lithium-ion batteries have become the most promising energy storage devices in recent years. However, the simultaneous increase of energy density and power density is still a huge challenge. Ultrafast laser structuring of electrodes is feasible to increase power density of lithium-ion batteries by improving the lithium-ion diffusion kinetics. The influences of laser processing pattern and film thickness on the rate capability and energy density were investigated using Li(Ni0.6Mn0.2Co0.2)O2 (NMC 622) as cathode material. NMC 622 electrodes with thicknesses from 91 µm to 250 µm were prepared, while line patterns with pitch distances varying from 200 µm to 600 µm were applied. The NMC 622 cathodes were assembled opposing lithium using coin cell design. Cells with structured, 91 µm thick film cathodes showed lesser capacity losses with C-rates 3C compared to cells with unstructured cathode. Cells with 250 µm thick film cathode showed higher discharge capacity with low C-rates of up to C/5, and the structured cathodes showed higher discharge capacity, with C-rates of up to 1C. However, the discharge capacity deteriorated with higher C-rate. An appropriate choice of laser generated patterns and electrode thickness depends on the requested battery application scenario; i.e., charge/discharge rate and specific/volumetric energy density.

1. Introduction

Ever since the market’s introduction to them by Sony corporation in the early 1990s, rechargeable lithium-ion batteries (LIBs) have been a triumph in many applications and have changed the world tremendously, especially with the rapid development of 3C-markets (computer, communication, and consumer), electric power tools, and electric vehicles. Meanwhile, much effort is devoted to meet the demand for battery development and innovation, such demands include higher power density, higher energy density, rapid chargeability, and a longer cycle life, while lowering the costs simultaneously. Nowadays, more and more automobile industries are seeking to find an alternative and sustainable solution for mobility. Many have been committed to developing hybrid electric vehicles (HEVs) and battery electric vehicles (BEVs). However, the major barrier for BEV compared to conventional vehicles with internal combustion engines is the range of a single charge, which is much lower than a fully fueled conventional automobile (generally 480 km to 640 km). For example, popular electric vehicles can travel up to 400 km after fully charged [1]. Besides, due to the limited space in BEV, it is necessary to achieve higher volumetric energy density. At the same time, the costs per kilowatt-hour are decisive factors to ensure a successful BEV integration into the automobile market.
Over the last decades, LIBs have become more and more popular and are considered to be an important potential power source for electric vehicles due to their high energy density and low weight compared to conventional batteries [2]. One of the commercially successful cathode materials for LIBs is Li(Ni1/3Mn1/3Co1/3)O2 (nickel-manganese-cobalt oxide, NMC 111), with a gravimetric capacity of 160 mAh/g [3]. However, much attention is focused on increasing the capacity by increasing nickel content. Most recently, Li(Ni0.6Mn0.2Co0.2)O2 (NMC 622), with a gravimetric capacity of 187 mAh/g [3], has become the mainstream material for cathodes, due to its higher capacity and energy density compared to NMC 111. Besides, cobalt is a very expensive component in comparison to nickel and manganese. Hence, the cost for cathode material is reduced by lowering the cobalt content. In addition, the overall cost of the cell will be decreased using NMC 622 instead of NMC 111, since about 1/4 of the cell cost comes from the cathode side [4].
The most practical approach to increase the energy density of a battery is to manufacture a thick electrode, which will increase the ratio of active material to inactive materials, such as the current collector and separator foils. Therefore, less energy consumption is required for processing steps, such as electrode sheet cutting and stacking. However, according to Ragone chart, specific energy is inversely correlated to specific power [5], which means the power of battery declines with increasing energy. That indicates that C-rate has a great impact on Li-ion diffusion inside electrode during charging and discharging. The conventional approach to enhance energy density by simply increasing cathode thickness leads to a deterioration of rate capability and long-term cycling performance, especially at high discharge rates, mainly due to the high internal resistance, poor mechanical integrity of thick electrode, and diffusion overpotential [
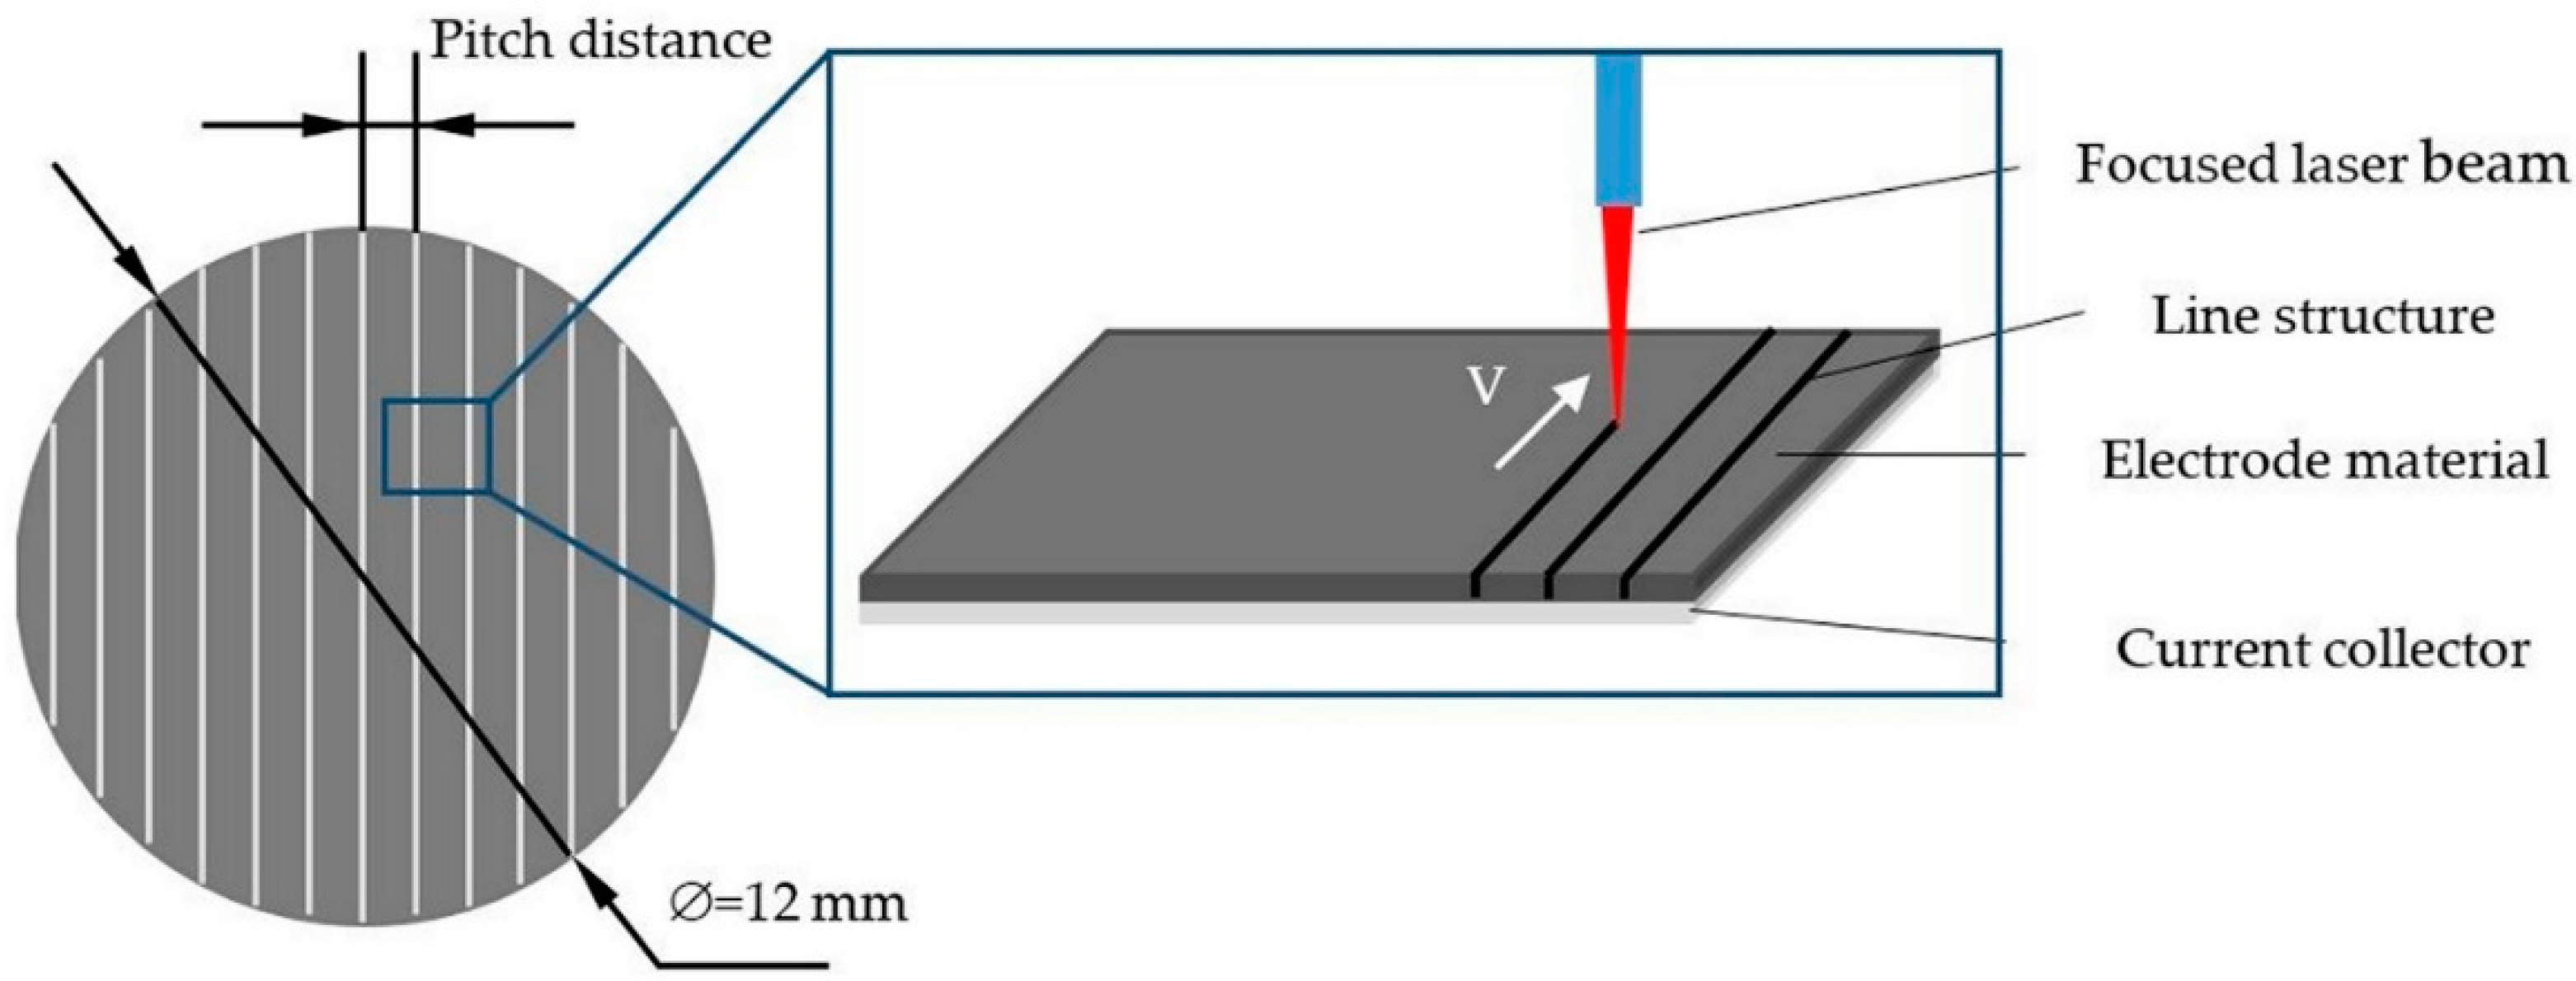
6]. In order to compensate for the capacity loss of thick cathodes at higher C-rates, three-dimensional (3D) architectures were generated on electrodes using ultrafast laser processing technique. It was proven that the generated 3D architectures improved battery performance parameters, such as capacity retention and cycle stability, especially for high C-rates [7,8,9]. Therefore, it is of great significance to investigate the effect of electrode thickness and the laser processing pattern on battery performance, and to determine the possibility of realizing high energy and high power operations through combining ultrafast laser structuring approach with thick film electrode concept.

2. Materials and Methods

2.1. Electrode Preparation

The commercially available battery cathode material NMC 622 (Targray, Canada) with an average particle size of 10 µm, was used as active material, while polyvinylidene fluoride (PVDF, MTI Corporation, USA) and TIMCAL Super C65 (MTI Corporation, USA) were chosen as binder and conductive agent, respectively. PVDF powder was dissolved in N-methyl-2-pyrrolidone solvent (NMP, BASF, Germany) in advance, with a weight proportion of 1:10 in a vacuum mixer (MSK-SFM-7, MTI Corporation, USA) for 30 min.
The cathode slurry was pre-mixed with 5 wt.% PVDF binder (dissolved in NMP), 5 wt.% Super C65 carbon black, and 90 wt.% NMC 622 for 1 h using SpeedMixer DAC 150 SP (Hauschild and Co. KG, Germany). Extra NMP solution was then added into the mixture, in order to control the viscosity of the slurry. The subsequent mixing procedure was carried out at 3000–3500 rpm for 1h. Finally, the slurry was tape casted onto a 20 µm thick aluminum foil with a doctor blade (ZUA 2000.150, Zehntner GmbH, Switzerland) on a film coater (MSK-AFA-III, MTI Corporation, USA). The thickness of the coated cathode film was controlled by varying the gap of the doctor blade. The cathode sheet was dried afterwards for 4 h with the built-in heater at around 120 °C and subsequently cooled down to room temperature for 16 h. Afterwards, the cathode film was calendered using a hot rolling calender (Precision 4” Hot Rolling Press/Calender, MTI Corporation, USA) at around 75 °C with a constant calendaring speed of 9 mm/s. The purpose of calendering procedure is to achieve an overall homogenous film thickness and to improve the particle-to-particle contact inside the electrode. For cathodes with different thicknesses, the porosity was adjusted to values of about 35% after calendaring.
An ultrafast fiber laser (Tangerine, Amplitude Systèmes, France), built in the flexible laser micromachining system PS450-TO (Optec s.a., Belgium), was used to realize a type of cold laser ablation. The ultrafast fiber laser system has a maximal average power of 35 W and a maximum pulse energy of 175 µJ at a wavelength of 1030 nm (M2 < 1.2). By using a pulse picker, a modulator, and compressor, it was possible to adjust the laser repetition rate from single pulse up to 2 MHz. The pulse duration ranged from 380 fs up to 10 ps. For the laser ablation process, a line pattern was chosen with pitch distances ranging from 200 µm to 600 µm (Figure 1). The repetition rate was kept constant at 200 kHz. Laser scanning velocity was set to 500 mm/s, and laser power was 3 W. The laser pulse duration was 380 fs. An external exhaust was placed next to the sample during the structuring and cutting processes in order to remove the ablated materials. The laser process was performed in ambient air. For electrodes with different thicknesses, the repetition of the laser structuring process was adjusted to achieve line structure from the electrode surface down to the current collector without damaging the current collector. Cross-section analyses of the electrode using different repetitions were made in order to find appropriate parameters. Owing to the subsequent scale requirement of cell assembling, cathodes were cut to 12 mm in diameter for coin cell design using the ultrafast laser system (wavelength: 1030 nm, frequency: 200 kHz, laser scanning velocity: 200 mm/s, repetition: 10 times), and were subsequently kept in a vacuum oven (VT 6025, Thermo SCIENTIFIC, Germany) at 130 °C for 16 h.

2.2. Cell Preparation and Characterization

NMC 622 cathodes were assembled using coin cell with lithium foil as the counter electrode in an argon-filled glove box (LABmaster sp, M. Braun Inertgas-Systeme GmbH, with H2O < 0.1 ppm and O2 < 0.1 ppm). Before cell assembly, the NMC 622 electrodes were soaked in electrolyte for 20 min, to ensure a homogenous and complete wetting. A total of 120 µl electrolyte was added. The electrolyte was a mixture of ethylene carbonate and dimethyl carbonate (EC/DMC 1:1) with 1 M lithium hexafluorophosphate (LiPF6) as the conducting salt. The separator was an alumina coated polyethylene (PE) foil with a thickness of 14.5 µm (Targray, Canada). After stacking, the parts were pressed together using an electric crimper machine (MSK-160D, MTI Corporation, USA). When the assembly was finished, the coin cells were stored at room temperature for 18 h, in order to allow the electrodes and separator to be fully wet with liquid electrolyte.
After assembling, cyclic voltammetry (CV) and galvanostatic measurements were used to characterize the electrochemical performance of coin cells using a battery cycler BT 2000 (Arbin Instruments, USA). A constant current–constant voltage (CC–CV) charge protocol was used for the first five cycles at C/10. The so-called “formation” step was used to ensure a homogeneous growth of solid electrolyte interphase (SEI) on the electrode [10]. After the formation step at C/10 with 5 cycles, a constant charge rate of C/5 was set, while the discharge rate varied in an accelerating trend from C/5 to 5C. At the end, a discharge rate of C/5 (5 cycles) was applied, in order to analyze the irreversible capacity loss. The scan rate of CV measurements increased from 0.02 mV/s to 0.1 mV/s. The voltage range for CV and galvanostatic measurements was set to 3.0–4.3 V. All electrochemical analyses were performed in ambient atmosphere at room temperature.

3. Results

3.1. Electrode Preparation

NMC 622 cathodes were tape-casted with thicknesses from 140 µm to 320 µm by adjusting the gap between doctor blade and Al foil. For cathode films with thickness over 200 µm, less NMP solvent was added during the second mixing step, in order to achieve a slurry with higher viscosity (3–4 Pa·s at the shear rate of 50 s−1). The porosity of a dried cathode was determined by the following equation [7]:
P o r o s i t y = V ( m N M C ρ N M C + m T I M C A L ρ T I M C A L + m P V D F ρ P V D F ) V = H M t o t a l   · i c i ρ i H ,
where V is the maximum possible volume, taking into account the outer dimensions of the composite electrode, m is the mass of each component, and ρ is the density of each component. Since there are only three components of a cathode, m can be replaced by the total mass multiplying the content percentage (ci) of each component. In addition, the cathodes were laser-cut in circles of 12 mm in diameter. It is convenient to substitute mass with areal mass M (g/cm2). H is the thickness of the cathode without aluminum current collector. The thickness, porosity, and other details of cathode films are listed in Table 1.
The mass loading in Table 1 is defined as the mass of active material (NMC 622) divided by the electrode area. The state of the art electrodes with thicknesses from 50 to 100 µm have mass loadings of 10–20 mg/cm2. However, in this paper, the mass loadings of the cathodes were increased to over 50 mg/cm2.
Figure 2 shows the cross-section of laser structured NMC 622-cathodes with thicknesses of 111 µm, 171 µm, and 270 µm and generated grooves with aspect ratios of 1:3, 1:5.5, and 1:8, respectively. The width of the groove structures of electrodes with thicknesses of 111 µm, 171 µm, and 270 µm for their cathodes were 33 ± 5 µm, 28 ± 5 µm, and 32 ± 5 µm, respectively. The sidewalls of the channels showed a slight curvature, which became more obvious for thin film electrodes. The rugged edges of the structures may due to the inhomogeneity of electrode materials inside the thick film. The active mass loading of each cathode was measured from electrodes with a diameter of 12 mm. For unstructured cathodes, the mass loading increased with increasing film thickness from 21.7 mg/cm2 to 56.7 mg/cm2, while for the laser structured cathodes, the mass loading increased with increasing pitch distance. The structured cathodes with thicknesses larger than 100 µm had less mass loss with decreasing pitch distance compared to cathode of 91 µm.
Scanning electron microscope (SEM) images of the structured cathodes are shown in Figure 3. A smooth electrode surface is observed due to the calendaring process. The width of the generated grooves was 34 ± 5 µm, which corresponds to the result achieved from the cross section analyses. Besides, no evidence of laser induced melting on the edges of the line structures was found.

3.2. Electrochemical Analysis

3.1.1. Galvanostatic Measurements

For the purpose of studying the influence of the laser processing on the discharge capacity, the coin cells with structured and unstructured cathodes were cycled at different C-rates from C/10 to 5C (Figure 4). During formation at C/10 and second step C/5, the specific discharge capacity for cells containing unstructured cathode was slightly higher compared to cells with structured cathodes (165 mAh/g). However, the thickness of electrode showed stronger influence on the rate capability for C-rates >C/5. For cells containing cathode of thickness of 91 µm, all cells showed similar discharge capacities of 160 mAh/g at C/5. The difference between cells containing structured and unstructured cathode was more obvious when the discharge rate was increased to C/2. At higher discharge rates from 1C to 5C, significant differences in the discharge capacities could be observed between cells with structured and unstructured cathodes. Cells with a structured cathode had 150 mAh/g capacity at 1C, while cells with an unstructured cathode had 140 mAh/g. At 3C and 5C, a structured cathode with 200 µm pitch distance provided the highest discharge capacity of 100 mAh/g and 50 mAh/g, respectively, which is almost twice comparing to cells with unstructured cathodes. After the discharge rate was reduced to C/5, all cells show a capacity of about 160 mAh/g. However, compared to the capacity at the first C/5, an irreversible loss in capacity of 5 mAh/g was observed.
Figure 4b,c shows significant capacity deterioration of cells with cathodes of 151 µm and 250 µm when being discharged faster than C/2. For cells with cathodes of 151 µm thickness, a structured cathode with 200 µm pitch distance retained the same discharge capacity of 160 mAh/g when the C-rate increased from C/5 to C/2 and maintained the most specific discharge capacity at 1C to 3C. At 5C, less than 10 mAh/g specific capacity was observed for all cells. At 1C and 2C, cells containing cathodes with 200 µm pitch distance showed higher specific capacity. As for cells with 250 µm cathodes, less than 10% of the initial capacity was observed when being cycled at 2C to 5C. Compared to cells with unstructured cathode, cells with structured cathode with 200 µm pitch distance showed enhanced specific capacities of 30 mAh/g and 50 mAh/g at C/2, and 1C, respectively. However, cells with cathodes having a pitch distance of 400 µm and 600 µm provided less specific capacity in comparison to cells with unstructured cathodes. Due to the significant improvement of discharge capacity observed for cells with cathodes and 200 µm pitch distance, it was interesting to investigate the discharge capacity of all cells containing unstructured cathodes and structured cathodes with 200 µm pitch distance, which is shown in Figure 4d. The discharge capacity increased from 4 mAh to 11 mAh at C/10 and C/5 when the cathode thickness increased from 91 µm to 250 µm. For cells with cathodes having a film thickness larger than 100 µm, structured cathodes provided a higher discharge capacity, from C/2 to 2C. At 1C, a capacity of 6 mAh was retained for cells with structured cathode having a film thickness of 250 µm, which is twice that of the cells with unstructured cathodes, while for film thickness of 151 µm the structured cathode enables a three times higher cell capacity in comparison to cells with unstructured cathode. However, applying a structured cathode with a film thickness of 91 µm delivers higher discharge capacity at 3C, while the cell capacity drops under 1 mAh after being cycled at 5C. Comparing to the first C/5 cycles, no distinct irreversible capacity loss was observed for all cells during the last C/5 cycles.

3.1.2. Cyclic Voltammetry

For cyclic voltammetry analyses, linearly voltage sweeps from 0.02 mV/s to 0.1 mV/s were applied to cells containing NMC 622 electrodes. The resulting current signals were recorded as shown in Figure 5. The first two cycles with a scan rate of 0.02 mV/s were removed due to influence of SEI formation on the lithium-ions’ diffusion. A hysteresis loop was recorded of current with a voltage increase and decrease from 3 V to 4.3 V. It is noticeable that for all cells, a current peak appears during charge and discharge process, which corresponds to the presence of a redox reaction on the cathode side. For each thickness, the current maximum increases from 0.001 A to 0.004 A with higher scan rates. Besides, the current peaks are located closer to each other, with an increasing scan rate for cells with structured cathodes in comparison to cells with unstructured cathodes, indicating better lithium-ion diffusion kinetics. In opposition to other cathodes, the cell with unstructured cathodes and a thickness of 250 µm thickness showed smaller current maxima when the scan rates reached values above 0.06 mV/s. This effect was less significant for cells with structured cathodes, showing a maximal current which stopped rising at scan rates of 0.09 mV/s and 0.1 mV/s.
In order to measure the chemical diffusion coefficient of lithium-ions in NMC 622 cathodes according to the Randles–Sevcik equation, which will be further discussed in the next section, all maximum currents were selected from CV analyses and plotted in Figure 6 against the square root of the corresponding scan rates. The recorded currents ranged from −0.004 A to 0.005 A. Figure 6 shows a linear relation between the two variables for cells, with cathodes having film thicknesses of 91 µm and 151 µm. However, when applying cathodes with 250 µm thickness, a linear correlation no longer exists when the scan rate is higher than 0.06 mV/s (square root of the scan rate higher as 0.008 V1/2·s−1/2). Therefore, in order to ensure the accuracy of the calculation, the slope for cathode with 250 µm thickness was calculated excluding the last four points ranging from 0.0835 to 0.0998 V1/2·s−1/2.

4. Discussion

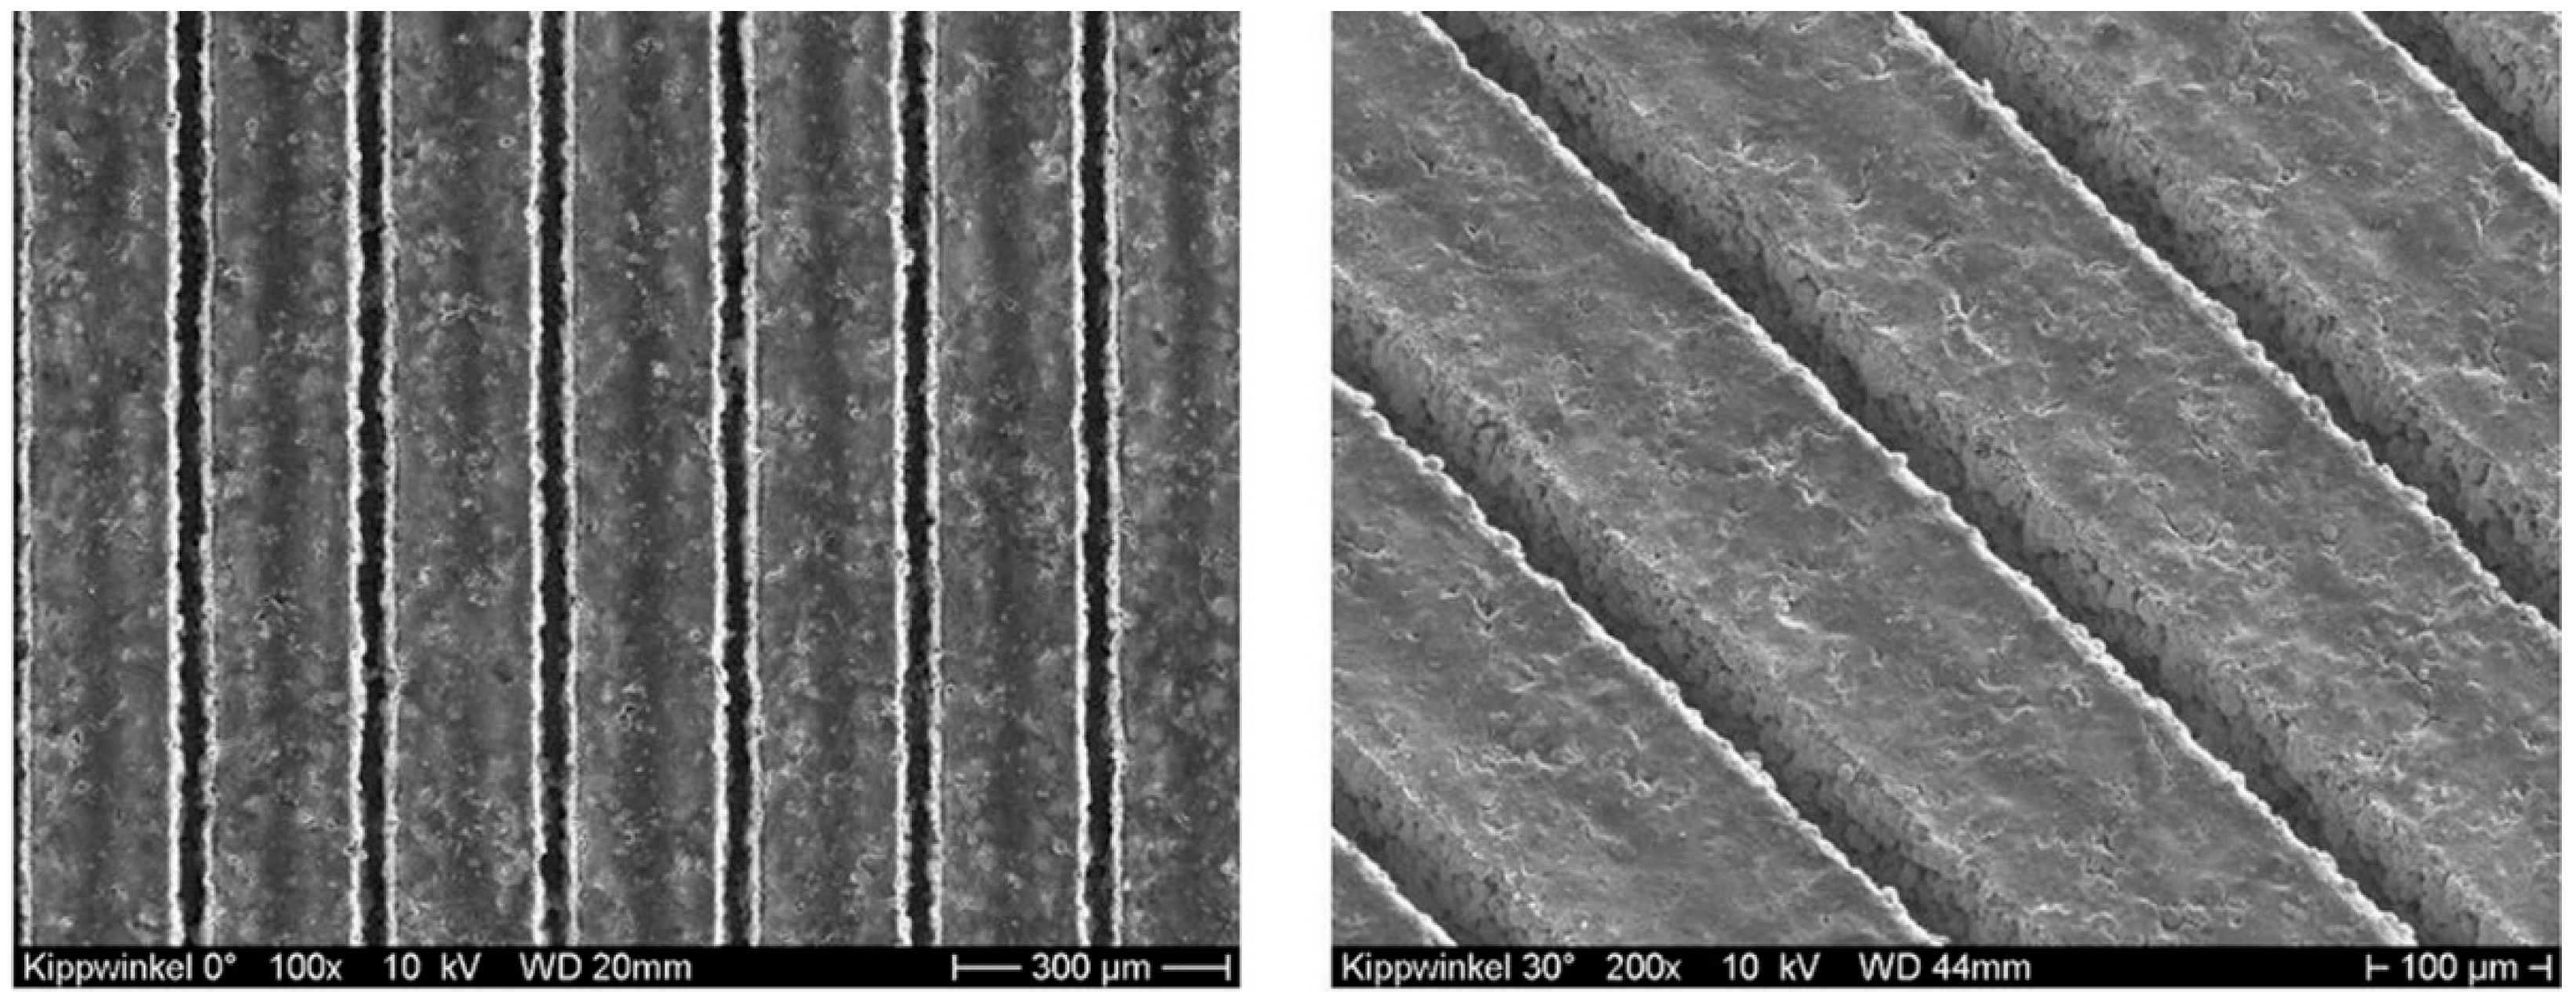
Laser structuring of advanced NMC 622 cathode materials using ultrafast laser ablation was investigated, regarding an improvement of cycling performances, such as capacity retention as a function of C-rate [7,8,9]. With ultrafast laser radiation, almost an ideal cold ablation process can be realized due to the well-known time-delay coupling of electron and phonon system [11,12].
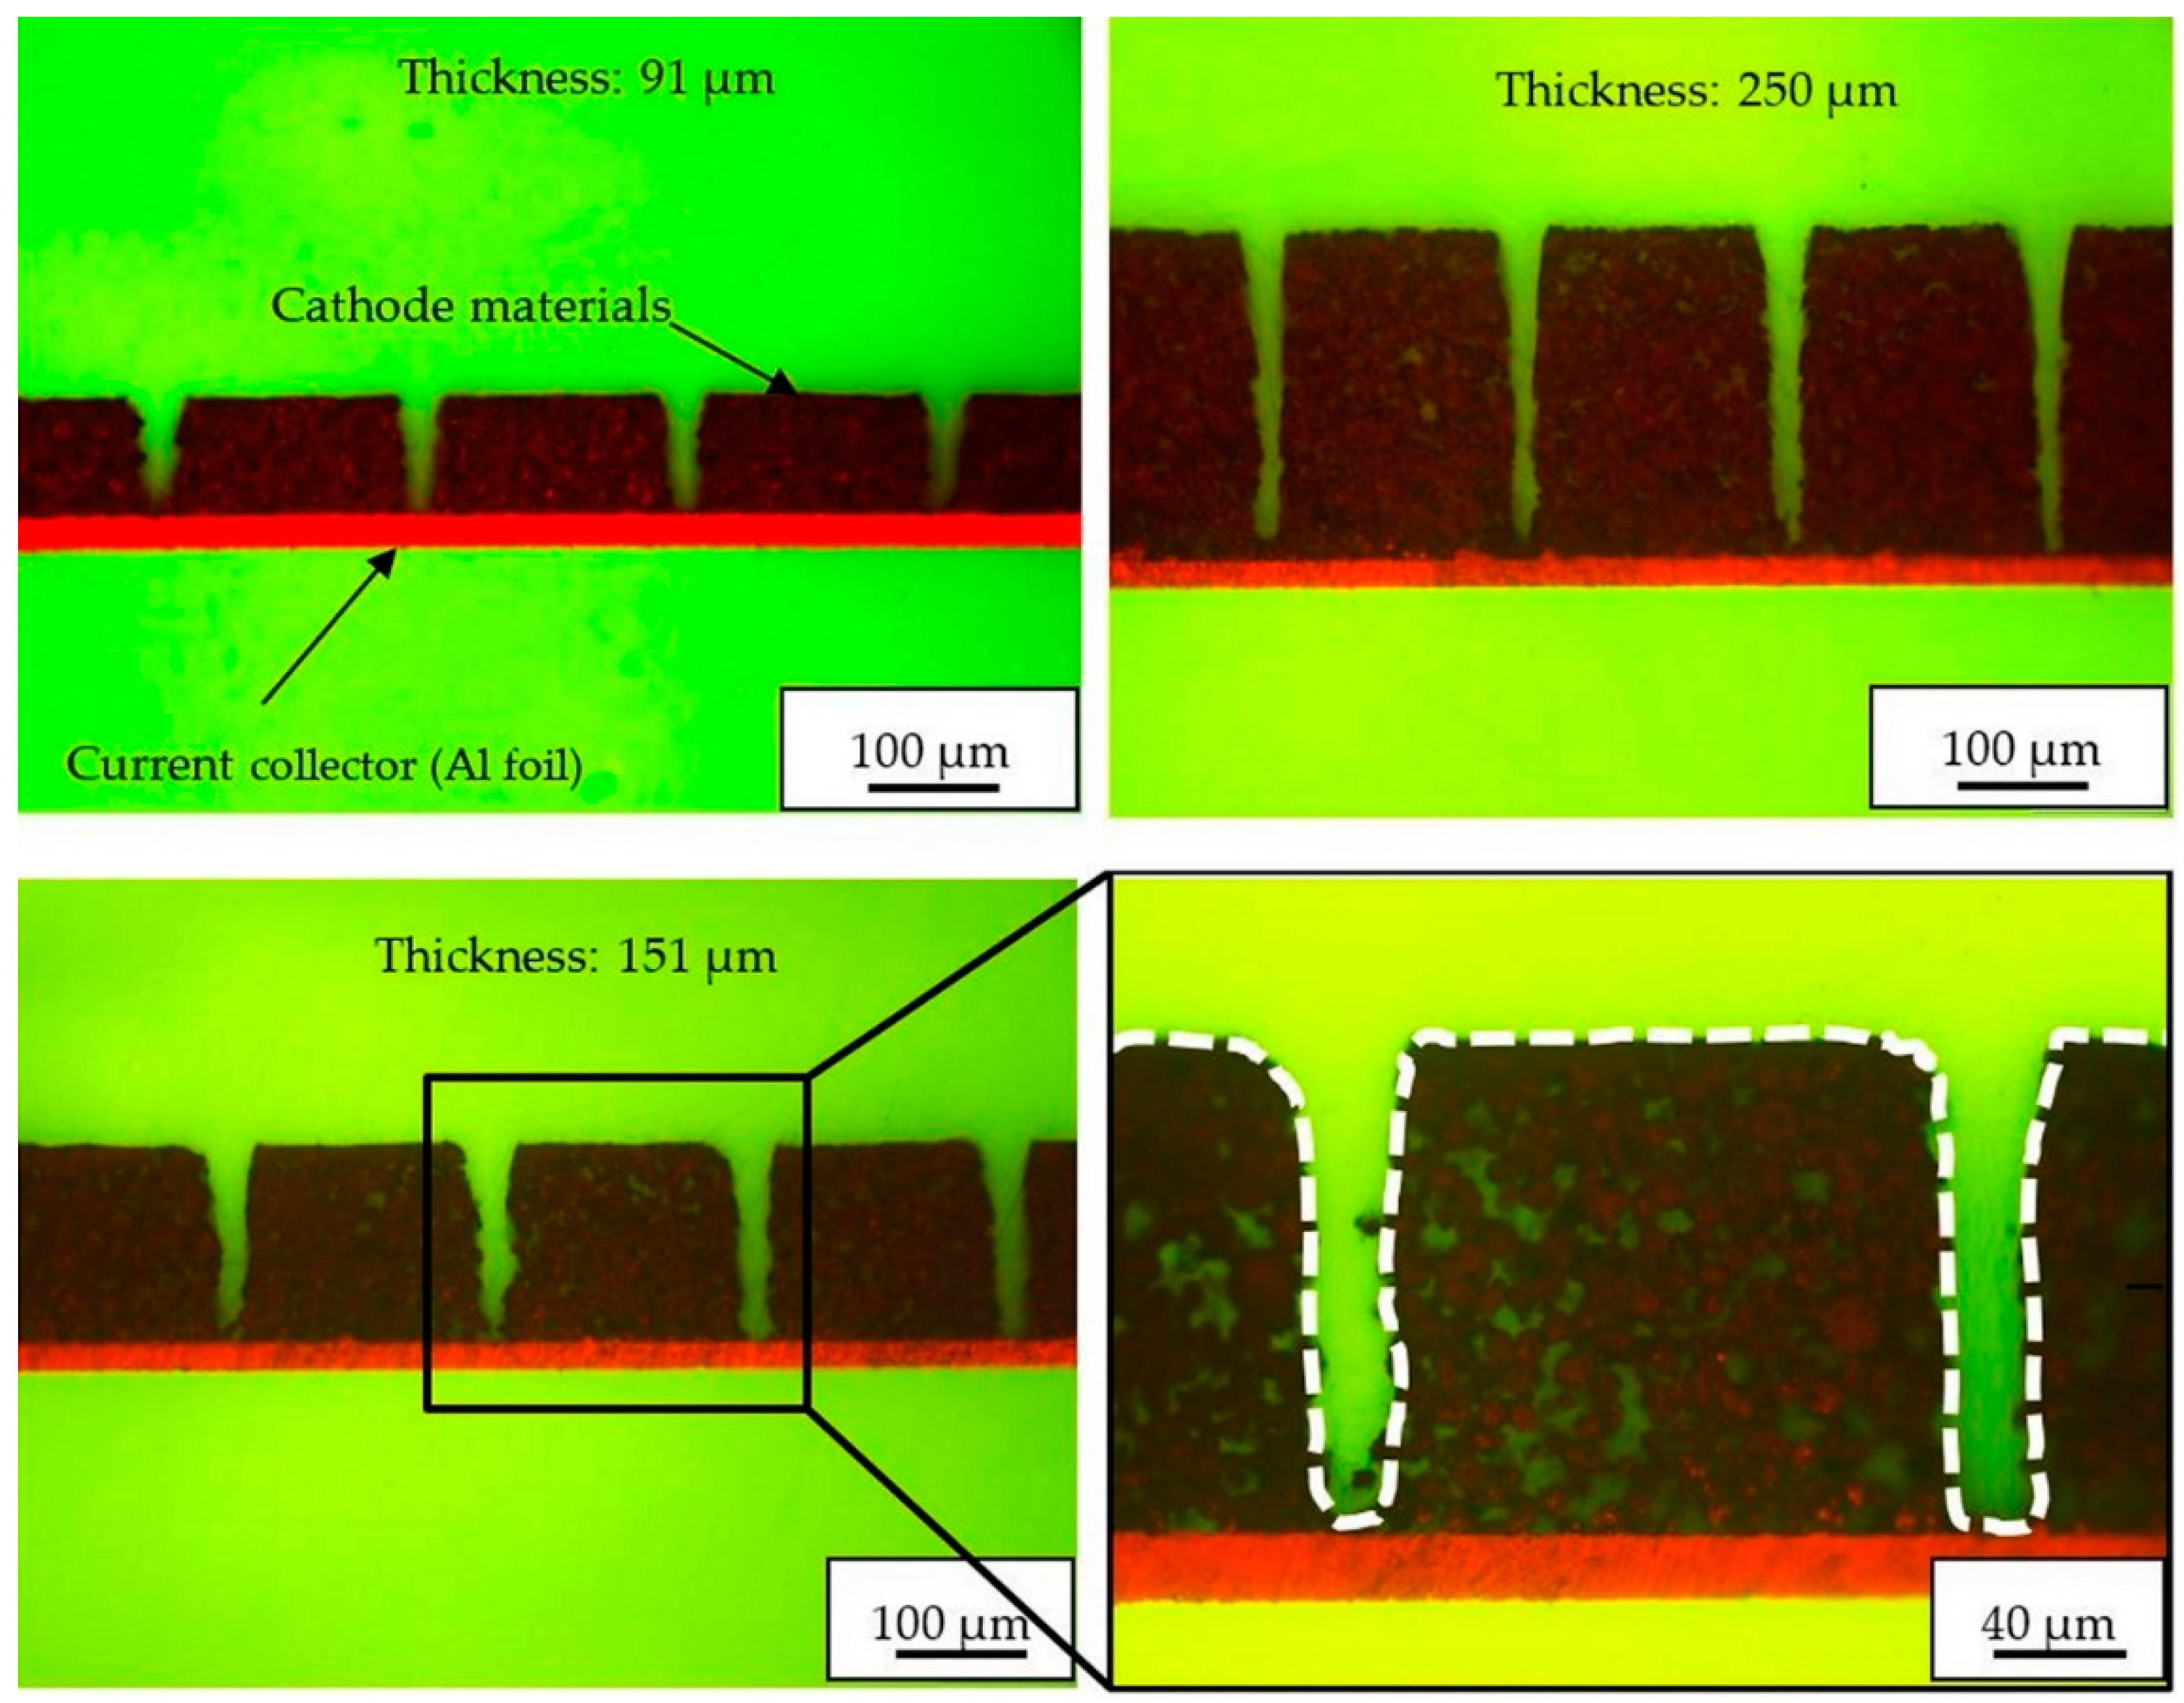
Table 1 shows that structured 91 µm cathodes with a pitch distance of 200 µm provided the highest mass loss of about 14%, while electrodes with higher film thickness showed a mass loss of about 8%. This is due to the wide crater opening of the established line structures which could be stated from the cross-section analyses (Figure 2). It was observed that within a length of about 50 µm beneath the electrode surface, the side-walls of the generated groove structures had a slight inclination of about 5°, while for length larger than 50 µm, the channel geometry tended to become rectangularly shaped. This means that for thin film electrodes (≤ 50 µm), the mass loss could increase rapidly, while for higher film thicknesses, the slope of increase of active mass loss is decreased and converges to a linear rise as a function of thickness. In addition, it was found that the groove walls were not always ideally smoothly contoured, which might be due to the different ablation rates for different types of materials, such as binder and NMC 622 particles.
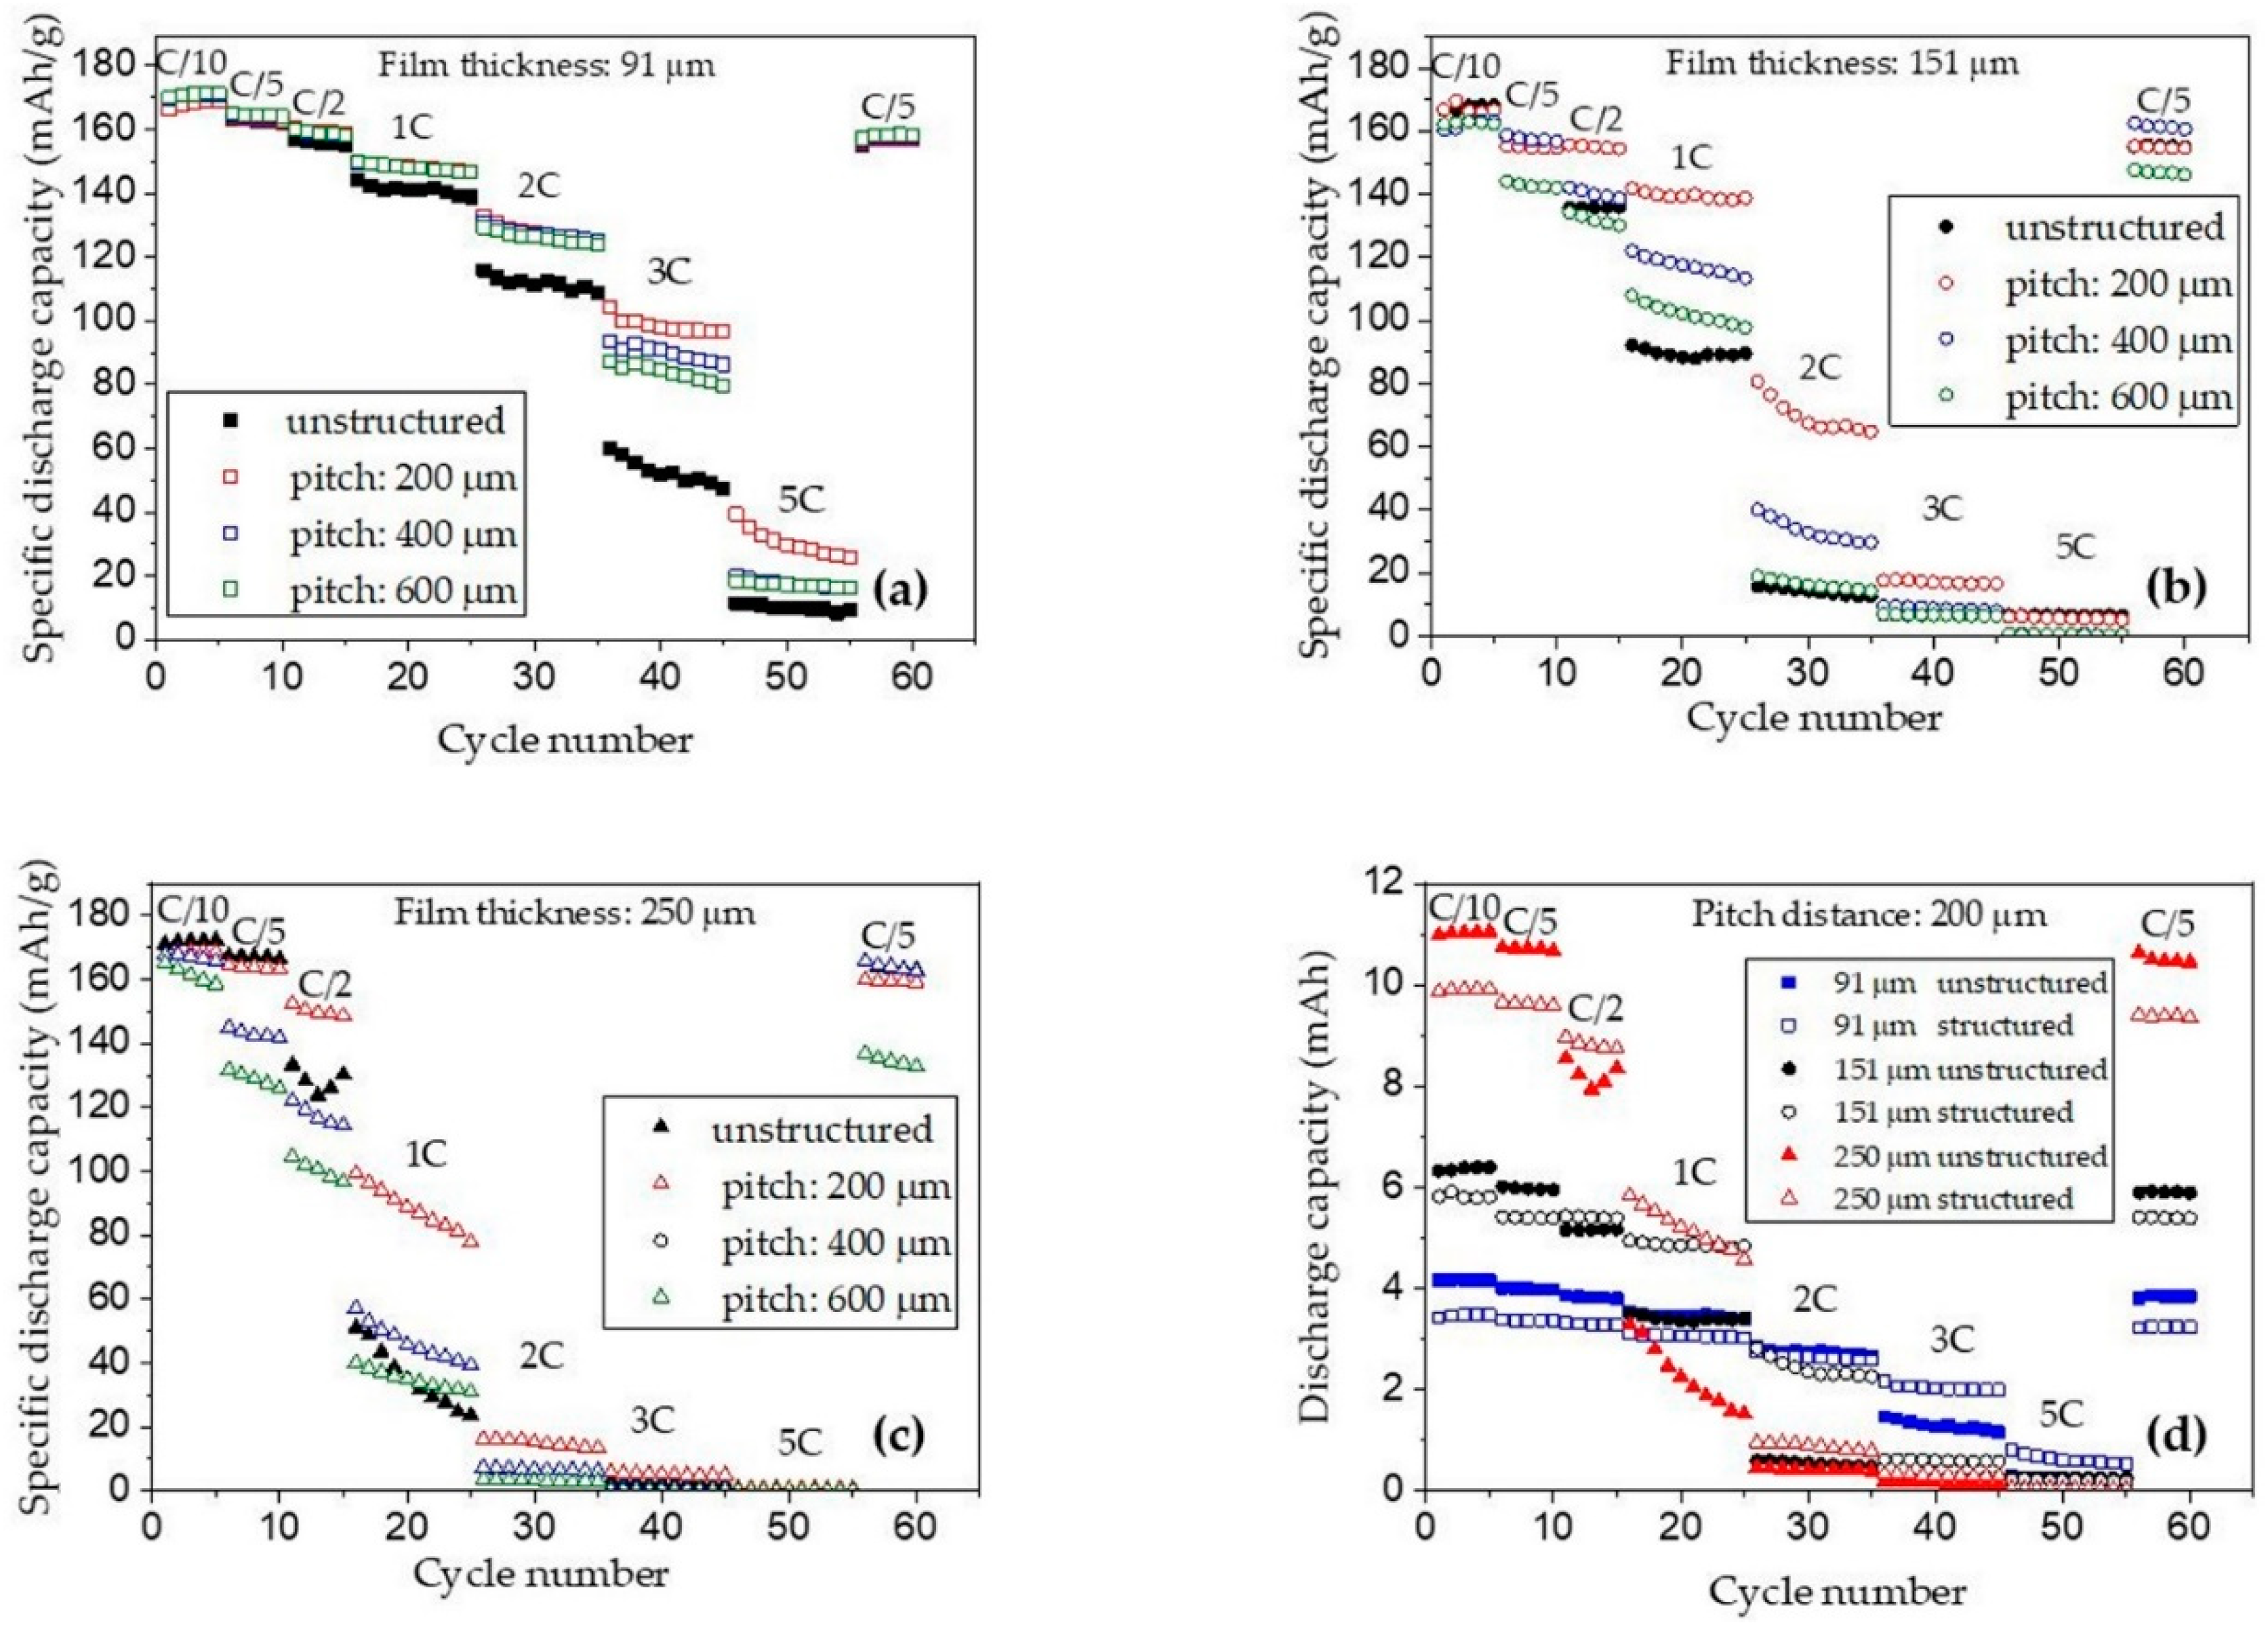
Figure 4 shows the rate capability of cells containing structured and unstructured NMC 622 cathodes. For the formation process at C/10, cells with structured cathodes have lower discharge capacity compared to unstructured cathodes. During formation, a larger solid electrolyte interface (SEI) was formed due to the increase of interface between electrode and electrolyte [13]. This procedure consumes more active materials and electrolyte. Therefore, fewer lithium-ions are available for the intercalation process (discharge). Cells with structured NMC 622 cathodes begin to show superior performance at discharge rates from C/2 to 3C. Especially for electrodes with thicknesses of 151 µm and 250 µm, laser-structured cathodes with a pitch distance of 200 µm provide 40 mAh/g more discharge capacity at C/2 and 1C. The diffusion-controlled transport of lithium-ions in the cathode is considered a bottleneck, which strongly influences the discharge rate. The laser generated line structures lead to an increase in active surface area. With reduced pitch distance, the number of the line structures across the cathode increases, which results in a shorter length of average diffusion path for lithium-ions from electrolyte to bulk material. Therefore, this leads to a reduced cell polarization and an improved high rate capability. It is verified that the lithium concentration along the contour of 3D architectures in electrodes is significantly increased using laser-induced breakdown spectroscopy, which indicates an improvement of lithium mobility by providing additional lithium diffusion pathways [14]. However, as the discharge rate increased from C/2 to 5C, all cells suffered from successive loss in discharge capacity. The decreasing of the discharge curve at higher C-rates corresponds to an enhanced cell polarization induced by the internal cell resistance [6]. When being cycled again at C/5, the cell with 250 µm cathode shows an irreversible capacity loss of 5%, while other cells have 2%–3% loss. According to Zhang et al. [15], during electrochemical cycling, side reactions can be induced, such as electrolyte oxidation with metallic lithium, which can promote the growth of the resistive surface layer. Another factor is the mechanical stability. Upon cycling, active materials suffer from a volume expansion and contraction with lithium intercalation and deintercalation. The change in volume can induce severe strain accumulation in the thick electrode, leading to increased internal stress [16]. Especially at high C-rates above 1C, the rapid volume change will lead to crack formation or a fracture in the cathode laminate. Those cracks can cause particle isolation, resulting in capacity loss of the electrode.
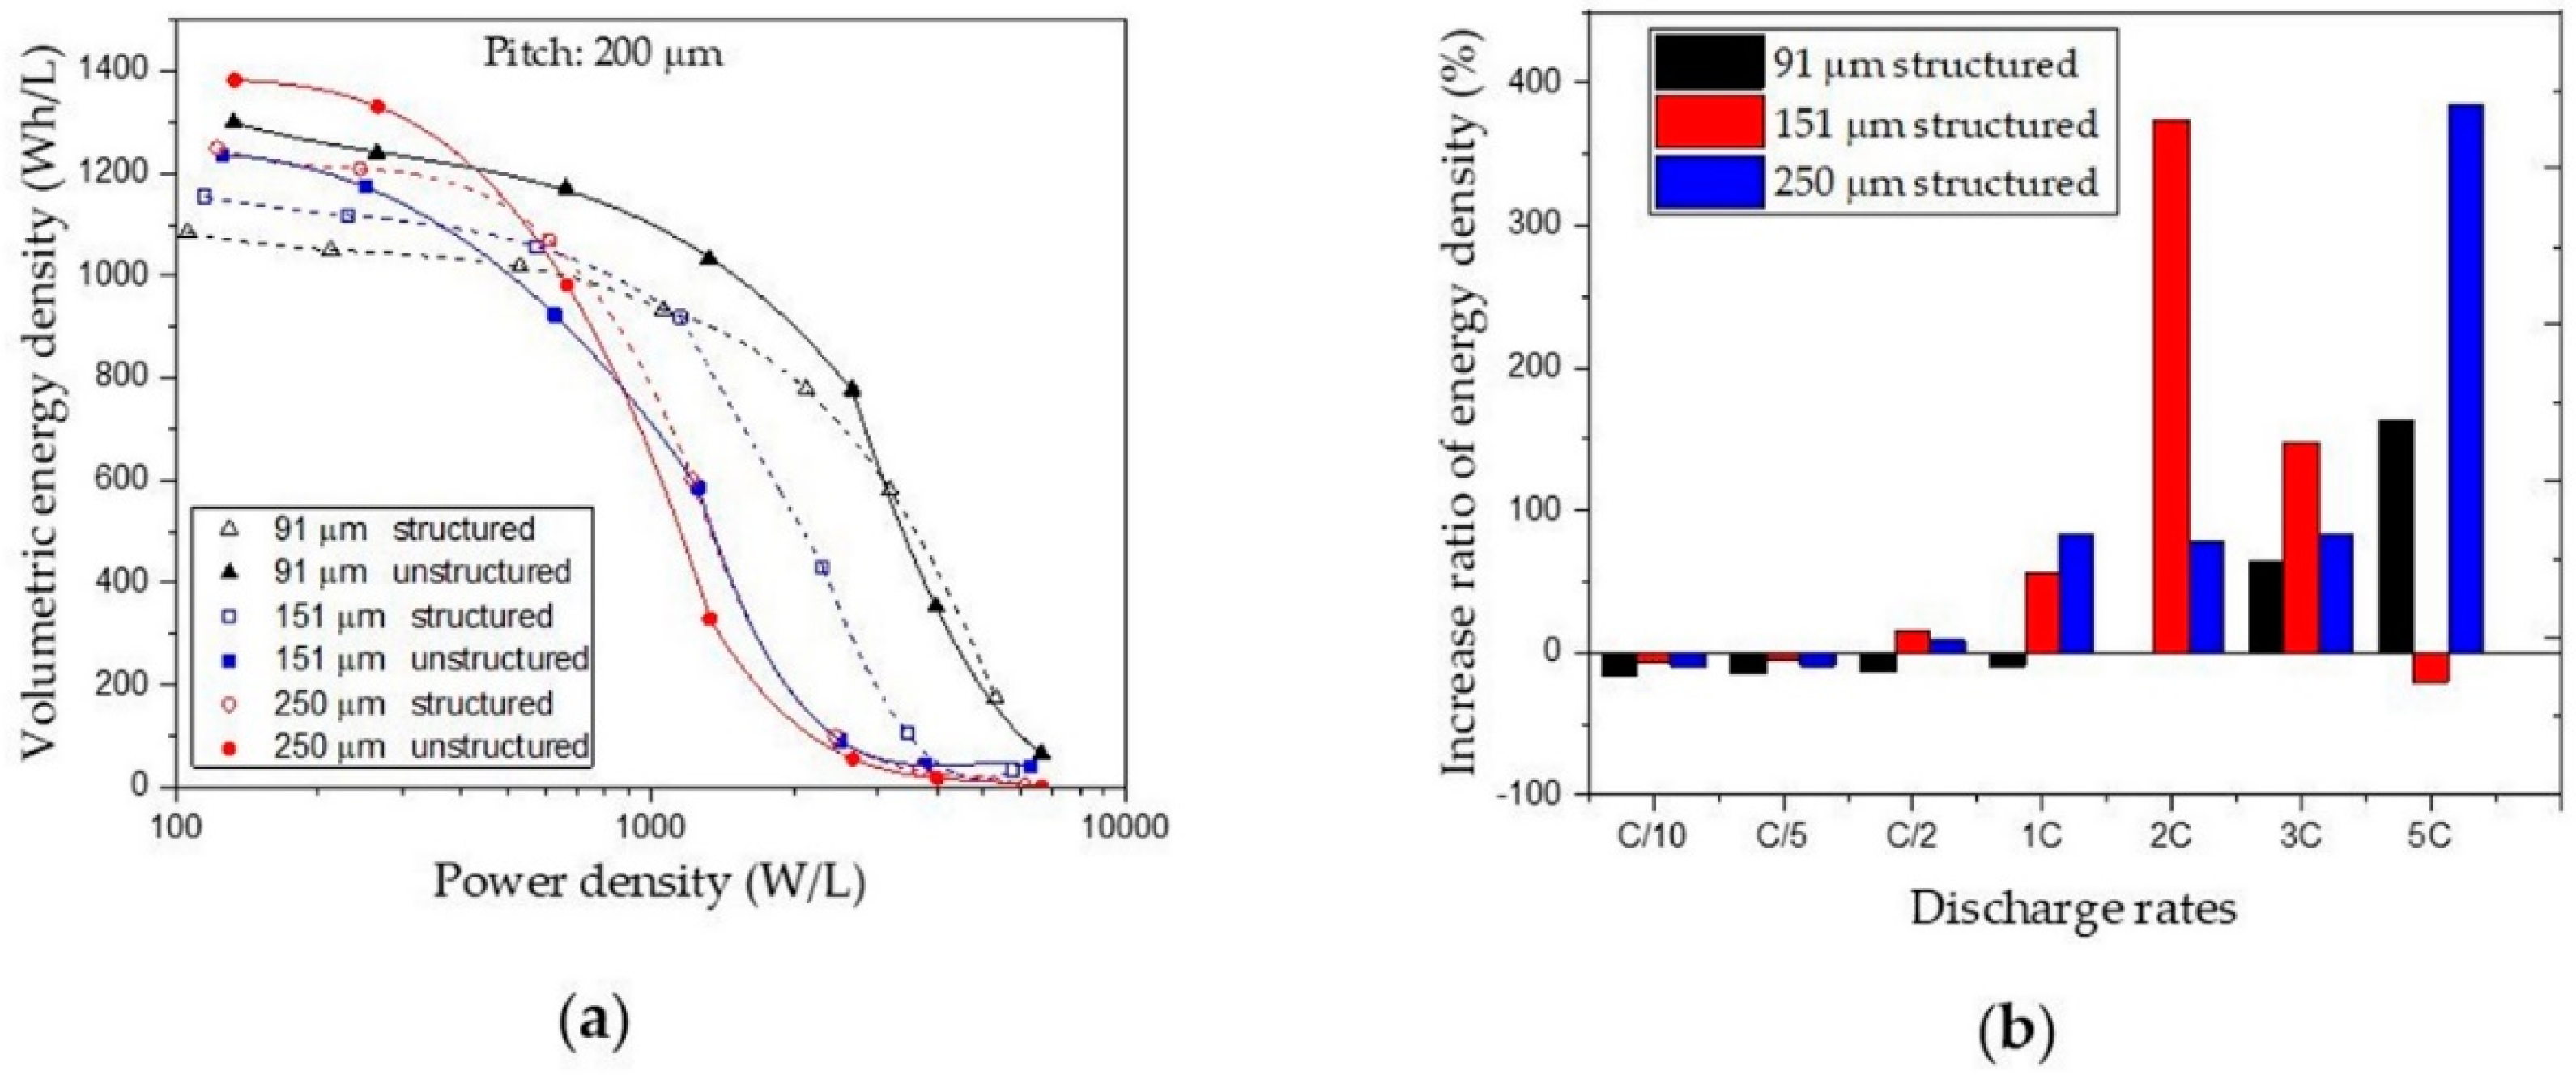
For commercial applications, power density and energy density are more practical to characterize electrochemical cell performance. Since cathodes with 200 µm pitch distance show great improvement of rate capability for each thickness, the volumetric energy density of cells containing structured cathodes with 200 µm pitch distance and cells with unstructured cathodes were calculated from galvanostatic measurements and were plotted versus the power density (Figure 7a). In order to be more consistent with the practical situation in the battery industry, the calculation of volumetric energy density with respect to cathode side was carried out using the total volume of the electrode material plus half of the volume of current collector and separator, since double-coated cathodes and anodes are mostly used in industry. This Ragone chart reveals that the energy density decreases with higher power density, especially for thick electrodes, and the energy density drops dramatically with increasing power. Clearly, there is a trade-off between energy density and power density controlled by the electrode thickness. At 100 W/L to 400 W/L, a cell with a 250 µm unstructured cathode has the highest energy density of about 1400 Wh/L, which is due to the decrease of current collector fraction with increasing electrode thickness. Meanwhile, all unstructured cathodes have 100 to 200Wh/L more energy density compared to structured cathodes, which means that for low power application (C-rate below C/2), the improvement of lithium-ion diffusion with 3D structures in electrode is insufficient to compensate the mass loss of electrode materials owing to laser structuring. However, laser structured cathodes show higher energy density with increased power when power density reached a threshold. For cathodes with 151 µm and 250 µm thicknesses, the turning point is 400 W/L, and 600 W/L, respectively. The cells with structured cathode of 91 µm thickness begin to show higher energy densities, at 3000 W/L, which is significantly delayed in comparison to cells with other cathodes, indicating that laser structuring technique is very suitable for improving the electrochemical performance of cells with thick cathodes at higher C-rates.
Furthermore, when the inactive components, such as current collector and separator are taken into account, the production cost of battery with thick film electrode will be significantly reduced. Table 2 shows the total area and quantity of NMC 622 cathodes that are required for the production of 52-Ah automobile cells using an electrode design of 21 cm × 24 cm, as suggested by Wood et al. [17]. The area of cathodes decreases from 1.45 m2 to 0.56 m2 with increasing film thickness from 91 µm to 250 µm, allowing for using half of the separators as well as the current collectors. For cells with 91 µm cathodes, 14 to 17 cathode sheets are needed, while only six sheets will be packed into the cells with cathodes having a thickness of 250 µm. As a result, the cost of electrode cutting and welding will be decreased. Besides, the difference of required area for 52-Ah cell between structured NMC 622 cathodes and unstructured NMC 622 cathodes is less distinct (the differences for cathodes with thicknesses of 91 µm and 250 µm are 0.12 m2–0.02 m2 and 0.02 m2–0.01 m2, respectively).
The energy density of an entire cell tends to be lower when anode and separator are taken into account, with about 370 Wh/L to 430 Wh/L energy density for cells with 100 µm to 250 µm cathodes [18]. The cathode of 91 µm thickness has almost 1300 Wh/L, about 300 Wh/L more energy density, compared to the results from Zheng et al., of NMC 111 [6], which is due to the higher specific capacity of NMC 622. Figure 7b shows the improvement of energy density for cells with structured cathodes in comparison to cells with unstructured cathodes having the same thicknesses. For structured cathodes, a 100% to 400% higher energy density is observed at 1C to 5C. As for 151 µm cathode, the enhancement is more significant at 1C to 3C. Although cells with structured cathodes having a line pitch distance of 200 µm showed higher discharge capacity with increasing discharge rate comparing to cells having other line pitch distances, it is unnecessary to pursue higher power simply by decreasing the pitch distance, because that leads to a dramatic active mass loss, which in turn would increases the total battery manufacture cost. Therefore, the selection of pitch distance and electrode thickness should be related to specific demands of applications. For the stationary storage application, unstructured thick film electrodes are preferred, while for high powered usage, such as in electrical vehicles, laser structuring has great potential. Besides, thick film electrode and 3D electrode concepts ensure higher capacity as well as higher power, at intermediate C-rates around C/2.
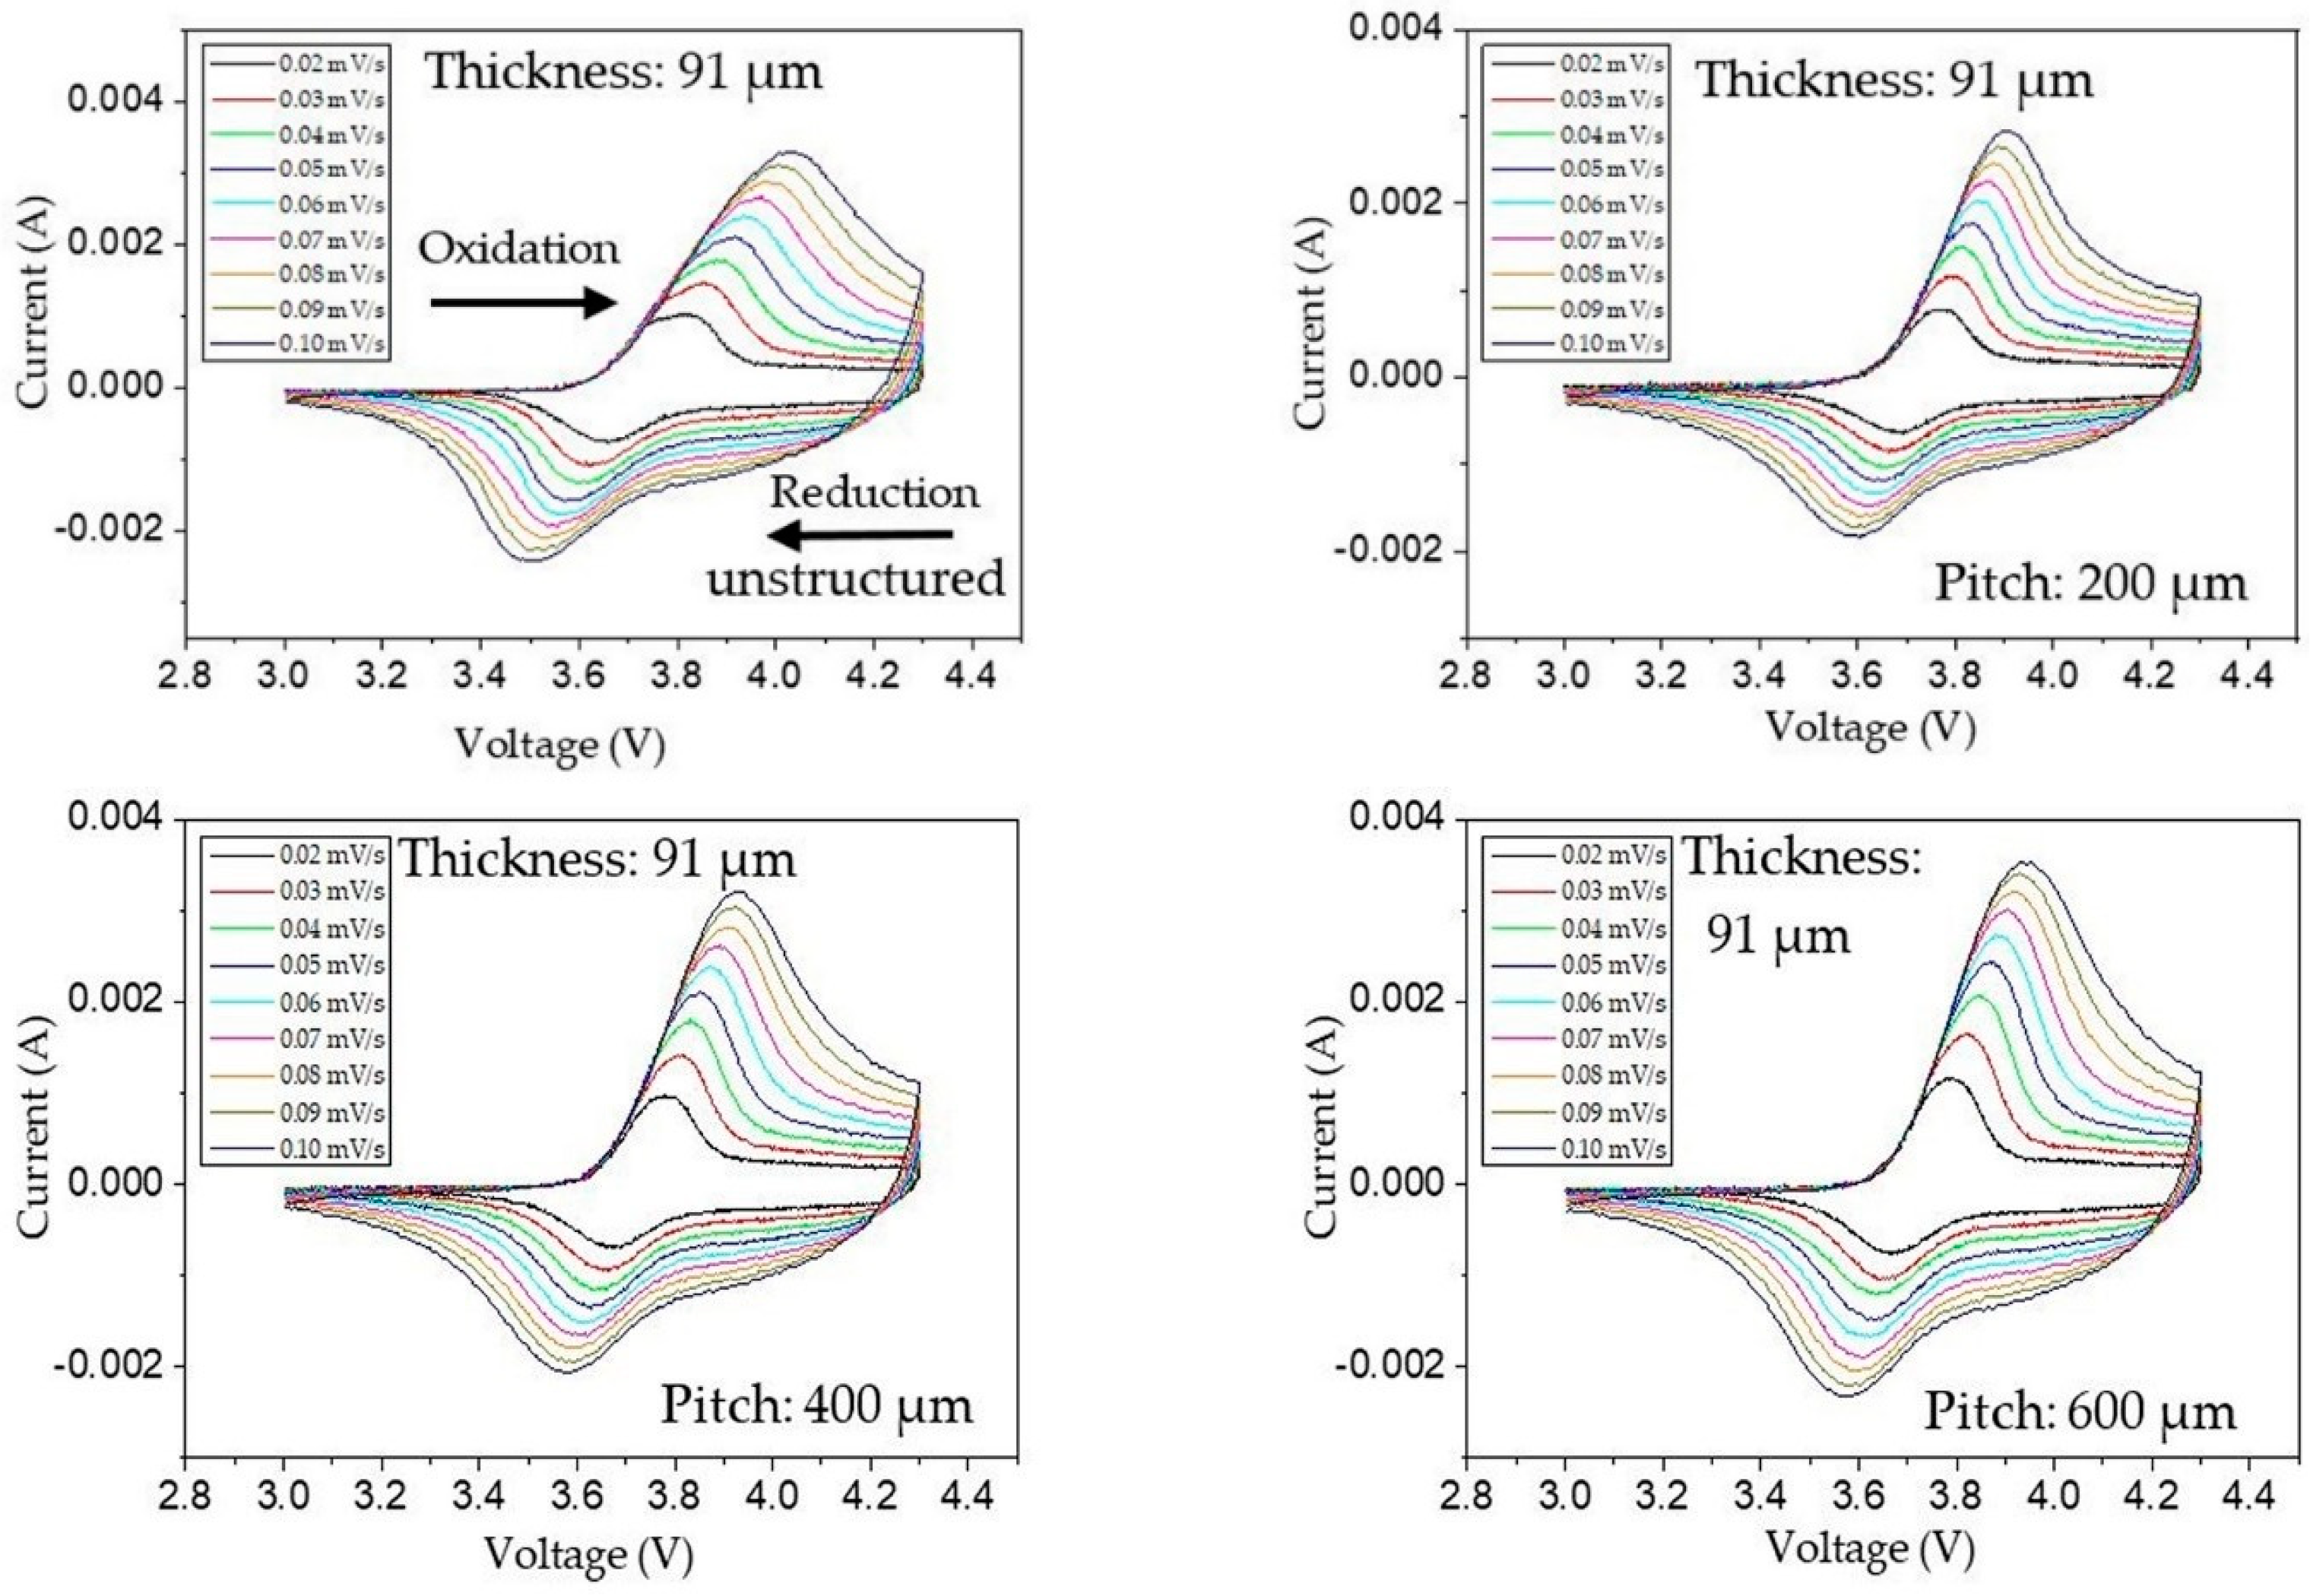
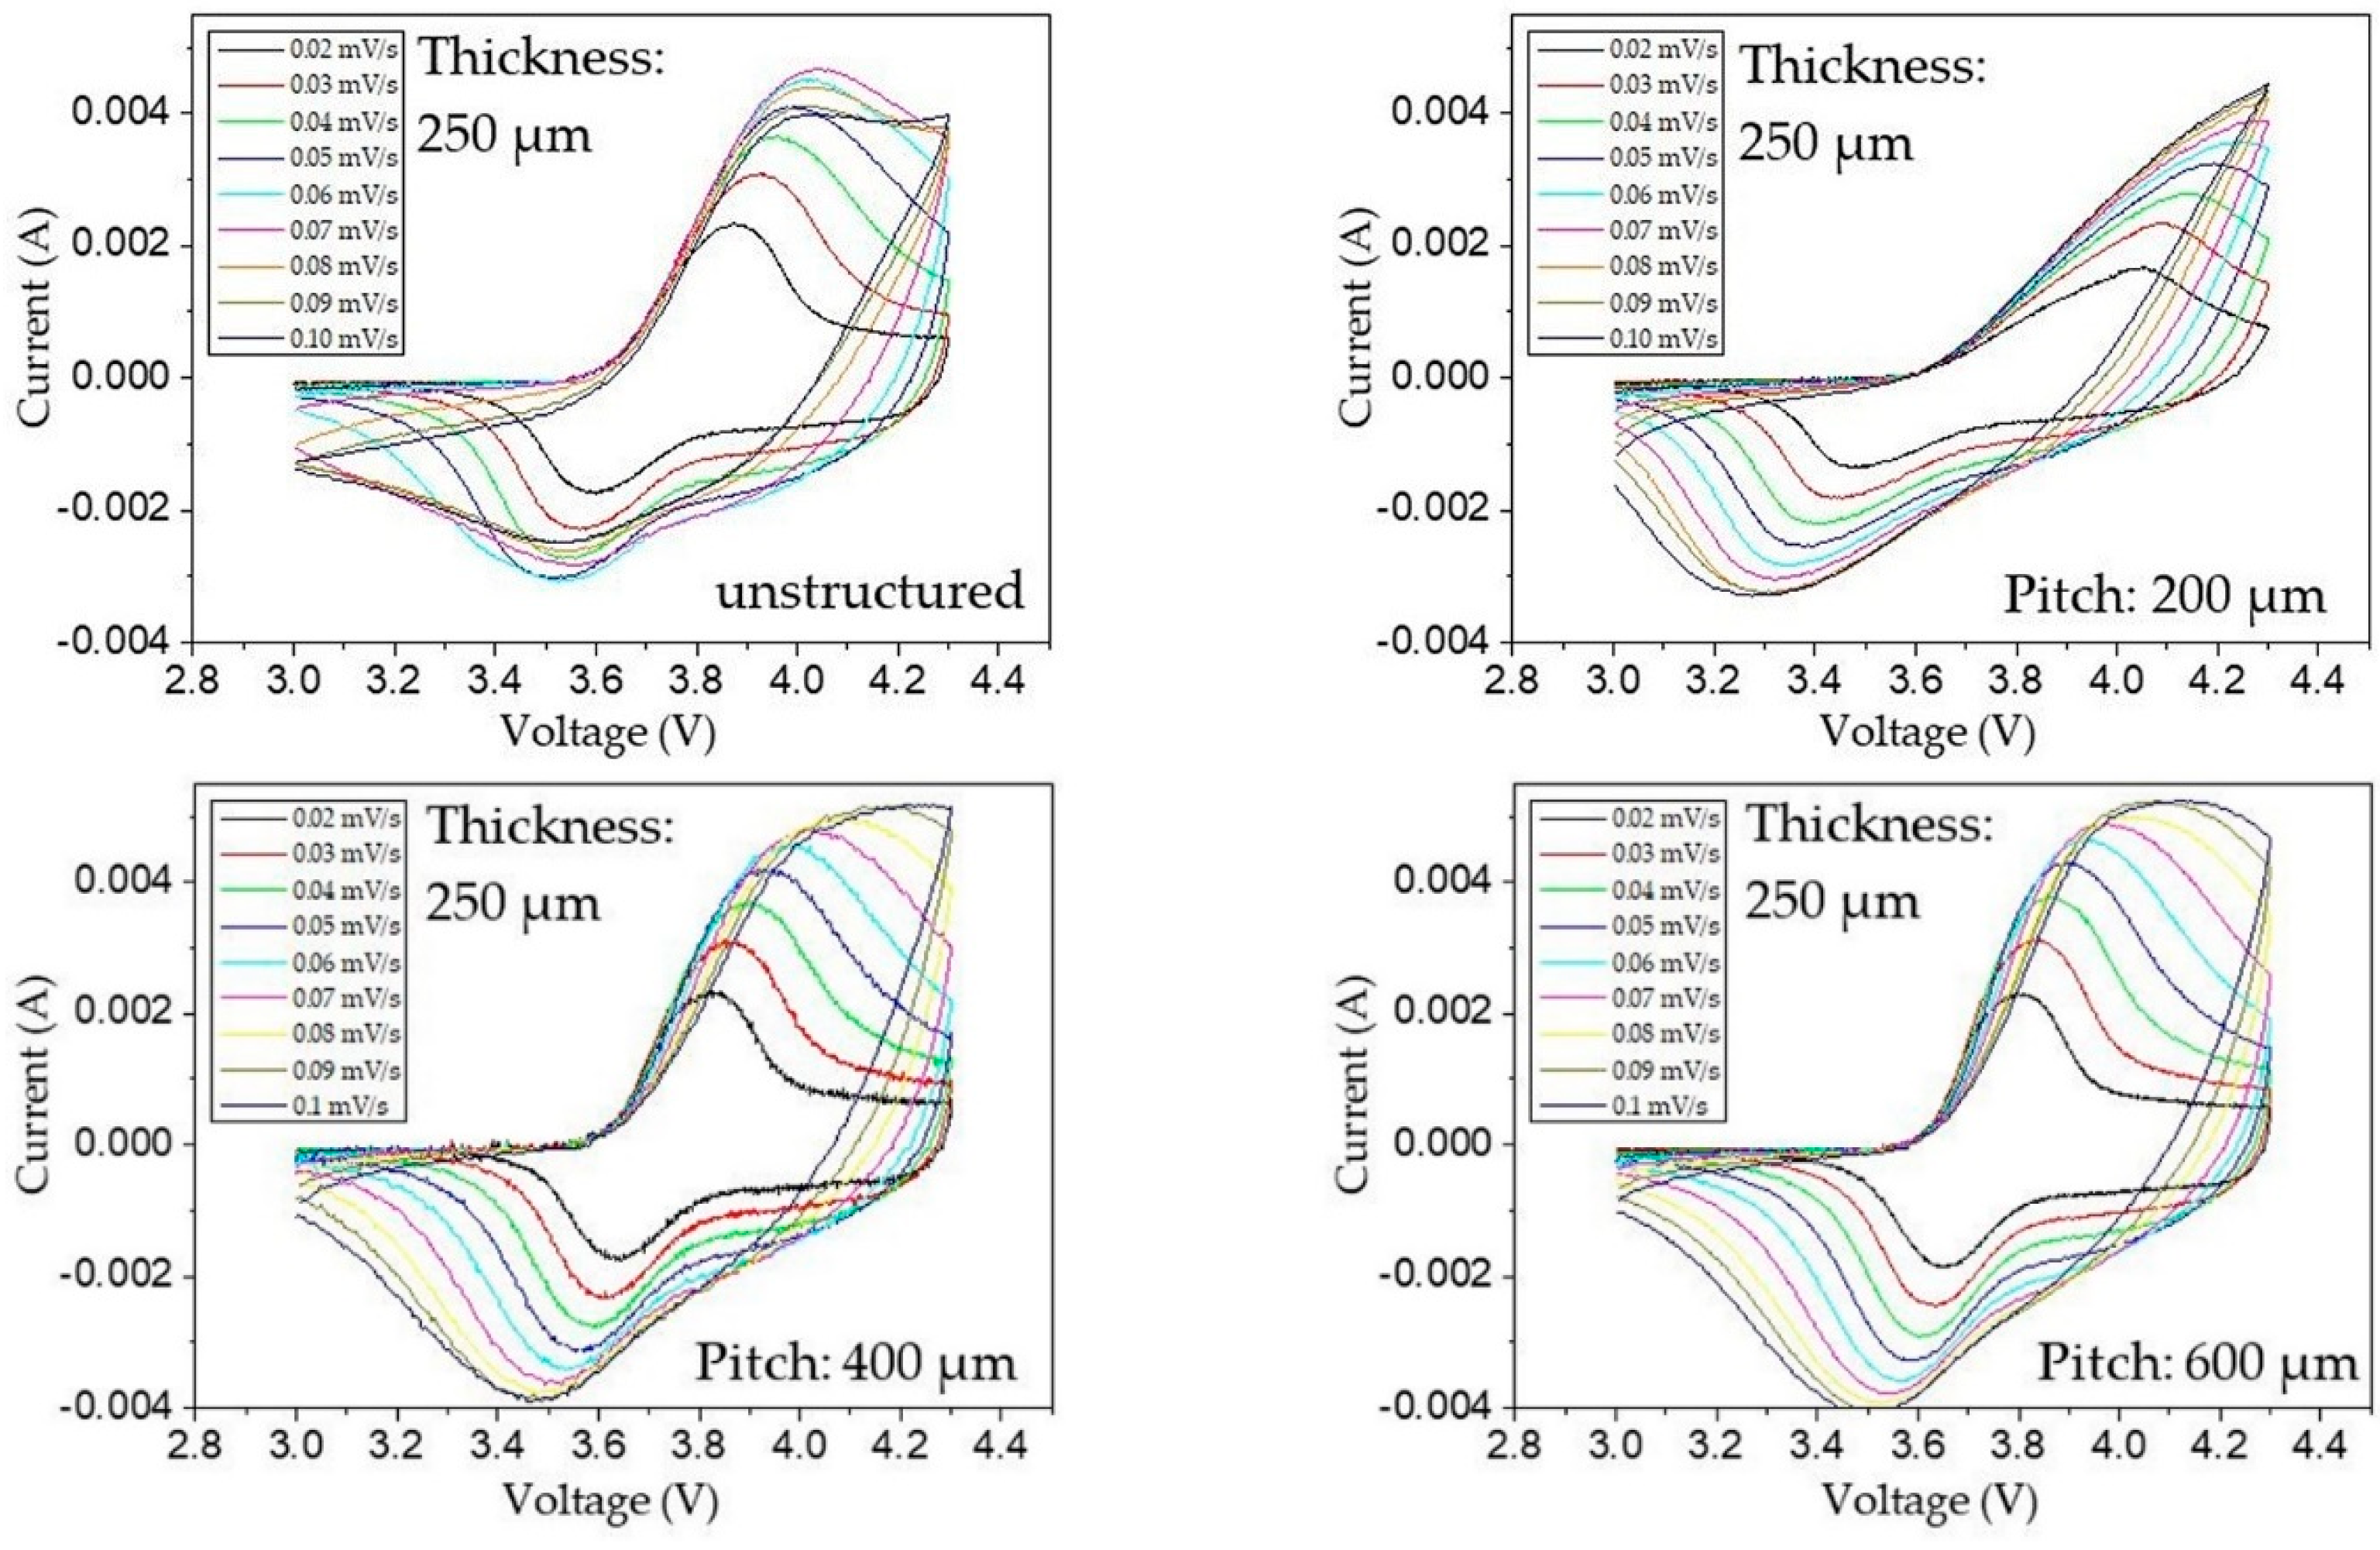
The CV analyses of cells with NMC 622 cathodes in Figure 5 show only one redox couple from 3 V to 4.3 V, which corresponds to the oxidation and reduction of Ni2+/Ni4+ [19]. The oxidation peak of NMC 622 cathode appears at 3.8 V under 0.02 mV/s scan rate and gradually rises with increasing scan rate. The result is similar to the study by Cao et al. [
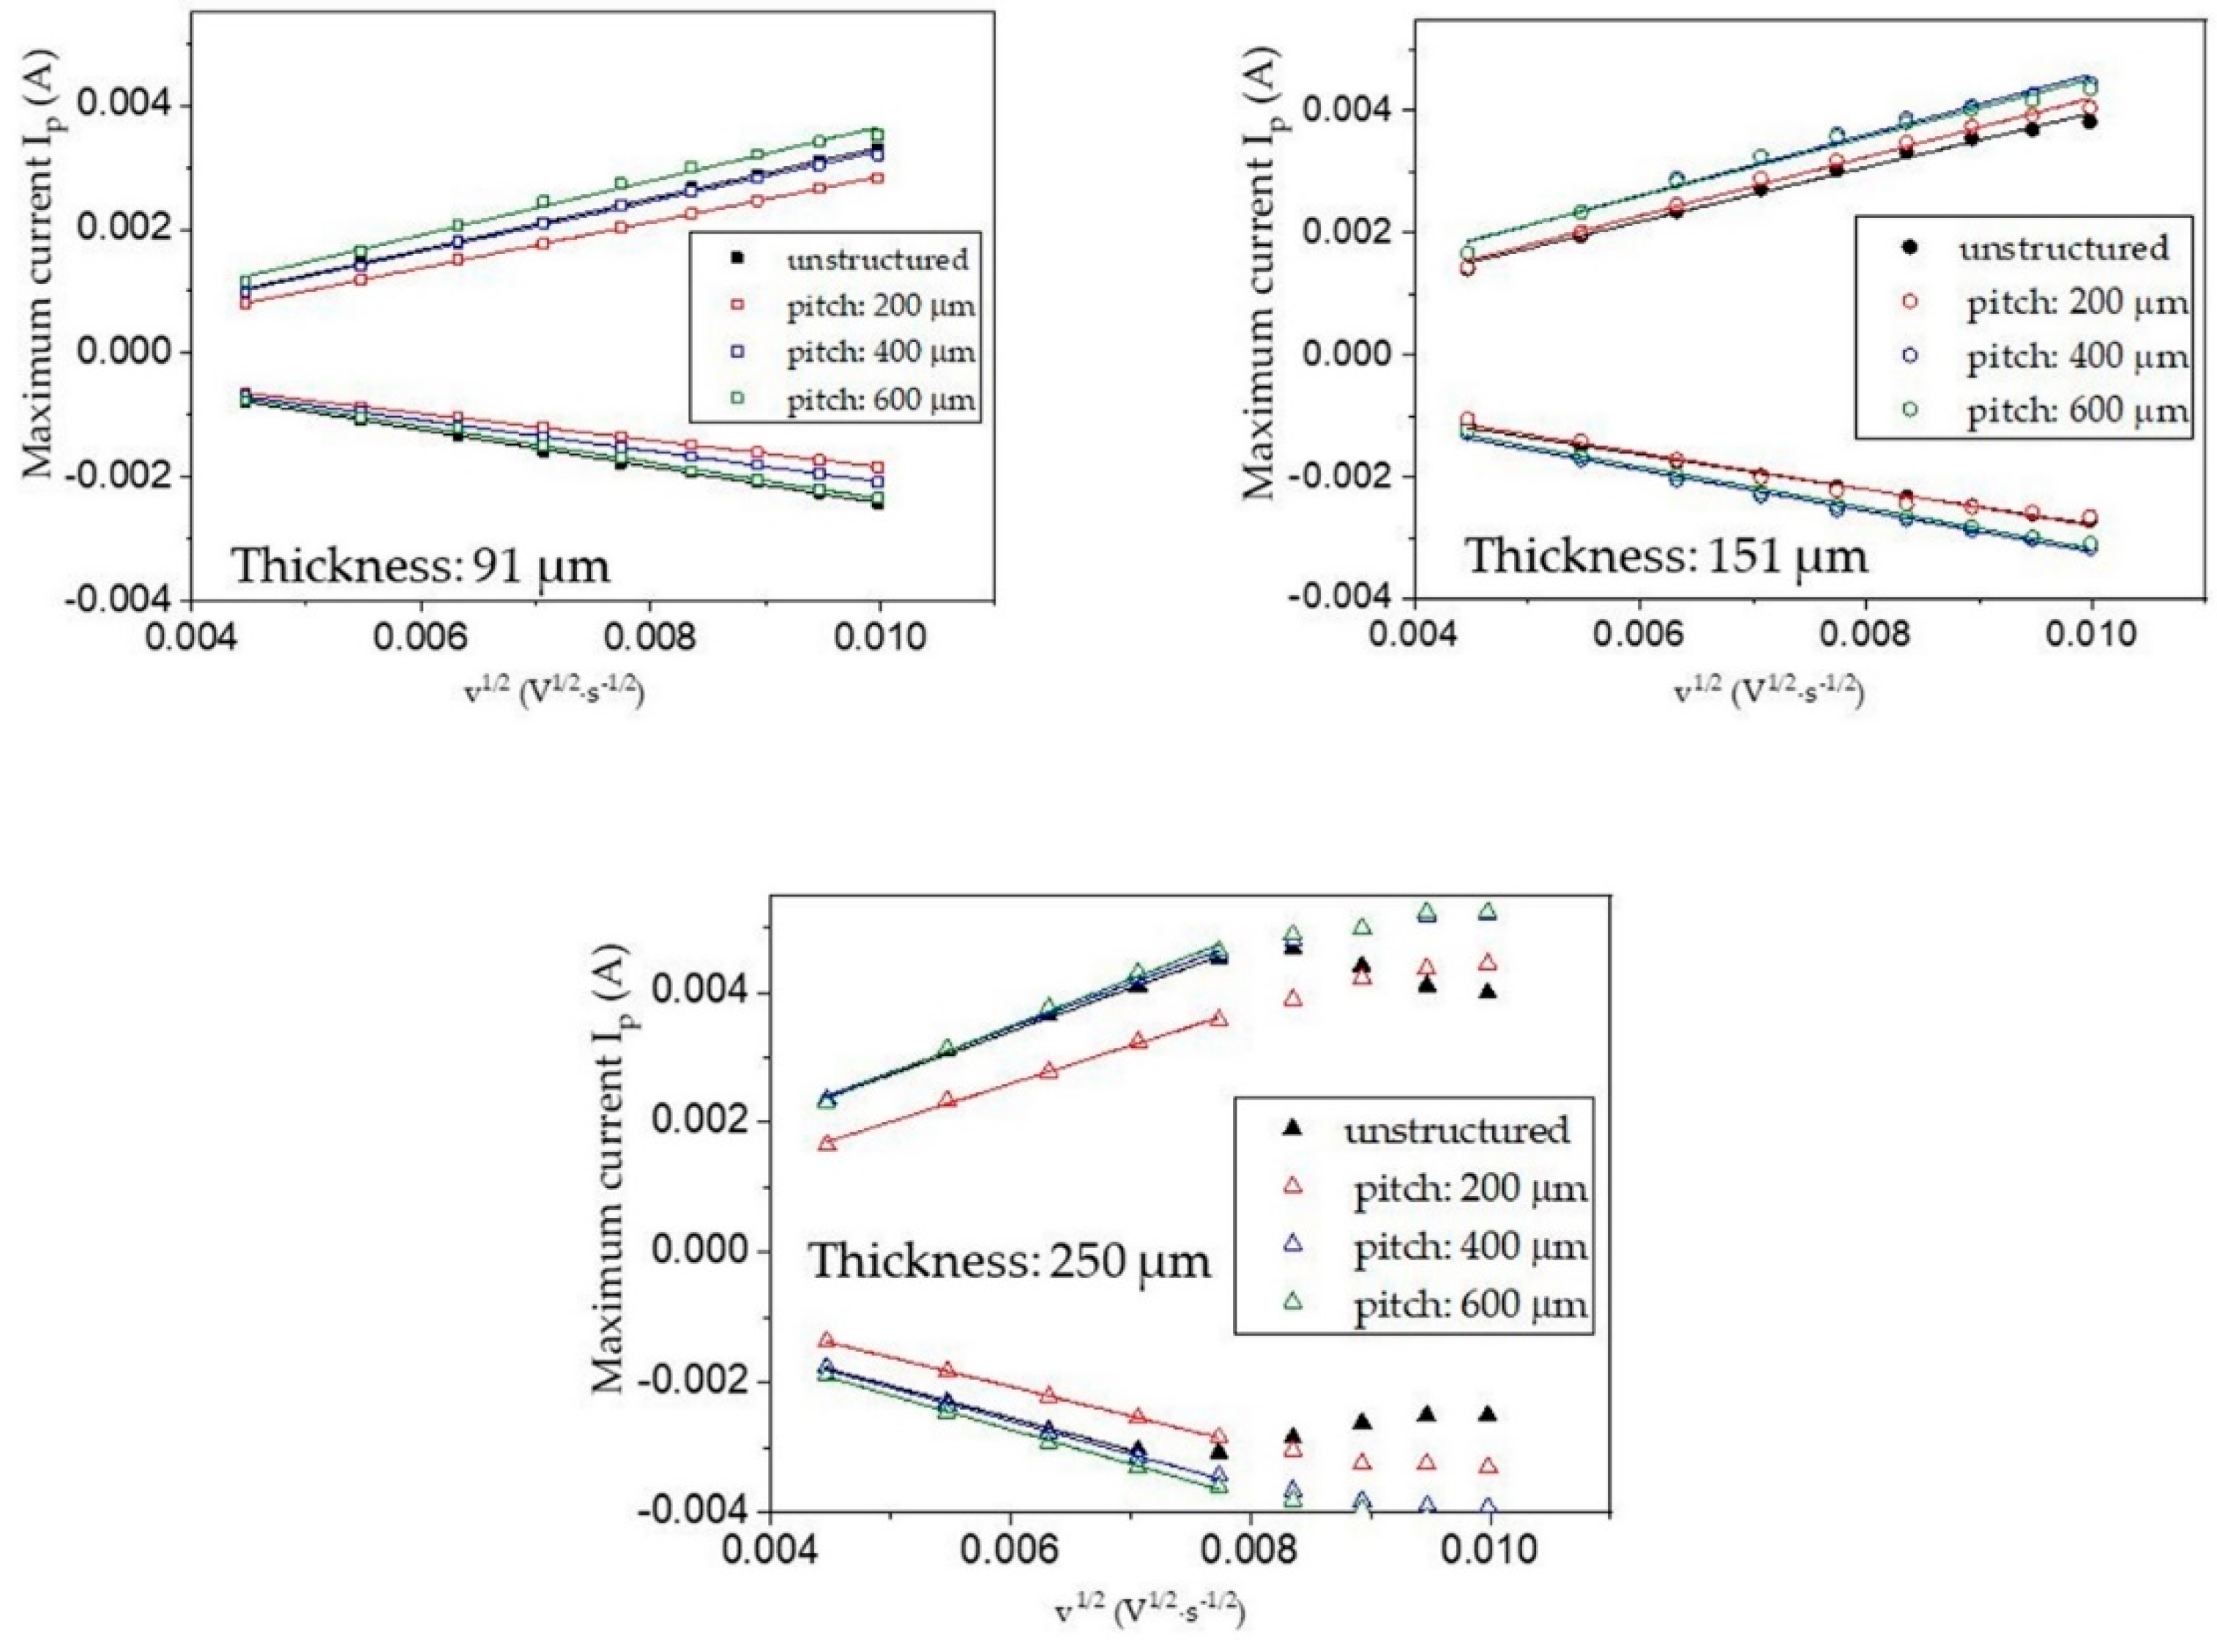
20]. Furthermore, CV is used to determine the chemical diffusion coefficient of lithium-ions (DCV) in cathode materials during charge and discharge process using the Randles–Sevcik equation [21]:
I p = 0 . 4463   ( F 3 R · T ) z 0 3 / 2 · A · C 0 · D C V 1 / 2 · v 1 / 2
In this equation, Ip is the maximum current from CV measurement during charge or discharge, F is Faraday’s constant, R is the gas constant, T is the absolute temperature, z0 is the number of transferred electrons, A is the electrode area, and C0 is the total amount of lithium-ions in an NMC 622 particle before delithiation. Since NMC 622 has a molar mass of 203.5 g/mol and a bulk density of 4.76 g/cm3, the Li concentration C0 was calculated to be 0.0234 mol/cm3. According to the study from Denis et al. [22], in order to calculate the chemical diffusion coefficient of lithium-ion in LiFeO4 (LFP), electrode area A in Equation (2) was substituted by 1/3 of the of the total Brunauer–Emmett–Teller (BET) surface area, because the lithium-ion diffusion path in LFP is one-dimensional. Since NMC 622 has a two-dimensional diffusion path for lithium-ion along (111) plane [23], the electrode area A is calculated as two-third of the total BET surface area for structured and unstructured electrodes. The BET surface equals the specific surface area multiplied by the mass of active material in the electrode, thus the electrode area is calculated with following equation:
A = A B E T · 2 3 = A s p e c · m a c t i v e · 2 3
The chemical diffusion coefficients of cells with different cathodes were calculated combining the Equations (2) and (3), as well as the slope from Figure 6, and are shown in Table 3. The diffusion coefficient of lithium-ions in NMC 622 electrode during discharge at room temperature varies from 2.7 × 10⁻¹³ cm2/s to 8.6 × 10⁻¹³ cm2/s. However, the values are lower compared to the diffusion coefficient acquired from galvanostatic intermittent titration technique (GITT) of 8 × 10⁻¹¹ cm2/s [24].
Table 3 shows that the diffusion coefficients of lithium-ions during charge process are higher comparing to discharge process, indicating that the during deintercalation, lithium-ions require less activation energy to diffuse from one octahedral site to the next site through an intermediate tetrahedral site [24]. The lithium-ion diffusivity in the NMC 622 electrode decreases with increasing electrode thickness, which corresponds to the deterioration of rate capability for thick electrodes. Although structured cathodes show higher discharge capacity at C/2 to 2C in galvanostatic measurement, the diffusion coefficients of structured and unstructured cathodes are at the same level (Table 3). However, it should be pointed out that the electrode area A can only be controversially discussed. In recent research from Smyrek et al., it was shown that the sidewalls of laser generated patterns play a dominant role regarding lithium-ion diffusion [14]. Therefore, it is justified to replace the electrode area A (Equation (3)) by the electrode surface-shell envelope, assuming that the direct contact area of active material to free liquid electrolyte provides the main contribution to lithium-ion diffusion kinetics. After laser structuring, the surface of electrode can expand 100–300%. The generated surface leads to a shortened diffusion path for lithium-ions inside the bulk electrode, and therefore improves energy at high power. In addition, the electrode wetting ability of laser structured electrodes with liquid electrolytes can be accelerated and become more homogeneous due to the capillary effect, which is a benefit regarding cell production costs and safety issues [25].

5. Conclusions

NMC 622 cathodes were assembled versus lithium using coin cell design. The influence of film thickness and laser structuring pattern on rate capability, as well as the diffusion coefficient of lithium-ions in electrodes were investigated. Galvanostatic measurements and cyclic voltammetry were applied to study the discharge capacity and energy density of the cells with structured and unstructured cathodes. An ultrafast laser with a wavelength of 1030 nm was used to generate line patterns down to the current collector in cathodes with film thicknesses of 91 µm to 250 µm. The pitch distance of line pattern was varied from 200 µm to 600 µm. Despite the mass loss due to the laser ablation of electrode material during laser processing, the cells containing structured cathodes with 200 µm pitch distance showed great improvement in specific capacity with discharge rates from C/2 to 3C. Comparing that to a cell with unstructured cathode, an increase of energy density from 50% to 300% was observed in galvanostatic measurements. At higher discharge rates of above 2C, the cells with 91 µm cathodes showed better electrochemical performance in terms of the volumetric energy density compared to cells with thicker cathode. Besides, volumetric energy density can be improved by increasing the electrode thickness at low C-rates (C/10 and C/5), due to a decrease of Al foil fraction inside the cathode. The increased surface area after laser processing provides new lithium diffusion pathways, which guarantees a high discharge capacity at elevated C-rates. However, a deterioration of energy density with increasing cathode thickness and increasing discharge rate was observed, which is due to the increase of internal resistance and the damage of the mechanical integrity of thick cathode material. Besides, the qualities of NMC 622 powder, such as particle sizes and purity, have impacts on the electrochemical performance, which were observed in the ongoing study using NMC 622 powder from another supplier. Cyclic voltammetry verifies that the chemical diffusion coefficient of lithium-ions in NMC 622 electrode decreases with increasing electrode film thickness. However, the diffusion coefficients of lithium-ions in structured and unstructured cathodes were almost the same. To explain the improved rate capability of structured cathodes, the expansion of the electrode’s surface must be taken into account. With line pattern, up to 400% surface expansion is applied to cathode, resulting in new diffusion paths for lithium-ions. The Ragone chart reveals a trade-off between power and energy for NMC 622 cathodes, and laser structuring shows an improvement of energy at higher power. Besides, the production cost of cells could be reduced, since less cathode sheets and other inactive components, such as separators and current collectors, are required for a 52-Ah automobile pouch cell with increasing electrode film thickness. Therefore, proper film thickness and laser structuring pattern should be selected related to the specific application-oriented demand. Thick electrodes (> 200 µm) without laser structuring are suitable for applications such as energy storage at low discharge rates of C/10 and C/5. While structured electrodes with thicknesses below 100 µm are more suitable for high-power (≥ 1000 W/L). Meanwhile, the combination of laser structuring and thick film electrode has potential in the automobile industry, where high power and high energy are simultaneously required.

Author Contributions

Conceptualization, P.Z. and W.P.; methodology, P.Z.; validation, H.J.S. and W.P.; investigation, P.Z.; resources, H.J.S. and W.P.; data curation, P.Z.; writing—original draft preparation, P.Z.; writing—review and editing, P.Z. and W.P.; supervision, W.P.

Funding

This research was funded by German Research Foundation (DFG), project No. 392322200.

Acknowledgments

We are grateful to our colleagues A. Reif, Y. Zheng, and H. Besser for their technical assistance and support with material and battery analyses. We acknowledge support by the KIT-Publication Fund of the Karlsruhe Institute of Technology. In addition, the support for laser materials processing by the Karlsruhe Nano Micro Facility (KNMF, http://www.knmf.kit.edu/), a Helmholtz research infrastructure at KIT, is gratefully acknowledged.

Conflicts of Interest

The authors declare no conflict of interest.

References

  1. Zubi, G.; Dufo-López, R.; Carvalho, M.; Pasaoglu, G. The lithium-ion battery: State of the art and future perspectives. Renew. Sustain. Energy Rev. 2018, 89, 292–308. [Google Scholar] [CrossRef]
  2. Placke, T.; Kloepsch, R.; Dühnen, S.; Winter, M. Lithium ion, lithium metal, and alternative rechargeable battery technologies: The odyssey for high energy density. J. Solid State Electrochem. 2017, 21, 1939–1964. [Google Scholar] [CrossRef]
  3. Noh, H.J.; Youn, S.; Yoon, C.S.; Sun, Y.K. Comparison of the structural and electrochemical properties of layered Li[NixCoyMnz]O2(x = 1/3, 0.5, 0.6, 0.7, 0.8 and 0.85) cathode material for lithium-ion batteries. J. Power Sources 2013, 233, 121–130. [Google Scholar] [CrossRef]
  4. Berckmans, G.; Messagie, M.; Smekens, J.; Omar, N.; Vanhaverbeke, L.; van Mierlo, J. Cost projection of state of the art lithium-ion batteries for electric vehicles up to 2030. Energies 2017, 10, 1314. [Google Scholar] [CrossRef]
  5. Van den Bossche, P.; Vergels, F.; van Mierlo, J.; Matheys, J.; van Autenboer, W. SUBAT: An assessment of sustainable battery technology. J. Power Sources 2006, 162, 913–919. [Google Scholar] [CrossRef]
  6. Zheng, H.; Li, J.; Song, X.; Liu, G.; Battaglia, V.S. A comprehensive understanding of electrode thickness effects on the electrochemical performances of Li-ion battery cathodes. Electrochim. Acta 2012, 71, 258–265. [Google Scholar] [CrossRef]
  7. Rakebrandt, J.H.; Smyrek, P.; Zheng, Y.; Seifert, H.J.; Pfleging, W. Laser processing of thick Li(NiMnCo)O2 electrodes for lithium-ion batteries. In Laser-Based Micro-and Nanoprocessing XI; International Society for Optics and Photonics: San Francisco, CA, USA, 2017. [Google Scholar]
  8. Mangang, M.; Seifert, H.J.; Pfleging, W. Influence of laser pulse duration on the electrochemical performance of laser structured LiFePO4 composite electrodes. J. Power Sources 2016, 304, 24–32. [Google Scholar] [CrossRef]
  9. Pröll, J.; Kim, H.; Piqué, A.; Seifert, H.J.; Pfleging, W. Laser-printing and femtosecond-laser structuring of LiMn2O4 composite cathodes for Li-ion microbatteries. J. Power Sources 2014, 255, 116–124. [Google Scholar] [CrossRef]
  10. Mueller, V.; Kaiser, R.; Poller, S.; Sauerteig, D. Importance of the constant voltage charging step during lithium-ion cell formation. J. Storage Mater. 2018, 15, 256–265. [Google Scholar] [CrossRef]
  11. Liu, X.; Du, D.; Mourou, G. Laser ablation and micromachining with ultrashort laser pulses. IEEE J. Quantum Electron. 1997, 33, 1706–1716. [Google Scholar] [CrossRef]
  12. Korte, F.; Serbin, J.; Koch, J.; Egbert, A.; Fallnich, C.; Ostendorf, A.; Chichkov, B.N. Towards nanostructuring with femtosecond laser pulses. Appl. Phys. A Mater. 2003, 77, 229–235. [Google Scholar]
  13. Peled, E. The electrochemical behavior of alkali and alkaline earth metals in nonaqueous battery systems—the solid electrolyte interphase model. J. Electrochem. Soc. 1979, 126, 2047–2051. [Google Scholar] [CrossRef]
  14. Smyrek, P.; Bergfeldt, T.; Seifert, H.J.; Pfleging, W. Laser-induced breakdown spectroscopy for the quantitative measurement of lithium concentration profiles in structured and unstructured electrodes. J. Mater. Chem. A 2019, 7, 5656–5665. [Google Scholar] [CrossRef] [Green Version]
  15. Zhang, S.S. The effect of the charging protocol on the cycle life of a Li-ion battery. J. Power Sources 2006, 161, 1385–1391. [Google Scholar] [CrossRef]
  16. Choi, S.S.; Lim, H.S. Factors that affect cycle-life and possible degradation mechanisms of a Li-ion cell based on LiCoO2. J. Power Sources 2002, 111, 130–136. [Google Scholar] [CrossRef]
  17. Wood, D.L., III; Li, J.; Li, C. Prospects for reducing the processing cost of lithium ion batteries. J. Power Sources 2015, 275, 234–242. [Google Scholar] [CrossRef] [Green Version]
  18. Singh, M.; Kaiser, J.; Hahn, H. A systematic study of thick electrodes for high energy lithium ion batteries. J. Electroanal. Chem. 2016, 782, 245–249. [Google Scholar] [CrossRef]
  19. Shaju, K.M.; Subba Rao, G.V.; Chowdari, B.V.R. Performance of layered Li(Ni1/3Co1/3Mn1/3)O2 as cathode for Li-ion batteries. Electrochim. Acta 2002, 48, 145–151. [Google Scholar] [CrossRef]
  20. Cao, H.; Zhang, Y.; Zhang, J.; Xia, B. Synthesis and electrochemical characteristics of layered LiNi0.6Co0.2Mn0.2O2cathode material for lithium ion batteries. Solid State Ion. 2005, 176, 1207–1211. [Google Scholar] [CrossRef]
  21. Levi, M.D.; Salitra, G.; Markovsky, B.; Teller, H.; Aurbach, D.; Heider, U.; Heider, L. Solid-State Electrochemical Kinetics of Li-Ion Intercalation into Li1-xCoO2: Simultaneous Application of Electroanalytical Techniques SSCV, PITT, and EIS. J. Electrochem. Soc. 1999, 146, 1279–1289. [Google Scholar] [CrossRef]
  22. Denis, Y.W.; Fietzek, C.; Weydanz, W.; Donoue, K.; Inoue, T.; Kurokawa, H.; Fujitani, S. Study of LiFePO4 by cyclic voltammetry. J. Electrochem. Soc. 2007, 154, A253–A257. [Google Scholar]
  23. Orman, H.J.; Wiseman, P.J. Cobalt (III) lithium oxide, CoLiO2: Structure refinement by powder neutron diffraction. Acta Crystallogr. Sect. C Cryst. Struct. Commun. 1984, 40, 12–14. [Google Scholar] [CrossRef]
  24. Cui, S.; Wei, Y.; Liu, T.; Deng, W.; Hu, Z.; Su, Y.; Li, H.; Li, M.; Guo, H.; Duan, Y. Optimized Temperature Effect of Li-Ion Diffusion with Layer Distance in Li(NixMnyCoz)O2 Cathode Materials for High Performance Li-Ion Battery. Adv. Energy Mater. 2016, 6, 1501309. [Google Scholar] [CrossRef]
  25. Pfleging, W.; Pröll, J. A new approach for rapid electrolyte wetting in tape cast electrodes for lithium-ion batteries. J. Mater. Chem. A 2014, 2, 14918–14926. [Google Scholar] [CrossRef]
Figure 1. Schematic view of electrode design and laser structuring process.
Applsci 09 04067 g001
Figure 2. Cross-sectional view of Li(Ni0.6Mn0.2Co0.2)O2 (NMC 622) cathodes with different film thicknesses (pitch distance: 200 µm).
Applsci 09 04067 g002
Figure 3. SEM images of laser structured NMC 622 cathodes with 200 µm pitch distance and a film thickness of 91 µm.
Applsci 09 04067 g003
Figure 4. Specific discharge capacity of cells containing (a) 91 µm, (b) 151 µm, and (c) 250 µm thick electrodes; and (d) the discharge capacity of cells with different cathode thicknesses and 200 µm pitch distance at different C-rates.
Applsci 09 04067 g004
Figure 5. CV analyses of cells containing unstructured cathodes and structured cathodes with different pitch distances (film thicknesses: 91 µm and 250 µm).
Applsci 09 04067 g005aApplsci 09 04067 g005b
Figure 6. Comparison of the maximum current in relation to the square root of the scan rate for cells containing unstructured and structured cathodes with different thicknesses.
Applsci 09 04067 g006
Figure 7. (a) Ragone plots for cells containing cathodes with different thicknesses, and (b) the increase of volumetric energy density of cells with structured cathodes in comparison to cells with unstructured cathodes with the same thickness at different C-rates.
Applsci 09 04067 g007
Table 1. Parameters of Li(Ni0.6Mn0.2Co0.2)O2 (NMC 622) cathodes.
Pitch Distance (µm)Thickness as Deposited (µm)Thickness after Calendaring (µm)Final Thickness without Al Foil (µm)Porosity (%)Active Mass Loading (mg/cm2)Mass Loss (%)
unstructured141 ± 1111 ± 39136.121.7 ± 0.1-
200141 ± 1111 ± 391-18.5 ± 0.314.1± 1.0
400141 ± 1111 ± 391-20.3 ± 0.26.6 ± 0.9
600141 ± 1111 ± 391-21.0 ± 0.23.4 ± 0.9
unstructured201 ± 2171 ± 315136.733.8 ± 0.2-
200201 ± 2171 ± 3151-31.2 ± 0.57.7 ± 1.9
400201 ± 2171 ± 3151-32.2 ± 0.74.7 ± 1.7
600201 ± 2171 ± 3151-32.7 ± 0.43.3 ± 1.4
unstructured305 ± 2270 ± 425036.056.7 ± 0.2-
200305 ± 2270 ± 4250-51.7 ± 0.28.8 ± 2.1
400305 ± 2270 ± 4250-54.2 ± 1.04.4 ± 1.9
600305 ± 2270 ± 4250-54.7 ± 0.83.5 ± 1.9
Table 2. The total area and quantity of NMC 622 cathodes required to fabricate a 52-Ah pouch cell.
Pitch Distance (µm)Final Thickness without Al Foil (µm)Areal Capacity (mAh/cm2)Area of Cathodes for a 52-Ah Pouch Cell 1 (m2)Number of the Cathodes (21 cm × 24 cm)
unstructured913.60.7314
200913.10.8517
400913.30.7815
600913.50.7515
unstructured1515.60.479
2001515.10.5110
4001515.30.4910
6001515.40.4810
unstructured2509.40.286
2002508.50.306
4002508.90.296
6002509.00.296
1 The NMC 622 cathodes were assumed to be double-coated in the calculations.
Table 3. Chemical diffusion coefficients of lithium-ion in unstructured and structured NMC 622 cathodes obtained from CV.
Thickness (µm)Pitch Distance (µm)∆IP/∆v1/2 [A∙s1/2∙V−1/2]DCV [cm2/s]
ChargeDischargeChargeDischarge
91-0.41−0.301.62 × 10−128.65 × 10⁻¹³
912000.37−0.221.84 × 10−126.52 × 10⁻¹³
914000.41−0.251.85 × 10−126.90 × 10⁻¹³
916000.44−0.291.94 × 10−128.43 × 10⁻¹³
151-0.45−0.296.52 × 10−132.71 × 10⁻¹³
1512000.48−0.308.60 × 10−133.36 × 10⁻¹³
1514000.50−0,348.10 × 10−133.70 × 10⁻¹³
1516000.49−0.347.05 × 10−133.38 × 10⁻¹³
250-0.68−0.505.23 × 10−132.83 × 10⁻¹³
2502000.59−0.454.72 × 10−132.75 × 10⁻¹³
2504000.64−0.494.93 × 10−132.91 × 10⁻¹³
2506000.67−0.505.37 × 10−132.96 × 10⁻¹³

