Article

Molecular Detection of Cordycepin-Induced HeLa Cell Apoptosis with Surface-Enhanced Raman Spectroscopy

1
Shanghai Key Laboratory of Modern Optical Systems, College of Optical-Electrical and Computer Engineering, University of Shanghai for Science and Technology, Shanghai 200093, China
2
Shanghai Institute of Intelligent Science and Technology, Tongji University, Shanghai 200092, China
*
Author to whom correspondence should be addressed.
Appl. Sci. 2019, 9(19), 3990; https://doi.org/10.3390/app9193990
Submission received: 15 August 2019 / Revised: 7 September 2019 / Accepted: 19 September 2019 / Published: 24 September 2019
(This article belongs to the Section Applied Biosciences and Bioengineering)

Abstract

:
Cordycepin, extracted from the medicinal mushroom Cordyceps militaris, was shown to induce cancer cell apoptosis. Yet its anticancer function was limitedly evaluated, and the mechanism was not entirely elucidated. In this study, we demonstrated the effectiveness of cordycepin in inducing apoptosis in HeLa cells and investigated its apoptosis-inducing mechanism through label-free surface-enhanced Raman spectroscopy (SERS). SERS spectral changes revealed detailed molecular changes in both early and late stages of apoptosis. Importantly, SERS characteristic peaks at 805 and 1438 cm−1, which were assigned to RNA, continued to decrease significantly from early to late apoptosis stages. It indicated that cordycepin induced HeLa cell apoptosis mainly through interfering with RNA production, potentially by restraining the translation of RNA encoding ribosomal proteins. Meanwhile, apoptotic cells and their apoptosis stage could be easily differentiated by SERS-based principal component analysis (PCA). Furthermore, the morphological changes of early and late-stage apoptotic cells were illustrated by differential interference contrast and fluorescence microscopic imaging. Therefore, the natural ingredient, cordycepin, could serve as a promising anticancer candidate. Our biological model of cell apoptosis in vitro, the non-invasive and rapid SERS technique, combined with PCA analysis, could be a powerful tool in the investigation of cell apoptosis mechanisms and anticancer drug screening.

1. Introduction

Every year, approximately 527,600 women are newly diagnosed with cervical cancer, and 265,700 people die of cervical cancer [1]. Many efforts have been made to find or develop efficient anticancer drugs to treat cervical cancer and promote the survival rate [2]. The anticancer effect and mechanism of drugs were usually investigated through their performance in inducing cancer cell apoptosis [3,4,5]. Therefore, cervical cancer cells, i.e., HeLa cells, were widely used in drug-induced apoptosis studies to evaluate the anticancer effects and to investigate the anticancer mechanism of a drug or compound [6,7,8]. Recently, extracting active anticancer compounds from natural substances has attracted much attention due to their simple composition, strong stability, high safety, and low irritation [9,10].
Cordycepin (3’ deoxyadenosine), extracted from the Chinese traditional medicinal mushroom, Cordyceps militaris, is an adenosine analogue [11]. Cordycepin has been shown to interfere with biochemical and molecular processes such as purine biosynthesis [11,12,13], DNA/RNA synthesis [14], and mTOR (mammalian target of rapamycin) signaling transduction [15]. To date, the anticancer function of cordycepin was reported in several types of cancers, including human colorectal cancer [16], breast cancer [17], human leukemia [18], thyroid carcinoma [19], glioma [20], and human ovarian cancer [21]. Based on previous reports, cordycepin possibly induces apoptosis through regulating the expression of various proteins, inhabiting mRNA polyadenylation and/or reducing mitochondrial membrane potential [16,17,18,19,20,21]. However, the mechanism of cordycepin-induced cancer cell apoptosis is still not completely clear and remains to be elucidated before using it clinically.
Apoptosis, or programmed cell death, is an active gene regulation process that plays a crucial role in the growth and development of organisms and the removal of damaged cells [22]. Many anticancer drugs play a therapeutic role by inducing tumor cell apoptosis [23,24]. In general, cells undergo specific characteristic changes during apoptosis. In the early stage, the cellular membrane shrinks, and the organelles are more tightly packed; in the late stage, the bond of DNA breaks, chromatin condensation and apoptotic bodies appear [25]. In correspondence, the contents of proteins and lipids as well as the concentration of nucleic acids and RNA may also change during cell apoptosis. Accurate measurement of these contents will provide insights in revealing the mechanisms in cell apoptosis.
Cell apoptosis is often investigated using flow cytometry [26], fluorescence microscopy [27], electron microscopy [28], DNA electrophoresis [29], MTT (3-(4,5-dimethylthiazol-2-yl)-2,5-diphenyltetrazolium bromide) [30], and TUNEL (terminal deoxynucleotidyl transferase dUTP nick end labeling) [31], etc. These approaches are effective, yet they usually include invasive procedures (e.g., cellular fluorescent labeling or cell fixation), which greatly limit the applications in live cells and longitudinal measurements [32]. Furthermore, many approaches only display structural appearance or identify the degradation of a single product and are not able to provide detailed changes in various contents in the cells at the same time. Raman spectroscopy, on the other hand, is a rapid, non-invasive technique that provides fingerprint information about the molecular structures of various contents by measuring the vibrational mode of molecules at once [33]. Raman spectroscopy has the characteristics of high-accuracy, high-sensitivity, non-invasiveness and real-time operation. It maintains the integrity and function of cells and simplifies the experimental procedure [34,35]. Conventional Raman spectroscopy suffers from weak signals, especially in the complex biological environment. Yet, the emergence of surface-enhanced Raman spectroscopy (SERS) has provided a solution to this problem [36]. SERS has become a powerful spectral analytical method since Raman signals can be enhanced up to 1014~1015 times when light, molecules, and metal nanoparticles interact, and even enable single cell detection [37]. SERS was used to study the structure of RNA bases adsorbed on the surface of silver nanowires [38]. Researchers also investigated the structural changes of different proteins based on the nanostructure SERS substrate [39]. Various SERS-active nanomaterials were synthesized for nucleic acids sensing applications [40]. Therefore, SERS is very promising in revealing the molecular mechanism involved in drug-induced cancer cell apoptosis.
In this study, we demonstrated the effectiveness of cordycepin in inducing apoptosis in HeLa cells and investigated its apoptosis-inducing mechanism through SERS. Experimental groups treated with cordycepin for 12 h and 48 h were used to study morphological and biomechanical changes in the early apoptosis stage and late apoptosis stage respectively. Our results showed that cordycepin potentially induced HeLa cell apoptosis through restraining the translation of RNA encoding ribosomal proteins. Furthermore, control cells, early-stage apoptotic cells, and late-stage apoptotic cells were easily differentiated through the SERS-based principal component analysis method. To our knowledge, there has been no report on the effect of cordycepin-induced HeLa cell apoptosis from the point of view of spectroscopy.

2. Materials and Methods

2.1. Cell Culture and Drug Treatment

HeLa cells were obtained from Nanjing Keygen Biotech Co., Ltd. (Nanjing, Jiangsu, China), and maintained in culture medium containing minimum essential medium (MEM, Nanjing Keygen Biotech Co., Ltd., Nanjing, Jiangsu, China), 10% fetal bovine serum (Hangzhou Sijiqing Biological Engineering Materials Co., Ltd., Hangzhou, Zhejiang, China), and 1% anti-double (penicillin and streptomycin, Holly Corp, Russia) in the cell incubator under 37 and 5% CO2. Cells were initially seeded at a density of 0.3 × 10⁶ cells/mL and then allowed to grow for three days to a density of 5 × 10⁶ cells/mL. Then 50 μL of cordycepin (1.0 mg/L, Beijing Century Aoke Biotech Co., Ltd., Beijing, China) was added to the HeLa cell medium (approximately 2 mL) to induce cell apoptosis. Three experimental groups were formed. Hela cells cultured with cordycepin for 12 h were used to study the early apoptosis stage of cordycepin treatment and were referred to as “cordycepin-12 h group”. HeLa cells cultured with cordycepin for 48 h were used to study the late apoptosis stage of cordycepin treatment and were referred to as “cordycepin-48 h group”. For comparison, HeLa cells cultured without drug treatment were used as the control group.

2.2. Differential Interference Contrast (DIC) and Fluorescence Microscopic Imaging

Differential interference contrast (DIC) and fluorescence microscopic imaging were used in the study for observing the morphology and evaluating the viability of the cells with and without cordycepin treatment. First, three experimental groups of HeLa cells were acquired and washed with phosphate buffered saline solution (PBS) three times to remove the cell culture medium. Propidium iodide (PI, Beyotime Institute of Biotechnology, Haimen, Jiangsu, China), a red-fluorescent nuclear staining dye, was used to stain to HeLa cells under 37 for 15 min. The samples were then observed and imaged under a spinning disk confocal microscopy system (Dragonfly200, Andor Technology Ltd., Belfast, Ireland). Both DIC images and fluorescence images were acquired using this system.

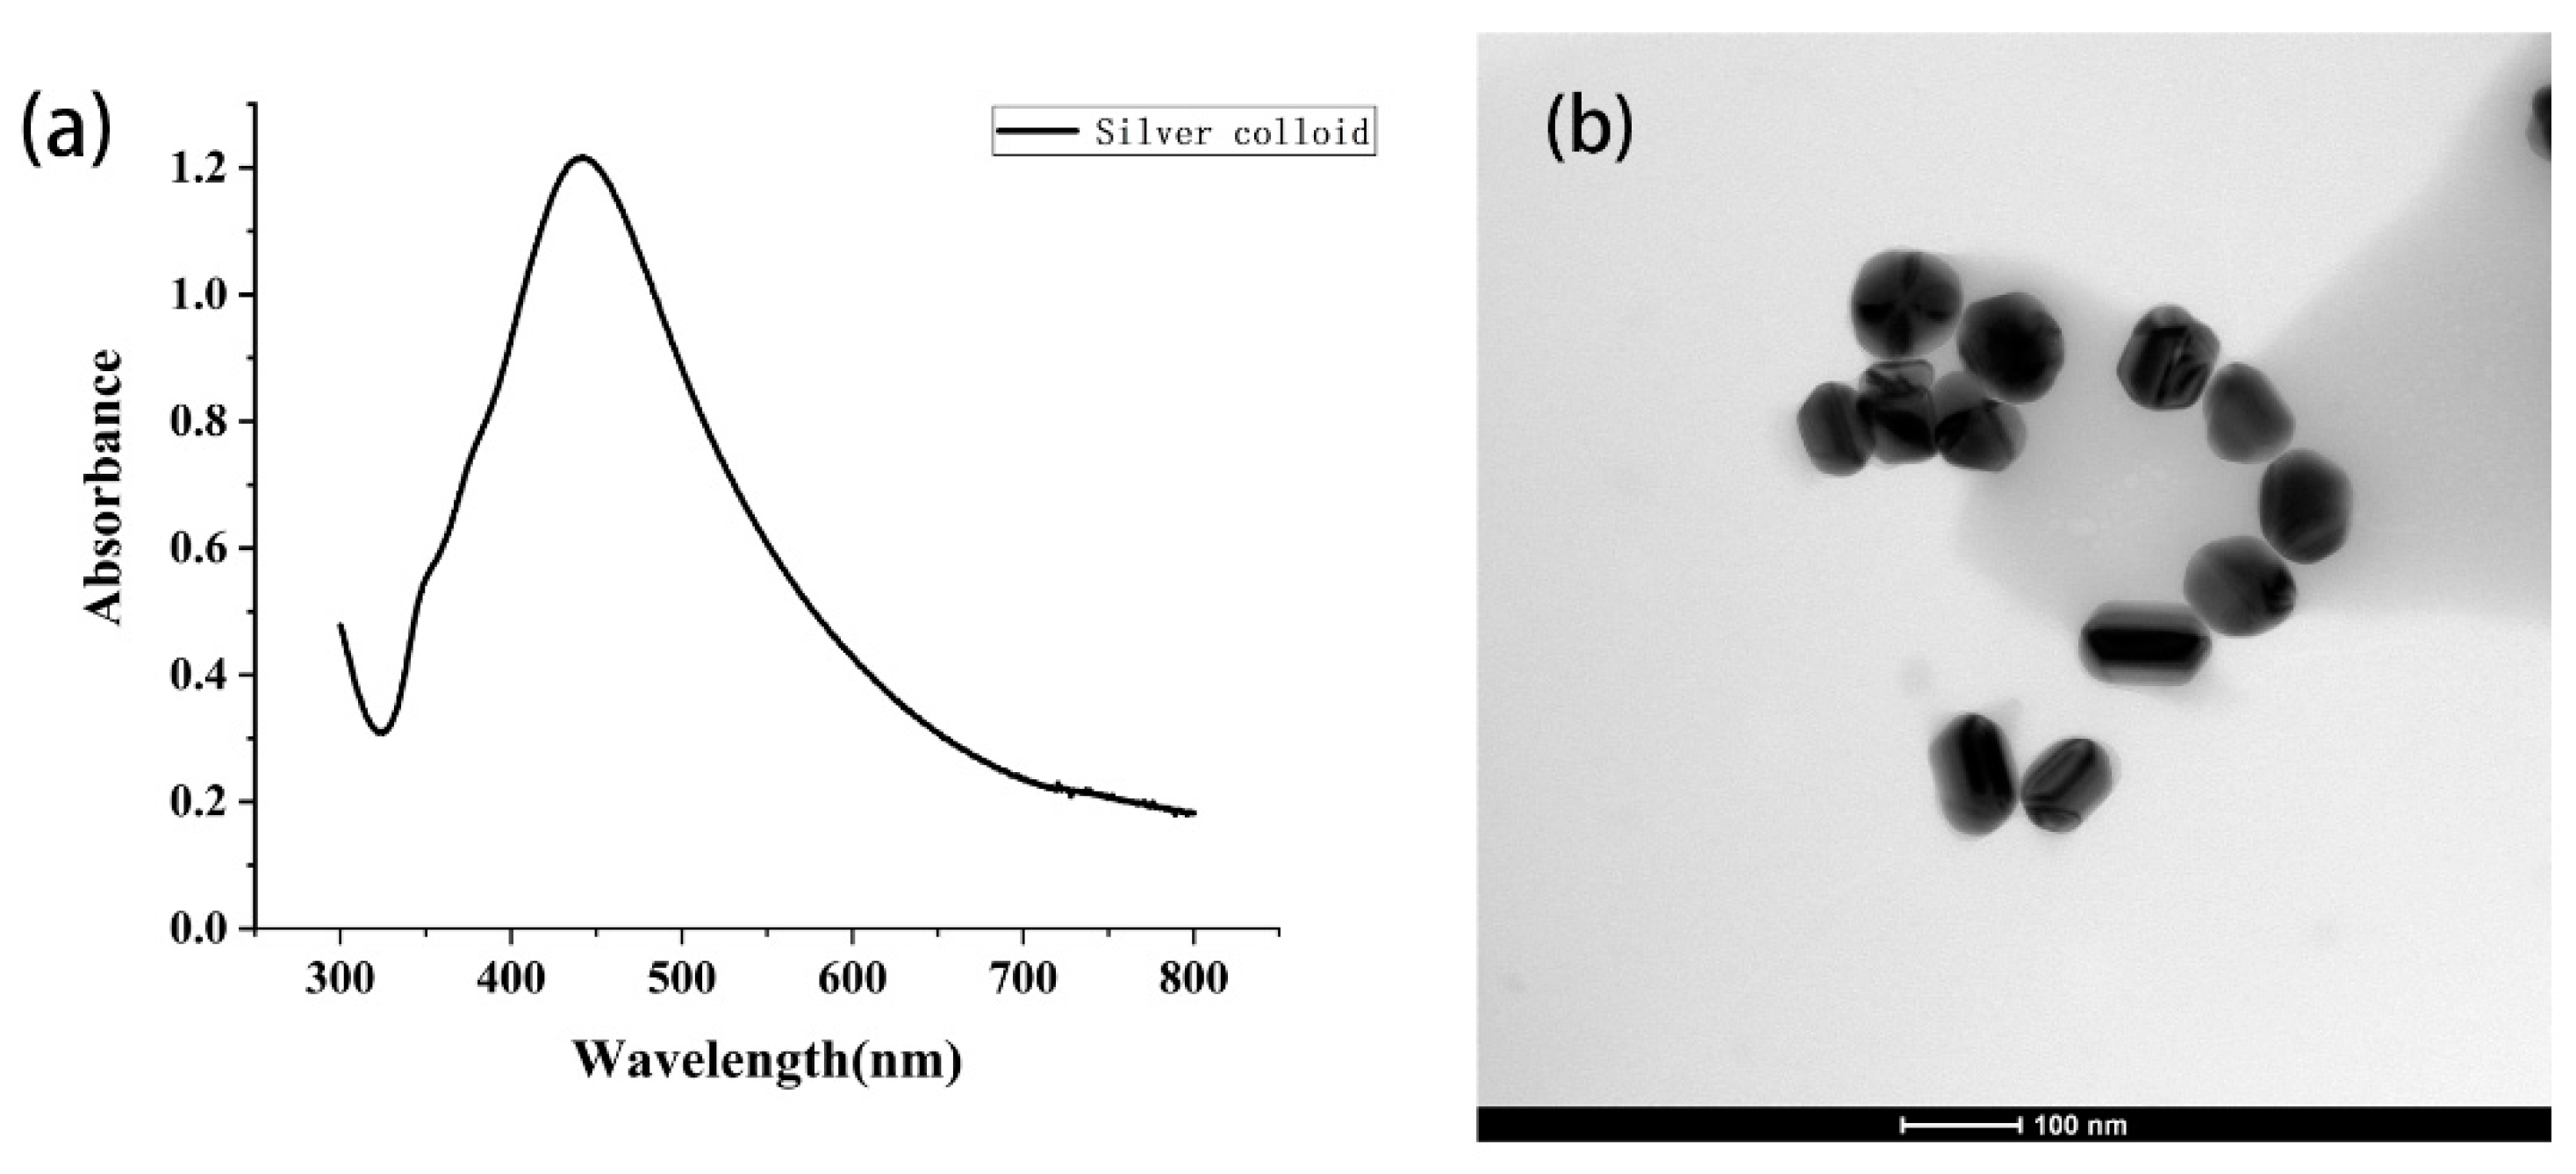
2.3. SERS Measurement and Analysis

The SERS substrate used in this study was silver colloid, which was prepared based on a classical sodium citrate reduction method [41]. First, 100 mL of 10−3 mol/L silver nitrate solution (Carbon Twelve Regent, Shenzhen, China) and 2.5 mL sodium citrate solution (Macklin Regent, Shanghai, China) with a mass fraction of 1% were prepared. Then, the silver nitrate solution was heated and stirred continuously until boiling. The sodium citrate solution was added, and the solution was boiled for 1 h. The colloidal solution was kept away from light at room temperature. The UV–vis spectrum and a transmission electron microscope (TEM, FEI, Hillsboro, OR, U.S.) image of the silver colloid is displayed in Figure 1. More TEM images and the size distribution measurement of the silver colloid are reported in the Supplementary Materials (Figures S1 and S2). The averaged silver nanoparticle size was measured to be 64 nm.
Throughout the study, SERS spectra of individual cells were collected with a confocal Raman spectrometer (LabRAM Xplora Plus, HORIBA, France) equipped with a 50× objective, a charge-coupled device (CCD) camera, and a 638 nm laser with around 10 mW power at sample. The measuring range of the spectrometer was 400–1700 cm−1 with a spectral resolution of 1 cm−1. The integration time for acquiring each SERS spectrum was 5 s. Before collecting the SERS spectra of cells, 2 μ L silver colloid was dropped into the culture dishes and the cells were re-incubated for 3 h in culture medium containing the silver colloid. Then, the cells were washed in PBS three times and 20 independent cells from each of the groups (control group, cordycepin-12 h group and cordycepin-48 h group) were measured with the SERS respectively. Therefore, a total of 60 spectra were obtained.
Necessary postprocessing steps were applied to optimize and analyze the acquired SERS spectra. First, the narrow cosmic rays were removed, and the baseline of the individual spectrum was corrected with a fifth-order polynomial fitting program to correct the fluorescence background. Both operations were performed in LabSpec 6 software (HORIBA Scientific, Paris, France, 2017). Next, all SERS spectra were smoothed by the nine-point Savitzky–Golay method and normalized based on the highest peaks. The 20 spectra from each of the experimental groups (cordycepin-12 h group and cordycepin-48 h group) were averaged to acquire a single averaged spectrum, which was then used to perform subtractions with the averaged spectrum of the control group. To further elucidate apoptosis-induced changes over time, intensity ratios between the apoptotic groups (cordycepin-12 h group, cordycepin-48 h group) and the control group were calculated at several important characteristic peaks. The results were displayed in a bar chart. Furthermore, principal component analysis (PCA) was performed on all 60 acquired spectra. The spectra were normalized. No smoothing was applied. PCA is a multivariate statistical analysis method that converts multidimensional variables in high-dimensional space into a small number of comprehensive new variables, so as to realize signal feature extraction and analysis [42]. In this study, PCA was used to differentiate the cordycepin-12 h group, the cordycepin-48 h group, and the control group.
In addition, the spectrum of cordycepin was measured using SERS (Supplementary Figure S3). It served as the proof that signal changes in different cell groups were not from the enhanced signals of cordycepin. Experiments were conducted to verify that the SERS substrate, i.e., silver nanoparticles, did not induce HeLa cell apoptosis. The methods, results, and figures (Supplementary Figures S4 and S5) of this experiment are presented in supplementary materials.

3. Results and Discussion

3.1. Morphological Changes of Cells Undergoing Apoptosis

Figure 2 presents the DIC microscopic images and fluorescence images of three groups of cells. DIC is one of the most widely used techniques in imaging the mostly transparent, unstained cells because it is able to enhance contrast effectively. As shown in Figure 2a,d,g, it was observed that the appearance of HeLa cells treated with cordycepin for 12 h or 48 h was significantly different from the control cells. The control cells were full in shape with clear cell boundaries while cells from the cordycepin treatment groups had irregular shapes and were almost flat. Cells with 48 h cordycepin treatment exhibited even less distinct cell boundaries but more distinct nucleus boundaries, which were not shown in the control group or the cordycepin-12 h group. This indicated that the cell membranes further shrunk, the density of cytoplasm increased, and the nucleoplasm condensed. Fluorescence images of PI stained cells provided a more direct proof of cordycepin-induced apoptosis. PI is a fluorescence dye that binds to DNA in the cell nucleus, thus, it is widely used to evaluate cell viability in the apoptosis process [43]. As shown in Figure 2b, PI was not present in the control cells, representing that PI was not permeable to HeLa cells without cordycepin treatment and that the control cells were viable. In contrast, PI staining was well observed in the cell groups treated with cordycepin for 12 h or 48 h (Figure 2e,h). This indicated that PI dye molecules penetrated through the cell membranes of cells from the cordycepin-12 h group and the cordycepin-48 h group. Fluorescence signals were produced by the interaction of the dye with the nucleus of cells, it was therefore demonstrated that HeLa cells treated with cordycepin no longer retained membrane integrity and could be interpreted as undergoing apoptosis. Furthermore, the fluorescence intensities of the cordycepin-48 h group were lower than the intensities of the cordycepin-12 h group. It was possibly due to the fact that nucleic acid content gradually decreased as the apoptosis progressed to a later stage, causing the stainability of the nucleus to decrease. In summary, the combined DIC and fluorescence microscopy images served as an effective evaluation for cordycepin-induced apoptosis and provided both morphological and biochemical changes in the cells during apoptosis.

3.2. Analysis of SERS Spectra

SERS spectral changes between the control group and the cordycepin-12 h group are shown in Figure 3. Trace (a) represents the average SERS spectra of the control group and trace (b) is the average SERS spectra of the cordycepin-12 h group. The corresponding spectral difference between the cordycepin-12 h group and the control group is shown as trace (c). The SERS spectral changes between these two groups represent content changes in the early stage of apoptosis. From Figure 3 trace (c), obvious differences between the cordycepin-12 h group and the control group at SERS characteristic peaks 534, 640, 746, 805, 830, 998, 1145, 1438, and 1546 cm−1 can be clearly observed. The spectral peak assignments are listed in Table 1. Compared to control cells, SERS peak intensities in apoptotic cells showed increases at 534, 746, and 1145 cm−1, which could be assigned to A ring (adenine ring) breath, T ring (thymine ring) breath, and deoxyribose phosphate, respectively. This indicated that nucleic acid concentration had increased in the early stage of cordycepin-induced apoptosis. On the other hand, peaks at 640, 805, 830, 998, 1438, and 1546 cm−1 exhibited decreases in intensities in apoptotic cells compared to control cells. A shoulder peak appeared at 830 cm−1, which was related to the stretching vibration of O–P–O asymmetric bond, also decreased in the cordycepin-12 h group. The peak at 640 cm−1 was assigned to the C–C twist of tyrosine, the peak at 998 cm−1 could be assigned to the symmetric ring breathing mode of phenylalanine, and the peak at 1546 cm−1 was assigned to Amide Ⅱ. The intensity decreases at these characteristic peaks revealed that the contents of proteins and lipids had decreased in the early stage of cordycepin-induced apoptosis. At the same time, the peaks at 805 and 1438 cm−1, which were assigned to RNA, also decreased, indicating that the RNA concentration began to decline in the early stage of apoptosis.
Figure 4 shows SERS spectral changes between the control group and the cordycepin-48 h group. The averaged SERS spectra of the control group are shown in trace (a), the cordycepin-48 h group is shown in trace (b), and the spectral differences between them is in trace (c). This figure exhibits the content changes in the late stage of cordycepin-induced apoptosis. Spectral differences at characteristic peaks 534, 746, and 1145 cm−1 revealed intensity decreases for nucleic acid while spectral changes at peaks 640, 830, 998, and 1546 cm−1 revealed intensity increases for proteins and lipids due to cordycepin-induced apoptosis at 48 h. Meanwhile, it was observed that peaks at 805 and 1438 cm−1, which were assigned to RNA, encountered significant decreases in spectral intensity in the late stage of apoptosis. Figure S6 in the Supplementary Materials shows the averaged spectra and the difference spectra of all three groups in one graph.
A more detailed comparison among cells from the control group, the cordycepin-12 h group, and the cordycepin-48 h group at important characteristic SERS peaks is shown in Figure 5. It was clear that prominent peak intensity changes at 534, 640, 746, 830, 998, 1145, and 1546 cm−1 in the late stage of apoptosis were different from those of the early stage of apoptosis. Peaks at 805 and 1438 cm−1 were shown to encounter continued decreases from the early stage of apoptosis to the late stage of apoptosis, indicating a progressing loss of the RNA content.

3.3. Principal Component Analysis of SERS Spectra

Furthermore, principal component analysis (PCA) was employed to distinguish cells from different experimental groups. Figure 6 shows the scores of two principal components (PCs), PC1 and PC2, calculated from SERS spectra of 20 cells with no drug treatment, 20 cells treated with cordycepin for 12 h, and 20 cells treated with cordycepin for 48 h. It was observed that three clusters were easily separated by PC1 and PC2, which possessed the contribution accounts of 73.9% and 16.7%, respectively. The variance of PC1 and PC2 were 1.71 and 0.28, respectively. The main discriminant was the PC1 score, where the control group had the highest scores while the cordycepin-48 h had the lowest scores. The PCA distribution area of the cordycepin-12 h group and the cordycepin-48 h group were larger than that of the control group. It indicated that the individual differences in the cordycepin-12 h group and the cordycepin-48 h group were more obvious, and the uniformity across cellular molecules was slightly worse than that of the control group. The results demonstrated that the control group, the cordycepin-12 h group, and the cordycepin-48 h group could be easily distinguished by SERS-based PCA.

3.4. Discussion

Our study demonstrated that cordycepin was able to induce apoptosis in HeLa cells, and morphological and biochemical changes were presented for early and late-stage cordycepin-induced apoptosis. In the early stage, the concentration of nucleic acids was increased, and proteins and lipid contents were decreased (Figure 5). These results were consistent with previously reported changes in general cell apoptosis mechanisms [44]. For example, in the early stage of apoptosis, DNA transcription started, explaining the increase of nucleic acids concentration [45]. Protein synthesis was inhibited, which, therefore, explained the decrease of protein contents [45,46] On the other hand, the decrease of RNA concentration was not a commonly reported phenomenon, instead, it was more specifically involved in the mechanisms of certain apoptosis inducers [45]. The decreased RNA potentially resulted from inhibited synthesis of completed ribosomal and ribosomal precursor RNA through restraining the translation of RNA encoding ribosomal proteins in the early stage of apoptosis [47,48]. In the late stage of apoptosis, the nucleic acid concentration was decreased, while protein and lipid concentrations were increased (Figure 5). These changes could be explained by highly fragmented cellular nucleus and apoptotic body formation [49]. Furthermore, RNA continued to decrease, explained by the widespread RNA decay due to the shutdown of translation of RNA encoding ribosomal proteins in the late stage of apoptosis [48,50]. Therefore, SERS results supported that cordycepin induced HeLa cell apoptosis through inhibiting RNA synthesis.

4. Conclusions

This study presented structural and biochemical changes in cordycepin-induced HeLa cell apoptosis and investigated its apoptosis-inducing mechanism. DIC and fluorescence microscopic imaging was used to demonstrate the effectiveness of cordycepin in inducing HeLa cell apoptosis, and to illustrate the morphological changes of cells undergoing apoptosis. SERS was used to reveal the detailed biochemical changes, such as nucleic acid, proteins, lipids, RNA, etc. Specifically, SERS characteristic peaks at 805 and 1438 cm−1, which were assigned to RNA, continued to decrease significantly from normal to the early apoptosis stage, and then to the late apoptosis stage. Therefore, cordycepin induced HeLa cell apoptosis through interfering with RNA production, potentially by restraining the translation of RNA encoding ribosomal proteins. Moreover, apoptotic cells and their apoptosis stage could be easily differentiated by PCA.
The natural ingredient cordycepin was a promising candidate in the treatment of cervical cancer. Our biological model of cell apoptosis in vitro also provided a reference for clinical treatment of cancer and anticancer drug development. In addition, the non-invasive, rapid SERS technique, combined with PCA analysis, was a powerful tool in the investigation of cell apoptosis mechanisms and anticancer drug screening.

Supplementary Materials

The following are available online at https://www.mdpi.com/2076-3417/9/19/3990/s1, Figure S1: The TEM images of silver nanoparticles, Figure S2: The particle size distribution of the silver colloid, Figure S3: The SERS spectrum of cordycepin, Figure S4: DIC and fluorescence microscopic images of HeLa cells in group 1–3. The DIC images of cells co-cultured with: (a) 20 μg/ml silver nanoparticles, (d) 60 μg/ml silver nanoparticles, (g) 200 μg/ml silver nanoparticles; the fluorescence images of cells co-cultured with: (b) 20 μg/ml silver nanoparticles, (e) 60 μg/ml silver nanoparticles, (h) 200 μg/ml silver nanoparticles; the merged DIC and fluorescence images were shown in (c), (f) and (i) respectively. In the DIC images, the bright or dark dots appeared were silver nanoparticles that resided on the bottom of the petri dish or those that had been endocytosed into the cells, Figure S5: DIC and fluorescence microscopic images of HeLa cells in group 4–6. The DIC images of cells co-cultured with: (a) 20 μg/ml silver nanoparticles, (d) 60 μg/ml silver nanoparticles, (g) 200 μg/ml silver nanoparticles; the fluorescence images of cells co-cultured with: (b) 20 μg/ml silver nanoparticles, (e) 60 μg/ml silver nanoparticles, (h) 200 μg/ml silver nanoparticles; the merged DIC and fluorescence images were shown in (c), (f) and (i) respectively. In the DIC images, the bright or dark dots appeared were silver nanoparticles that resided on the bottom of the petri dish or those that had been endocytosed into the cells, Figure S6: SERS spectral changes of HeLa cells treated with cordycepin in the early and late stage of apoptosis. (a): The average SERS spectrum of the control group; (b): the average SERS spectrum of the cordycepin-12h group; (c): the average SERS spectrum of the cordycepin-48h group; (d): spectral difference between (b) and (a); (e): spectral difference between (c) and (a). The x-axis was Raman shift and y-axis was the intensity in arbitrary unit (a.u.). Table S1: A summary of treatment and results of the Ag-cell apoptosis experiment.

Author Contributions

Concept formation P.M., L.X., H.C. and J.L.; experimental design P.M. and L.X.; data acquisition L.X., and P.M.; data analysis L.X. and L.W.; data interpretation L.X. and P.M.; first draft L.X.; manuscript revision P.M.; manuscript editing, P.M., L.X., L.W., N.C., X.Z., H.C. and J.L.

Funding

This research was supported by the National Key R&D Program of China (no. 2017YFC0110200), the Shanghai Pujiang Program (no. 18PJ1408700), the Shanghai Sailing Program (no. 19YF1435400), and the National Natural Science Foundation of China (NSFC, no. 61805143).

Conflicts of Interest

The authors declare no conflict of interest.

References

  1. Torre, L.A.; Islami, F.; Siegel, R.L.; Ward, E.M.; Jemal, A. Global cancer in women: Burden and trends. Cancer Epidemiol. Biomark. Prev. 2017, 26, 444–457. [Google Scholar] [CrossRef] [PubMed]
  2. Longoria, T.C.; Tewari, K.S. Pharmacologic Management of Advanced Cervical Cancer: Antiangiogenesis Therapy and Immunotherapeutic Considerations. Drugs 2015, 75, 1853–1865. [Google Scholar] [CrossRef] [PubMed] [Green Version]
  3. Xiang, S.; Sun, Z.; He, Q.; Yan, F.; Wang, Y.; Zhang, J. Aspirin inhibits ErbB2 to induce apoptosis in cervical cancer cells. Med. Oncol. 2010, 27, 379–387. [Google Scholar] [CrossRef] [PubMed]
  4. Saha, B.; Adhikary, A.; Ray, P.; Saha, S.; Chakraborty, S.; Mohanty, S.; Das, K.; Mukherjee, S.; Mazumdar, M.; Lahiri, L.; et al. Restoration of tumor suppressor p53 by differentially regulating pro- and anti-p53 networks in HPV-18-infected cervical cancer cells. Oncogene 2012, 31, 173–186. [Google Scholar] [CrossRef] [PubMed]
  5. Lowe, S.W.; Lin, A.W. Apoptosis in Cancer. Carcinogenesis 2000, 21, 485. [Google Scholar] [CrossRef] [PubMed]
  6. Torriglia, A.; Negri, C.; Chaudun, E.; Prosperi, E.; Courtois, Y.; Counis, M.F.; Scovassi, A.I. Differential involvement of DNases in HeLa cell apoptosis induced by etoposide and long term-culture. Cell Death Differ. 1999, 6, 234–244. [Google Scholar] [CrossRef] [PubMed]
  7. Priyadarsini, R.V.; Murugan, R.S.; Maitreyi, S.; Ramalingam, K.; Karunagaran, D.; Nagini, S. The flavonoid quercetin induces cell cycle arrest and mitochondria-mediated apoptosis in human cervical cancer (HeLa) cells through p53 induction and NF-κB inhibition. Eur. J. Pharmacol. 2010, 649, 84–91. [Google Scholar] [CrossRef]
  8. Cao, J.-T.; Zhu, Y.-D.; Rana, R.K.; Zhu, J.-J. Microfluidic chip integrated with flexible PDMS-based electrochemical cytosensor for dynamic analysis of drug-induced apoptosis on HeLa cells. Biosens. Bioelectron. 2014, 51, 97–102. [Google Scholar] [CrossRef]
  9. Yue, G.G.-L.; Lee, J.K.-M.; Chan, B.C.-L.; Kwok, H.-F.; Hoi, S.W.-H.; Sze, D.M.-Y.; Fung, K.-P.; Leung, P.-C.; Lau, C.B.-S. An innovative anti-cancer Chinese herbal formula exhibited multi-targeted efficacies in metastatic breast cancer mouse model. Chin. Med. 2018, 13, 64. [Google Scholar] [CrossRef] [Green Version]
  10. Wang, Z.; Li, J.; Ji, Y.; An, P.; Zhang, S.; Li, Z. Traditional Herbal Medicine: A Review of Potential of Inhibitory Hepatocellular Carcinoma in Basic Research and Clinical Trial. Evid. Based Complement. Altern. Med. 2013, 2013, 1–7. [Google Scholar] [CrossRef] [Green Version]
  11. Tuli, H.S.; Sharma, A.K.; Sandhu, S.S.; Kashyap, D. Cordycepin: A bioactive metabolite with therapeutic potential. Life Sci. 2013, 93, 863–869. [Google Scholar] [CrossRef] [PubMed]
  12. Overgaard-Hansen, K. The inhibition of 5-phosphoribosyl-1-pyrophosphate formation by cordycepin triphosphate in extracts of Ehrlich ascites tumor cells. BBA Spec. 1964, 80, 504–507. [Google Scholar] [CrossRef]
  13. Rottman, F.; Guarino, A.J. The inhibition of phosphoribosyl-pyrophosphate amidotransferase activity by cordycepin monophosphate. Biochim. Biophys. Acta (BBA) Spéc. Sect. Enzym. Subj. 1964, 89, 465–472. [Google Scholar] [CrossRef] [Green Version]
  14. Holbein, S.; Wengi, A.; Decourty, L.; Freimoser, F.M.; Jacquier, A.; Dichtl, B. Cordycepin interferes with 3′ end formation in yeast independently of its potential to terminate RNA chain elongation. RNA 2009, 15, 837–849. [Google Scholar] [CrossRef] [PubMed]
  15. Wong, Y.Y.; Moon, A.; Duffin, R.; Barthet-Barateig, A.; Meijer, H.A.; Clemens, M.J.; de Moor, C.H. Cordycepin inhibits protein synthesis and cell adhesion through effects on signal transduction. J. Biol. Chem. 2010, 285, 2610–2621. [Google Scholar] [CrossRef] [PubMed]
  16. Jeong, J.-W.; Park, C.; Cha, H.-J.; Hong, S.H.; Park, S.-H.; Kim, G.-Y.; Kim, W.J.; Kim, C.H.; Song, K.S.; Choi, Y.H. Cordycepin inhibits lipopolysaccharide-induced cell migration and invasion in human colorectal carcinoma HCT-116 cells through down-regulation of prostaglandin E2 receptor EP4. BMB Rep. 2018, 51, 532–537. [Google Scholar] [CrossRef] [Green Version]
  17. Choi, S.; Lim, M.-H.; Kim, K.M.; Jeon, B.H.; Song, W.O.; Kim, T.W. Cordycepin-induced apoptosis and autophagy in breast cancer cells are independent of the estrogen receptor. Toxicol. Appl. Pharmacol. 2011, 257, 165–173. [Google Scholar] [CrossRef]
  18. Jeong, J.-W.; Jin, C.-Y.; Park, C.; Hong, S.H.; Kim, G.-Y.; Jeong, Y.K.; Lee, J.-D.; Yoo, Y.H.; Choi, Y.H. Induction of apoptosis by cordycepin via reactive oxygen species generation in human leukemia cells. Toxicol. Vitr. 2011, 25, 817–824. [Google Scholar] [CrossRef]
  19. Chen, Y.; Chen, Y.-C.; Lin, Y.-T.; Huang, S.-H.; Wang, S.-M. Cordycepin Induces Apoptosis of CGTH W-2 Thyroid Carcinoma Cells through the Calcium-Calpain-Caspase 7-PARP Pathway. J. Agric. Food Chem. 2010, 58, 11645–11652. [Google Scholar] [CrossRef]
  20. Chen, Y.; Yang, S.-H.; Hueng, D.-Y.; Syu, J.-P.; Liao, C.-C.; Wu, Y.-C. Cordycepin induces apoptosis of C6 glioma cells through the adenosine 2A receptor-p53-caspase-7-PARP pathway. Chem. Interact. 2014, 216, 17–25. [Google Scholar] [CrossRef]
  21. Cui, Z.Y.; Park, S.J.; Jo, E.; Hwang, I.H.; Lee, K.B.; Kim, S.W.; Kim, D.J.; Joo, J.C.; Hong, S.H.; Lee, M.G.; et al. Cordycepin induces apoptosis of human ovarian cancer cells by inhibiting CCL5-mediated Akt/NF-kappaB signaling pathway. Cell Death Discov. 2018, 4, 62. [Google Scholar] [CrossRef]
  22. Liu, X.; Fu, R.; Pan, Y.; Meza-Sosa, K.F.; Zhang, Z.; Lieberman, J. PNPT1 Release from Mitochondria during Apoptosis Triggers Decay of Poly(A) RNAs. Cell 2018, 174, 187–201. [Google Scholar] [CrossRef]
  23. Hickman, J.A. Apoptosis induced by anticancer drugs. Cancer Metastasis Rev. 1992, 11, 121–139. [Google Scholar] [CrossRef]
  24. Jiang, Q.L.; Zhang, S.; Tian, M.; Zhang, S.Y.; Xie, T.; Chen, D.Y.; Chen, Y.J.; He, J.; Liu, J.; Ouyang, L.; et al. Plant lectins, from ancient sugar-binding proteins to emerging anti-cancer drugs in apoptosis and autophagy. Cell Prolif. 2015, 48, 17–28. [Google Scholar] [CrossRef]
  25. Eidet, J.R.; Pasovic, L.; Maria, R.; Jackson, C.J.; Utheim, T.P. Objective assessment of changes in nuclear morphology and cell distribution following induction of apoptosis. Diagn. Pathol. 2014, 9, 92. [Google Scholar] [CrossRef]
  26. Nicoletti, I.; Migliorati, G.; Pagliacci, M.C.; Grignani, F.; Riccardi, C. A rapid and simple method for measuring thymocyte apoptosis by propidium iodide staining and flow cytometry. J. Immunol. Methods 1991, 139, 271–279. [Google Scholar] [CrossRef]
  27. Vashishtha, S.C.; Nazarali, A.J.; Dimmock, J.R. Application of Fluorescence Microscopy to Measure Apoptosis in Jurkat T Cells After Treatment with a New Investigational Anticancer Agent (N.C.1213). Cell. Mol. Neurobiol. 1998, 18, 437–445. [Google Scholar] [CrossRef]
  28. Sun, M.G.; Williams, J.; Munoz-Pinedo, C.; Perkins, G.A.; Brown, J.M.; Ellisman, M.H.; Green, D.R.; Frey, T.G. Correlated three-dimensional light and electron microscopy reveals transformation of mitochondria during apoptosis. Nat. Cell Biol. 2007, 9, 1057–1065. [Google Scholar] [CrossRef]
  29. Stine, K.C.; Warren, B.; Becton, D.L. Apoptosis Induced by Interleukin-12 Measured by DNA Electrophoresis and in Situ End Labeling in Leukemia. Ann. N. Y. Acad. Sci. 2010, 795, 420–421. [Google Scholar] [CrossRef]
  30. Sundaram, N.; Pahwa, A.K.; Ard, M.D.; Lin, N.; Perkins, E.; Bowles, A.P. Selenium Causes Growth Inhibition and Apoptosis in Human Brain Tumor Cell Lines. J. Neuro-Oncol. 2000, 46, 125–133. [Google Scholar] [CrossRef]
  31. Fouladi-Nashta, A.A.; Alberio, R.; Kafi, M.; Nicholas, B.; Campbell, K.H.; Webb, R. Differential staining combined with TUNEL labelling to detect apoptosis in preimplantation bovine embryos. Reprod. Biomed. Online 2005, 10, 497–502. [Google Scholar] [CrossRef]
  32. Ubai, T.; Azuma, H.; Kotake, Y.; Inamoto, T.; Takahara, K.; Ito, Y.; Kiyama, S.; Sakamoto, T.; Horie, S.; Muto, S.; et al. FTY720 induced BCL-associated and FAS-independent apoptosis in human renal cancer cells in vitro and significantly reduced in vivo tumor growth in mouse xenograft. Anticancer Res. 2007, 27, 75–88. [Google Scholar]
  33. Morris, M.D. Review—Modern Raman Spectroscopy: A Practical Approach. Anal. Chem. 2006, 78, 33. [Google Scholar] [CrossRef]
  34. Matthäus, C.; Bird, B.; Miljković, M.; Chernenko, T.; Romeo, M.; Diem, M. Infrared and Raman microscopy in cell biology. Methods Cell Biol. 2008, 89, 275. [Google Scholar]
  35. Koenig, J.L. Raman spectroscopy of biological molecules: A review. J. Polym. Sci. Part A Polym. Chem. 2010, 6, 59–177. [Google Scholar] [CrossRef]
  36. Kneipp, K. Surface-enhanced Raman scattering. Phys. Today 2007, 60, 40–46. [Google Scholar] [CrossRef] [Green Version]
  37. Jiang, X.; Jiang, Z.; Xu, T.; Su, S.; Zhong, Y.; Peng, F.; Su, Y.; He, Y. Surface-Enhanced Raman Scattering-Based Sensing In Vitro: Facile and Label-Free Detection of Apoptotic Cells at the Single-Cell Level. Anal. Chem. 2013, 85, 2809–2816. [Google Scholar] [CrossRef]
  38. Badr, Y.; Mahmoud, M. Effect of silver nanowires on the surface-enhanced Raman spectra (SERS) of the RNA bases. Spectrochim. Acta Part A Mol. Biomol. Spectrosc. 2006, 63, 639–645. [Google Scholar] [CrossRef]
  39. Das, G.; Mecarini, F.; Gentile, F.; De Angelis, F.; Kumar, H.M.; Candeloro, P.; Liberale, C.; Cuda, G.; Di Fabrizio, E. Nano-patterned SERS substrate: Application for protein analysis vs. temperature. Biosens. Bioelectron. 2009, 24, 1693–1699. [Google Scholar] [CrossRef]
  40. Kneipp, K.; Flemming, J. Surface enhanced Raman scattering (SERS) of nucleic acids adsrobed on colloidal silver particles. J. Mol. Struct. 1986, 145, 173–179. [Google Scholar] [CrossRef]
  41. Lee, P.C.; Meisel, D.J.J. Adsorption and Surface-Enhanced Raman of Dyes on Silver and God Sols. J. Phys. Chem. 1982, 86, 3391–3395. [Google Scholar] [CrossRef]
  42. Sato-Berrú, R.; Mejía-Uriarte, E.V.; Frausto-Reyes, C.; Villagrán-Muniz, M.; Saniger, J.M. Application of principal component analysis and Raman spectroscopy in the analysis of polycrystalline BaTiO3 at high pressure. Spectrochim. Acta Part A Mol. Biomol. Spectrosc. 2007, 66, 557–560. [Google Scholar] [CrossRef]
  43. Shu, Z.; Shi, X.; Nie, D.; Guan, B. Low-Molecular-Weight Fucoidan Inhibits the Viability and Invasiveness and Triggers Apoptosis in IL-1beta-Treated Human Rheumatoid Arthritis Fibroblast Synoviocytes. Inflammation 2015, 38, 1777–1786. [Google Scholar] [CrossRef]
  44. Moritz, T.J.; Taylor, D.S.; Krol, D.M.; Fritch, J.; Chan, J.W. Detection of doxorubicin-induced apoptosis of leukemic T-lymphocytes by laser tweezers Raman spectroscopy. Biomed. Opt. Express 2010, 1, 1138–1147. [Google Scholar] [CrossRef] [Green Version]
  45. Elmore, S. Apoptosis: A Review of Programmed Cell Death. Toxicol. Pathol. 2007, 35, 495–516. [Google Scholar] [CrossRef]
  46. Jiang, H.Y.; Wek, R.C. Phosphorylation of the alpha-subunit of the eukaryotic initiation factor-2 (eIF2alpha) reduces protein synthesis and enhances apoptosis in response to proteasome inhibition. J. Biol. Chem. 2005, 280, 14189–14202. [Google Scholar] [CrossRef]
  47. Jones, B.E.; Lo, C.R.; Srinivasan, A.; Valentino, K.L.; Czaja, M.J. Ceramide induces caspase-independent apoptosis in rat hepatocytes sensitized by inhibition of RNA synthesis. Hepatology 1999, 30, 215–222. [Google Scholar] [CrossRef]
  48. Bushell, M.; Stoneley, M.; Sarnow, P.; Willis, A. Translation inhibition during the induction of apoptosis: RNA or protein degradation? Biochem. Soc. Trans. 2004, 32, 606–610. [Google Scholar] [CrossRef] [Green Version]
  49. Hu, S.; Feng, Y.; Zhang, D.; Lu, X.; Tian, J.; Fan, J.; Zhong, L. Raman spectral changes of Artemisinin-induced Raji cells apoptosis. Vib. Spectrosc. 2015, 81, 83–89. [Google Scholar] [CrossRef]
  50. Jovanovic, M.; Hengartner, M.O. miRNAs and apoptosis: RNAs to die for. Oncogene 2006, 25, 6176–6187. [Google Scholar] [CrossRef] [Green Version]
Figure 1. (a) The UV–vis absorption spectrum of the surface-enhanced Raman spectroscopy (SERS) substrate, (b) the TEM image of silver nanoparticles.
Applsci 09 03990 g001
Figure 2. Differential interference contrast (DIC) and fluorescence microscopic images of HeLa cells. The DIC images of cells from: (a) the control group, (d) cordycepin-12 h group, (g) cordycepin-48 h group; the fluorescence images of cells from: (b) the control group, (e) the cordycepin-12 h group, (h) the cordycepin-48 h group; the merged DIC and fluorescence images are shown in (c), (f), and (i), respectively.
Applsci 09 03990 g002
Figure 3. SERS spectral changes of HeLa cells treated with cordycepin in the early stage of apoptosis. (a) The average SERS spectrum of the control group; (b) the average SERS spectrum of the cordycepin-12 h group; (c) spectral difference between (b) and (a). The x-axis is the Raman shift and y-axis is the intensities in arbitrary unit (a.u.).
Applsci 09 03990 g003
Figure 4. SERS spectral changes of HeLa cells treated with cordycepin in the late stage of apoptosis. (a) The average SERS spectrum of the control group; (b) the average SERS spectrum of the cordycepin-48 h group; (c): spectral difference between (b) and (a). The x-axis is the Raman shift and y-axis is the intensities in arbitrary unit (a.u.).
Applsci 09 03990 g004
Figure 5. Intensity changes of important SERS characteristic peaks among the experimental groups. At each characteristic peak, the intensity of the control group was set as a base value, 1, and was divided by intensities from the cordycepin-12 h group and the cordycepin-48 h group. The error bars represent the standard deviations from 15 measurements in each group.
Applsci 09 03990 g005
Figure 6. Scatter plots of the first two principal components (PCs) for the control group (green), cordycepin-12 h group (blue), and cordycepin-48 h group (red).
Applsci 09 03990 g006
Table 1. Raman peak frequencies and their assignments.
Raman shift (cm−1)Assignment
534Adenine ring breath
640C–C twist of tyrosine
746Thymine ring breath
805RNA
830O–P–O asymmetric stretch, tyrosine ring breath
998Phenylalanine symmetric ring breath
1145Deoxyribose phosphate
1438RNA
1546Amide Ⅱ

