Abstract
Lipreading is understanding speech from observed lip movements. An observed series of lip motions is an ordered sequence of visual lip gestures. These gestures are commonly known, but as yet are not formally defined, as ‘visemes’. In this article, we describe a structured approach which allows us to create speaker-dependent visemes with a fixed number of visemes within each set. We create sets of visemes for sizes two to 45. Each set of visemes is based upon clustering phonemes, thus each set has a unique phoneme-to-viseme mapping. We first present an experiment using these maps and the Resource Management Audio-Visual (RMAV) dataset which shows the effect of changing the viseme map size in speaker-dependent machine lipreading and demonstrate that word recognition with phoneme classifiers is possible. Furthermore, we show that there are intermediate units between visemes and phonemes which are better still. Second, we present a novel two-pass training scheme for phoneme classifiers. This approach uses our new intermediary visual units from our first experiment in the first pass as classifiers; before using the phoneme-to-viseme maps, we retrain these into phoneme classifiers. This method significantly improves on previous lipreading results with RMAV speakers.
Dataset: RMAV Active Appearace Model Features can be found at http://doi.org/10.5281/zenodo.2576567
Keywords:
visual speech; lipreading; recognition; audio-visual; speech; classification; viseme; phoneme; transfer learning 1. Introduction
The concept of phonemes is well developed in speech recognition and derives from a definition in phonetics as “the smallest sound one can articulate” [1]. Phonemes are analogous to atoms—they are the building blocks of speech. While they are an approximation, in practice that approximation has been remarkably robust [2]. Not only are phonemes used by linguists and audiologists to describe speech, they are widely used in large-vocabulary speech recognition as the acoustic classes, or ‘units’, to be recognized [2,3,4]. Sequences of unit estimates can be strung together to infer words and sentences.
Comprehending visual speech, or lipreading, is much less well developed [5]. The units considered to be equivalent to phonemes are called visemes [6] but, even in English, there is no clear agreement on the visemes [7], and in [8] for example, it is noted that there are at least 120 proposed viseme sets. This large number arises because some authors take vowels [9], and others consonants [10], but also because, of the proposed sets, some are derived from linguistic principles [11,12], some are the results of human lipreading experiments [13,14], others are data-derived [8,15], and others still are hybrids of these approaches [16].
Despite the challenges, a number of lipreading systems have been built using visemes ([17,18] for example). When building a viseme recognizer a complication is that multiple phonemes will map onto a single viseme [8]. A common example is the , , and bilabial sounds which are often grouped into one viseme [19,20,21]. Attempts to draw mappings between the phonemes and visemes have been tested [8,22] but to date these mappings have not yet proven to improve machine lipreading significantly.
On the other hand, there is an emerging body of work [23,24] that, despite the caveats above, is demonstrating that phoneme lipreading systems can outperform viseme recognizers. In essence it is a tradeoff: does one use viseme units which are tuned to the shape of the lips but suffer with inaccuracies caused by visual confusions between words that sound different but look identical [23]; or does one stick to phonetic units knowing that many of the phonemes are difficult to distinguish on the lips?
These visual confusions are called homophenes [25]. We demonstrate the homophenous word difficulty, with some examples in Table 1 from [23]. In this example, Jeffers visemes [26] have been used to translate the phonemes into viseme strings.

Table 1.
Example of phoneme and viseme dictionary with its corresponding IPA symbols [23].
However, as we shall show in this paper, it need not be an either/or approach to phonemes or visemes; we develop a novel method that allows us to vary the number of classes/visual units. This means we can tune the visual units as an intermediary state between the visual and audio spaces and we can also optimize against the competing trends of homopheneiosity [27,28] and accuracy [29]. Thus, in this work, we use the term visemes for the traditional visemes, and the term visual units for our new intermediary units which we propose will improve phoneme classifiers.
We are motivated in our work because lipreading is a difficult challenge from speech signals. Speech signals are bimodal (that is they have two channels of information, audio and visual) and significant prior work uses both. For example [30] uses audio-visual speech recognition to demonstrate cross modality learning. However in our case, lipreading, which is useful for understanding speech when audio speech is too noisy to recognize easily, is classifying speech from only the visual information channel in speech signals thus, as we shall present, we use a novel training method which uses new visual units and phonemes in a complimentary fashion.
This paper is an extended version of our prior work [5,31], this work is relevant to all classifiers since the choice of visual unit matters and is made before the classifier is trained. In other words, the choice of visual units must be made early in the design process and a non-optimal choice can be very expensive in terms of performance.
The rest of this paper is structured as follows; we summarize prior viseme research for lipreading by both humans and machines, and describe the state-of-the-art approaches for lipreading systems in a background section. Then we present an experiment in which we demonstrate how we can find the optimal number of visual units within a set; this is an essential preliminary test to define the scope of the second task. We present the data for all experiments within this section. The preliminary test includes phoneme classification and clustering for new visual unit generation before analyzing the results to find the optimal visual unit sets.
These optimal visual unit sets are used to test our novel method for training phoneme-labeled classifiers by using these sets as an initialization stage in the training phase of a conventional lipreading system. As part of this second task, we also present a side task of deducing the right units for lipreading language models used in the lipreading system. Finally, we present the results of the new training method and draw conclusions before suggesting future work. Thus, we have three main contributions:
- a method for finding optimal visual units,
- a review of language model units for lipreading systems,
- a new training paradigm for lipreading systems.
2. Background
Table 2 summarizes the most common viseme sets in the literature used for both human and machine lip reading. The range of set sizes is from four (Woodward [12]) to 21 (Nichie [21]). Note that not all viseme sets represent the same number of phonemes. Furthermore some of these use American English and others British English so there are minor variations in the phoneme sets. (American English phonemes tend to use diacritics [32].)

Table 2.
Ratio of visemes to phonemes in previous viseme sets from literature.
Lipreading systems can be built with a range of architectures. Conventional systems are adopted from acoustic methods, often using Hidden Markov Models, for example as in [36]. More modern systems exploit deep learning methods [37,38]. Deep learning has been deployed in two configurations: (i) as a replacement for the GMM in the Hidden Markov Models (HMM) and (ii) in a configuration known as end-to-end learning.
However, the high-level architectures have similarities: first the face of the speaker must be tracked or located; then some form of features are extracted; then a classification model is trained and tested on unseen data, optionally using a language model to improve the classification output (e.g., [39]). Throughout this process one must translate between the words spoken (and captured in the training videos), to their phonetic pronunciation, to their visual representation on the lips, and back again for a useful transcript.
3. Finding a Robust Range of Intermediate Visual Units
In our first example we use the RMAV dataset [40] and the BEEP pronunciation dictionary [41]. Figure 1 shows a high-level overview of the first task. We begin with classification using phoneme-labeled classifiers. The output of this task is a set of speaker-dependent confusion matrices. The data in these are used to cluster together single phonemes (monophones) into subgroups of visual units, based upon confusions.

Figure 1.
Three-step high-level process for visual unit classification where the visual units are derived from phoneme confusions.
However, conversely to the approach in [8] we implement an alternative phoneme clustering process (described in detail in Section 4). The key difference between the ad-hoc viseme choices compared in [8] and our new clustering approach, is our ability to choose the number of visual units, whereas in prior viseme sets, this is fixed.
With our new algorithm, we create a new phoneme-to-viseme (P2V) mapping every time a pair of classes is re-classified into a new class, thus reducing the number of classes in a set by one each time. In the phonetic transcripts of our 12 speakers, there is a maximum of 45 phonemes, therefore we can create at most 45 P2V maps for each speaker. We note that the real number of maps we can derive depends upon the number of phonemes classified during step one of Figure 1. During this preliminary phoneme classification, should a phoneme not be classified, either incorrectly or correctly, then it is an omission in the confusion matrix from which our visual units are created. Thus, we have up to 45 sets of visual unit labels per speaker with which to label our classifiers.
There is the option to measure performance using phoneme, viseme, or word error. Here we choose word error [42] because viseme error varies as the number of visemes varies which leads to unfair comparisons and phoneme error is not as close to what we believe to be of interest to users which is transcript error.
3.1. Data
The RMAV dataset (formerly known as LiLIR) consists of 20 British English speakers (we use the 12 speakers who had tracked features available; seven male and five female) and up to 200 utterances per speaker of the Resource Management (RM) sentences which totals between 1362 and 1802 words each. The sentences selected for the RMAV speakers are a subset of the full RM dataset [43] transcripts. They were selected to maintain as much coverage of all phonemes as possible as shown in Figure 2 and realistic to English conversation [40]. The original videos were recorded in high definition () and in a full-frontal position at 25 fs. Individual speakers are tracked using Linear Predictors [44] and Active Appearance Model [45] features of concatenated shape and appearance information have been extracted.
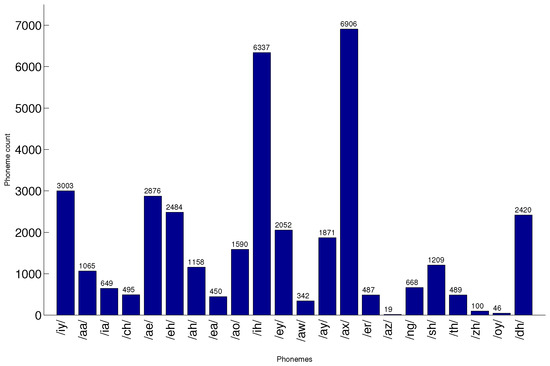
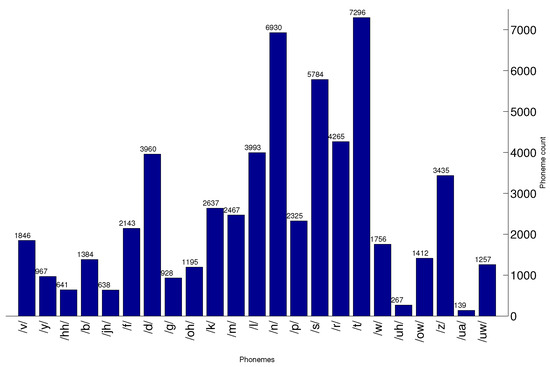
Figure 2.
Occurrence frequency of phonemes in the RMAV dataset.
3.2. Linear Predictor Tracking
Linear Predictors (LP) are a person-specific and data-driven facial tracking method. Devised primarily for observing visual changes in the face during speech, these make it possible to cope with facial feature configurations not present in the training data by treating each feature independently.
The linear predictor is the central point around which support pixels are used to identify the change in position of the central point over time. The central point is observed as a landmark on the outline of a feature. In this method both the shape (comprised of landmarks) and the pixel information surrounding the linear predictor position are intrinsically linked. Linear predictors have been successfully used to track objects in motion, for example [46].
3.3. Active Appearance Model Features
AAM features [45] of concatenated shape and appearance information have been extracted. We track using a full-face model (Figure 3(left)) but the final features are reduced to information from the lip area alone (Figure 3(right)). Shape features (1) are based solely upon the lip shape and positioning during the duration of the speaker speaking. The landmark positions can be compactly represented using a linear model of the form:
where is the mean shape and are the modes. The appearance features are computed over pixels, the original images having been warped to the mean shape. So is the mean appearance and appearance is described as a sum over modal appearances:
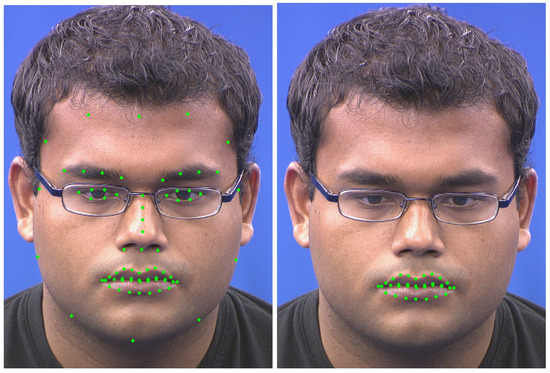
Figure 3.
Landmarks in a full-face AAM used to track a face (left) and the lip-only AAM landmarks (right) for feature extraction.
Combined features are the concatenation of shape and appearance after PCA has been applied to each independently. The AAM parameters for each speaker is in Table 3 (MATLAB files containing the extracted features can be downloaded from http://zenodo.org/record/2576567).

Table 3.
The number of parameters of shape, appearance, and combined shape and appearance AAM features for the RMAV dataset speakers. Features retain 95% variance of facial information.
4. Clustering
4.1. Step One: Phoneme Classification
To complete our preliminary phoneme classification, we implement 10-fold cross-validation with replacement [47], over the 200 sentences per speaker. This means 20 test samples are randomly selected and omitted from training sample folds. Our classifiers are based upon Hidden Markov Models (HMMs) [48] and implemented with the HTK toolkit [29]. We use the HTK tools as follows;
- HLed creates our phoneme transcripts to be used as ground truth transcriptions.
- HCompV initializes the HMMs using a ‘flat-start’ [49] using manually made prototype files for each speaker based upon their AAM parameters (listed in Table 3) and the desired HMM parameters. The prototype HMM is based upon a Gaussian mixture of five components and three state HMMs as per the work of [50].
- Using HERest we train the classifiers by re-estimating the HMM parameters 11 times over via embedded training with the Baum-Welch algorithm [51], more than 11 iterations and the HMM’s overfit. Our list of HMMs includes a single-state, short-pause model, labeled to model the short silences between words in the spoken sentences. States are tied with HHed.
- We build a bigram word lattice using HLStats and HBuild and use this lattice to complete recognition with HVite. HVite uses our trained set of phoneme-labeled HMM classifiers to estimate what our test samples should be.
- The output transcripts from HVite are used with our ground truth transcriptions from HLEd as inputs into HResults to produce confusion matrices and lipreading accuracy scores. HResults uses an optimal string match using dynamic programming [29] to compare the ground truths with the prediction transcripts.
4.2. Step Two: Phoneme Clustering
Now we have our phoneme confusions (an example matrix is in Figure 4), we have ten confusion matrices per speaker (one for each fold of the cross-validation). We cluster the m phonemes into new visual unit classes, one iteration at a time.
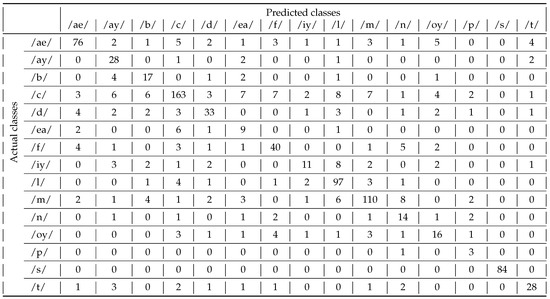
Figure 4.
An example phoneme confusion matrix.
First we sum all ten matrices into one matrix to represent all the confusions for each speaker. Our clustering begins with this single specific speaker confusion matrix.
where the element is the count of the number of times phoneme i is classified as phoneme j. This algorithm works with the column normalized version,
the probability that given a classification of that the phoneme really was . Merging of phonemes is done by looking for the two most confused phonemes and hence creating new matrices . Specifically, for each possible merged pair a score, q, is calculated as:
Vowels and consonants cannot be mixed, the significant negative effect of mixing vowel and consonant phonemes in visemes was demonstrated in [8], so phonemes are assigned to one of two classes, V or C, for vowels and consonants respectively. The pair with the highest q is merged. We break equal scores randomly. This process is repeated until . We stop at two because at this point we have two single classes, one class containing vowel phonemes, and a second class of consonant phonemes. Each intermediate step, forms another set of prospective visual units. An example P2V mapping is shown in Table 4 for RMAV speaker number one with ten visual units.

Table 4.
An example P2V map, (for RMAV Speaker 1 with ten visual units).
4.3. Step Three: Visual Unit Classification
Step three is similar to step one. We again complete 10-fold cross-validation with replacement [47] over the 200 sentences for each speaker using the same folds as the prior steps to prevent mixing the training and test data. Again, 20 test samples are randomly selected to be omitted from the training folds. Again, with the HTK toolkit, we build new sets of HMM classifiers. This time however, our classifiers are labeled with the visual units we have just created in step two.
We have a python script which translates the phoneme transcripts from using HLed in step one and the P2V maps from step two, into visual unit transcripts, one for each P2V map. For each set of visual units, visual unit HMMs are flat-started (HCompV) with the same speaker specific HMM prototypes as before (Gaussian mixtures are uniform across prototypes), re-estimated 11 times over with HERest. A bigram word lattice supports classification including a grammar scale factor of (shown to be optimum in [24]) and a transition penalty of .
The important difference this time is that the visual unit classes are now used as classifier labels. By using these sets of classes which have been shown in step one to be visually confusing on the lips, we now perform classification for each class set. In total this is at most 44 sets, where the smallest set is of two classes (one with all the vowel phonemes and the other all the consonant phonemes), and the largest set is of 45 classes with one phoneme in each—thus the largest set for each speaker is a repeat of the phoneme classification task but using only phonemes which were originally recognized (either correctly or incorrectly) in step one.
5. Optimal Visual Unit Set Sizes
Figure 5 plots word correctness on the y-axis for all 12 speakers with error bars showing ± one standard error (se). The x-axis shows the number of visual units. In green we plot mean weighted guessing over all speakers for each viseme set. Individual speaker variations are in Appendix A, Figure A1, Figure A2, Figure A3, Figure A4, Figure A5 and Figure A6.
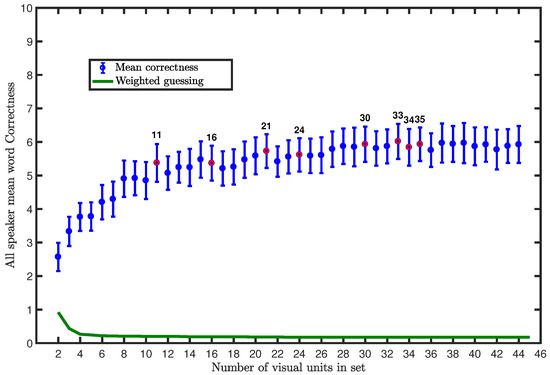
Figure 5.
All-speaker mean word classification correctness .
It is important in this case to weight the chance of guessing by visual homophenes as these vary by the size of the visual unit set. Visual unit sets which contain fewer visual units produce sequences of visual units which represent more than one word. These are homophenes. The effect of homophenes can be seen on the left side of Figure 5 and the graphs in Appendix A with visual unit sets with fewer than 11 visual units where homophenes become noticeable and language model can no longer correct these confusions.
An example of a homophene in the RMAV data are the words ‘tonnes’ and ‘since’. If one uses Speaker 1’s 10-visual unit P2V map, both words transcribe into visual units as ‘’. In practice a language model, or word lattice, will tend to reduce such confusions since the lattice models the probability of word N-grams which means that probable combinations such as “metric tonnes” will be favored over “metric since” [23].
We see all our word correctness scores are significantly above guessing albeit still low. There is variation between speakers, but there is a clear overall trend. Superior performance is to be found with larger numbers of visual units. An important point is some authors report viseme accuracy instead of word correctness [42]. This is unhelpful as it masks the effect of homophenous words on performance. Had we reported this then the positive effect of larger visual unit sets would not be visible.
In Figure 5 we highlight in red the class sets which, for any speaker, have shown a significant classification improvement (with non-overlapping error bars) over the adjacent set of units on its right side along the x-axis. Error bars overlap once the correctness is averaged so Table 5 lists these combinations for each speaker. These red points show where we can identify the pairs of classes which, when merged into one class, significantly improve classification. If we refer to the speaker demographic factors such as gender or age, we find no apparent pattern through these visual unit combinations. So, we have further evidence to reinforce the idea that all speakers have a unique visual speech signal, [52]. In [53] this is suggested to be due to how the trajectory between visual units varies by speaker, due to such things as rate of speech [54]. This is how difficult finding a set of cross-speaker visual units can be when phonemes need alternative groupings for each individual [27].

Table 5.
visual unit class merges which improve word classification in correctness; .
6. Discussion
In Figure 5 we have plotted mean word correctness, C, over all 12 speakers and weighted guessing () in green. Here we see that within one standard error, there is a monotonic trend. Small numbers of units perform worse than phonemes and which supports the claim that phonemes are preferred to visemes but, it would be an oversimplification to assert that higher accuracy lipreading can be achieved with phonemes as this has not been shown in our results with significance. Rather we say that, generally, visual unit sets with higher numbers of visual unit classes outperform the smaller sets. In [8] the authors reviewed 120 of previous phoneme-to-viseme (P2V) maps, typically these consist of between 10 and 35 visual units [55]. For example the Lee set consists of six consonant visemes and five vowel visemes [15] and Jeffers [26] group phonemes into eight vowel and three consonant visemes.
In Figure A1, Figure A2, Figure A3, Figure A4, Figure A5 and Figure A6 and Figure 5 we present a definite rapid decrease in lipreading word correctness for visemes sets containing fewer than ten visemes. However, positively, the region visemes sets of sizes between 11 and 20 contain the optimum viseme set for three out of the 12 speakers which is more than random chance. This means, for each speaker, we have found and presented an optimal number of visual units (shown by the best performing results in Figure A1, Figure A2, Figure A3, Figure A4, Figure A5 and Figure A6) but the optimal number is not related to any of the conventional viseme definitions, nor is it consistent across speakers. Table 6 shows the word correctness, , of each speakers phoneme classification.
7. Hierarchical Training for Weak-Learned Visual Units
Figure 5 showed our first results derived using an adapted version of the algorithm described in [55]. Table 5 also shows us, for each of our 12 speakers the significantly improving visual unit sets. These sets are those where one single change of visual unit grouping has resulted in a significant (greater than one standard error over ten folds) increase in word correctness. This tells us that there are some units between the traditional visemes (for example [13,20,21]), and phonemes which are better for visual speech classification.
Table 5 ([31]) shows us several significantly improving sets. Our suggestions for why these are interesting are; first the tradeoff of homophenes against accuracy. It is possible these are the groupings where the accuracy improvement is significantly improving, despite the extra homophenes created as the number of visual units in the set decreases. Either the increase in homophenes is negligible or, the number of training samples for two visually indistinguishable classes significantly increases when combined.
We propose a novel idea; to implement hierarchical classifier training using both visual units and phonemes in sequence. Some work in acoustic speech recognition has used this layered approach to model building with success e.g., [56]. It is our intention use our new range of visemes to test if our new training algorithm can improve phoneme classification without the need for more training data as this approach shares training data across models. This premise avoids the negative effects of introducing more homophenes because of the second layer of training discriminates between the sub-units within the first layer. This will assist the identification of the more subtle but important differences in visual gestures representing alternative phonemes. We note from [22] that using the wrong clusters of phonemes is worse than using none, and also that this new approach aims to optimize performance within the scope of the datasets and system affects described previously in Section 5 and Section 6.
A bonus of our revised classification scheme is that because we weakly train the classifier before phoneme training, we remove any desire to consider post-processing methods (e.g., weighted finite state transducers [24]) to reverse the P2V mapping in order to decode the real phoneme recognized.
In Figure 5, the performance of classifiers with small numbers of visual units (fewer than 10) is poor. As described previously, we attributed this to the large number of homophenes. At the other side of our figure, sets containing large numbers of visual units (greater than 35) do not significantly, or even noticeably, improve the correctness. This is where many phonetic variations are visually indistinguishable on the lips. Also taking into account the set numbers printed in black (which are the significantly improving visual unit sets) we focus on sets of visual units in the size range 11 to 35 with the same 12 RMAV speakers for our experiments using hierarchical training of phoneme classifiers.
Here, we use our knowledge of visual speech to drive our novel redesign of the conventional training method. In Figure 6 shows how we make it earlier in the process. The top of Figure 6 in black boxes shows the steps of a lipreading system, divided into phases where the units change from words, to phonemes, to visual units (where used). Flow 1 shows how we translate the word ground truth into phonemes using a pronunciation dictionary (e.g., [41] or [57]) for labeling the classifiers, before decoding with a word language model. Flow 2 below this, using visual units. The variation in flow 2 shows we translate from visual unit trained classifiers back into words using the word network. Finally, row three shows our new approach, where we introduce an extra step into the training phase, which means classifiers are initialized as visual units, before retraining them into phoneme classifiers before word decoding. We describe this new process in detail now.
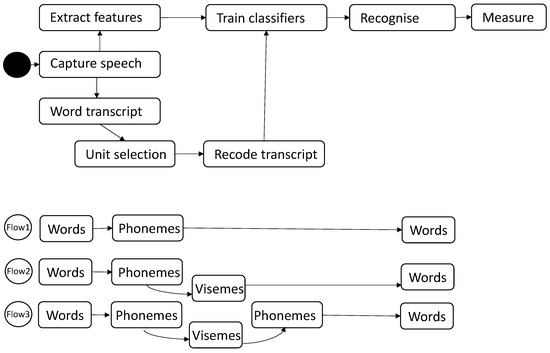
Figure 6.
(Top): a high-level lipreading system, and (Bottom): where conversions between words, phonemes, and visual units can occur in lipreading systems in three different flows.
8. Classifier Adaptation Training
The basis of our new training algorithm is a hierarchical structure with the first level based on visual units, and the second level based on phonemes. In Figure 7 we present an illustration based on a simple example using five phonemes (in reality there are up to 45 in the RMAV sentences) mapped to two visual units (in reality there will be between 11 and 35 as we have refined our experiment to only use sets of visual units in the optimal size range from the preliminary test results). Each phoneme is mapped to a visual unit as in [5], our example map is in Table 7. But now we are going to learn intermediate visual unit labeled HMMs before we create phoneme models.
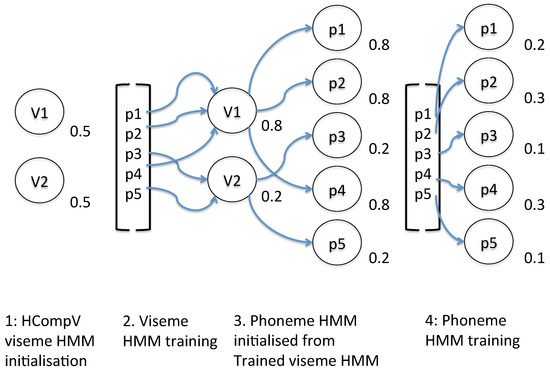
Figure 7.
Hierarchical training strategy for training visual units HHMs into phoneme-labeled HMM classifiers.

Table 7.
Our example P2V map to illustrate our novel training algorithm.
In this example , and are associated with , so are initialized as duplicate copies of HMM . Likewise, phoneme models labeled and are initialized as replicas of . We now retrain the phoneme models using the same training data.
In full for each set of visual units of sizes from 11 to 35:
- We initialize visual unit HMMs with HCompV, this tool initializes HMMs defines all models equal [58].
- With our prototype HMM based upon a Gaussian mixture of five components and three states, we use HERest 11 times over to re-estimate the HMM parameters and we include short-pause model state tying (between re-estimates three and four with HHed). Training samples are from all phonemes in each visual unit cluster. These first two points are steps 1 and 2 in Figure 7.
- Before classification, our visual unit HMM definitions duplicated to be used as initialized definitions for phoneme-labeled HMMs (Figure 7 step 3). In our Figure 7 illustration, is duplicated three times (one for each phoneme in its cluster) and is copied twice. The respective visual unit HMM definition is used for all the phonemes in its relative P2V map.
- These phoneme HMMs are retrained with HERest 11 times over, this time, training samples are divided by the unique phoneme labels.
- We create a bigram word lattice with HLStats and HBuild and as part of the classification we apply a grammar scale factor of and a transition penalty of (based on [24]) with HVite. In Section 9 we present a test to determine the best language network units for this step.
- Finally, the output transcripts from HVite are used in HResults against the phoneme ground truths produced by HLed. This is all implemented using 10-fold cross-validation with replacement [47].
The big advantage of this approach is the phoneme classifiers have seen mostly positive cases therefore have good mode matching, the disadvantage is they are limited in their exposure to negative cases, less so than the visual units.
9. Language Network Units
Step five in our novel hierarchical training method requires a language network. It has been consistently observed that language models are very powerful in lipreading systems (e.g., in [59]). Language models built upon the ground truth utterances of datasets learn grammar and structure rules of words and sentences (the latter in the case of continuous speech). However, the visual co-articulation effects damages the performance of visual speech language models as visually, people do not say what the language model expects. These types of network are commonplace, but we note that higher-order N-gram language models may improve classification rates but the cost of this model is disproportionate to our goal of developing more accurate classifiers. Therefore, to decide which unit would best optimize our language model we test three units: visemes; phonemes; and words, as bigram models in a second preliminary test.
In the first two columns of Table 8 we list the possible pairs of classifier units and language model units. For each of these pairs we use the common process previously described for lipreading in HTK, where our phonemes are based on the International Phonetic Alphabet [1], and our visemes are Bear’s speaker-dependent visemes [8]. Word labels are from the RMAV dataset. We define classifier units as the labels used to identify individual classification models and language units as the label scheme used for building the decoding network used post classification.

Table 8.
Unit selection pairs for HMMs and language network combinations, and the all-speaker mean achieved.
Language Network Unit Analysis
In Table 8 column four we have listed one standard error values for these tests. The phoneme units are the most robust. In Figure 8 we have plotted word correctness (x-axis) for each speaker along the y-axis over three figures, one figure per language network unit. The viseme network is top, phoneme network middle, and word network at the bottom. The viseme network is the lowest performing score (). On the face of it, the idea of visemes classifiers is a good one because they take visual co-articulation into account to some extent. However, as seen here, a language model of visemes is too complex because of homophenes. This leaves us with a choice of either phoneme or word units for our language model in step five of our new hierarchical training method.
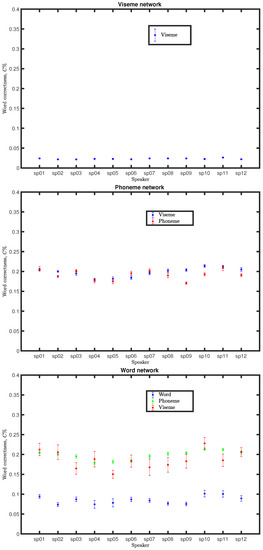
Figure 8.
Effects of support network unit choice with each type of labeled HMM classifier units. Along the x-axis is each speaker, y-axis values are correctness, C. Viseme network is at the (top), phoneme network plotted in the (middle), and word networks at the (bottom).
In Figure 8(middle) we have our phoneme language network performance with both viseme and phoneme trained classifiers. This is more exciting because for all speakers we see a statistically significant increase in compared to the viseme network scores in Figure 8(top). Looking more closely between speakers we see that for four speakers (2, 9, 10 and 12), the viseme classifiers outperform the phonemes, yet for all other speakers there is no significant difference between the two. On average they are identical with an all-speaker mean of compared to the viseme classifiers (Table 8, column 3).
In Figure 8(bottom) we show our for all speakers with a word network paired with classifiers built on viseme, phoneme, and word units. Our first observation is that word classifiers perform very poorly. We attribute this to a low number of training samples per class due to the extra number of classes in the word space compared to the number of classes in the phoneme space, so we do not continue our work with word-based classifiers. Also shown in Figure 8(bottom) are the phoneme and viseme classifiers (in green and red respectively) with a word network. This time we see that for five of our 12 speakers (3, 5, 7, 8, and 11), the phoneme classifiers outperform the visemes and for our remaining speakers there is no significant difference once a work network is applied.
These results tell us that for some speakers viseme classifiers with phoneme networks are a better choice whereas others are easier to lipread with phoneme classifiers with a word network. Thus, we continue our work using both phoneme and word-based language networks.
10. Effects of Training Visual Units for Phoneme Classifiers
Here we present the results of our proposed hierarchical training method (described in Section 4 with two different language models. Figure 9 shows the mean correctness, C, for all 12 speakers over 10 folds. We have plotted four symbols, one for each of the pairings of our HMM unit labels and the language network unit ({visual units and phonemes, visual units and words, phonemes and phonemes, phonemes and words}). Random guessing is plotted in orange.
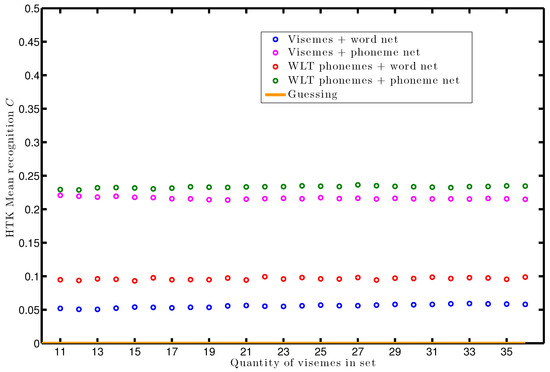
Figure 9.
HTK Correctness C for visual unit classifiers with either phoneme or word language models and phoneme classifiers with either phoneme or word language models averaged over all 12 speakers. The correctness unit matches the paired network unit.
The x-axis of Figure 9 is the size of the optimal visual unit sets from Figure 5, from 11 to 36. This is the range of optimal number of visual units where phoneme label classifiers do not improve classification. The baseline of visual unit classification with a word network from [31] is shown in blue and is not significantly different from conventionally learned phoneme classifiers. Based on our language network study in Section 9, it is not a surprise to see just by using a phoneme network instead of a word network to support visual unit classification we significantly improve our mean correctness score for all visual unit set sizes for all speakers (shown in pink). We have plotted weighted guessing in orange.
More interesting to see is our new weakly trained phoneme HMMs are significantly better than the visual unit HMMs. In the first part of our work here phoneme HMMs gave an all-speaker mean and was not significantly different from the best visual units. Here, regardless of the size of the original visual unit set, C is almost double. Weakly learned phoneme classifiers with a word network gain to in mean C, and when these phoneme classifiers are supported with a phoneme network we see a correctness gain range from to . These gains are supported by the all-speaker mean minimum and maximums listed in Table 9. These gain scores are from over all the potential P2V mappings and show there is little difference in which P2V map is best for knowing which set of visual units to initialize our phoneme classifiers. All results are significantly better than guessing.

Table 9.
Minimum and maximum all-speaker mean correctness, C, showing the effect of hierarchical training from visual units on phoneme-labeled HMM classification.
In Figure 10, Figure 11, Figure 12 and Figure 13, we have plotted for each of our 12 speakers non-aggregated results showing one standard error. While not monotonic, these graphs are much smoother than the speaker-dependent graphs shown in Appendix A. The significant differences between visual unit set sizes (in Figure 5) have now disappeared because the learning of differences between visual units, has been incorporated into the training of phoneme classifiers, which in turn are now better trained (plotted in red and green which improve on blue and pink respectively).
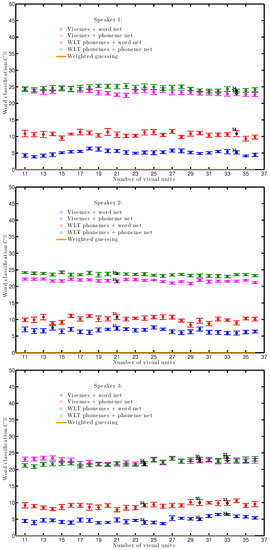
Figure 10.
Speaker 1 (top), Speaker 2 (middle), and Speaker 3 (bottom) correctness with a word language model (blue) and the hierarchically trained phoneme classifiers with a phoneme or word network.
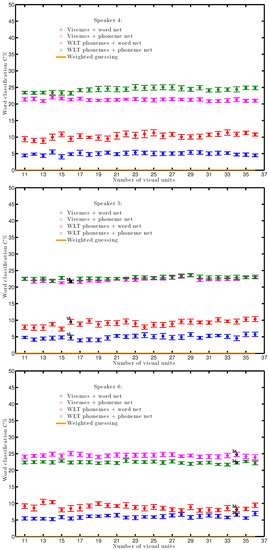
Figure 11.
Speaker 4 (top), Speaker 5 (middle), and Speaker 6 (bottom) correctness with a word language model (blue) and the hierarchically trained phoneme classifiers with a phoneme or word network.
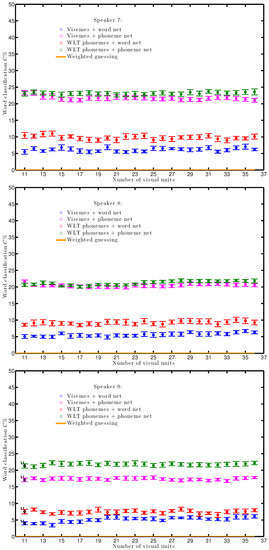
Figure 12.
Speaker 7 (top), Speaker 8 (middle), and Speaker 9 (bottom) correctness with a word language model (blue) and the hierarchically trained phoneme classifiers with a phoneme or word network.
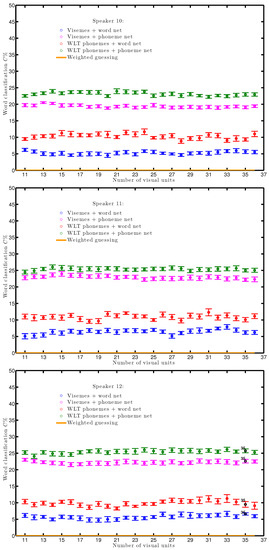
Figure 13.
Speaker 10 (top), Speaker 11 (middle), and Speaker 12 (bottom) correctness with a word language model (blue) and the hierarchically trained phoneme classifiers with a phoneme or word network.
An intriguing observation is comparing the use of a phoneme network for visual units and for weakly taught phonemes. For some speakers, the weakly learned phonemes are not always as important as having the right network unit. This is seen in Figure 10(top,bottom), Figure 11(middle), Figure 12(middle), and Figure 13(bottom) for Speaker’s 1, 3, 5, 8, and 12. By rewatching the original videos to estimate the age of our speakers, we categorize them as either an ‘older’ or ’younger’ speaker by eye because the exact ages were not captured during filming. The speakers with less significant difference in the effect of hierarchical training from visual to audio units are younger. This implies to lipread a younger person we need more support from the language model, than an older speaker. We suggest this could be because young people show more co-articulation than older people, but this requires further investigation.
11. Conclusions
We have described a method that allows us to construct any number of visual units. The presence of an optimum is a result of two competing effects on a lipreading system. In the first, as the number of visual units shrinks the number of homophenes rises and it becomes more difficult to recognize words (correctness drops). In the second, as the number of visual units rises we run out of training data to learn the subtle differences in lip-shapes (if they exist), so again, correctness drops. Thus, the optimum number of visual units lies between one and 45. In practice we see this optimum is between the number of phonemes and eight (which is the size of one of the smaller visual unit sets).
The choice of visual units in lipreading has caused some debate. Some workers use visemes (for example Fisher [13] in which visemes are a theoretical construct representing phonemes that should look identical on the lips [60]). Others, e.g., [24] have noted that lipreading using phonemes can give superior performance to visemes. Here, we supply further evidence to the more nuanced hypothesis first presented in [31], that there are intermediate units, which for convenience we call visual units, that can provide superior performance provided they are derived by an analysis of the data. A good number of visual units in a set is higher than previously thought.
We have also presented a novel learning algorithm which shows improved performance for these new data-driven visual units by using them as an intermediate step in training phoneme classifiers. The essence of our method is to retrain the visual unit models in a fashion similar to hierarchical training. This two-pass approach on the same training data has improved the training of phoneme-labeled classifiers and increased the classification performance.
We have also investigated the relationship between classifier unit choice with the unit choice for the supporting language network. We have shown that one can choose either phoneme or words without significantly different accuracy, but recommend a word net as this reduces the effect of homophene error and enables unbiased comparison of classifier performance.
In future works we would seek to experiment if this hierarchical training method would achieve the same benefit to other classification techniques, for example RBMs. This is inspired by the work in [61,62] and other recent hybrid HMM studies such as [63].
Author Contributions
H.B. and R.H conceived and designed the experiments; H.B.performed the experiments; H.B and R.H analyzed the data; H.B and R.H wrote the paper.
Funding
This research was funded by EPSRC grant number 1161995. The APC was funded by Queen Mary University of London.
Acknowledgments
We would like to thank our colleagues at the University of Surrey who were collaborators in building the RMAV dataset.
Conflicts of Interest
The authors declare no conflict of interest.
Appendix A
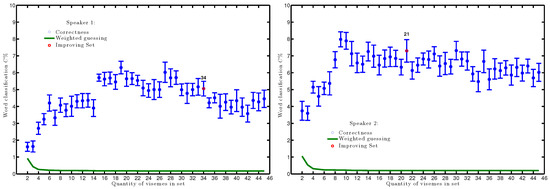
Figure A1.
Speaker 1 (left) and Speaker 2 (right): word correctness, for P2V map sizes 2–45. Set 34 (red) is significantly better than set 35.
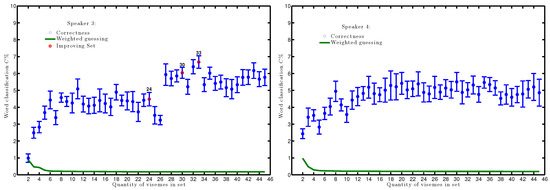
Figure A2.
Speaker 3 (left) and Speaker 4 (right): word correctness, for P2V map sizes 2–45. Sets 24, 30, and 33 (red) are significantly better than sets 25, 31, and 34 respectively.
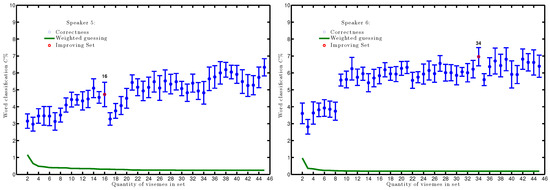
Figure A3.
Speaker 5 (left) and Speaker 6 (right): word correctness, for P2V map sizes 2–45. Set 16 (red) is significantly better than set 17.
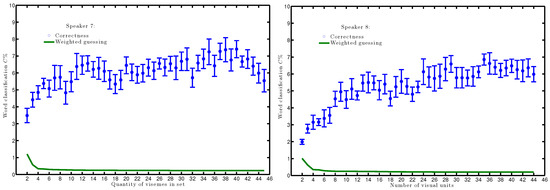
Figure A4.
Speaker 7 (left) and Speaker 8 (right): word correctness, for P2V map sizes 2–45.
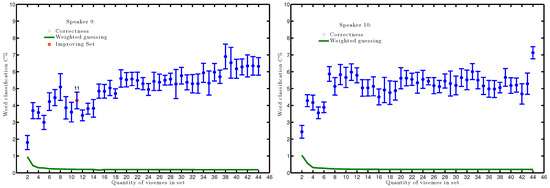
Figure A5.
Speaker 9 (left) and Speaker 10 (right) : word correctness, for P2V map sizes 2–44. Set 11 (red) is significantly better than set 12.
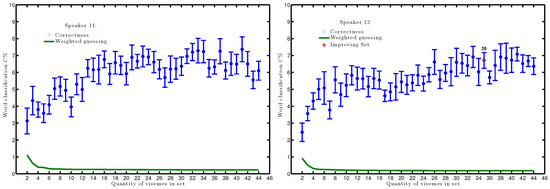
Figure A6.
Speaker 11 (left) and Speaker 12 (right): word correctness, for P2V map sizes 2–44.
References
- Association, I.P. Handbook of the International Phonetic Association: A Guide to the Use of the International Phonetic Alphabet; Cambridge University Press: Cambridge, UK, 1999; pp. 1–216. [Google Scholar]
- Hinton, G.; Deng, L.; Yu, D.; Dahl, G.E.; Mohamed, A.R.; Jaitly, N.; Senior, A.; Vanhoucke, V.; Nguyen, P.; Sainath, T.N.; et al. Deep neural networks for acoustic modeling in speech recognition: The shared views of four research groups. IEEE Signal Process Mag. 2012, 29, 82–97. [Google Scholar] [CrossRef]
- Wöllmer, M.; Eyben, F.; Schuller, B.; Rigoll, G. Recognition of spontaneous conversational speech using long short-term memory phoneme predictions. In Proceedings of the 11th Annual Conference of the International Speech Communication Association, Makuhari, Chiba, Japan, 26–30 September 2010; pp. 1946–1949. [Google Scholar]
- Triefenbach, F.; Jalalvand, A.; Schrauwen, B.; Martens, J.P. Phoneme recognition with large hierarchical reservoirs. In Advances in Neural Information Processing Systems; The MIT Press: Cambridge, MA, USA, 2010; pp. 2307–2315. [Google Scholar]
- Bear, H.L.; Harvey, R. Decoding visemes: Improving machine lip-reading. In Proceedings of the International Conference Acoustics, Speech and Signal Processing (ICASSP), Shanghai, China, 20–25 March 2016; pp. 2009–2013. [Google Scholar]
- Cappelletta, L.; Harte, N. Viseme definitions comparison for visual-only speech recognition. In Proceedings of the 2011 19th Signal Processing Conference, Barcelona, Spain, 29 August–2 September 2011; pp. 2109–2113. [Google Scholar]
- Goldschen, A.J.; Garcia, O.N.; Petajan, E.D. Rationale for phoneme-viseme mapping and feature selection in visual speech recognition. Speechreading Hum. Mach. 1996, 505–515. [Google Scholar]
- Bear, H.L.; Harvey, R. Phoneme-to-viseme mappings: the good, the bad, and the ugly. Speech Commun. 2017, 95, 40–67. [Google Scholar] [CrossRef]
- Montgomery, A.A.; Jackson, P.L. Physical characteristics of the lips underlying vowel lipreading performance. J. Acoust. Soc. Am. 1983, 73, 2134–2144. [Google Scholar] [CrossRef] [PubMed]
- Walden, B.E.; Prosek, R.A.; Montgomery, A.A.; Scherr, C.K.; Jones, C.J. Effects of training on the visual recognition of consonants. J. Speech Lang. Hear. Res. 1977, 20, 130. [Google Scholar] [CrossRef] [PubMed]
- Neti, C.; Potamianos, G.; Luettin, J.; Matthews, I.; Glotin, H.; Vergyri, D.; Sison, J.; Mashari, A.; Zhou, J. Audio-Visual Speech Recognition; Final Workshop 2000 Report; John Hopkins School of Engineering: Baltimore, MD, USA, 2000; Volume 764, pp. 40–41. Available online: https://www.clsp.jhu.edu/workshops/00-workshop/audio-visual-speech-recognition/ (accessed on 4 September 2012).
- Woodward, M.F.; Barber, C.G. Phoneme perception in lipreading. J. Speech Lang. Hear. Res. 1960, 3, 212. [Google Scholar] [CrossRef] [PubMed]
- Fisher, C.G. Confusions among visually perceived consonants. J. Speech Lang. Hear. Res. 1968, 11, 796. [Google Scholar] [CrossRef] [PubMed]
- Finn, K.E.; Montgomery, A.A. Automatic optically-based recognition of speech. Pattern Recognit. Lett. 1988, 8, 159–164. [Google Scholar] [CrossRef]
- Lee, S.; Yook, D. Audio-to-visual conversion using Hidden Markov Models. In PRICAI 2002: Trends in Artificial Intelligence; Springer: Berlin/Heidelberg, Germany, 2002; pp. 563–570. [Google Scholar]
- Bozkurt, E.; Erdem, C.; Erzin, E.; Erdem, T.; Ozkan, M. Comparison of phoneme and viseme based acoustic units for speech driven realistic lip animation. In Proceedings of the 2007 3DTV Conference, Kos Island, Greece, 7–9 May 2007; pp. 1–4. [Google Scholar]
- Shaikh, A.A.; Kumar, D.K.; Yau, W.C.; Azemin, M.C.; Gubbi, J. Lip reading using optical flow and support vector machines. In Proceedings of the 2010 3rd International Congress on Image and Signal Processing (CISP), Yantai, China, 16–18 October 2010; Volume 1, pp. 327–330. [Google Scholar]
- Bear, H.L.; Harvey, R.; Theobald, B.J.; Lan, Y. Resolution limits on visual speech recognition. In Proceedings of the 2014 IEEE International Conference on Image Processing (ICIP), Paris, France, 27–30 October 2014; pp. 1371–1375. [Google Scholar]
- Binnie, C.A.; Jackson, P.L.; Montgomery, A.A. Visual intelligibility of consonants: A lipreading screening test with implications for aural rehabilitation. J. Speech Hear. Disord. 1976, 41, 530. [Google Scholar] [CrossRef]
- Lander, J. Read My Lips: Facial Animation Techniques; The Disney synthesis shapes for visual speech animation. Available online: http://www.gamasutra.com/view/feature/131587/read_my_lips_facial_animation_.php (accessed on 28 January 2014).
- Nitchie, E.B. Lip-Reading, Principles and Practise: A Handbook for Teaching and Self-Practise; Frederick A Stokes Co.: New York, NY, USA, 1912. [Google Scholar]
- Bear, H.L.; Owen, G.; Harvey, R.; Theobald, B.J. Some observations on computer lip-reading: Moving from the dream to the reality. In SPIE Security+ Defence. International Society for Optics and Photonics; SPIE: Bellingham, MA, USA, 2014; p. 92530G. [Google Scholar]
- Thangthai, K.; Bear, H.L.; Harvey, R. Comparing phonemes and visemes with DNN-based lipreading. In Proceedings of the British Machine Vision Conference (BMVC) Deep Learning for Machine Lip Reading Workshop, British Machine Vision Association (BMVA), London, UK, 7 September 2017; pp. 23–33. [Google Scholar]
- Howell, D.; Theobald, B.J.; Cox, S. Confusion Modelling for Automated Lip-Reading using Weighted Finite-State Transducers. Audit.-Vis. Speech Process. (Avsp) 2013, 2013, 197–202. [Google Scholar]
- Gault, R.H. Discrimination of Homophenous Words by Tactual Signs. J. Gen. Psychol. 1929, 2, 212–230. [Google Scholar] [CrossRef]
- Jeffers, J.; Barley, M. Speechreading (Lipreading); Thomas: Springfield, IL, USA, 1971. [Google Scholar]
- Bear, H.L. Visual gesture variability between talkers in continuous visual speech. In Proceedings of the British Machine Vision Conference (BMVC) Deep Learning for Machine Lip Reading Workshop, British Machine Vision Association (BMVA), London, UK, 7 September 2017; pp. 12–22. [Google Scholar]
- Bear, H.L.; Harvey, R. Comparing heterogeneous visual gestures for measuring the diversity of visual speech signals. Comput. Speech Lang. 2018, 52, 165–190. [Google Scholar] [CrossRef]
- Young, S.; Evermann, G.; Gales, M.; Hain, T.; Kershaw, D.; Liu, X.A.; Moore, G.; Odell, J.; Ollason, D.; Povey, D.; et al. The HTK Book (for HTK Version 3.4); Cambridge University Engineering Department: Cambridge, UK, 2006. [Google Scholar]
- Ngiam, J.; Khosla, A.; Kim, M.; Nam, J.; Lee, H.; Ng, A.Y. Multimodal deep learning. In Proceedings of the 28th International Conference on Machine Learning (ICML-11), Bellevue, WA, USA, 28 June–2 July 2011; pp. 689–696. [Google Scholar]
- Bear, H.L.; Harvey, R.; Theobald, B.J.; Lan, Y. Finding phonemes: Improving machine lip-reading. In Proceedings of the 1st Joint International Conference on Facial Analysis, Animation and Audio-Visual Speech Processing (FAAVSP), ISCA, Vienna, Austria, 11–13 September 2015; pp. 190–195. [Google Scholar]
- Labov, W.; Ash, S.; Boberg, C. The Atlas of North American English: Phonetics, Phonology and Sound Change; Walter de Gruyter: Berlin, Germany, 2005. [Google Scholar]
- Franks, J.R.; Kimble, J. The confusion of English consonant clusters in lipreading. J. Speech Lang. Hear. Res. 1972, 15, 474. [Google Scholar] [CrossRef] [PubMed]
- Kricos, P.B.; Lesner, S.A. Differences in visual intelligibility across talkers. Volta Rev. 1982, 82, 219–226. [Google Scholar]
- Hazen, T.J.; Saenko, K.; La, C.H.; Glass, J.R. A Segment-based Audio-visual Speech Recognizer: Data Collection, Development, and Initial Experiments. In Proceedings of the 6th International Conference on Multi-modal Interfaces, State College, PA, USA, 13–15 October 2004; ACM: New York, NY, USA, 2004; ICMI ’04, pp. 235–242. [Google Scholar] [CrossRef]
- Potamianos, G.; Graf, H.P.; Cosatto, E. An image transform approach for HMM based automatic lipreading. In Proceedings of the IEEE International Conference Image Processing (ICIP), Chicago, IL, USA, 7 October 1998; pp. 173–177. [Google Scholar]
- Petridis, S.; Wang, Y.; Li, Z.; Pantic, M. End-to-End Multi-View Lipreading. In Proceedings of the BMVA British Machine Vision Conference (BMVC), London, UK, 7 September 2017; pp. 1–12. [Google Scholar]
- Stafylakis, T.; Tzimiropoulos, G. Combining Residual Networks with LSTMs for Lipreading; Interspeech: Graz, Austria, 2017; pp. 3652–3656. [Google Scholar]
- Le Cornu, T.; Milner, B. Generating intelligible audio speech from visual speech. IEEE/Acm Trans. Audio Speech Lang. Process. 2017, 25, 1751–1761. [Google Scholar] [CrossRef]
- Lan, Y.; Theobald, B.J.; Harvey, R.; Ong, E.J.; Bowden, R. Improving visual features for lip-reading. In Proceedings of the International Conference on Audio-Visual Speech Processing Hakone, Kanagawa, Japan, 30 September–3 October 2010. [Google Scholar]
- Cambridge University. BEEP Pronounciation Dictionary; Cambridge University: Cambridge, UK, 1997. [Google Scholar]
- Bear, H.L.; Taylor, S. Visual speech processing: Aligning terminologies for better understanding. In Proceedings of the British Machine Vision Conference (BMVC) Deep Learning for Machine Lip Reading Workshop, British Machine Vision Association (BMVA), London, UK, 7 September 2017; pp. 1–11. [Google Scholar]
- Fisher, W.M.; Doddington, G.R.; Goudie-Marshall, K.M. The DARPA speech recognition research database: Specifications and status. In Proceedings of the DARPA Workshop on Speech Recognition, Palo Alto, CA, USA, 19–20 February 1986; pp. 93–99. [Google Scholar]
- Ong, E.; Bowden, R. Robust Facial Feature Tracking Using Shape-Constrained Multi-Resolution Selected Linear Predictors. IEEE Trans. Pattern Anal. Mach. Intell. 2011, 33, 1844–1859. [Google Scholar] [PubMed]
- Matthews, I.; Baker, S. Active Appearance Models Revisited. Int. J. Comput. Vis. 2004, 60, 135–164. [Google Scholar] [CrossRef]
- Matas, J.; Zimmermann, K.; Svoboda, T.; Hilton, A. Learning efficient linear predictors for motion estimation. Springer Comput. Vision Graph. Image Process. 2006, 4338, 445–456. [Google Scholar]
- Efron, B.; Gong, G. A leisurely look at the bootstrap, the jackknife, and cross-validation. Am. Stat. 1983, 37, 36–48. [Google Scholar]
- Holmes, W. Speech Synthesis and Recognition; CRC Press: Boca Raton, FL, USA, 2001. [Google Scholar]
- Forney, G.D. The Viterbi algorithm. Proc. IEEE 1973, 61, 268–278. [Google Scholar] [CrossRef]
- Matthews, I.; Cootes, T.; Bangham, J.; Cox, S.; Harvey, R. Extraction of visual features for lipreading. Pattern Anal. Mach. Intell. 2002, 24, 198–213. [Google Scholar] [CrossRef]
- Welch, L.R. Hidden Markov models and the Baum-Welch algorithm. IEEE Inf. Theory Soc. Newsl. 2003, 53, 10–13. [Google Scholar]
- Luettin, J.; Thacker, N.; Beet, S. Speaker identification by lipreading. Spok. Lang. (ICSLP) 1996, 1, 62–65. [Google Scholar]
- Bear, H.L.; Cox, S.J.; Harvey, R.W. Speaker-independent machine lip-reading with speaker-dependent viseme classifiers. In Proceedings of the The 1st Joint Conference on Facial Analysis, Animation, and Auditory-Visual Speech Processing, Vienna, Austria, 11–13 September 2015; pp. 190–195. [Google Scholar]
- Taylor, S.; Theobald, B.J.; Matthews, I. The effect of speaking rate on audio and visual speech. In Proceedings of the 2014 IEEE Acoustics, Speech and Signal Processing (ICASSP), Florence, Italy, 4–9 May 2014; pp. 3037–3041. [Google Scholar]
- Bear, H.L.; Harvey, R.W.; Theobald, B.J.; Lan, Y. Which Phoneme-to-Viseme Maps Best Improve Visual-Only Computer Lip-Reading. In Advances in Visual Computing; Springer: Las Vegas, NV, USA, 2014; pp. 230–239. [Google Scholar]
- Morgan, N. Deep and wide: Multiple layers in automatic speech recognition. IEEE Trans. Audio Speech Lang. Process. 2012, 20, 7–13. [Google Scholar] [CrossRef]
- Carnegie Mellon University. CMU Pronunciation Dictionary; Carnegie Mellon University: Pittsburgh, PA, USA, 2008. [Google Scholar]
- Young, S.J.; Evermann, G.; Gales, M.; Kershaw, D.; Moore, G.; Odell, J.; Ollason, D.; Povey, D.; Valtchev, V.; Woodland, P. The HTK Book Version 3.4; Cambridge University Engineering Department: Cambridge, UK, 2006. [Google Scholar]
- Lan, Y.; Harvey, R.; Theobald, B.J. Insights into machine lip reading. In Proceedings of the International Conference on Acoustics, Speech and Signal Processing (ICASSP), Kyoto, Japan, 25–30 March 2012; pp. 4825–4828. [Google Scholar]
- Hazen, T.J. Visual model structures and synchrony constraints for audio-visual speech recognition. IEEE Trans. Audio Speech Lang. Process. 2006, 14, 1082–1089. [Google Scholar] [CrossRef]
- Mousas, C.; Anagnostopoulos, C.N. Real-time performance-driven finger motion synthesis. Comput. Graph. 2017, 65, 1–11. [Google Scholar] [CrossRef]
- Nam, J.; Herrera, J.; Slaney, M.; Smith, J.O. Learning Sparse Feature Representations for Music Annotation and Retrieval; ISMIR: Montreal, QC, Canada, 2012; pp. 565–570. [Google Scholar]
- Thangthai, K. Computer Lipreading via Hybrid Deep Neural Network Hidden Markov Models. Ph.D. Thesis, University of East Anglia, Norwich, UK, 2018. [Google Scholar]
© 2019 by the authors. Licensee MDPI, Basel, Switzerland. This article is an open access article distributed under the terms and conditions of the Creative Commons Attribution (CC BY) license (http://creativecommons.org/licenses/by/4.0/).