Abstract
The cable cross section of an offshore wind farm power system is conventionally determined on the basis of the maximum current carrying capacity. However, this criterion cannot be matched and optimized with connection topology, which may lead to a large overall resistance level in the topology, thereby causing severe energy loss. In this pursuit, the present work envisages the establishment of a coupling optimization method of connection topology and cable cross-section planning for the first time. Based on this method, the power system of a small discrete wind farm is optimized and its results are compared with the results of the traditional design methods. The results indicate that an optimal matching of connection topology and cable cross section can be achieved using the proposed method. Besides, the optimal topology obtained uses more branches, and the large cross-section cables are reasonably used on the large-current cable segments, thus dramatically reducing the energy loss and minimizing the total cost of the power system. The proposed method is very versatile and suitable for the optimization of power systems containing any number of wind turbines and substations. Moreover, it can be combined with any evolutionary algorithm.
1. Introduction
Currently, the large-scale utilization of offshore wind energy is restricted due to its development costs, which are significantly greater than the onshore wind farms. The cost of power systems accounts for 15–30% of the total development cost of offshore wind farm based on the depth of water and the seabed characteristics [1,2]. Therefore, the realization of the optimal design of power systems is of great significance for improving the economics of the offshore wind farm.
A large amount of research on the optimization of power systems in offshore wind farms has been developed. In these researches, the main idea is to reduce the one-time investment cost by improving the power calculation model, topology model, and optimization algorithm, and these advances have been well summarized in the review articles [3,4,5,6]. However, the impact of energy loss on the topology and economy of power systems has not received sufficient attention or an adequate evaluation. A large amount of energy loss occurs in the medium-voltage power network, and the cost of energy loss exceeds the cable cost in the 20 years of wind farm operating life, which is revealed in a literature analysis of a small wind farm containing 25 wind turbines [7].
The magnitude of the energy loss in a medium-voltage power network is determined by the overall resistance level in its topology. The reduction of the overall resistance level in the topology requires not only a reasonable planning of the cross-section of cable but also optimal matching with its topology [7]. Therefore, it is necessary to carry out the coupling optimization of the connection topology and the cable cross-section. However, the optimization of topology and the planning of cable cross-section are performed independently in the current power system design so that the most economical power system solution is theoretically unavailable.
Currently, the design of the cable cross-section is based on the maximum current-carrying criterion [8,9,10]. This method of design is to determine the cable cross-section after the connection topology is obtained, according to the rule that the maximum current on each cable segment in the topology should not exceed the allowable current capacity of the cable. At the same time, the safety constraints such as the voltage drop [4] and the thermal stability [10] need to be strictly met. In the solution obtained according to the principle of maximum current carrying capacity, the cross-section of each cable segment in the topology should be the smallest, and this minimizes the cost of the cable. However, the resistance increases as the cross-sectional area of the cable decreases, resulting in greater power loss during the service life of the power system for at least 20 years. According to an earlier report [11], by properly employing the large cross-section cables on cable segments with large currents in the topology, the power loss caused by the resistors was found to be greatly reduced, thereby effectively improving the economics of the power system.
Another factor that has a significant impact on the overall resistance level is the topology. Currently, the minimum spanning tree (MST) derived from the graph theory is the most widely used in topology optimization of power systems [12,13,14,15,16,17,18]. In the MST architecture, the wind turbine and topology are treated as nodes and directed connectivity graphs, respectively, to obtain the topology with the shortest total cable length. Initially, all wind turbines are used to perform the topology generation of the MST [12,13]. However, the topologies generated in this manner are often insufficient to meet all of the power parameter constraints [14,15]. To solve this problem, clustering algorithms such as random combination [16], k-mean clustering [17], and fuzzy c-means clustering [18] were also applied to perform the grouping of the wind turbine groups, and then MST was used to generate connections for each group. In addition, the location of the substation has a significant impact on the connection topology, and some studies have proved an optimal matching between the two [19,20,21,22,23,24]. In these studies, the spatial coordinates of the substation were taken as variables, and the shortest cable length [19,20,21], minimum investment [22], maximum benefit [23], and minimum energy loss [24] were taken as optimization targets. Subsequently, the optimal substation locations and matching topology were obtained by using MST to generate connections and combine the optimization algorithms. A joint optimization of the wind turbine locations and the connection topology at a given annual wind speed distribution has also been carried out in some studies to improve the economics of the entire wind farm [25,26,27]. In the literature [10,24,28], when the energy loss of the topology was included in the cost model, the optimization results showed that the energy loss was effectively reduced by improving the topology structures. In the selection of optimization algorithms, the optimization of the power system involved complex connections between wind turbines and substations, and a large number of constraints on power parameters, being revealed as a non-convex, discontinuous, NP-complete complex optimization problem [29,30]. To cope with such problems, evolutionary algorithms such as genetic algorithms [20,22], PSO [25], and MOEA [31] were considered to be ideal optimization algorithms, since they could be applied to any number of design variables and tolerate random errors generated during the search process. In addition, classical optimization algorithms such as nonlinear programming [24,32] and quadratic programme [33] have also been applied.
From the review of the existing literature, it can be concluded that the cable cross-section of the power system is traditionally determined according to the principle of maximum current carrying capacity, and the matching optimization with the connection topology cannot be achieved. This situation may cause the overall topological resistance level to increase significantly, resulting in severe energy loss. In this pursuit, we develop a new coupling optimization method for the connection topology and the cable cross-section. The proposed method designed the power system of a typical discrete wind farm, and the results are compared with the traditional step-by-step method. Moreover, the effects of the energy loss on the power system economics and topology are also evaluated, and the effectiveness of the proposed method is discussed.
2.Mathematical Modelling
2.1. Modelling of Connection Topology and Cable Cross-Section
In this study, the commonly used tree topology is adopted in the medium-voltage power network. The topology is modelled as a directed graph G (V, E), where V are nodes representing the wind turbines or substations in the topology; E is the edges connecting the nodes. An essential characteristic of the tree topology is that if there is no loop in the topology, a connection is sent from each node, which inevitably forms a standard tree topology. Based on this, in the constructed topology model, any wind turbine node Vi of the wind farm can randomly generate a pointing node Vj to connect Eij. When all of the wind turbine nodes have completed the connection generation, a directed graph G (V, E) is automatically formed. The adjacency matrix A can be used to describe the relationship between the wind turbines and the substations, as shown in Equation (1).
where n is the number of nodes in G, which is the sum of the number of substations NOS and the number of wind turbines NWT in the wind farm. As shown in Figure 1, the adjacency matrix A is an asymmetric matrix, forming four sub-regions, of which Area I represents the connection relationship between substations. Area II describes the connection relationship of the substations to the wind turbines. Since the substations were directly connected to the land access point, having no directional connection to the wind turbines or other substations, all the elements in this area were zero. Area III describes the connection relationship among wind turbines. Area IV describes the connection of the wind turbines to the substations. In the adjacency matrix A, any one of the elements ai,j represents that the current generated by the node i in the topology flows through the node j to the substation.
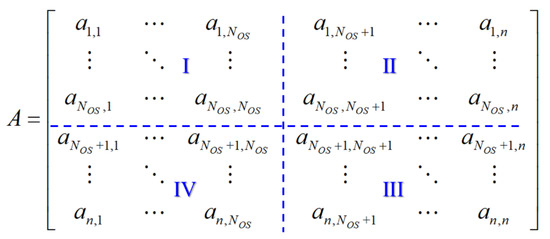
Figure 1.
Adjacency matrix and region division.
For a clearer explanation, a simple topology consisting of eight wind turbines is taken as an example to illustrate the characteristics of the proposed model. As shown in Figure 2a,b, the example topology and the formed adjacency matrix are shown, respectively, where WT represents the wind turbine. The adjacency matrix A is a 9 × 9 matrix, describing the connections and current flow between one substation and eight wind turbines. The first column represents the connection of the wind turbine to the substation, and its elements in rows 2 and 5 are all 1, indicating that two wind turbines (WT1 and WT4) are connected to the substation. The element in the 3rd row of the second column is 1, indicating that a wind turbine (WT2) is connected to the wind turbine Similarly, the elements in the 6nd and 8th rows of the fifth column are all 1, indicating that two wind turbines (WT5 with WT7) are connected to the wind turbine It can be concluded that the adjacency matrix clearly shows the connection relationship between the wind turbines and the substations in the topology, which is more conducive to the calculation and analysis of the power parameters.
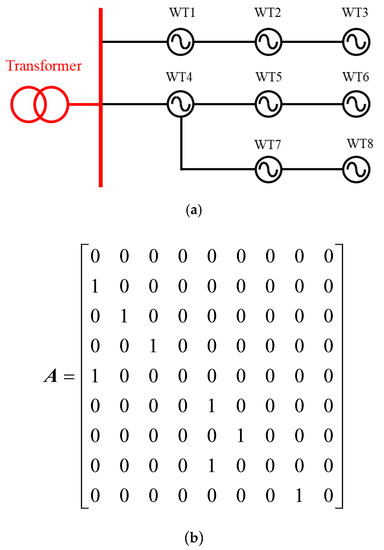
Figure 2.
Connection topology and adjacency matrix in the example: (a) Topology; (b) Adjacency Matrix.
Since the proposed connection topology was randomly generated, there can be loops in the topology, which is strictly prohibited in the tree topology. The identification and counting of loops in the topology adopts a very mature union-find set algorithm in the graph theory [34,35].
The smallest cable cross-section scheme obtained by the traditional method of cable cross-section planning based on the maximum current-carrying criteria may result in severe power loss [7]. In the present study, any cable segment i in the directed graph G was randomly selected among different types of available cables, so there were NC variables, and NC was the number of cable segments. In addition, a constraint selection strategy was established to reduce the optimized search space. The main ideas are as follows: firstly, the maximum current Ii,max on any cable segment i in the directed graph G was calculated; subsequently, the cable type of the allowable current carrying capacity exceeding Ii,max was placed in a set SCi; and finally, one type of cable was randomly selected with the uniform probability in the SCi.
The coupling optimization of the connection topology and cable section included a total of NWT and NC variables according to the proposed model.
2.2. Annual Energy Loss Model
The annual energy loss of the wind farm power system is an analysis of the energy loss in all cable segments at a specified annual wind speed distribution. The expression is shown in Equation (2).
where U is the wind speed of the wind farm; Ii(U) s the current on cable segment i when the wind speed is V; T is the annual number of hours; and f (U) is the Weibull probability distribution function.
The rated current of the cable section needs to be included in the sum of the currents generated by all the wind turbines flowing through it to the substation. To calculate the rated current of any cable segment i, a subset of SVi is required for the cable segment to save the wind turbine number. The current of the cable segment i at the wind speed U is calculated by Equation (3).
where Pj(U) is the output power of wind turbine j at wind speed U; UN is the rated voltage for medium-voltage network; and is the power factor taken as 0.95.
2.3. Branch Voltage Drop Model
The maximum voltage drop in each branch in the topology needs to be controlled within a certain range. The impedance, maximum current carrying capacity, etc., of each cable segment is determined after the cross-sectional area thereof is determined. A subset SFi is created for each branch Fi to hold the number of all cable segments subordinate to this branch, and then the maximum voltage drop for this branch is calculated using Equation (4) [36].
where NF,I is the number of cable segments in SFi; Rj is conductor resistance of the cable segment j; Xj is inductive reactance of the cable segment j [37]; and lj and IE,j are the length and rated current of the cable segment j, respectively. The maximum voltage drop of the branch is less than 1%.
2.4. Cost Model
The total power system CTotal involves one investment cost of submarine cables and the energy loss cost of power system, consisting of four parts, as shown in Equation (5).
Cable cost CCable is divided into high-voltage and low-voltage cable costs, which are functions of cable length and cross-sectional area, and is given in Equation (6).
where NM and NH are the number of medium and high-voltage cable segments, respectively; and are the length of the ith medium-voltage cable section and the unit length price of the corresponding cable, respectively; and and are the length of the high-voltage cable section i and the unit length price of the corresponding cable, respectively.
The construction cost CConst represents the cost of trench construction for subsea medium- and high-voltage cables, and is shown in Equation (7).
where, cT is the construction cost per unit length, and its value is 21,000 USD/km according to engineering experience [7].
The energy loss cost CLoss is the sum of the energy loss costs of the power network topology lifetime, and is shown in Equation (8).
where τ is the design life of the wind farm, taken as 20 years; q is the discount factor, taken as 0.02; EAL is the annual power loss of the power network; and cEP is the unit price of the wind farm sold to the grid, taken as 0.05 USD/kWh.
Substation cost COS is an empirical formula related to rated power and is fitted based on a large amount of data [38], shown in Equation (9).
where PSR is the rated power of offshore substations. Ap, Bp, and β are constant coefficients, taken as −205,000, 364.6, and 0.4473, respectively.
2.5. Description of the Optimization Problem
The optimization goal was to minimize the total cost of the power network, and a large number of equations and inequality constraints were met in the optimization process, such as the current of any cable segment was less than the allowable current carrying capacity of the cable, the voltage drop of each branch was less than the allowable voltage drop, the number of loops in the entire network was 0). The minimization is shown in Equation (10).
satisfying:
where IP,i is the allowable current carrying capacity of cable segment I, is the allowable voltage drop of the branch, and NFeeder is the number of branches in the topology.
2.6. Optimization Algorithm and Framework
The Omni optimizer developed by Deb et al. [39] was used by the optimization algorithm. The Omni optimizer is a powerful and universal optimization tool, being used to solve single-objective and multi-objective optimization problems with complex constraints. It integrates a series of efficient operators such as using SBX crossover and polynomial variation to generate new individuals and adopting ε-decision and adaptive niche techniques to maintain population diversity and avoid local convergence. However, it also integrates an efficient constraint handling mechanism that can handle any number of equality and inequality constraints. The Omni optimizer has been tested by a number of standard functions representing different features, including non-convex, nonlinear, and discontinuous, containing a large number of optimized variables and constraints, which have been proven to have excellent performances [39].
The dominant selection constraint mechanism is adopted to deal with a large number of constraints in the power system optimization [39,40]. This mechanism uses the binary tournament selection, where two solutions are picked from the population and the better solution is chosen. In the presence of constraints, each solution can be either feasible or infeasible. There may be at most three situations: (a) both solutions are feasible, (b) one is feasible and other is not, and (c) both are infeasible. Thereby, a simple domination rule is used for each case. A solution i is said to constrained-dominate a solution j, if any of the following conditions is true. (1) Solution i is feasible and solution j is not, (2) solutions i and j are both infeasible but solution i has a smaller overall constraint violation, and (3) solutions i and j are feasible and solution i has a better objective value than solution j. Since in no case constraints and objective function value are compared with each other, there is no need of having any penalty parameter. Moreover, the mechanism only needs to modify the selection operation of the optimization algorithm, and can be combined with various evolutionary algorithms.
Coupled with the Omni optimizer, the connection topology and optimized framework for the wind farm power system are shown in Figure 3. The specific steps were as follows: First, the coordinates of the wind turbine group and basic parameters such as cables and algorithms were entered as the input; the variables of the connection topology and cable cross section were coded; the initial population was randomly generated, and the power parameters of the generated topology were analyzed to obtain the values of the optimization target and the constraints; and the Omni optimizer’s crossover, mutation, and elite preservation operations were performed to generate new population. Finally, the convergence was judged; if it converged, the result of the optimization was an output; if there was no convergence, the population was updated and the optimization operation of t + 1 generation was carried out.
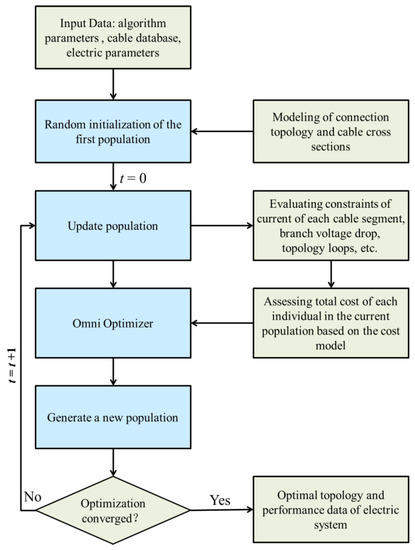
Figure 3.
Optimization process of wind farm power system.
3. Case Studies
The optimization of a power system with an irregular wind farm of 25 wind turbines was used to describe the impact of power loss on the economics of the power system. The AeroDyn 2.5 MW wind turbines were selected as energy inputs to the power system, having a rotor with a diameter of 103.2 m, and the curve of the power with the wind speed is shown in Figure 4. The wind turbine group was randomly distributed within a range of 10 km × 10 km, and the distance between any two wind turbines was greater than 10 times the diameter of the rotor. The power loss caused by the wake effect between the wind turbines was neglected due to the extremely dispersed distribution of the wind turbines. The offshore substation (OS) was fixed in the middle of the wind farm with coordinates (0.5 km, 0.5 km), and the coordinates of the onshore connection point (OCP) were (0.5 km, −0.5 km).
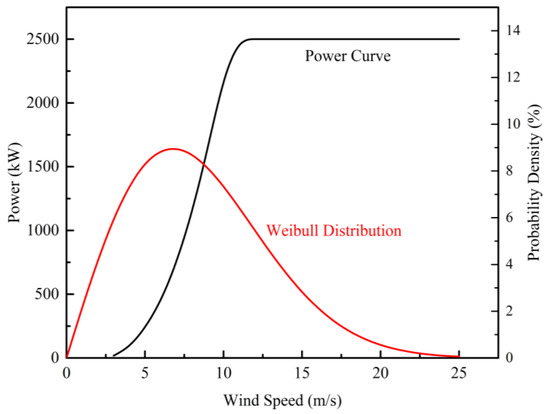
Figure 4.
Power curve of AeroDyn 2.5 MW and Weibull wind speed distribution.
The medium-voltage and high-voltage power networks were constructed with 30 kV and 220 kV, respectively. The available cable contained eight cross-sectional areas (mm2) of 50, 70, 120, 150, 185, 240, 400, and 500, respectively. The cost and basic technical parameters of the cable were obtained from the reference [7]. The resistances and reactances of the cables as a function of the cross-sections are shown in Figure 5. In the literature, the price of the cable was denominated in Polish Zloty (PLN), which was converted to USD denominated (USD) at a rate of 1 PLN = 0.2625 USD. The power of the offshore substation was 75 MVA.
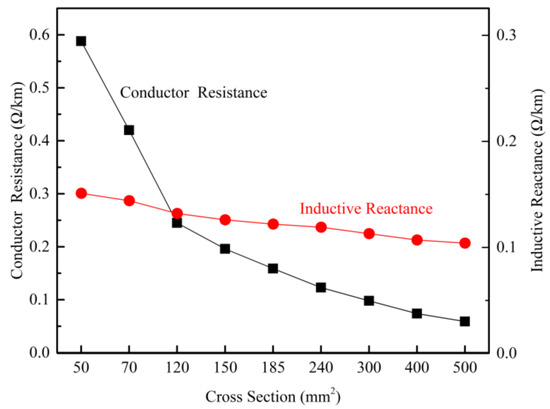
Figure 5.
The resistances and reactances of the cables.
The wind speed distribution of the wind farm was set according to the Class II wind farm of the GL2010 design standard, wherein Weibull shape parameters and annual mean wind speed distributions were 2 and 8.5 m/s.
In the illustration adopted, the population size was taken as 100, the largest evolutionary generation was 5000, and the crossover and mutation rates were 0.9 and 0.01, respectively.
A total of three scenarios were set up for the optimization of the power system. Script 1 employs a traditional step-by-step design approach in which the connection topology was generated by the MST and then the cable cross-section was designed according to the principle of maximum current carrying capacity. Script 2 also used MST to generate a topology, but it optimized the cross-section of the cable. Script 3 performed a coupling optimization of topology and cable cross sections. All scripts are run for a maximum of 5000 function evaluations and converged to the final solutions after about 3500 generations. The optimal topology and cable cross section schemes obtained from the above three scripts are given in Figure 6, Figure 7 and Figure 8. The length comparison of the different cross-section cables used in the three script optimal solutions is shown in Figure 9. A comparison of the key economic parameters of the power systems is given in Table 1.
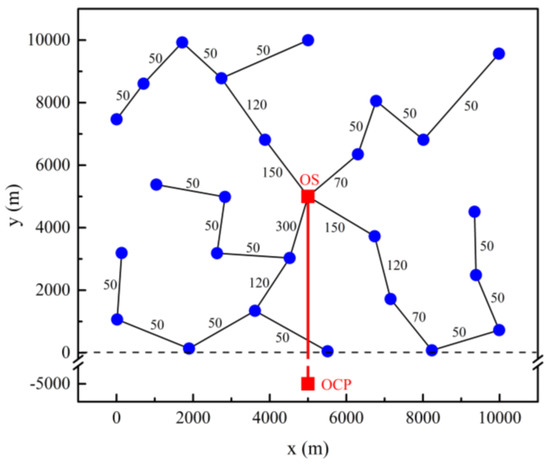
Figure 6.
Topology optimization based on minimum spanning tree (MST) and cable cross-section planning according to the principle of maximum current carrying capacity (Scenario 1).
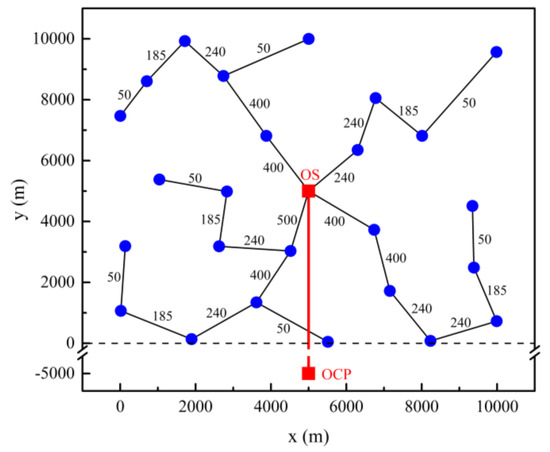
Figure 7.
Topology optimization based on MST and optimization of the cable cross-sections (Scenario 2).
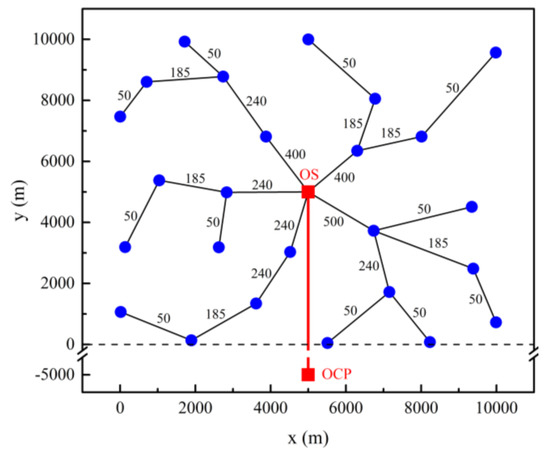
Figure 8.
Coupling optimization of the connection topology and the cable cross-sections (Scenario 3).
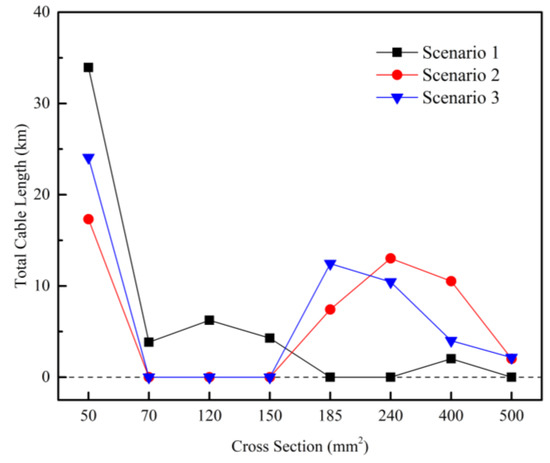
Figure 9.
Comparison of lengths of different cross-sectional cables used in the topology.

Table 1.
Comparison of key economic parameters of topology.
Scenario 1 used MST to generate a connection topology, thus obtaining the topology with the shortest total cable length. The optimal topology formed four branches, and the number of wind turbines in the branch was 4, 6, 9, and 6, respectively. From the perspective of cost composition, the energy loss cost in the 20-year operation period was the main expenditure part of the power system, accounting for 49.3% of the total cost, while the medium-voltage cable cost and substation cost only accounted for 15.9% and 14.7%, respectively, indicating that the power system obtained by the traditional step-by-step design method can cause a serious energy and economic losses. The main reasons are as follows: a large number of cables with small cross-sections were used in the topology according to the maximum current-carrying criterion, so that the overall resistance level of the topology remained large, resulting in a large amount of energy loss.
Scenario 2 also used MST to generate the connection topology, similar to scenario 1, so the topology obtained was exactly the same as script Scenario 2 optimized the cross-section of the cable and used a large number of cables with a cross-section of 185 mm2 to 500 mmAlthough this optimization increased the cost of medium-voltage cable from 1.27 million US dollars to 2.25 million US dollars in script 1, it also caused a significant drop in the overall topological resistance level, which reduced the annual power loss from 3495.23 MWh/a to 1202.85 MWh/a, resulting in a 65.7% reduction in power loss costs. In a comprehensive comparison, the total cost of scenario 2 was 22.2% lower than that of scenario It can be concluded that the optimization of the cable cross section can effectively reduce the development cost of the power system.
Scenario 3 carried out the coupling optimization of the connection topology and the cable cross-section, and the structure of the optimal topology obtained was significantly different from the topology generated by the MST (scenario 1 and scenario 2), wherein the number of branches were increased to 5 and the number of wind turbines per branch were 5, 7, 4, 4 and Scenario 3 allowed for an appropriate increase in the length of the cable in exchange for the best match of the topology and cable cross-section, so the total length of the medium-voltage cable was increased by 5.5% over scenario 1 and scenario Compared to scenario 1, scenario 3 employed cables with large cross-sections, resulting in a significant reduction in energy loss costs of 72.2%. Compared to scenario 2, the optimal topology used in scenario 3 adopted more branches to reduce the current in each branch, thereby reducing the use of large cables with a cross-section of 240 mm2 or more, thus successfully reducing the cost of the medium-voltage cable by 10.7%. At the same time, facilitated by the optimal matching of the connection topology to the cable cross section, the annual energy loss was further reduced to 973.27 MWh/a. In addition, the total cost of scenario 3 decreased by 27.6% and 7%, respectively, relative to scenario 1 and scenario These results show that the best match between the two were achieved by optimizing the coupling between the connection topology and the cable cross-section optimization, which could significantly reduce the power loss of the power system and achieve the goal of minimum total cost.
4. Conclusions
We aimed at the problem of severe energy loss caused by the separate design of the connection topology and the cable cross-section of current wind farm power system. In this pursuit, a coupling optimization method of connection topology and cable cross-section was first established and explained in detail. Based on the proposed method, the power system of a discrete wind farm containing 25 wind turbines was optimized and compared with the results of the traditional step-by-step design method. Our major conclusions of the study are as follows:
- (1)
- In the solution obtained according to the principle of maximum current carrying capacity, the cross-section of each cable segment in the topology is the smallest, which minimized the cable cost. However, the resistance increases as the cross-sectional area decreases, resulting in greater power loss during the service life of the power system, for at least 20 years. In the analysed wind farm power system, the energy loss cost was a major part of the power system expenditure.
- (2)
- Based on the proposed method, the coupling optimization of connection topology and cable cross-section achieved optimal matching, thus minimizing the total cost of the power system. The optimal topology obtained tended to use more branches to reduce the current of per branch and to rationally use the cables with large cross-section, thus significantly reducing the energy losses in the power system. In the analysed wind farm power system, the total cost of the power system obtained by the proposed coupling method was reduced by 27.6% compared with the traditional step-by-step method. Furthermore, the power loss was reduced by 72.2%.
- (3)
- The proposed method is very versatile and suitable for the optimisation of the power system involving any number of wind turbines, and can be combined with any evolutionary algorithm.
In future, the work can be improved in the following ways: (1) the proposed method at present is only applicable to the tree topology optimization, and modeling for other topology structures is a subject that needs to be studied further; (2) refined electric analysis models could be included in the optimization to evaluate the impact on the topology structure; and (3) gradient-based evolutionary algorithms could be taken into consideration to further accelerate the convergence process.
Author Contributions
All authors were involved during the development of the article. T.W. and L.W. conceived and designed the model setup; L.W. wrote the article and launched the formal analysis; J.W. wrote the codes to compute power output and cost. R.H. provided valuable insights throughout the research and writing process.
Funding
This research was funded by [National Nature Science Foundation of China] grant number [51506089, 51506088] And the Priority Academic Program Development of Jiangsu Higher Education Institutions.
Conflicts of Interest
The authors declare no conflict of interest.
References
- Council, G.W.E. Global Wind Energy Outlook 2014; Global Wind Energy Council: Brussels, Belgium, 2014. [Google Scholar]
- Hou, P.; Hu, W.; Chen, C.; Chen, Z. Overall optimization for offshore wind farm electrical system. Wind Energy 2017, 20, 1017–1032. [Google Scholar] [CrossRef]
- Lumbreras, S.; Ramos, A. Offshore wind farm electrical design: A review. Wind Energy 2013, 16, 459–473. [Google Scholar] [CrossRef]
- González, J.S.; Payán, M.B.; Santos, J.M.R.; Gonzalez-Longatt, F. A review and recent developments in the optimal wind-turbine micro-siting problem. Renew. Sustain. Energy Rev. 2014, 30, 133–144. [Google Scholar] [CrossRef]
- Rodrigues, S.; Restrepo, C.; Katsouris, G.; Pinto, R.T.; Soleimanzadeh, M.; Bosman, P.; Bauer, P. A multi-objective optimization framework for offshore wind farm layouts and electric infrastructures. Energies 2016, 9, 216. [Google Scholar] [CrossRef]
- Herbert-Acero, J.; Probst, O.; Réthoré, P.E.; Larsen, G.C.; Castillo-Villar, K.K. A review of methodological approaches for the design and optimization of wind farms. Energies 2014, 7, 6930–7016. [Google Scholar] [CrossRef]
- Wędzik, A.; Siewierski, T.; Szypowski, M. A new method for simultaneous optimizing of wind farm’s network layout and cable cross-sections by MILP optimization. Appl. Energy 2016, 182, 525–538. [Google Scholar] [CrossRef]
- Chen, Y.; Dong, Z.; Meng, K.; Luo, F.; Yao, W.; Qiu, J. A novel technique for the optimal design of offshore wind farm electrical layout. J. Mod. Power Syst. Clean Energy 2013, 1, 258–263. [Google Scholar] [CrossRef]
- Gonzalez-Longatt, F.M.; Wall, P.; Regulski, P.; Terzija, V. Optimal electric network design for a large offshore wind farm based on a modified genetic algorithm approach. IEEE Syst. J. 2011, 6, 164–172. [Google Scholar] [CrossRef]
- Amaral, L.; Castro, R. Offshore wind farm layout optimization regarding wake effects and electrical losses. Eng. Appl. Artif. Intell. 2017, 60, 26–34. [Google Scholar] [CrossRef]
- Đorđević, A.; Đurišić, Ž. General mathematical model for the calculation of economic cross sections of cables for wind farms collector systems. IET Renew. Power Gener. 2018, 12, 901–909. [Google Scholar] [CrossRef]
- Bauer, J.; Lysgaard, J. The offshore wind farm array cable layout problem: A planar open vehicle routing problem. J. Oper. Res. Soc. 2015, 66, 360–368. [Google Scholar] [CrossRef]
- Vasko, F.J.; Barbieri, R.S.; Rieksts, B.Q.; Reitmeyer, K.L.; Stott, K.L. The cable trench problem: Combining the shortest path and minimum spanning tree problems. Comput. Oper. Res. 2002, 29, 441–458. [Google Scholar] [CrossRef]
- Pillai, A.; Chick, J.; Johanning, L.; Khorasanchi, M.; De Laleu, V. Offshore wind farm electrical cable layout optimization. Eng. Optim. 2015, 47, 1–20. [Google Scholar] [CrossRef]
- Hou, P.; Hu, W.; Chen, C.; Chen, Z. Optimisation of offshore wind farm cable connection layout considering levelised production cost using dynamic minimum spanning tree algorithm. IET Renew. Power Gen. 2016, 10, 175–183. [Google Scholar] [CrossRef]
- Quinonez-Varela, G.; Ault, G.; Anaya-Lara, O.; McDonald, J. Electrical collector system options for large offshore wind farms. IET Renew. Power Gener. 2007, 1, 107. [Google Scholar] [CrossRef]
- Dutta, S.; Overbye, T. Optimal wind farm collector system topology design considering total trenching length. IEEE Transact. Sustain. Energy 2012, 3, 3339–3348. [Google Scholar] [CrossRef]
- Dahmani, O.; Bourguet, S.; Machmoum, M.; Guerin, P.; Rhein, P.; Josse, L. Optimization of the connection topology of an offshore wind farm network. IEEE Syst. J. 2014, 9, 1–10. [Google Scholar] [CrossRef]
- Zhao, M.; Chen, Z.; Blaabjerg, F. Optimisation of electrical system for offshore wind farms via genetic algorithm. IET Renew. Power Gener. 2009, 3, 205–216. [Google Scholar] [CrossRef]
- Lumbreras, S.; Ramos, A. Optimal design of the electrical layout of an offshore wind farm applying decomposition strategies. IEEE Trans. Power Syst. 2012, 28, 1434–1441. [Google Scholar] [CrossRef]
- Wang, L.; Wang, T.; Wu, J.; Chen, G. Multi-objective differential evolution optimization based on uniform decomposition for wind turbine blade design. Energy 2017, 120, 346–361. [Google Scholar] [CrossRef]
- Wu, Y.T.; Liao, T.L.; Chen, C.K.; Lin, C.Y.; Chen, P.W. Power output efficiency in large wind farms with different hub heights and configurations. Renew. Energy 2019, 132, 941–949. [Google Scholar] [CrossRef]
- Shin, J.S.; Kim, J.O. Optimal design for offshore wind farm considering inner grid layout and offshore substation location. IEEE Trans. Power Syst. 2016, 32, 2041–2048. [Google Scholar] [CrossRef]
- Cerveira, A.; De Sousa, A.; Pires, E.J.S.; Baptista, J. Optimal cable design of wind farms: The infrastructure and losses cost minimization case. IEEE Trans. Power Syst. 2016, 31, 1–11. [Google Scholar] [CrossRef]
- Hou, P.; Hu, W.; Soltani, M.; Chen, C.; Chen, Z. Combined optimization for offshore wind turbine micro siting. Appl. Energy 2017, 189, 271–282. [Google Scholar] [CrossRef]
- González, J.S.; García, Á.L.T.; Payán, M.B.; Santos, J.R.; Rodríguez, Á.G.G. Optimal wind-turbine micro-siting of offshore wind farms: A grid-like layout approach. Appl. Energy 2017, 200, 28–38. [Google Scholar] [CrossRef]
- González, J.S.; Gonzalez-Rodriguez, A.G.; Mora, J.C.; Payan, M.B.; Santos, J.R. Overall design optimization of wind farms. Renew. Energy 2011, 36, 1973–1982. [Google Scholar] [CrossRef]
- Fischetti, M.; Pisinger, D. Optimizing wind farm cable routing considering power losses. Eur. J. Oper. Res. 2018, 270, 917–930. [Google Scholar] [CrossRef]
- Gong, X.; Kuenzel, S.; Pal, B.C. Optimal Wind Farm Cabling. IEEE Trans. Sustain. Energy 2018, 9, 1126–1136. [Google Scholar] [CrossRef]
- Wang, L.; Wang, T.G.; Luo, Y. Improved non-dominated sorting genetic algorithm (NSGA)-II in multi-objective optimization studies of wind turbine blades. Appl. Math. Mech. 2011, 32, 739–748. [Google Scholar] [CrossRef]
- Kwong, W.Y.; Zhang, P.Y.; Romero, D.; Moran, J.; Morgenroth, M.; Amon, C. Multi-Objective Wind Farm Layout Optimization Considering Energy Generation and Noise Propagation With NSGA-II. J. Mech. Des. 2014, 136, 1–11. [Google Scholar]
- Tang, Y.; He, H.; Wen, J.; Liu, J. Power system stability control for a wind farm based on adaptive dynamic programming. IEEE Trans. Smart Grid 2015, 6, 166–177. [Google Scholar] [CrossRef]
- Hertz, A.; Mdimagh, A.; Carreau, M.; Welt, F.; Marcotte, O. Design of a wind farm collection network when several cable types are available. J. Oper. Res. Soc. 2017, 68, 62–73. [Google Scholar] [CrossRef]
- Herlihy, M. A methodology for implementing highly concurrent data objects. ACM Trans. Program. Lang. Syst. 1993, 15, 745–770. [Google Scholar] [CrossRef]
- Zhu, C.; Zhu, C.; Guo, T. Multi-Zone ice accretion and roughness models for aircraft icing numerical simulation. Adv. Appl. Math. Mech. 2016, 8, 737–756. [Google Scholar] [CrossRef]
- Vartdal, J.T.; Qassim, R.Y.; Mokliev, B.; Udjus, G.; Gonzales-Gorbena, E. Optimal configuration problem identification of electrical power cable in tidal turbine farm via traveling salesman problem modeling approach. J. Mod. Power Syst. Clean Energy 2019, 7, 289–296. [Google Scholar] [CrossRef]
- Ioannou, S.; Stefanakos, E.; Wiley, P. New MOV failure mode identification invention. IEEE Trans. Consum. Electron. 2007, 53, 1068–1075. [Google Scholar] [CrossRef]
- Nandigam, M.; Dhali, S.K. Optimal design of an offshore wind farm layout. In Proceedings of the 2008 International Symposium on Power Electronics, Electrical Drives, Automation and Motion, Ischia, Italy, 11–13 June 2008; pp. 1470–1474. [Google Scholar]
- Deb, K.; Tiwari, S. Omni-optimizer: A generic evolutionary algorithm for single and multi-objective optimization. Eur. J. Oper. Res. 2008, 185, 1062–1087. [Google Scholar] [CrossRef]
- Wang, L.; Chen, G.; Wang, T.; Cao, J. Numerical optimization and noise analysis of high-tip-speed wind turbine. Adv. Appl. Math. Mech. 2017, 9, 1461–1484. [Google Scholar] [CrossRef]
© 2019 by the authors. Licensee MDPI, Basel, Switzerland. This article is an open access article distributed under the terms and conditions of the Creative Commons Attribution (CC BY) license (http://creativecommons.org/licenses/by/4.0/).