Featured Application
Seeds of the desert date palm tree can be used as potential feedstock for the production of second-generation biodiesels in the Middle East and Africa.
Abstract
Transportation is a vital necessity without which the entire world would come to a standstill. The fossil fuels used to power transportation are consumed at rates of approximately 100,000 times their rate of natural formation, and their consumption subjects the human environment and ecosystem to significant damage. As substitutes for fossil-based diesel, second-generation biodiesels can eliminate many of the challenges concerning first-generation biodiesels in terms of their high cost and the food versus fuel debate. The seeds of the date palm tree have significant oil content and are a promising prospective energy source. This study investigated the potential environmental benefits of this biofuel in terms of diesel tailpipe emission reduction. The various blends of palm date biodiesel were produced and matched to fuel standard requirements, resulting in four standard-compatible blends that were tested in a diesel engine at varying operating conditions for speed and load. Although the biodiesel emissions had lower concentrations of CO2, CO, and HC relative to fossil diesel, higher concentrations of NOx were detected. The results suggest that date-seed biodiesel could become a sustainable energy source for the transport sector, although further technical and economic investigations will be required before its wide deployment.
1. Introduction
In the current era of fast and significant global transition in which prosperity and planetary health are both primary concerns, it is necessary for countries to secure, stabilize, and optimize their energy resources []. Stability in the energy market, however, remains difficult to ensure as the sector continues to be characterized by significant turbulence featuring recurrent booms and busts []. Fuel emissions are also a significant health risk, inducing, for example, an estimated 600,000 premature deaths in European Union countries in 2010 alone and a corresponding morbidity of $1.575 trillion []. These security and environmental challenges have been exacerbated by the steep rise in the demand for fossil liquid fuels. Some scenarios project an oil demand of up to 300 million barrels per day by 2100 []. This increase in use and the associated environmental deterioration have instigated global (public, academic, industrial, and governmental) demand for a partial to complete replacement of conventional fuels by more secure, renewable, and sustainable sources []. These concerns are also shared by engine and automotive manufacturers, who have been subjected to increasing pressure to meet increasingly stringent tailpipe emission regulations []. As a result, a wide variety of alternative fuels, of which biodiesels are the most prominent, have been proposed to address some of the concerns associated with fossil fuels. However, factors including the limited availability, lower energy content, and high production costs pose significant challenges to the large-scale uptake of biodiesels and other alternatives []. In the biodiesel fuel case in particular, it has become necessary to seek out and evaluate any potential feedstock that can boost availability.
The attempts to identify appropriate feedstocks can be classified into a series of biodiesel generations. First-generation biodiesels are agrofuels extracted from crops that would otherwise be cultivated for the purpose of food production. First-generation biodiesels have a number of desirable attributes that make them excellent compression-ignition engine fuels, including renewability, compatibility with existing automotive engines and fuel handling infrastructure, and high energy densities of ~90% of that of fossil diesel (39.8 MJ/kg for date seed oil (DSO) compared with 44.6 MJ/kg for fossil diesel fuel). It has also been shown that pure biodiesel can result in a reduction of “cradle-to-grave” CO2 emissions of at least 50% relative to its fossil-based diesel counterpart []. However, other life cycle analyses have shown that only limited savings in greenhouse gas emissions can be attained using biodiesel []. Although such analyses use significantly varying methodologies and the data and differences in the results should be viewed from this perspective [], it is true that first-generation biodiesel suffers from other problems, including the difficulty in sustaining feedstock, accelerated deforestation, biodiversity damage, and the effects of production on water scarcity, production costs, and food prices.
To address these issues, biodiesels derived from non-edible feedstocks or waste streams (second-generation biodiesels) have emerged as a promising alternative [,,,,]. These biodiesels can be produced from waste streams in the food supply chain, which are estimated to comprise >30% of the global food supply balance and are typically landfilled or incinerated []. To produce second-generation biofuels, a number of waste streams have been investigated and exploited, including used cooking oil [], waste coffee [], and the seeds of the date palm trees [].
The seeds of the date fruit are a promising feedstock for biodiesel production in the Middle East and North Africa, which support the most appropriate habitats for the cultivation of the desert date palm. Almost 90% of the total global production (8.166 million t in 2017 [], harvested from more than 100 million trees []) originates from this region. The seed mass is 11–18% of the date fruit mass [] and has an oil content of 4–13% [,]. These figures indicate that it is theoretically possible to extract an annual 127 kt of date-seed oil (DSO) to produce an identical quantity of DSO biodiesel, a substantial quantity relative to the total annual biodiesel production in the Middle East and Africa of 38.7 kt in 2015 [].
To date, however, there have been no significant implementations of this byproduct stream and it is, in most cases, disposed of in landfills []. However, there have been some unscalable applications, including animal feed [,], caffeine-free coffee [,], and pharmaceutical and cosmetic products []. A limited number of studies [,,] have examined date seeds as a potential feedstock for biodiesel production with a restricted focus on DSO extraction and biodiesel transesterification. Although the parameters and conditions that govern the extraction and production processes were identified and their optimum values specified, none of these studies tested the final biodiesel product in an actual automotive engine to assess the performance and tailpipe emissions. In addition, there has been no research into whether DSO biodiesel meets the entire range of specifications set out under the standards, such as ASTM D6751 and EN14214. To fill this gap in the research, in this study, biodiesel was produced from desert date palm seeds following a systematic procedure that adjusted the product specifications to match those set out under international fuel standards. The four-resulting standard-compatible blends (B5, B10, B15, and B20) were prepared and tested in a compression engine to evaluate their tailpipe emissions of CO2, CO, HC, and NOX and to assess their relative cost viabilities relative to fossil-based diesel fuel.
2. Materials and Methods
2.1. Biodiesel Production from Date Seeds
The fine date-seed powder was obtained from Sharjah Dates Factory, a domestic date facility, and used as feedstock for oil extraction using a Soxhlet extractor (B 811 BUCHI, Flawil, Switzerland). The following conditions and parameters for obtaining the optimum extraction yield were obtained from the literature [,,,,,]: Hexane solvent (S D Fine-Chem Limited); a temperature of 60 °C; 4 h time; and a solvent/seed weight ratio of six. The gums formed in the resulting oil were eliminated via a degumming process in which they were hydrated by small amounts of water and then separated by centrifugation. The resulting DSO had phosphorus (P), and magnesium (Mg) plus calcium (Ca) concentrations of 9.08 and 14.16 ppm, respectively, both higher than the limits accepted under ASTM D6751 (5 and 10 ppm for P and for Mg plus Ca, respectively). To reduce these levels to tolerable concentrations, the DSO was subjected to the “phosphoric acid treatment procedure.” []. The measured free fatty acid content of the resulting DSO of 0.42 wt.% (using the titration method) was compliant with the level specified by ASTM D6751, justifying the use of a one-step transesterification process. The final product had an oil yield of 10.74%, and the fatty acid profile is as shown in Table 1 (gas chromatography with flame-ionization detection (GC/FID)). The biodiesels were produced using a standard transesterification process using the following parameters and conditions for optimum oil conversion based on previous research [,,,,]: Methanol (Fisher Chemical, Pittsburgh, PA, USA), NaOH (Sigma-Aldrich, MO, USA) as catalyst, methanol/DSO molar ratio of 9/1, catalyst/DSO mass fraction of 1/100; 1 h time; and a temperature of 55 °C, respectively. The resulting DSO biodiesels were purified using distilled water, dried, tested, and finally characterized for conformity with the standards. Table 2 summarizes the properties of the DSO biodiesel along with those of the fossil-based diesel and other second-generation biodiesels. Four of the biodiesel-diesel blends, which are labeled B5, B10, B15, and B20, respectively, were then assessed in terms of their impact on engine tailpipe emissions and performance.

Table 1.
Fatty acid profile of date-seed oil (DSO).

Table 2.
DSO biodiesel specifications compared with Jatropha biodiesel.
2.2. Experimental Settings and Engine Test Rig
A single-cylinder compression ignition (CI) naturally aspirated engine (Figure 1, Table 3) was used to carry out the tests. A diaphragm pump mounted in the crankcase was used to deliver high-pressure fuel to the injector, which was located at the center of the hemispherical bowl-in-piston combustion chamber. The mass flowrate of air draw during the intake process was measured via a differential pressure transducer mounted at the entrance of a plenum cylinder used to attenuate the pulsation of the intake process. The fuel mass flow rate was measured using a burette mounted in the pipe connecting the fuel tank to the fuel pump. The engine was loaded by a dynamometer—a car alternator modified for the purpose—with the load governed by a bridge rectification circuit that managed the external excitation and dissipated generated heat using an air-cooled resistive load bank. The rotational speed of the engine was sensed using a proximity switch, and an exhaust gas analyzer (EMS 5003) (Table 4) was used to measure the engine tailpipe emissions of CO2, CO, NOx, and HC.
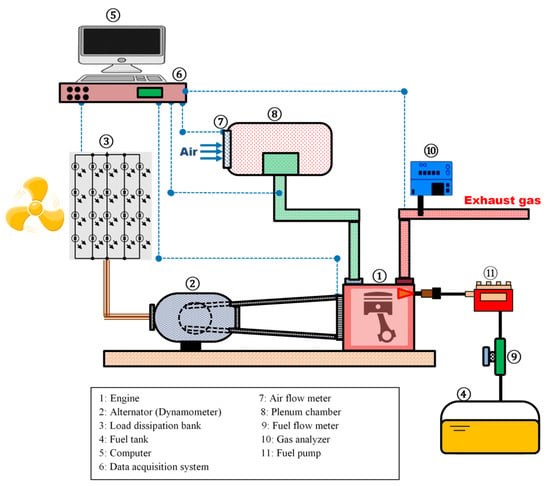
Figure 1.
Experimental setup of the engine test rig.

Table 3.
Test engine specifications.

Table 4.
Technical data of the exhaust gas analyzer (EMS 5003).
The emission trends were investigated under different engine loads (50, 75, and 100%) and for a range of engine speeds (1600–3600 rpm in steps of 200 rpm) to obtain a broad understanding of emission behaviors and a wide scale for comparison. The differences between the emission levels of the benchmark diesel (grade 2D) fuel and those of the biodiesel fuels were normalized with respect to the benchmark as , where is the normalized value, is the biodiesel measurement, and is the benchmark diesel measurement. Then, the normalized values were represented in a series of charts showing the percentage fractions of the variations as contour figures adjacent to their respective trends.
3. Results and Discussion
This study analyzed the combustion and emissions of the DSO biodiesel blends and the base diesel fuel. The typical volumetric makeup of the exhaust gas emissions from a diesel engine are shown in Figure 2 []. It is seen from the figure that the volumetric concentration of the pollutant emissions is typically less than 1%.
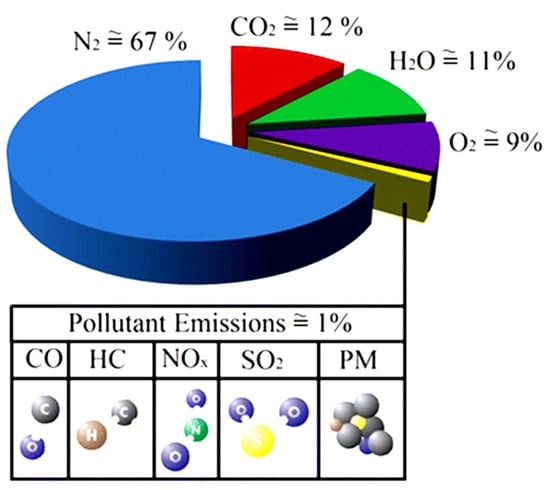
Figure 2.
Volumetric composition of typical diesel engine exhaust gas [].
3.1. CO2 Emissions
Technically, the presence of CO2 in the engine exhaust is a healthy sign of engine operation. Apart from CO2, none of the principal diesel engine emissions shown in Figure 2 have adverse climate impacts. Even though it is not itself toxic, CO2 is a prime greenhouse gas and the major contributor to global warming. Approximately 40% of the CO2 produced by transportation, power generation, and industry is eliminated from the atmosphere by the plant photosynthesis process and through dissolution into surface water, which contributes to ocean acidification. The 60% of CO2 emissions that remain in the atmosphere contribute significantly to climate change.
Figure 3 shows the variations in CO2 emissions by the respective fuels at different speeds and loads. In all of the blends and the benchmark diesel fuel, CO2 emissions decrease as the engine load decreases or the engine speed increases. Running the engine under a partial loading reduces the amount of fuel delivered to the cylinder and, ultimately, the CO2 produced by the combustion. This interpretation ties into the clear and worthy goal of reducing engine CO2 emissions through the efficient use of combustion energy, i.e., converting the combustion energy into kinetic energy without waste. To achieve this, the losses in the various engine accessories can be minimized, kinetic and heat energy losses can be recovered, and the air resistance and drag from the motion of the car can be reduced. The average CO2 emissions of diesel fuel over the entire speed range was reduced from 8.76 vol.% under full loading to 6.9 and then 4.6 vol.% under 75 and 50% loading, respectively. The average CO2 emissions of B20 at 100, 75, and 50% loading were 7.9, 6.4, and 4.2% vol., respectively. When the engine ran at higher speeds, very brief time intervals were available for the intake process, resulting in a reduced intake of fresh air, which in turn diminished volumetric efficiency and, therefore, the CO2 emissions in the engine exhaust [,]. The presence of inherent oxygen in the DSO biodiesel offset some of this oxygen shortage within the combustion chamber. Thus, a reduction of 37% in the CO2 emission of B15 at full loading was observed, compared to the 34.1% observed for the base diesel fuel, when the engine speed was increased from 1600 to 3600 rpm. For the same increase in engine speed and 50% engine loading, the corresponding decreases were 47.4 and 44.7%, respectively. It appears that, at lower engine loads, the variation in CO2 emission became more sensitive to the increase in engine speed, which is the result of a combination of two effects that reduced both the carbon and oxygen levels in the cylinder. The inclusion of DSO biodiesel in the blends reduced the CO2 emissions in proportion to the biodiesel fraction: At full loading, the average reductions in CO2 emissions over the engine speed range were 2, 3.4, 5.7, and 9.6% for B5, B10, B15, and B20, respectively. This variation can be better understood by taking a closer look at the combustion chemistries of the respective DSO biodiesel (C16H36O2) species. The general stoichiometric combustion reaction can be expressed as:
from which it is seen that the amount of CO2 produced by the combustion is governed by the number of moles of each reactant. In the case of fossil diesel (C12H23), burning (n) moles produces (12n) moles of CO2. By comparison, the combustion of (n) moles of the larger DSO biodiesel molecules produces (16n) moles of CO2. However, it is more practical to analyze the combustion reaction in terms of mass. Fossil-based diesel has a smaller molar mass (167 g/mole) than DSO biodiesel (260.45 g/mole). For example, burning of 1000 g of fossil-based diesel in a stochiometric combustion releases 3158.1 g of CO2 (with a molar mass of 44.01 g/mole), while burning the same mass of DSO biodiesel produces only 2703.6 g of CO2 because the same mass of the larger-molecule DSO biodiesel contains a lower number of moles. As a consequence, burning DSO biodiesel releases less CO2 than the same mass of fossil diesel. It is worth noting that the hydrogen content in DSO biodiesel is close to that in fossil diesel and increasing the H2 fraction makes the combustion process more efficient. However, carbon also enhances the combustion process, and the DSO biodiesels have a lower carbon content than fossil diesel. Overall, higher C and H2 fuel content enhances diesel engine efficiency. The findings of this study agree with other reports in the literature that CO2 emissions decrease when biodiesel is combusted in a diesel engine [,].
CnHmOw + (n + m/4 − w/2) O2 → nCO2 + (m/2) H2O,
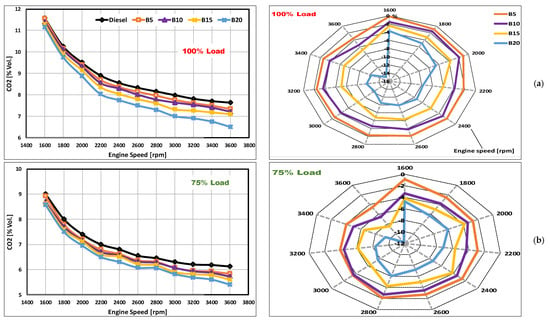
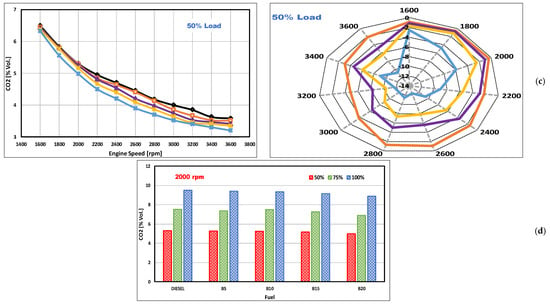
Figure 3.
CO2 variations with engine speed and load, presented as trends (left) and the normalized value contours (right) for (a) 100%, (b) 75%, and (c) 50% loading. (d) Comparison of the results for all fuels at all loads at 2000 rpm.
3.2. CO Emissions
Figure 4 shows the impacts of the DSO biodiesel fraction on the amount of CO emitted by the engine running at different speeds and loads. Carbon monoxide is a silent killer because it cannot be perceived by visual or olfactory means, and a CO fraction of 0.5% in the air can cause unconsciousness and kill within 15 min. Even extremely low concentrations of 0.04% can cause headaches and can kill following exposure for several hours. Internal combustion engines (ICEs) are the main anthropogenic source of CO gas and cause more than 95% of CO emissions in urban areas []. Carbon monoxide is generated during fuel-rich charge combustion as a result of an oxygen insufficiency in the combustion chamber that prevents full oxidization of the carbon in the fuel. The combustion reaction in a CI engine comprises two pathways—the breakdown of the fuel to form CO, and the oxidation of CO to form CO2—with most of the fuel’s energy liberated in the second process. The factors that determine the CO emissions from a CI engine include the fuel-air mixture features (such as the air-fuel ratio (AFR), mixing condition, and fuel type), engine operating conditions (such as speed, load, fuel atomization, and injection parameters including timing, duration, and pressure), and engine specifications (such as compression ratio and combustion chamber design) [,]. Of these, the AFR has the largest influence on the production of CO emissions and can be seen as the prime driver of CO production, while the other factors enhance its effects. Thus, a CI engine produces lower CO emissions than a spark ignition engine because it operates under leaner overall conditions (AFR > 1). Unlike NOx formation, the formation of CO is firmly driven by the initial stages of the combustion reaction, during which the fuel distribution within the combustion chamber is inhomogeneous. That is, the AFR is nonuniform and varies both spatially and temporally within the cylinder, producing fuel-rich regions that are optimal for CO formation. A jet of injected fuel penetrates the combustion chamber, entraining hot gas that, in turn, heats up the fuel and causes evaporation. The hot fuel vapor-air mixture forms a sheath surrounding the jet, including the jet tip. Pre-flame combustion begins at this stage (at a temperature of approximately 480 °C), drawing more hot air into the fuel jet and increasing the temperature to approximately 550 °C []. As the temperature increases continuously, the reaction rate of the combustion increases and, eventually, premixed combustion in which CO forms rapidly in the flame reaction zone begins and then increases to a peak value. The diffusion flame surrounding the spray plume is also established during this stage. Ultimately, diffusion combustion occurs at a temperature of approximately 1,600 °C. If a sufficient amount of hot oxygen is available, the CO produced by this path of the combustion reaction is oxidized to CO2. This flame plume structure and its respective zones [] are illustrated in Figure 5.
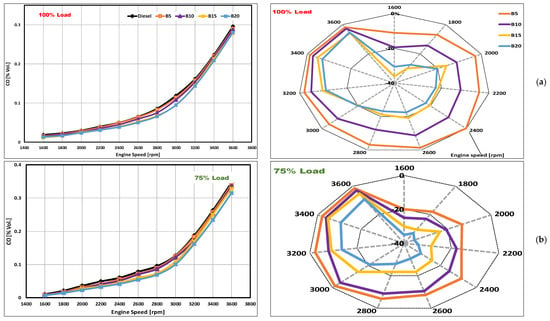
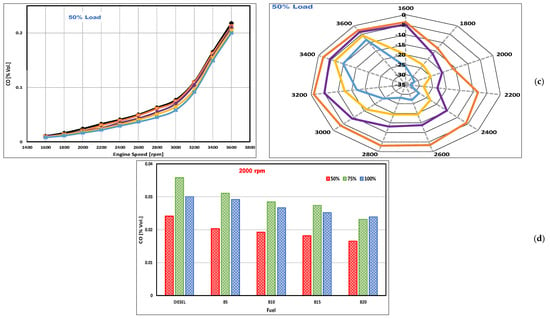
Figure 4.
CO variations with engine speed and load, presented as trends (left) and the normalized value contours (right) for (a) 100%, (b) 75%, and (c) 50% loading. (d) Comparison of the results for all fuels at all loads at 2000 rpm.
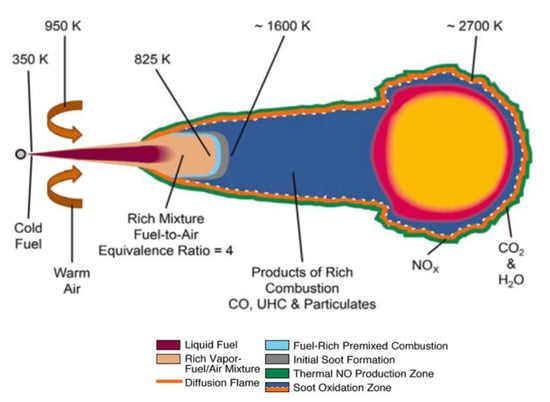
Figure 5.
Schematic of a typical stabilized combustion jet in a diesel engine [].
It is seen from Figure 4 that, under all loads and for all of the fuel types, the CO emissions increase moderately when engine speed increases. This trend in terms of engine speed is consistent with the reported literature [,]. When the engine is operated at higher speeds, less time is available for the intake process, resulting in reduced volumes of air and richer mixtures within the cylinder. The 18.8 millisecond (ms) available for the intake stroke at 1600 rpm is reduced to 8.3 ms at 3600 rpm. As a result of this reduction in available time, the combustion efficiency declines from its optimum value. The lower speeds increase the AFR and render the mixture within the combustion chamber leaner. Similarly, with all fuels and at any speed the CO emissions from the exhaust are augmented when the engine operates under higher loads, a trend that has also been reported in the literature [,,]. As is generally true for ICEs, increasing the engine load initially results in a richer mix (with lower AFR). However, the increase in CO emissions only continues up to an engine loading of 75%, after which the trend reverses. At full or extremely high loading, the combustion temperature increases, leading to complete combustion and, ultimately, a decrease in CO emissions []. It was also found that blending the fossil-based diesel with the DSO biodiesels resulted in a reduction of CO emissions in proportion to the fraction of DSO biodiesel in the blend. Once again, this finding is in full agreement with the literature [,]. In these cases, the presence of fuel-bound oxygen in the DSO biodiesel provided additional oxidant for the fuel in the combustion chamber and boosted complete oxidation to aid in the formation CO2 [,]. Another contributing factor to the reduction in CO emissions was the higher levels of cetane number (CN) (62) in the DSO biodiesel, which shortened the ignition delay period and minimized the likelihood of the formation of local fuel-rich regions within the cylinder that could serve as a CO incubator [,]. It was also found that, for all blends and at all loads, the reduction in CO emissions through DSO biodiesel addition increased with engine speed up to mid-range. This trend can be attributed to the inherent oxygen in the DSO biodiesel, which enhanced the need for the oxidant, and the fact that, up to this speed range, the high viscosity of the biodiesel did not clearly affect the combustion process. The observed peak reductions in CO emissions under full loading at 3000 rpm were 0.0046, 0.01, 0.024, and 0.024 vol.% for blends B5, B10, B15, and B20, respectively. In the high-speed range, however, the effects of biodiesel viscosity negated the emission advantages of the intermediate speed range. At higher speeds, in which the combustion process could operate under a very short time interval, the higher viscosities of the DSO biodiesels induced a relapse in the droplet atomization, fuel evaporation, and homogeneous distribution within the cylinder, reducing the combustion efficiency. That is, at higher speeds, the adverse effect of the high viscosity of DSO biodiesel superseded a significant portion of the positive effect gained from the inherent oxygen contained by the biodiesel. As a result of this rebound, the CO emissions of the DSO biodiesel blends approached that of fossil-based diesel at higher speeds.
3.3. NOx Emissions
The nitrogen oxide (NOx) emissions pattern produced by DSO biodiesel blends and fossil-based diesel are shown in Figure 6. As in the CO2 and CO cases, the tests were conducted at different engine speeds and loads. Nitric monoxide (NO) and nitric dioxide (NO2) are collectively referred to as NOx, with NO representing the preponderant oxide (in diesel engine emissions, the proportion of NO2 within NOx is 10–30%) []. As very small concentrations of NOx are emitted from a diesel engine relative to the aggregate exhaust emissions, the concentration of NOx is expressed as parts per million (ppm). On-board ICEs contribute more than 50% of the NOx that is emitted globally [].
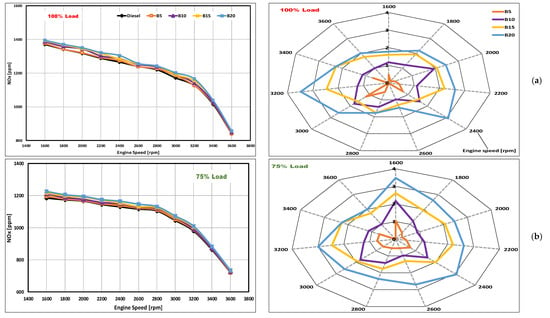
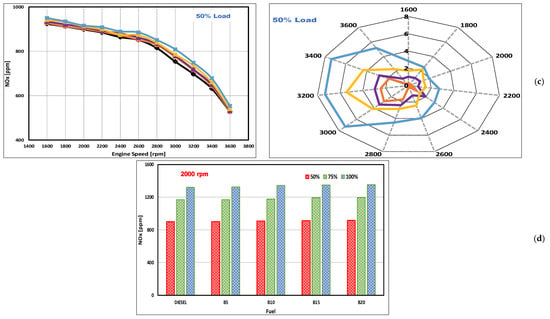
Figure 6.
NOx variations with engine speed and load, presented as trends (left) and the normalized value contours (right) for (a) 100%, (b) 75%, and (c) 50% loading. (d) Comparison of the results for all fuels at all loads at 2000 rpm.
To better understand NOx emissions trends with speed, load, and DSO biodiesel fraction, this study first discusses the formation of NOx in a diesel engine. The air (composed of 21% O2 as oxidant and 79% N2 as diluent) is trapped inside the cylinder during the intake process and undergoes compression thereafter. The fuel is injected into this compressed and heated air at a few crank degrees before the top dead center (just prior to the onset of combustion), and the subsequent combustion reaction releases heat. If the temperature inside the cylinder does not exceed 1600 °C, the atmospheric (molecular) N2 remains inert and is driven from the cylinder to the exhaust. Otherwise, the oxygen and nitrogen undergo dissociation and subsequent NOx formation. In diesel engines, the gas temperature exceeds 1600 °C, making them the primary contributor to NOx pollution. Although increasing the temperature within the cylinder increases the rate of NOx formation, the formation reaction of NOx is not itself part of the combustion reaction. Instead, the combustion creates the appropriate conditions and environment for NOx formation. Three chemical mechanisms contribute to NO formation: A thermal (Zeldovich) process; the combustion of fuel N2; and a prompt (Fenimore) mechanism []. As diesel and biodiesel fuels contain very small quantities of nitrogen of typically less than 2% by weight, the contribution of the fuel-bound N2 is secondary, and the NOx is not formed by the combustion of fuel. Prompt NO forms rapidly in the combustion flame reaction zone as a result of the reactions between intermediate chemical species. In CI engines, however, the flame front is extremely thin as a result the high pressure under which combustion occurs, and the residence time of the chemical species in the flame front zone is very short. As a result, NO formation via the thermal mechanism in the hot gases behind the flame front represents the predominant formation mechanism in such engines []. A typical stabilized combustion jet [] of the type shown in Figure 5 is free from impingement or interaction with the combustion chamber walls and has a volume of hot combusted gas that is much greater than the instantaneous volume of the combustion flame front.
To sum up the preceding discussion, NOx formation in CI engines is governed by three main parameters: The temperature to which the burned gases can rise; the residence times of the chemical species; and the availability of oxygen. From Figure 6, it is seen that for all the fuels and under all loading conditions, the engine expelled lower amounts of NOx emissions when running at higher speeds. Under low-speed operating conditions, the volumetric efficiency was boosted, which increased the air intake and, consequently, the induction of O2 within the cylinder and the formation of NOx. The engine speed had an impact on both the volumetric efficiency and the heat transfer from the cylinder. The volumetric efficiency dropped at higher engine speeds, leading to a higher degree of residual gas dilution in a manner similar to a miniaturization of the effect obtained from the dilution obtained from exhaust gas recirculation. Increasing the engine speed produced two conditions with contradictory effects on the heat transfer rate: A reduced cycle time, which diminished the heat transfer rate; and higher turbulence, which enhanced the heat exchange process. However, the former effect dominated, with the reduced heat transfer rate leading to higher burned gas temperatures at higher speeds. The relatively long residence time of the NOx-forming reaction kinetics associated with lower speeds is another factor affecting NOx formation. The net effect of these respective factors is the set of NOx-formation trends shown in Figure 6, which are specific to the combusted fuel, engine specifications, and operating conditions. Overall, at higher engine speeds, NOx formation is suppressed by a lack of O2 and an inadequate residence time. These findings agree closely with extensively reported results in the literature [,]. Following the acceleration of the engine from 1600 to 3600 rpm under full loading, a reduction of 38% in NOx emissions was observed in both cases where the fossil-based diesel and B20 were used as fuel. This reduction increased to 42% under a half-loaded condition, suggesting that reducing the load made the engine more responsive in terms of NOx formation to the speed variation. Under low loading and high-speed conditions, three restrainers (lower temperature, lack of O2, and shorter residence time) act against NOx formation. At higher loads and under any speed and fuel condition, the engine produced higher amounts of NOx emissions. Increasing the load increased the amount of fuel burned within the combustion chamber, resulting in a higher temperature, which is the primary contributor to NOx formation. This finding is also reflected in the literature []. Increasing the fraction of DSO biodiesel in the blend also promoted NOx formation at all loads and speeds because biodiesel fuel has more inherent O2 in its chemical composition. When adequate amounts of O2 were available within the combustion chamber, the fuel charge underwent complete combustion, which in turn raised the temperature of the product gas. As noted above, a high amount of available oxygen at a high temperature corresponds to a convenient environment for NOx formation via the Zeldovich mechanism. Accordingly, increasing the fuel-bound oxygen increased the NOx in the exhaust. The increased NOx emission can be also partially attributed to the compressibility features of DSO biodiesel in terms of its bulk modulus, which quantifies how easily the volume of a quantity of fuel can be varied by applying pressure (alternatively, the bulk modulus governs the pressure increase resulting from a sudden decrease in fuel volume). Biodiesel has a smaller bulk modulus of compressibility than fossil diesel. Therefore, at a given injection pump timing, the DSO biodiesel exhibited a faster pressure increase and an earlier injection timing of approximately 1° of crank rotation []. This advancing of the injection timing increased the NOx emissions. Several studies have also attributed the increases in NOx emissions to the elevated levels of CN in biodiesel [,]. It is believed that higher CN levels shorten the ignition delay, thereby advancing the combustion and increasing NOx emissions. However, the higher CN levels in the DSO biodiesels assessed in this study also contributed to the shortening of the premixed combustion phase and therefore alleviated the pressure and temperature variations within the cylinder, ultimately resulting in reductions in the NOx emissions. Several previous studies experimentally demonstrated the predominance of this latter effect [,]. The peak (worst) increments in NOx emission of 2.8, 3.3, 5.4, and 7.4% for blends B5, B10, B15, and B20, respectively, were all seen at loadings below 50%. These findings agree with those of a significant number of studies carried out on different biodiesel types and blends under various engine operating conditions [,,]. Duda et al. [] also reported similar findings and interpretations of NOx trends with the engine load and speed.
3.4. HC Emissions
Figure 7 shows the HC emission concentration levels in the exhaust gas produced at different engine speeds and loads with the respective DSO biodiesel blends. The concentrations shown in the figure are expressed in terms of the total hydrocarbon content and given in ppm. Hydrocarbon emissions (or organic emissions) in the exhaust of the CI reflect the hydrocarbons that escape the combustion process unburned. The composition of HC in CI engine exhaust is quite complex for two reasons: The diesel fuel itself comprises a combination of hydrocarbons with high molecular weight; and the structure of some hydrocarbons alters during the combustion reaction and does not complete the reaction, leading to the production of hydrocarbons that are not present in the parent fuel. Accordingly, unburned hydrocarbons comprise nearly 400 major and minor species. A normal combustion process in a CI engine involves four stages: Ignition delay, rapid combustion, mixing-controlled combustion, and late combustion. Fuel can escape this sequence unburned via four routes: (1) The over-mixing of air and fuel that causes the AFR to exceed the lean flammability limit; (2) under-mixing that makes the charge too rich to burn; (3) over-penetration of fuel spray that causes fuel droplets to impinge on the cylinder walls; and (4) sudden quenching of the flame during expansion or as a result of mixing with cold air. The most significant contributors to HC emissions from CI engines are over-mixing (over-leaning) and under-mixing (over-riching). It is seen from Figure 7 that increasing the engine load reduced HC emissions up to a specific load limit (75% load), with the trend reversing thereafter. This trend was also found by [,,]. Increasing the engine load resulted in a richer mixture (lower AFR) within the combustion chamber and, therefore, a shorter ignition delay, corresponding to a reduced likelihood that the air-fuel mixture would be diluted by more air prior to autoignition. This made it unlikely that local mixtures that were lean to the levels below the flammability limit would develop. Ignition delay is strongly dependent on the air-fuel mixing condition and tends to be minimum near the stoichiometric proportion. However, a further increase in engine loading (to full loading) can prolong the delay period relative to the minimum condition. This in turn provides adequate time for the fuel to become further mixed beyond the lean limit of combustion, and therefore to avoid burning and the sustenance of a proper fast flame front. As a result, some of the fuel escapes through the exhaust port without being ignited. Under this interpretation, it is evident that ignition delay was the predominant factor governing the quantity of HC emissions in the assessments. At 3000 rpm, HC emissions of fossil diesel and B20 were 16.3 and 11 ppm, respectively, under the half-loading condition. These concentrations were reduced to 13.8 and 9.3 ppm, respectively, under 75% loading but increased again to 16.4 and 11.9 ppm, respectively, under full loading. For all of the fuels under all loading conditions, the concentration of HC emissions decreased as the engine speed increased. At higher speeds, the ignition delay was shortened, blocking the fuel from reaching the lean flammability limit, while the volumetric efficiency declined as a result of a lack of time available for the intake process. As a result, a rich mixture was produced within the cylinder, leading to complete combustion. At lower speeds, a sufficient amount of air was inducted within the cylinder, leading to a protracted ignition delay. Both effects promoted slow and incomplete combustion reactions that presented a favorable environment for unburned hydrocarbons, hydrocarbon fractionation products, and incomplete oxidation compounds. Some of these products avoided the combustion process and were ejected from the cylinder unburned. The fossil diesel and DSO biodiesel blends demonstrated similar HC emission reductions of nearly 55% when the engine speed increased from 1600 to 3600 rpm at full load. At 50% loads, these reductions increased to nearly 75%. The higher sensitivity of the variation in HC emissions to changes in engine speed under lower loads is likely attributable to the higher concentrations of HC emissions produced at lower loads, which led to a greater amount of change in emissions with engine speed.
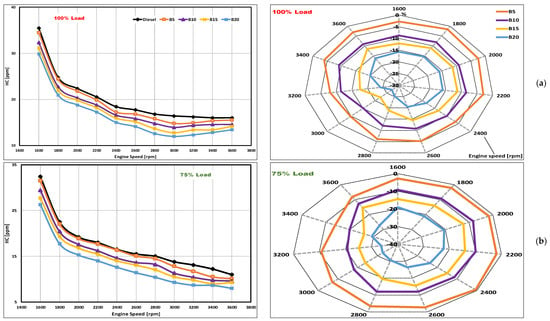
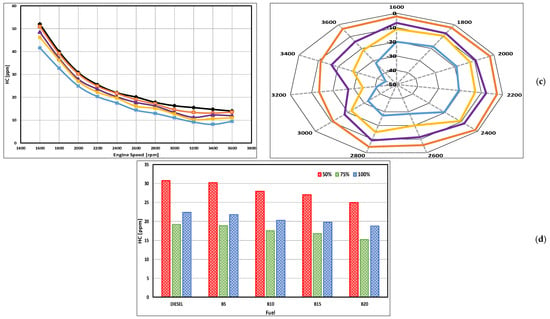
Figure 7.
HC variations with engine speed and load, presented as trends (left) and the normalized value contours (right) for (a) 100%, (b) 75%, and (c) 50% loading. (d) Comparison of the results for all fuels at all loads at 2000 rpm.
Blending the neat fossil diesel with fractions from DSO biodiesel appears to also have had a significant impact on the HC emissions. As shown in Figure 7, increasing the amount of DSO biodiesel in the blend reduced HC emissions to a degree proportional to the DSO biodiesel fraction []. These substantial changes in emissions can be attributed to the variations in the ignition delay occurring as a result of blending the fossil-based diesel with the DSO biodiesel. It is worth mentioning that, in this context, the ignition delay was both a chemical and physical process. That is, it was driven by both the heterogeneous and the complex physical mixing process in the CI engine and the chemical kinetics of the fuel. All blends demonstrated considerable declines in HC emissions relative to neat fossil diesel throughout the running process, possibly because the higher CN content of the DSO biodiesels shortened the ignition delay and therefore decreased the fuel fraction that could be diluted by the surrounding air prior to ignition. As a result, the pre-mixed combustion phase was minimized, and less fuel had was dispersed within the cylinder prior to combustion. This reduction in ignition delay also constrained the amount of fuel that could impinge on the cylinder walls, a potential source of HC emissions. The best performance in terms of the maximum decrease in HC emissions relative to the benchmark diesel were attained at the mid-range of engine speed, with peak reductions of 13.9, 27.2, 34, and 44.4% at loads of 75, 100, 100, and 100% for B5, B10, B15, and B20, respectively. Further increases in the engine speed diminished these reductions and caused the HC emissions of the DSO blends to converge with that of the neat diesel. At the mid-range of engine speeds, the oxygen bound within the biodiesel fuels improved the combustion process, and the DSO biodiesel blends could meet acceptable levels of fuel atomization and homogeneous charge distribution within the combustion chamber. At higher engine speeds, however, extremely brief time intervals were available for any combustion event, including fuel atomization, evaporation, and distribution within the cylinder. The higher viscosities of the DSO biodiesel blends worsened the situation, leading to poor combustion efficiency. Eventually, the elevated HC emission levels approached that of neat fossil diesel, with the relative reductions for B5, B10, B15, and B20 reducing to 3.5, 14.2, 21.4, and 32%, respectively, at 50% load and 3600 rpm.
4. Conclusions
Extensive research and development remain to be carried out on second-generation biodiesels to investigate the extent to which they can overcome the barriers that have prevented the wide-scale adoption of first-generation biodiesels. However, there remain serious technical and economic hurdles that must be overcome before second-generation biodiesels can be deployed. Of the primary areas that require further clarification, combustion in automotive engines and the resulting tailpipe emissions are among the most prominent. To address these issues, this study investigated the tailpipe emissions produced during the combustion of biodiesel blends derived from DSO and analyzed the mechanisms of their formation during the combustion reaction in terms of the relation between biodiesel properties and the emission components. To that end, DSO was extracted and converted to biodiesel by applying the parameters and conditions reported in the literature, and its specifications were subsequently adjusted to conform with various standards. As a result, four DSO blends (B5, B10, B15, and B20) were prepared and used for testing in a CI engine to evaluate the resulting tailpipe emissions (CO2, CO, NOx, and HC) relative to a fossil diesel comparison baseline. The following conclusions can be reported:
- The inclusion of DSO biodiesel in the blends reduced CO2 emission levels, with a greater degree of enhancement occurring at lower engine loads and higher engine speeds. At full loading, an average reduction of emissions from B20 of 9.6% was obtained.
- The CO emissions were reduced significantly in the case of DSO biodiesel blends. At full loading, the average CO emission reductions of 3.4, 9.7, 18.6, and 19.2% were obtained using B5, B10, B15, and B20, respectively.
- The presence of inherent O2 within the DSO biodiesels resulted in greater concentrations of NOx emissions at all loads and speeds, with the peak (worst) increments of 2.8, 3.3, 5.4, and 7.4% obtained for blends B5, B10, B15, and B20, respectively. All of these peaks occurred under 50% loading. At higher speeds, the increases diminished, and the emissions approached the levels produced by fossil diesel.
- There were remarkable decreases in HC emission levels that were observed for the DSO biodiesel. The peak reductions of 13.9, 27.2, 34, and 44.4% were obtained at 75, 100, 100, and 100% loading for B5, B10, B15, and B20, respectively.
Author Contributions
Conceptualization, M.K., C.G., and A.G.O.; methodology, M.K., K.R., C.G., and I.T.N.; formal analysis, M.K., and A.G.O.; investigation, M.K., K.R., and C.G.; data curation, K.R., C.G., and I.T.N.; writing—original draft preparation, M.K., K.R., and I.T.N.; writing—review and editing, M.K., C.G., and A.G.O.; supervision, A.G.O.; funding acquisition, C.G.
Funding
This research was funded by the University of Sharjah, UAE [grant number V.C.R.G./R.1285/2017].
Acknowledgments
The authors would like to express their gratitude to the following institutions, laboratories, and inspection bodies for their support of this project: University of Sharjah, Lootah Biofuels LLC (UAE), Bureau Veritas–Inspectorate (UAE), Materials Laboratory (UAE), GHP Testing & Calibration Laboratory (UAE), and Dubai Central Laboratory (Food and Environment Laboratory Section).
Conflicts of Interest
The authors declare no conflicts of interest.
References
- Arunkumar, M.; Kannan, M.; Murali, G. Experimental Studies on Engine Performance and Emission Characteristics Using Castor Biodiesel as Fuel in CI Engine. Renew. Energy 2019, 131, 737–744. [Google Scholar] [CrossRef]
- The British Petroleum Company, BP. BP Statistical Review of World Energy, June 2017, 66th ed.; Pureprint Group Limited: London, UK, 2017; Available online: https://www.bp.com/content/dam/bp/en/corporate/pdf/energy-economics/statistical-review-2017/bp-statistical-review-of-world-energy-2017-full-report.pdf (accessed on 23 August 2018).
- World Health Organization (WHO); Regional Office for Europe (OECD). Economic Cost of the Health Impact of Air Pollution in Europe: Clean Air, Health and Wealth; WHO Regional Office Publications: Copenhagen, Denmark, 2015. [Google Scholar]
- Höök, M.; Tang, X. Depletion of Fossil Fuels and Anthropogenic Climate Change—A Review. Energy Policy 2013, 52, 797–809. [Google Scholar] [CrossRef]
- Ge, J.; Yoon, S.; Choi, N.; Ge, J.C.; Yoon, S.K.; Choi, N.J. Using Canola Oil Biodiesel as an Alternative Fuel in Diesel Engines: A Review. Appl. Sci. 2017, 7, 881. [Google Scholar] [CrossRef]
- Liu, S.; Chen, W.; Zhu, Z.; Jiang, S.; Ren, T.; Guo, H.; Liu, S.; Chen, W.; Zhu, Z.; Jiang, S.; et al. A Review of the Developed New Model Biodiesels and Their Effects on Engine Combustion and Emissions. Appl. Sci. 2018, 8, 2303. [Google Scholar] [CrossRef]
- Nigam, P.S.; Singh, A. Production of Liquid Biofuels from Renewable Resources. Prog. Energy Combust. Sci. 2011, 37, 52–68. [Google Scholar] [CrossRef]
- Johnston, M.; Holloway, T. A Global Comparison of National Biodiesel Production Potentials. Environ. Sci. Technol. 2007, 41, 7967–7973. [Google Scholar] [CrossRef]
- Bart, C.J.; Palmeri, N.; Cavallro, S. Biodiesel Science and Technology: From Soil to Oil; TJ International Limited: Cornwall, UK, 2010. [Google Scholar]
- Giakoumis, E.G.; Rakopoulos, C.D.; Dimaratos, A.M.; Rakopoulos, D.C. Exhaust Emissions of Diesel Engines Operating under Transient Conditions with Biodiesel Fuel Blends. Prog. Energy Combust. Sci. 2012, 38, 691–715. [Google Scholar] [CrossRef]
- Hughes, S.R.; Qureshi, N. Biofuel Demand Realization. In Biomass to Biofuels; Vertes, A., Qureshi, N., Blaschek, P., Yukawa, H., Eds.; Blackwell Publishing Ltd.: Oxford, UK, 2010; pp. 55–69. [Google Scholar] [CrossRef]
- Mofijur, M.; Masjuki, H.H.; Kalam, M.A.; Hazrat, M.A.; Liaquat, A.M.; Shahabuddin, M.; Varman, M. Prospects of Biodiesel from Jatropha in Malaysia. Renew. Sustain. Energy Rev. 2012, 16, 5007–5020. [Google Scholar] [CrossRef]
- Mofijur, M.; Masjuki, H.H.; Kalam, M.A.; Atabani, A.E. Evaluation of Biodiesel Blending, Engine Performance and Emissions Characteristics of Jatropha Curcas Methyl Ester: Malaysian Perspective. Energy 2013, 55, 879–887. [Google Scholar] [CrossRef]
- Bhuiya, M.M.K.; Rasul, M.G.; Khan, M.M.K.; Ashwath, N.; Azad, A.K. Prospects of 2nd Generation Biodiesel as a Sustainable Fuel—Part: 1 Selection of Feedstocks, Oil Extraction Techniques and Conversion Technologies. Renew. Sustain. Energy Rev. 2016, 55, 1109–1128. [Google Scholar] [CrossRef]
- Ahmad, T.; Danish, M.; Kale, P.; Geremew, B.; Adeloju, S.B.; Nizami, M.; Ayoub, M. Optimization of Process Variables for Biodiesel Production by Transesterification of Flaxseed Oil and Produced Biodiesel Characterizations. Renew. Energy 2019, 139, 1272–1280. [Google Scholar] [CrossRef]
- Luque, R.; Lin, C.S.K.; Wilson, K.; Clark, J.H. Handbook of Biofuels Production: Processes and Technologies, 2nd ed.; Woodhead Publishing: Duxford, UK, 2016. [Google Scholar]
- Hawi, M.; Elwardany, A.; Ismail, M.; Ahmed, M.; Hawi, M.; Elwardany, A.; Ismail, M.; Ahmed, M. Experimental Investigation on Performance of a Compression Ignition Engine Fueled with Waste Cooking Oil Biodiesel–Diesel Blend Enhanced with Iron-Doped Cerium Oxide Nanoparticles. Energies 2019, 12, 798. [Google Scholar] [CrossRef]
- Kamil, M.; Ramadan, K.M.; Awad, O.I.; Ibrahim, T.K.; Inayat, A.; Ma, X. Environmental Impacts of Biodiesel Production from Waste Spent Coffee Grounds and Its Implementation in a Compression Ignition Engine. Sci. Total Environ. 2019, 675, 13–30. [Google Scholar] [CrossRef]
- Azeem, M.W.; Hanif, M.A.; Al-Sabahi, J.N.; Khan, A.A.; Naz, S.; Ijaz, A. Production of Biodiesel from Low Priced, Renewable and Abundant Date Seed Oil. Renew. Energy 2016, 86, 124–132. [Google Scholar] [CrossRef]
- Food and Agriculture Organization of the United Nations Organization, FAO. FAO Statistical Year Book, World Food and Agriculture. Available online: http://www.fao.org/faostat/en/#data/QC (accessed on 16 May 2019).
- Mrabet, A.; Ferchichi, A.; Chaira, N.; Mohamed, B.S.; Baaziz, Z.; Penny, T.M. Physico-Chemical Characteristics and Total Quality of Date Palm Varieties Grown in the Southern of Tunisia. Pakistan J. Biol. Sci. PJBS 2008, 11, 1003–1008. [Google Scholar] [CrossRef]
- Afiq, A.; Rahman, A.; Man, C. Date Seed and Date Seed Oil 1. Int. Food Res. J. 2013, 20, 2035–2043. [Google Scholar]
- Al-Farsi, M.; Alasalvar, C.; Al-Abid, M.; Al-Shoaily, K.; Al-Amry, M.; Al-Rawahy, F. Compositional and Functional Characteristics of Dates, Syrups, and Their By-Products. Food Chem. 2007, 104, 943–947. [Google Scholar] [CrossRef]
- Besbes, S.; Drira, L.; Blecker, C.; Deroanne, C.; Attia, H. Adding Value to Hard Date (Phoenix Dactylifera L.): Compositional, Functional and Sensory Characteristics of Date Jam. Food Chem. 2009, 112, 406–411. [Google Scholar] [CrossRef]
- Besbes, S.; Blecker, C.; Deroanne, C.; Drira, N.E.; Attia, H. Date Seeds: Chemical Composition and Characteristic Profiles of the Lipid Fraction. Food Chem. 2004, 84, 577–584. [Google Scholar] [CrossRef]
- Vandepopuliere, J.M.; Al-Yousef, Y.; Lyons, J.J. Dates and Date Pits as Ingredients in Broiler Starting and Coturnix Quail Breeder Diets. Poult. Sci. 1995, 74, 1134–1142. [Google Scholar] [CrossRef]
- Al-Farsi, M.A.; Lee, C.Y. Usage of Date (Phoenix Dactylifera L.) Seeds in Human Health and Animal Feed. In Nuts and Seeds in Health and Disease Prevention; Academic Press: Burlington, MA, USA, 2011; pp. 447–452. [Google Scholar]
- Ali-Mohamed, A.Y.; Khamis, A.S.H. Mineral Ion Content of the Seeds of Six Cultivars of Bahraini Date Palm (Phoenix Dactylifera). J. Agric. Food Chem. 2004, 52, 6522–6525. [Google Scholar] [CrossRef]
- Rahman, M.S.; Kasapis, S.; Al-Kharusi, N.S.Z.; Al-Marhubi, I.M.; Khan, A.J. Composition Characterisation and Thermal Transition of Date Pits Powders. J. Food Eng. 2007, 80, 1–10. [Google Scholar] [CrossRef]
- Devshony, S.; Eteshola, E.; Shani, A. Characteristics and Some Potential Applications of Date Palm (Phoenix Dactylifera L.) Seeds and Seed Oil. J. Am. Oil Chem. Soc. 1992, 69, 595–597. [Google Scholar] [CrossRef]
- Jamil, F.; Al-Muhtaseb, A.H.; Al-Haj, L.; Al-Hinai, M.A.; Hellier, P.; Rashid, U. Optimization of Oil Extraction from Waste “Date Pits” for Biodiesel Production. Energy Convers. Manag. 2016, 117, 264–272. [Google Scholar] [CrossRef]
- Al-Zuhair, S.; Taher, H.; Al Dhaheri, S.; Wajeeh, S.; Nour, M.; El-Najjar, E. Biodiesel Production from Oils Extracted from Date Pits. Green Sustain. Chem. 2017, 07, 48–56. [Google Scholar] [CrossRef]
- Nehdi, I.; Omri, S.; Khalil, M.I.; Al-Resayes, S.I. Characteristics and Chemical Composition of Date Palm (Phoenix Canariensis) Seeds and Seed Oil. Ind. Crop. Prod. 2010, 32, 360–365. [Google Scholar] [CrossRef]
- Yousuf, R.G.; Winterburn, J.B. Waste Date Seed Oil Extract as an Alternative Feedstock for Poly(3-Hydroxybutyrate) Synthesis. Biochem. Eng. J. 2017, 127, 68–76. [Google Scholar] [CrossRef]
- Akaagerger, S.M.; Giwa, S.O.; Ibrahim, M.G. Production of Biodiesel from Desert Date Seed Oil. Int. J. ChemTech Res. 2016, 9, 453–463. [Google Scholar]
- Sanford, S.; White, J.; Shah, P. Feedstock and Biodiesel Characteristics Report; Renewable Energy Group: Ames, IA, USA, 2009. [Google Scholar]
- Farooq, M.; Ramli, A.; Naeem, A.; Mahmood, T.; Ahmad, S.; Humayun, M.; Islam, M.G.U. Biodiesel Production from Date Seed Oil (Phoenix Dactylifera L.) via Egg Shell Derived Heterogeneous Catalyst. Chem. Eng. Res. Des. 2018, 132, 644–651. [Google Scholar] [CrossRef]
- Majewski, W.A.; Khair, M.K. Diesel Emissions and Their Control; Society of Automotive Engineers (SAE): Wallendale, PA, USA, 2006. [Google Scholar]
- Chauhan, B.S.; Kumar, N.; Cho, H.M. A Study on the Performance and Emission of a Diesel Engine Fueled with Jatropha Biodiesel Oil and Its Blends. Energy 2012, 37, 616–622. [Google Scholar] [CrossRef]
- Aydin, H.; Bayindir, H. Performance and Emission Analysis of Cottonseed Oil Methyl Ester in a Diesel Engine. Renew. Energy 2010, 35, 588–592. [Google Scholar] [CrossRef]
- An, H.; Yang, W.M.; Maghbouli, A.; Li, J.; Chou, S.K.; Chua, K.J. Performance, Combustion and Emission Characteristics of Biodiesel Derived from Waste Cooking Oils. Appl. Energy 2013, 112, 493–499. [Google Scholar] [CrossRef]
- Chauhan, B.S.; Kumar, N.; Cho, H.M.; Lim, H.C. A Study on the Performance and Emission of a Diesel Engine Fueled with Karanja Biodiesel and Its Blends. Energy 2013, 56, 1–7. [Google Scholar] [CrossRef]
- Horner, J.M. Anthropogenic Emissions of Carbon Monoxide. Rev. Environ. Health 2000, 15, 289–298. [Google Scholar] [CrossRef]
- Ulusoy, Y.; Arslan, R.; Kaplan, C. Emission Characteristics of Sunflower Oil Methyl Ester. Energy Sources Part A Recover. Util. Environ. Eff. 2009, 31, 906–910. [Google Scholar] [CrossRef]
- Ong, H.C.; Masjuki, H.H.; Mahlia, T.M.I.; Silitonga, A.S.; Chong, W.T.; Yusaf, T. Engine Performance and Emissions Using Jatropha Curcas, Ceiba Pentandra and Calophyllum Inophyllum Biodiesel in a CI Diesel Engine. Energy 2014, 69, 427–445. [Google Scholar] [CrossRef]
- Richards, P. Automotive Fuels Reference Book, 3rd ed.; SAE International: Wallendale, PA, USA, 2014. [Google Scholar]
- Xue, J.; Grift, T.E.; Hansen, A.C. Effect of Biodiesel on Engine Performances and Emissions. Renew. Sustain. Energy Rev. 2011, 15, 1098–1116. [Google Scholar] [CrossRef]
- Suresh, M.; Jawahar, C.P.; Richard, A. A Review on Biodiesel Production, Combustion, Performance, and Emission Characteristics of Non-Edible Oils in Variable Compression Ratio Diesel Engine Using Biodiesel and Its Blends. Renew. Sustain. Energy Rev. 2018, 92, 38–49. [Google Scholar] [CrossRef]
- Usta, N. An Experimental Study on Performance and Exhaust Emissions of a Diesel Engine Fuelled with Tobacco Seed Oil Methyl Ester. Energy Convers. Manag. 2005, 46, 2373–2386. [Google Scholar] [CrossRef]
- Hasan, M.M.; Rahman, M.M. Performance and Emission Characteristics of Biodiesel–Diesel Blend and Environmental and Economic Impacts of Biodiesel Production: A Review. Renew. Sustain. Energy Rev. 2017, 74, 938–948. [Google Scholar] [CrossRef]
- Qi, D.H.; Geng, L.M.; Chen, H.; Bian, Y.Z.; Liu, J.; Ren, X.C. Combustion and Performance Evaluation of a Diesel Engine Fueled with Biodiesel Produced from Soybean Crude Oil. Renew. Energy 2009, 34, 2706–2713. [Google Scholar] [CrossRef]
- Kim, H.; Choi, B. The Effect of Biodiesel and Bioethanol Blended Diesel Fuel on Nanoparticles and Exhaust Emissions from CRDI Diesel Engine. Renew. Energy 2010, 35, 157–163. [Google Scholar] [CrossRef]
- Giakoumis, E.; Sarakatsanis, C.; Giakoumis, E.G.; Sarakatsanis, C.K. A Comparative Assessment of Biodiesel Cetane Number Predictive Correlations Based on Fatty Acid Composition. Energies 2019, 12, 422. [Google Scholar] [CrossRef]
- Carslaw, D.C.; Rhys-Tyler, G. New Insights from Comprehensive On-Road Measurements of NOx, NO2 and NH3 from Vehicle Emission Remote Sensing in London, UK. Atmos. Environ. 2013, 81, 339–347. [Google Scholar] [CrossRef]
- Environmental Protection Agency (EPA). Nitrogen Oxides (NOx), Why and How They Are Controlled; Clean Air Technology Center Report (MD-12): Research Triangle Park, NC, USA, 1999.
- Heywood, J. Internal Combustion Engine Fundamentals, 2nd ed.; McGraw-Hill Education: New York, NY, USA, 2018. [Google Scholar]
- Pundir, B.P. Engine Emissions: Fundamentals and Advances in Control, 2nd ed.; Alpha Science International Ltd.: Oxford, UK, 2008. [Google Scholar]
- Lin, C.Y.; Lin, H.A. Diesel Engine Performance and Emission Characteristics of Biodiesel Produced by the Peroxidation Process. Fuel 2006, 85, 298–305. [Google Scholar] [CrossRef]
- Lin, C.Y.; Li, R.J. Engine Performance and Emission Characteristics of Marine Fish-Oil Biodiesel Produced from the Discarded Parts of Marine Fish. Fuel Process. Technol. 2009, 90, 883–888. [Google Scholar] [CrossRef]
- Tat, M.E.; Van Gerpen, J.H. Measurement of Biodiesel Speed of Sound and Its Impact on Injection Timing; Report 4 in a Series of 6 (No. NREL/SR-510-31462); National Renewable Energy Lab.: Golden, CO, USA, 2003.
- Ghobadian, B.; Rahimi, H.; Nikbakht, A.M.; Najafi, G.; Yusaf, T.F. Diesel Engine Performance and Exhaust Emission Analysis Using Waste Cooking Biodiesel Fuel with an Artificial Neural Network. Renew. Energy 2009, 34, 976–982. [Google Scholar] [CrossRef]
- Meng, X.; Chen, G.; Wang, Y. Biodiesel Production from Waste Cooking Oil via Alkali Catalyst and Its Engine Test. Fuel Process. Technol. 2008, 89, 851–857. [Google Scholar] [CrossRef]
- Wu, F.; Wang, J.; Chen, W.; Shuai, S. A Study on Emission Performance of a Diesel Engine Fueled with Five Typical Methyl Ester Biodiesels. Atmos. Environ. 2009, 43, 1481–1485. [Google Scholar] [CrossRef]
- Puhan, S.; Vedaraman, N.; Ram, B.V.B.; Sankarnarayanan, G.; Jeychandran, K. Mahua Oil (Madhuca Indica Seed Oil) Methyl Ester as Biodiesel-Preparation and Emission Characterstics. Biomass Bioenergy 2005, 28, 87–93. [Google Scholar] [CrossRef]
- Golimowski, W.; Krzaczek, P.; Marcinkowski, D.; Gracz, W.; Wałowski, G. Impact of Biogas and Waste Fats Methyl Esters on NO, NO2, CO, and PM Emission by Dual Fuel Diesel Engine. Sustainability 2019, 11, 1799. [Google Scholar] [CrossRef]
- Lozhkina, O.V.; Lozhkin, V.N. Estimation of Nitrogen Oxides Emissions from Petrol and Diesel Passenger Cars by Means of On-Board Monitoring: Effect of Vehicle Speed, Vehicle Technology, Engine Type on Emission Rates. Transp. Res. Part D Transp. Environ. 2016, 47, 251–264. [Google Scholar] [CrossRef]
- Duda, K.; Wierzbicki, S.; Śmieja, M.; Mikulski, M. Comparison of Performance and Emissions of a CRDI Diesel Engine Fuelled with Biodiesel of Different Origin. Fuel 2018, 212, 202–222. [Google Scholar] [CrossRef]
- Koszałka, G.; Hunicz, J. Detailed Speciation of Emissions from a Diesel Engine Fuelled with Canola Methyl Ester. In Proceedings of the BulTrans-2018, 10th International Scientific Conference on Aeronautics, Automotive and Railway Engineering and Technologies, Sozopol, Bulgaria, 15–17 September 2018; Volume 234. [Google Scholar] [CrossRef][Green Version]
© 2019 by the authors. Licensee MDPI, Basel, Switzerland. This article is an open access article distributed under the terms and conditions of the Creative Commons Attribution (CC BY) license (http://creativecommons.org/licenses/by/4.0/).