Article

The Effect of Accelerated Aging Conditions on the Properties of Rigid Polyurethane-Polyisocyanurate Foams Modified by Cinnamon Extract

by
Joanna Liszkowska
1,*,
Krzysztof Moraczewski
2,
Marcin Borowicz
1,
Joanna Paciorek-Sadowska
1,
Bogusław Czupryński
1 and
Marek Isbrandt
1
1
Department of Chemistry and Technology of Polyurethanes, Technical Institute, Faculty of Mathematics, Physics and Technical Science, Kazimierz Wielki University, J. K. Chodkiewicza Street 30, Bydgoszcz 85064, Poland
2
Department of Materials Engineering, Technical Institute, Faculty of Mathematics, Physics and Technical Science, Kazimierz Wielki University, J. K. Chodkiewicza Street 30, Bydgoszcz 85064, Poland
*
Author to whom correspondence should be addressed.
Appl. Sci. 2019, 9(13), 2663; https://doi.org/10.3390/app9132663
Submission received: 30 May 2019 / Revised: 26 June 2019 / Accepted: 27 June 2019 / Published: 29 June 2019
(This article belongs to the Section Materials Science and Engineering)

Abstract

:
Two series of rigid polyurethane-polyisocyanurate foams (RPU/PIR) modified by cinnamon extract (series C_0t and CU_0t) were obtained. One RPU/PIR series contained a commercial flame retardant (C_0t) in the formulation. The other was produced without its participation (CU_0t). The basic properties of obtained foams, e.g., apparent density, brittleness, water absorption, compressive strength, flammability were examined. Afterwards, both series of foams (C_0t and CU_0t) were subjected to degradation in the climatic chamber, acting on samples of foams a defined temperature, humidity and UV radiation for a seven days. In this way, two successive series of RPU/PIR foams were obtained, which were designated, respectively, C_1t and CU_1t, Chosen properties of degraded foams such as: compressive strength, cellular structure by scanning electron microscopy (SEM) and changes of chemical structure by FTIR spectroscopy were determined. Compressive strength and the aging resistance was also determined (against the coefficient of compressive strength variation (CV). The possible replacement of a commercial flame retardant in polyurethane formulations by the antioxidant raw material (cinnamon extract) was evaluated.

Graphical Abstract

1. Introduction

The field of polyurethanes (PU) is one of the fastest growing fields of polymer technology. Intensive research is conducted to modify their properties for meeting the requirements of customers [1]. Foams used in civil engineering as construction or insulation materials require adequate strength, resistance to aging and weather conditions, dimensional and thermal stability, and fire resistance [2,3]. The literature presents issues related to the possibility of delaying the burning of foams, improving dimensional stability, insulating and mechanical properties [4,5,6]. Possibility of modifying of polyol premixes by biopolyols, improves some properties of PU foams [7,8,9]. Many renewable sources are used for the development of polyurethane foams (PUF) and other PU products. Polyols, a raw material of PU foam, have been also derived from different renewable sources, e.g., from vegetable oils, sugarcane bagasse, and pine wood. These bioproducts are used to produce environmentally friendly PU products. Additionally, ground coffee waste could be used in acid liquefaction polyhydric solvents (e.g., PEG 400/glycerol, 90/10 wt/wt) in the presence of sulfuric acid [10,11]. Thermogravimetric analysis (TGA) confirmed that these bio-based PUFs were thermally stable up to 190 °C. Foams regained their original shape even after 70% of creep compression, which showed their good elastic behavior. They can be used as thermal and acoustic insulation, even in aeronautics.
Antioxidants (e.g., lactone-based, phenols in combination with phosphites or tioesters) could decrease the scorch. A large number of factors may promote scorch in flexible foams: high water content in the formulation, a high isocyanate index, FR additives, pigments, methylene chloride-based blowing agent, high ambient humidity, collapsed foam layers, air flow, smaller size of cells, foam block size, metal traces, hydroperoxides, or free ethylene oxide content of polyol. Pentabromodiphenyl oxide blended with aromatic phosphates showed higher thermal and hydrolytic stability did not promote a scorch of flexible PUFs [12].
Factors such as thermal, electrical, electrochemical aging, mechanical, environmental exposure, and others have a significant influence on the decrease of the properties of insulating materials during their handling. The phenomenon of decreasing properties with time lapse is called aging or lack of resistance (durability) to climate change. In order to prevent it, additive agents (so-called antioxidants) are added.
Aging of materials is structural changes occurring in the whole mass of the material, in the long time. It usually leads to the decrease of their functional properties. The basic factors causing aging are: temperature, sunlight, humidity, chemical agents, and microorganisms. The behavior of the material under the influence of these factors during it using is difficult to predict [13,14]. It is difficult to distinguish a dominant degradation factor during aging under natural climatic conditions, because all of its affect simultaneously [15]. The most common changes occurring in the polymer during the aging process are: crosslinking, oxidation (thermooxidation), degradation, and destruction.
The concepts of resistance and durability are very often used in the description of aging materials. Hardiness is a material resistance that it puts into action by specific destructive chemical, physico-chemical, physical, or biological factors. Durability is the average time after which the selected material property becomes extremely permissive as a result of aging processes, i.e., it reaches a critical level. The critical level is defined as the determined absolute value of the measured quantity or the percentage change of this value in relation to its initial value. The aging time is also taken into account [16].
Accelerated aging is the process that is most often carried out to estimate the resistance to a decrease of the parameters of the tested material over time. This is a simulation of natural aging in a shortened time. Subjecting plastics to accelerated aging causes a decrease in mechanical properties, e.g., strength [3,17]. Aging of polyurethane foams is tested mainly by measuring changes of linear dimension, geometric volume, and mass after 48 hours of thermostating in a dryer with forced circulation [1,18]. The smallest change in dimensions or the volume of foam is extremely important in using it as thermal insulation. Properly selected industrial insulation affects not only the saving of energy costs, but also the correct operation of the technological installation [19].
PUFs’ aging can also take place under conditions of simulated solar radiation, so-called photodegradation [9], and in a climatic chamber [20]. Polyphenols contained in cinnamon extract are used also in cosmetics, coffee, tea or cocoa, and as anti-oxidants to prevent the aging process [21,22]. Phenolic antioxidants are used for polyolefins [23].
The aim of the study was to determine the effect of cinnamon extract in synergy with a flame retardant (Antiblaze TCMP) on the structure, aging, and mechanical and functional properties of RPU/PIR foams. The influence of this biofiller on the properties of foams without flame retardant was also examined. Antiblaze TCMP contains in its composition chlorine and phosphorus [24], compounds of this type are currently limited due to the negative impact on the natural environment [25]. In relation with the above, the possibility of replacing a commercial flame retardant with a cinnamon extract (used until now in the cosmetics industry) has also been checked. The obtaining polyurethane-polyiscoyanurate (RPU/PIR) foams were also subjected to an accelerated aging tests two ways (air dryer and air conditioner) [26,27]. Among others, the analysis of foams before and after aging in infrared spectroscopy (FTIR) and the analysis of their structure by scanning electron microscopy (SEM) was also performed.

2. Materials and Methods

2.1. Materials

Rokopol RF-551, a sorbitol oxyalkylation product (PCC Rokita S.A., Brzeg Dolny, Poland), was used as a reference polyol (hydroxyl number 420 mg KOH/g, molecular weight = 650 g/mol, functionality 4,5), to prepare RPU/PIR foams. Catalytic system in the RPU/PIR formulation were 33% solution of anhydrous potassium acetate (Chempur, Piekary Śląskie, Poland) in diethylene glycol (Chempur, Piekary Śląskie, Poland), as a trimerization catalyst and 33% solution of DABCO—1,4-diazabicyclo[2.2.2]octane (Alfa Aesar, Haverhill, MA, USA) in diethylene glycol—as a polyurethane bond catalyst. The stabilizer of the foam structure was poly (oxyalkilene siloxane) surfactant Tegostab 8460 (Evonik, Essen, Germany). Carbon dioxide produced in situ in the reaction between water and isocyanate groups was a blowing agent. Furthermore, a commercial flame retardant, Antiblaze TCMP—tris-(2-chloropropyl) phosphate (Albemarle, Charlotte, NC, USA)—was added into some of the foams. The isocyanate raw material was a technical polymeric diisocyanate Purocyn B (supplied by Purinova, Bydgoszcz, Poland), whose main component was 4,4’-diphenyl-methane-diisocyanate (MDI). The density of Purocyn B at a temperature of 25 °C was 1.23 g/cm3, viscosity was 200 mPas, and content of –NCO groups was 31.0%. Polyether and diisocyanate were characterized in accordance with appropriate standards like ASTM D 2849-69 and ASTM D 1638-70. Cinnamon extract—CE (Agrema Sp. z o.o., Wroclaw, Poland)—was used as a physical filler. According to the manufacturer information, this extract contains 5% of polyphenols. The main polyphenols in the cinnamon extract were, respectively, chlorogenic acid, flavonoids, and phenolic acids. In this biofiller are also metals in trace amounts (Table 1). The rest of the extract was an inert carrier of the active substances (polyphenols) [28]. Cinnamon was analyzed by FTIR technique (Figure 1). Cellulose in cinnamon comes from the bark of a cinnamon tree.
FTIR analysis of cinnamon (Figure 1) showed the presence of groups –OH (3346.25 cm−1) and –C-H (2928.26 cm−1, 1416.64 cm−1, 1367.87 cm−1, 848.63 cm−1) derived from –CH2OH or from the ring in cellulose; the aromatic ring (1631.68 cm−1, 763.47 cm−1, and 707.31 cm−1) derived from cellulose, flavonoids, and phenol acids; and 1152.23 cm−1 represents the aromatic ether from flavonoids. –OH groups can be largely derived from cellulose.

2.2. Synthesis of the Rigid PUR-PIR Foams

Foam formulations (Table 1) were calculated based on the reference sources [1,29]. Detailed calculations are provided in cited articles [30,31]. The basic components of the foams are: polyol and polyisocyanate. Two types of catalysts are used: amine (Dabco) and organometallic (Catalyst 12). The first one catalyzes crosslinking reactions, the second accelerates the reaction of isocyanate groups with hudroxyl groups. Tegostab surfactant is necessary to stabilize the structure of foams, facilitating the mixing of ingredients. Water was used as the foaming agent, which forms CO2 in reaction with the –NCO groups [29]. PUFs were prepared at a laboratory scale by a one-step method from the two-component system (A and B) in the mass equivalent (R) ratio of NCO groups to OH groups equal 3,7:1 [29]. An increased amount of polyisocyanate (3.7 R instead of 3.0 R) was used for the reaction of polyisocyanate with water. The NCO group chemical equivalent (R) was calculated according to Equation (1):
R N C O = 4200 31 % NCO
where %NCO is the content of the NCO group in the polyisocyanate raw material (%).
The hydroxyl group chemical equivalent (R) was calculated according to the following equation:
R O H = 56100 HN
where HN is the hydroxyl number of Rokopol RF-551 (mg KOH/g).
The component A (polyol premix) was obtained by the precise mixing of the suitable amounts of Rokopol RF-551 (66.80 g) trimerization catalyst (8.00 g), polyurethane bond catalyst (3.20 g), flame retardant (47.60 g), surfactant (5.40 g), chemical blowing agent (CO2 (distilled water was used in an amount of 3.15 g)), and biofiller. Ground cinnamon extract was added in amounts of 5 wt%, 10 wt%, and 15 wt% (Table 2). The selection of fillers and flame retardants was made on the basis of the symplex planning triangle [32]. The considered premixes contained a variable amount of cinnamon extract and a constant amount of flame retardant (C_0t series) or a variable amount of cinnamon extract without flame retardant (series CU_0t). Two reference premixes without fillers were also obtained: W_0t (with flame retardant) and WU_0t (without flame retardant). Component B was polyisocyanate Purocyn B in the amount of 250.60 g. Both components A and B were mixed (1800 rpm, 10 s) at their respective mass ratios and poured into an open cuboidal mold with internal dimensions of 190 × 190 × 230 mm. Two series of modified foams (C and CU) and two reference foams (W and WU) were obtained.

2.3. Methods

2.3.1. Foaming Process

The foaming process was analyzed in accordance with ASTM D7487 13e—Standard Practice for Polyurethane Raw Materials: Polyurethane Foam Cup Test [33]. Measured by electronic stopwatch to determine the characteristic foaming times in accordance: cream time: from the start of mixing components A and B until fine bubbles appeared; free rise time: from the start of mixing components A and B until the foam stops expanding; string gel time: from the start of mixing components A and B until long strings of tacky material can be pulled away from foam surface when the surface is touched by a tongue depressor; and the tack-free time: from the start of mixing components A and B until the foam surface can be touched by a tongue depressor without sticking. The maximum reaction temperature (Tmax) in the foams was measured during its synthesis by using a thermometer placed in the center of the obtained RPU/PIR foams.

2.3.2. Foam Aging was Carried Out Using Two Methods

Accelerated Aging Tests

Accelerated aging tests of the RPU/PIR foams was carried out by the thermostating process of a cubic specimen with a side length of 50 mm in 48 h at temperature of 120 °C. The samples were thermostated in a dryer with forced air circulation. The result of this test were change of linear dimensions (Δl), change of geometrical volume (ΔV), and mass loss (Δm). Values of these parameters were calculated in accordance with ISO 1923: 1981 and PN–EN ISO 4590: 2016-11. The formulas for calculations Δl, ΔV, Δm are shown in Equations (3)–(5):
Δ l = l l 0 l 0 · 100 %
where l0 is the length of the sample before thermostating, according to the direction of foam rise (mm), and l is the length of the sample after thermostating, according to the direction of foam rise (mm).
Δ V = V V 0 V 0 · 100 %
where V0 is the geometrical volume of the sample before thermostating (mm3), and V is the geometrical volume of the sample after thermostating (mm3).
Δ m = m 0 m m 0 · 100 %
where m0 is the mass of the sample before thermostating (g), and m is the mass of the sample after thermostating (g).

Aging in a Climate Chamber

Aging in a climate chamber consisted of the controlled submission of samples to treatment destructive factors, i.e., increased temperature, humidity, and UV radiation, at the same time. This mechanical property plays a significant role during the using of foams in civil engineering, especially in structural applications [15]. Aging due to the action on samples of heat foams, UV radiation, and moisture was marked in a set time interval of seven days (the series was marked C_1t and CU_1t). The cubic specimens with a side length of 50 mm were also separately aged during the seven days (for compressive strength tests). It consisted in placing samples in a heated heating chamber up to 50 °C, 70% relative humidity, and irradiance of 320.86 W/m2. For aging tests, the climate chamber (DYCOMETAL CCK, model CCK-40/300 NG, Es-tor L.T.D., Poznań, Poland) was used for tests with artificial light with UV lighting. The chamber has 8 fluorescent lamps (PHILIPS SUPER ACTINICA TL 60 W / 10-R ISL). The fluorescence wavelength range was between 350–400 nm) [34]. The dimensions of the chamber were 0.572 m × 0.654 m. Heating was set at 4 °C/min for the first hour according to IEC 60068-3-5 (for an empty chamber). Then, the temperature was kept constant for a certain time (seven days). Samples were placed directly under the lamps, so that the sample distance the lamp was as small as possible. The radiation from the lamps fell at an angle of 90° to the surface of the samples. The heating was carried out in a continuous mode, without opening the chamber. This action was aimed at deteriorating the physico-mechanical properties of the samples tested [18]. This does not fully reflect the changes that occur during the natural aging process, but it is sufficient to quantify decrease of samples strength coefficient of compressive strength variation (CV) and to assess the effect of given degradation conditions on DSC and strength. The samples were removed from the chamber after ending of the heating and one week degradation). The degraded area was evaluated for selected properties of ambient conditions. The obtained results of selected tests of one-week-aged foams (series 1 t) and results of pre-aging tests in a climatic chamber (series 0 t) were compared. In this way, the combined effect of temperature, UV radiation, and moisture on selected foam properties (compressive strength, DSC, FTIR, change of linear dimensions, change of geometrical volume and mass loss) was determined.

2.3.3. Apparent Density

The apparent density of the obtained foams was determined as the ratio of foam weight to its geometrical volume, using cubic samples with side length of 50 mm in accordance with the ISO 845:2006 standard.

2.3.4. Flammability Tests

A simplified flammability chimney test (called also Bütler’s combustion test or vertical test) was carried out in accordance with ASTM D3014-04. The apparatus used for this flammability test consists of a vertical column with dimensions 300 × 57 × 54 mm where three walls are made of sheet metal, and the fourth is a movable window. The test was performed on six specimens with dimensions of 150 × 19 × 19 mm. Before combustion the sample was weighed to an accuracy of 0.0001 g, then it was placed inside the chimney. The samples were burned by the flame from the burner fueled by propane-butane gas mixture at a time of 10 s. Then the burner was moved away. Combustion residue was calculated according to Equation (6):
C R = m b m a · 100 %
where ma is the mass of the sample before burning test (g), and mb is the mass of the sample after burning test (g).
Flammability was tested based on a marker method in accordance with the PN–EN ISO 4589-2:2006 standard by a Limited Oxygen Index Module apparatus (Concept Equipment, Phoenix Court, Rustington, Great Britain). This test determined the boundary percentile volume of oxygen in a mixture of oxygen and nitrogen needed for sustaining the burning of the sample 150 × 13 × 13 mm in dimension. The limited oxygen index in percentage by volume of oxygen in the mixture is determined from Equation (7):
L O I = [ O 2 ] [ O 2 ] + [ N 2 ] · 100 %
where O2 is the volumetric flow rate of oxygen (m3/h), and N2 is the volumetric flow rate of nitrogen (m3/h).
Another burning test was conducted by using the horizontal method according to the PN-78 C-05012 standard. This method marked the speed of surface flame spreading on a sample 150 × 50 × 13 mm dimensions, which was placed horizontally and exposed to a flame at one of end. The flame was also from the burner fueled by the propane-butane gas mixture. The speed of surface flame spreading is a speed at which the head of the flame moved on the surface of the flammable sample. During the test the sample foam was placed on a net in a horizontal position and a burner was placed at one side of the foam’s end for 60 s. A line was drawn across the 125 mm mark from the side where the burner was placed. The distance of the flame and the time to reach the marked line need to be noted. If the foam extinguishes before the flame reaches the marker, then the foam is categorized as self-extinguishing. If the foam keeps burning, an average burning time of the marked distance can be determined or the speed of flame spreading (in mm/s) based on the distance the head of the flame covers in a specific time. Flammability of foams was classified according to PN–EN ISO 3582:2002.

2.3.5. Differential Scanning Calorimetry (DSC)

Changes occurring in foams under heat was checked by differential scanning calorimeter DSC Q200 (TA Instruments, New Castle, DE, USA) with built-in Advanced Tzero technology. The apparatus working range was from –90 to +725 °C (foam tests were conducted in the range from 0° C to 400 °C) in one-step heating, under nitrogen flow. The mass of a sample was 2.9–3.1 mg.

2.3.6. Softening Point

Thermal properties of the foams are determined by measuring of their softening point. The Vicat apparatus was used for this temperature measurement. The softening point, as the thermal resistance to compression, was marked by using cubic samples with 20 mm edge (according to the foam rising direction) in accordance with DIN 53424 standard. Foam samples were subjected to compressive load of 24.52 kPa at 50 °C temperature for an hour. The softening point is the temperature at which the sample was compressed by 1 mm.

2.3.7. Compressive Strength and Compressive Strength Ratio

Compressive strength was measured using an Instron universal strength machine 5544 according to PN-93/C-89071 (ISO 844). The compressive strength of foams before degradation (0t series) and after seven days of degradation (1t series) was tested. The aging resistance in relation to the coefficient of variation of compressive strength (CV) was calculated from Equation (8) [15,35] in accordance with ISO 844:2014:
C V = W W 0 · 100 %
where W0 is the compressive strength measured before foam degradation (kPa), and W and compressive strength measured after foam degradation (kPa).

2.3.8. Foam Structure

The foam structure was determined by Hitachi TM 3000 SEM with EDS attachment (Hitachi High-Technologies Co., Tokyo, Japan). The samples were dusted with a gold layer that was about 6 nm thick. The studies were performed at the accelerating voltage of 10 kV, with the working distance 10 mm and magnification at 50×. The statistical analysis of cell sizes was carried out on the basis of obtained micrographs by using ImageJ software (LOCI, Madison, WI, USA).

2.3.9. Absorbability and Water Absorption

Absorbability (A) and water absorption (WA) were determined in accordance with ISO 2896:2001, measured after immersion in distilled water for 24 h. Values of these parameters were calculated from Equations (9) and (10):
A = m A m D m D · 100 %
where mA is the mass of the sample after immersion in distilled water (g), and mD is the mass of the dry sample (g).
W A = m W A m D m D · 100 %
where mWA is the mass of the sample after surface drying (g).

2.3.10. Brittleness

Brittleness was measured according to ASTM C-421-61. Based on the quoted norm, brittleness was calculated as a percentage weight loss of 12 foam cubes (shape of cubes with a side of 25 mm). The brittleness test was carried out in a normalized device, which was a cubic chest made from oak wood with dimensions 190 × 197 × 197 mm. This device was rotated around the axis at 60 rpm. The filling of the chest consisted of 24 oak cubes with side length of 20 mm. The loss of foam weight in percent reflected the value of its brittleness. This parameter was calculated on the basis of Equation (11):
K = m 1 m 2 m 1 · 100 %
where m1 is the mass of the sample before test (g), and m2 is the mass of the sample after test (g).

2.3.11. Chemical Structure

The chemical structure of the obtained foams was evaluated on the basis of infrared spectra obtained by using the Nicolet spectrometer iS10 FTIR spectrophotometer (Thermo Fisher Scientific, Waltham, MA, USA). It has a spectrospcopic range from 7800 to 350 cm−1 and a maximum resolution capability of < 0.4 cm−1 with a DTGS detector.

2.3.12. Content of Closed Cells

The samples before testing the contents of closed cells were seasoned by 24 h. The test of this parameter was carried out in accordance with the PN–EN ISO 4590:2016-11 by using the helium pycnometer AccuPyc 1340 with the FoamPyc software from Micrometrics Instrument Corporation, Norcross, USA. This software calculated the content of closed cells based on the measurement of pressure changes in the test chamber.

2.3.13. Measurement of Foam Color

A standard colorimetric observer (2°), Konica Minolta CR-410, with D65 light source and calibration according to white pattern, produced by Konica Minolta Sensing Americas, Inc, 101 Williams Drive Ramsey, NJ 07446 USA. The device gives the average of three measurements L, a, and b. The difference between the two colors in the space (∆E) was calculated according to Equation (12):
Δ E = ( Δ L ) 2 + ( Δ a ) 2 + ( Δ b ) 2
where L is the vertical axis of the coordinate system defining the brightness; a is the axis of the coordinate the amount of red (positive “a” values), the amount of green (negative “a” values); and b is the axis expressing the amount of yellow color (positive values) or blue (negative values) in color.

3. Results and Discussion

3.1. Foaming Process

The course of the foaming process depends on the raw materials used [36]. Development of the correct composition of the polyol mixture of RPU/PIR foam allows obtaining a product with the desired properties [37]. The foaming agent used in the foaming process has a great influence on the thermal insulation properties of the foams. A suitable catalytic system and surfactant give a cellular structure that ensures the stability of the performance-usable parameters. Two different series of foams were synthesized according to the formulations presented in Table 1. The basic technological parameters of the foaming process of modified PU premixes are characteristic times. Synthesis of RPU/PIR foams was monitored by measuring the appropriate processing times by using an electronic stopwatch. Result of this measurement were shown in Table 3. Addition of a modifier in the form of cinnamon extract contributed to the prolongation of the processing parameters of RPU / PIR foams. Cream times for both of foams series were elongated from 8 s for foam W_0t and WU_0t to 10 s for foams with content of cinnamon extract (foams C series and CU15_0t). Free rise times were also increased from 34 s (for reference foams) to 54 s (C15_0t, foam with 15 wt% of cinnamon extract) and to 44 s (CU15_0t, foam with 15 wt% of cinnamon extract without flame retardant). String gel times were extended about 7 s (for C foams) and about 10 s (for CU foams) in compared with W 0t and WU_0t foam. Modifier cinnamon extract (CE: 5% wt., 10% wt., 15% wt.) influenced the viscosity of the initial mixture. The foaming process was partially disrupted, because the processing parameters slightly increased. There were probably additional reactions between –OH and –COOH groups (from CE) with the isocyanate, thus creating an imbalance in the NCO/OH ratio. This also manifested in the increase in Tmax-modified foams according to the reference foams (Table 3) [38]. Maximum reaction temperatures were increased by about 17–25 °C for modified foams. The process of free growth of the foam and its gelation was disturbed by the addition of cinnamon extract. The free rise time and string gel time increased (respectively, from 34 s to 54 s and from 23 s to 33 s). Elongation of these times is advantageous when obtaining foams in complicated shapes, in which the polyol mixture must thoroughly fill the entire mold.

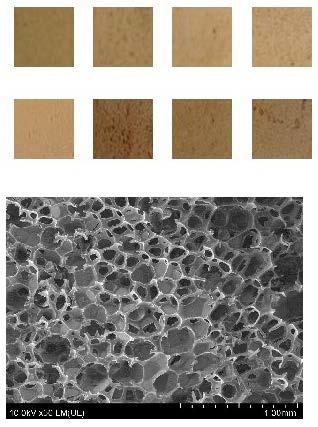
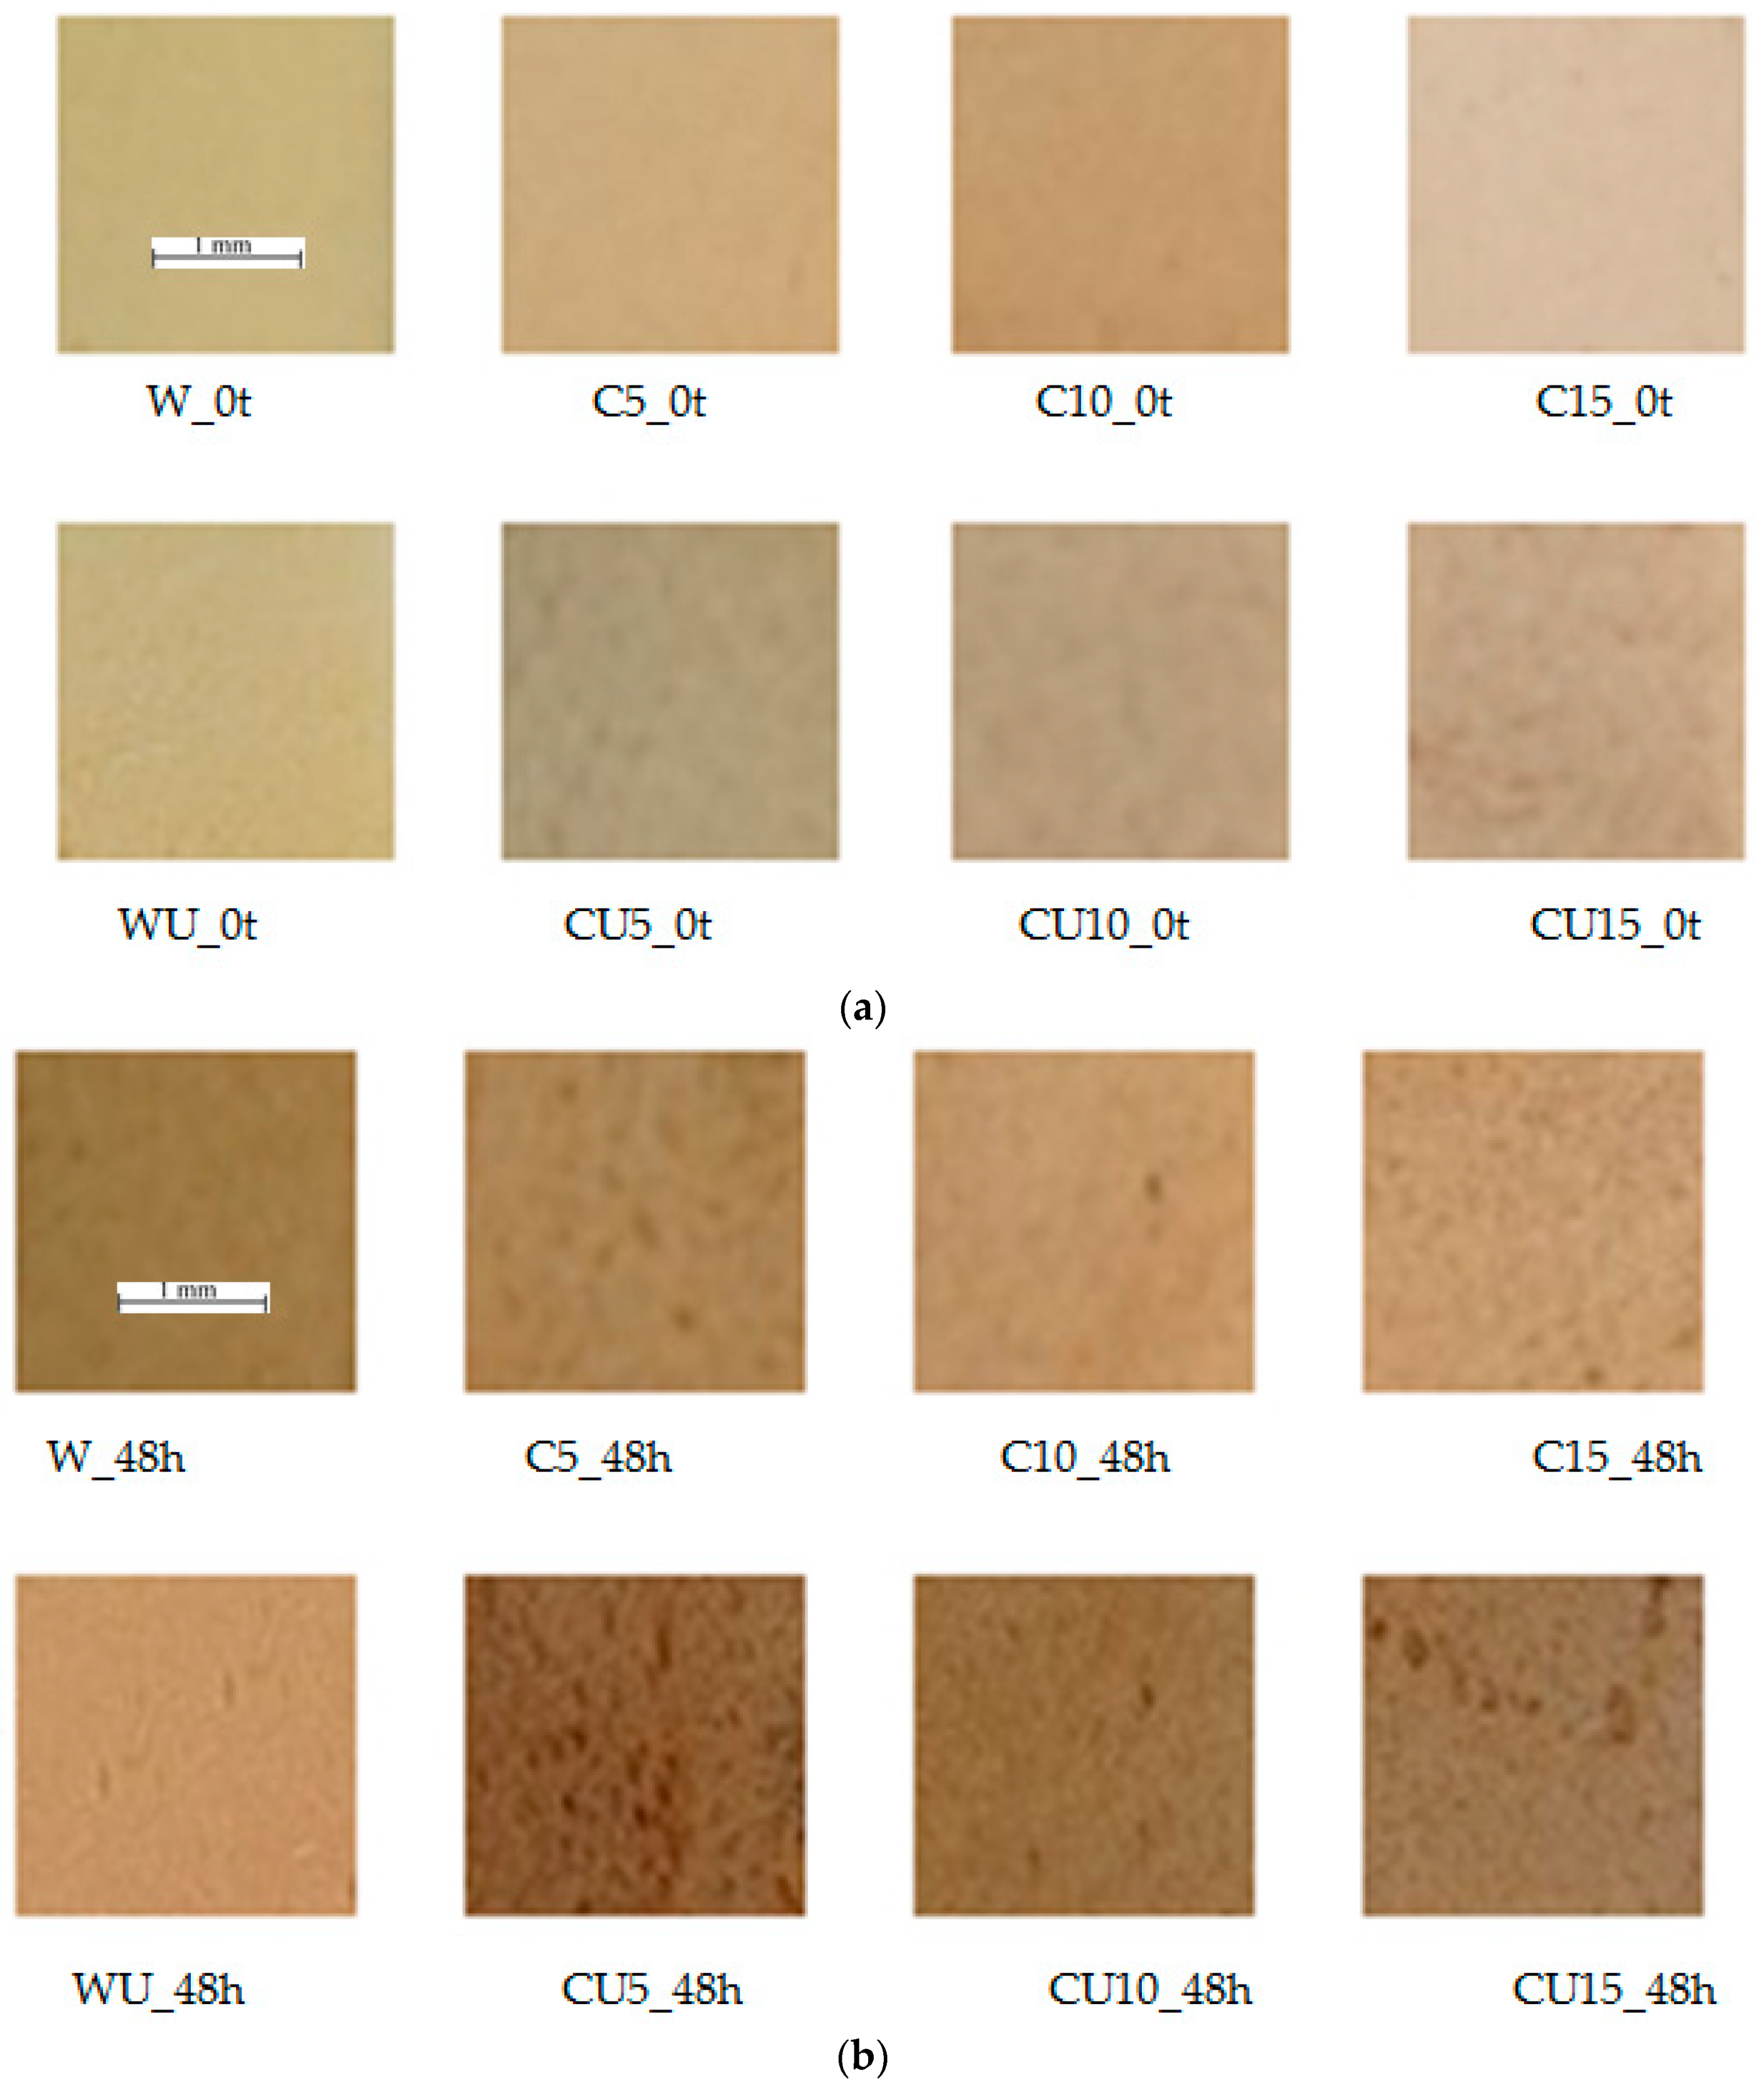
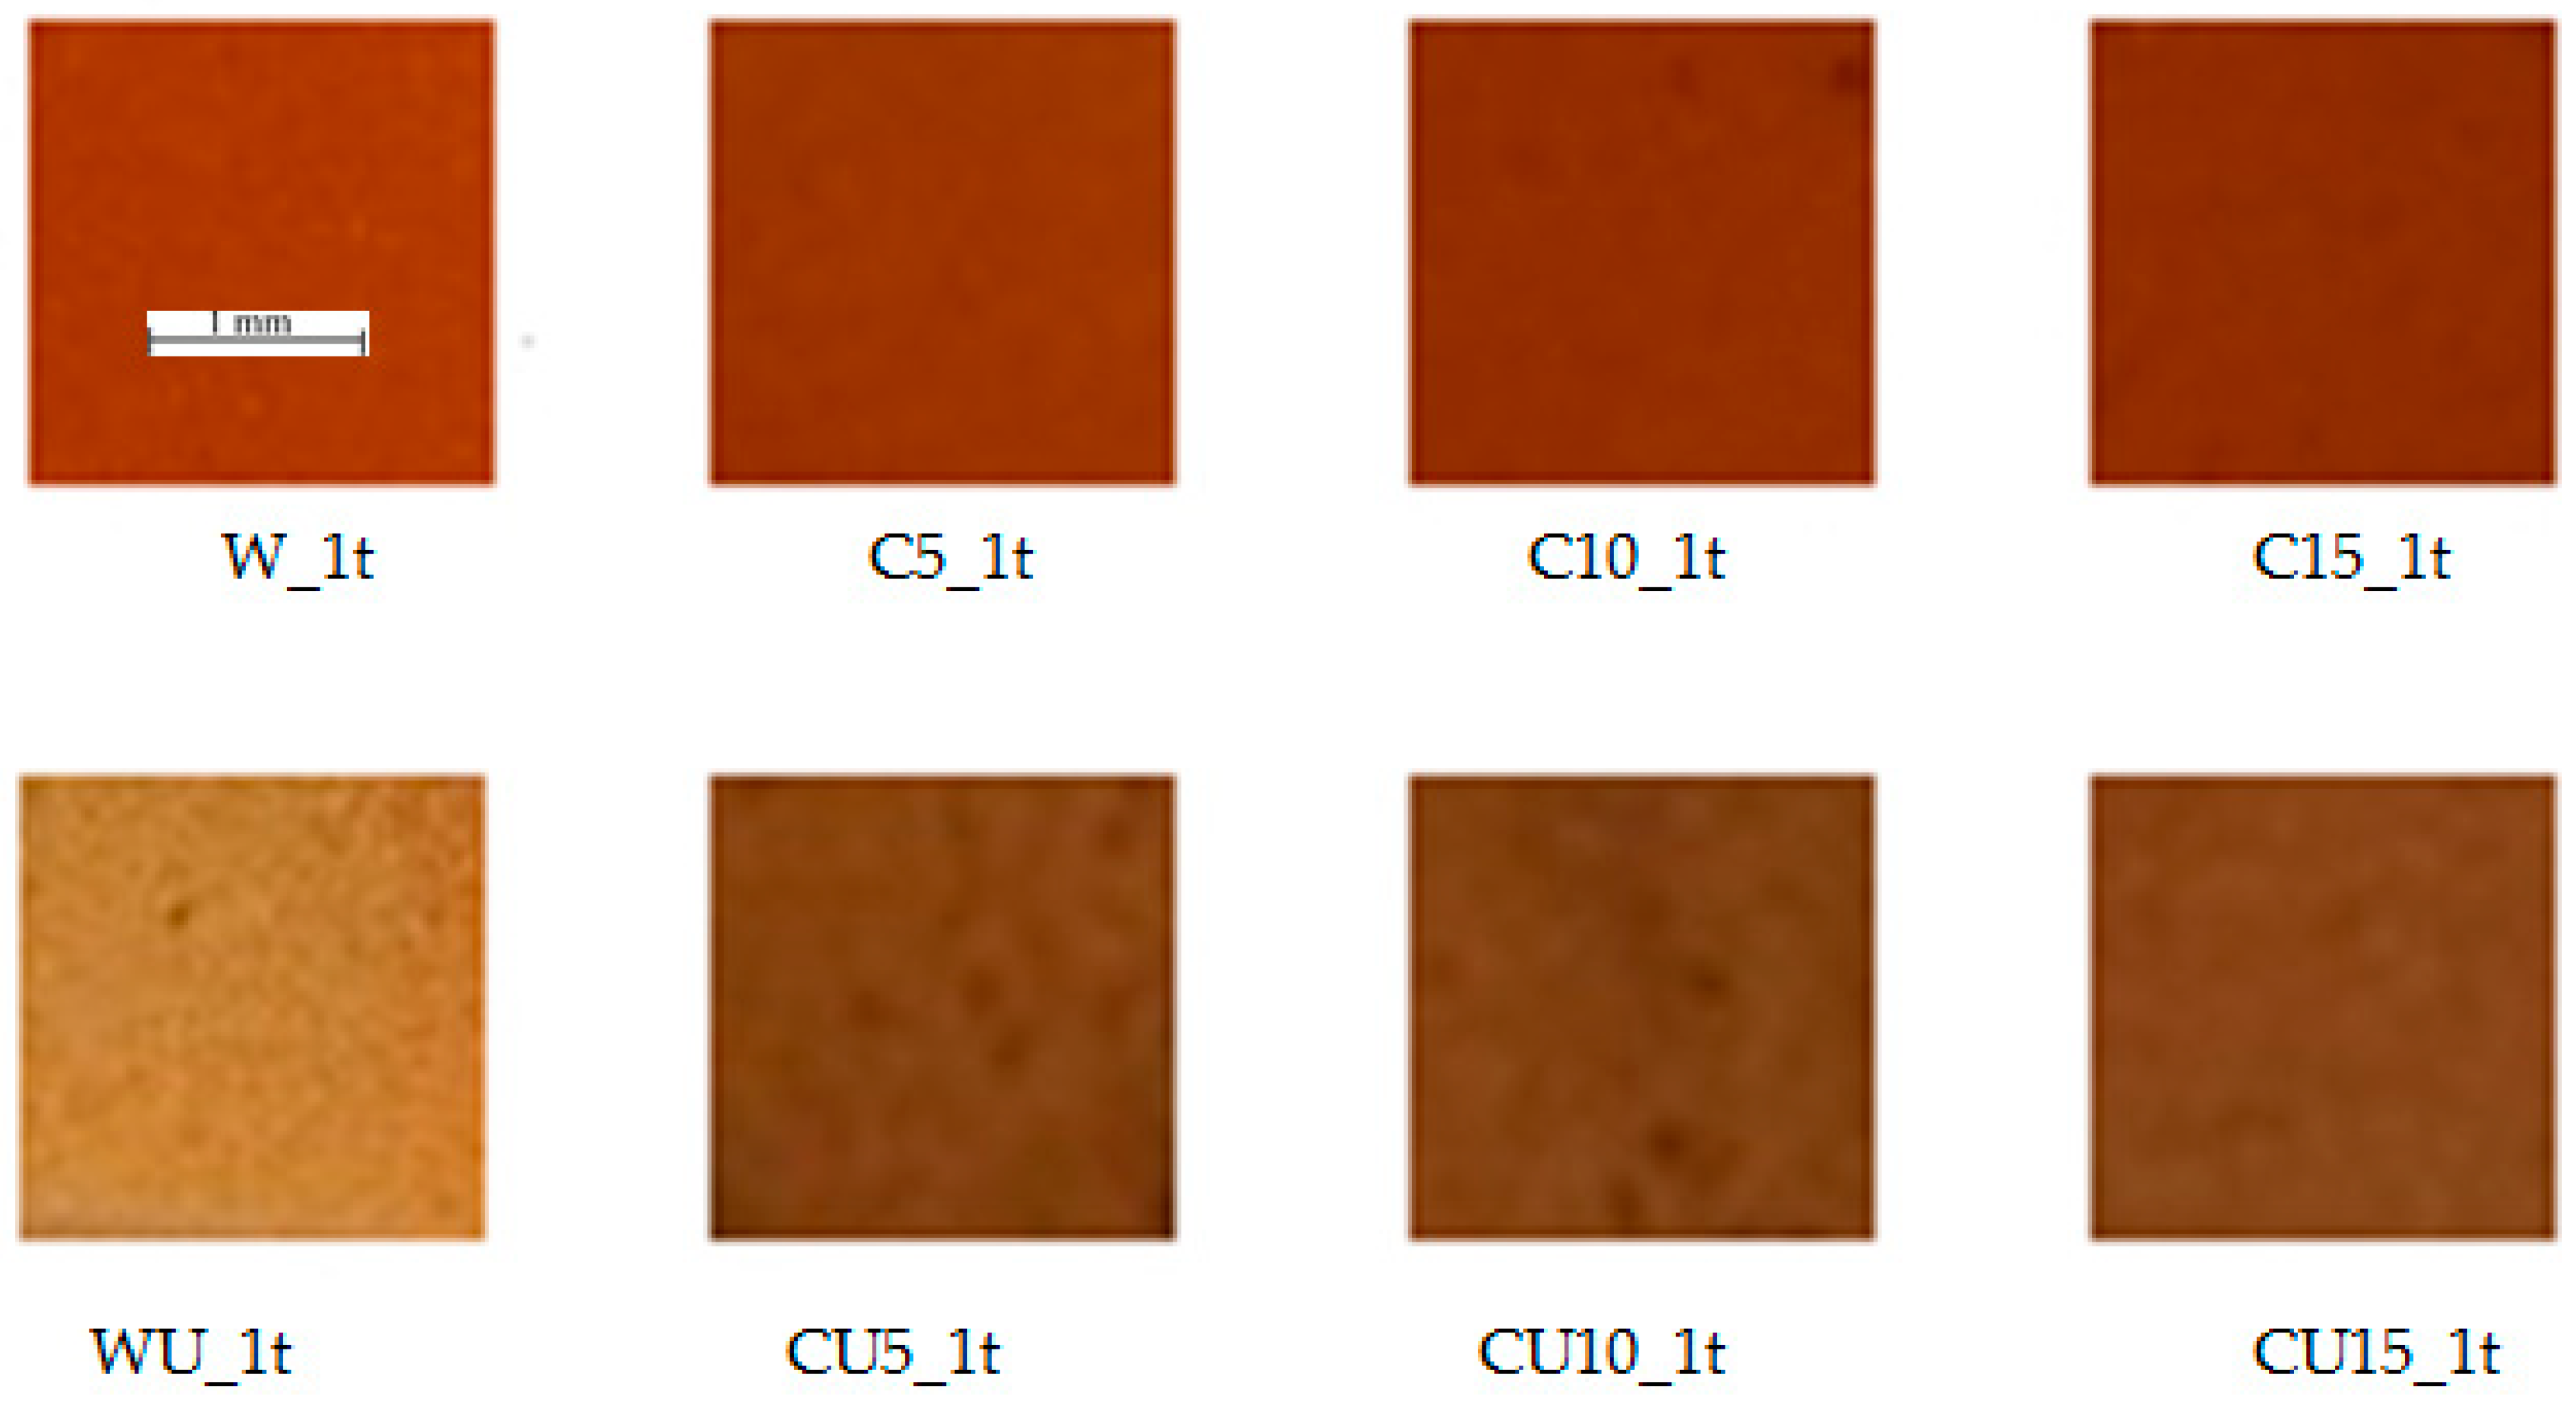
3.2. Organoleptic Assessment of RPU/PIR Foams

An oraganoleptic analysis was performed comparing the appearance of non-degraded foams (series 0t on photographs in Figure 2a) with foams aged in a dryer at 120 °C for 48 h (C and CU, WU and WU series 48h on photographs in Figure 2b) and with foams degraded in the climatic chamber (1t series in Figure 3). The external appearance of the foams and the possible color change were compared. It was determined whether the surface of the foams are crumble or not. Foams after thermostating in the dryer had a slight change in their color (foams in Figure 2b) in relation to the non-thermostated foams (Figure 2a). Aging at temperature (120 °C) caused a light yellow foams color (Figure 2b). Their roughness also increased.
The surface color of foams, which were irradiated by UV rays in the climate chamber, was changed from light yellow to orange (series C_1t on Figure 3. After that, the surface was exposed to UV radiation, humidity, and temperature. The surface of C_1t and W_1t foams became brittle after degradation than the surface of CU_1t and WU_1t foams. The following dependence was observed: CU_0t foams not contained the flame retardant (FR) were more brittle than the C_0t foams that contained FR. Degradation caused the opposite effect. Crumbling of the surface of a series of foams (CU_1t, without flame retardant after one week of degradation) slightly increased. Surface of C_1t foams subjected to one week of degradation was much more destroyed than the surface of foams from before degradation (C_0t). Based on the organoleptic assessment, it could be assumed that the removal of flame retardant from cinnamon-based foams should improve the strength of the bonds responsible for reducing the crumbling of CU_1t foams in relation to the C_1t series subjected to aging in the climatic chamber. The color change can be caused by thermal-oxidation degradation of the foams surface, hence, the color change in the case of thermostating (foams on Figure 3).
Wirpsza [29] reports that PU obtained from aromatic MDI turn yellow under the influence of light. Colorful quinonoimide groups are formed on its surface. Yellowing does not affect the strength properties, it only decreases the properties of coatings.
A different color (yellow, orange) was observed on the surface of conditioned foams (Figure 3) depending on whether the foam contained a flame retardant (yellow) or not (orange). This dependence was already observed in reference foams (W_1t and WU_1t) even before the addition of cinnamon extract. Soft segments of the foams, which are aliphatic polyethers and aliphatic polyesters, are more susceptible to oxidation and affect discoloration (change of color) [12]. Aromatic amines are produced in the reaction of the isocyanate with water. They are easily oxidized to chromophores could make to contribution towards change of color of foams. The changed color on the surface of C_0t series can be caused by presence of phosphate flame retardant. These compounds can decompose giving hydrogen halide.

3.3. Color of Foam

Foam color test results are included in Table 4. The test results showed a practically small increase in the brightness of the foams at once with increasing cinnamon extract content in unheated and non-conditioned foams (brightness L was from 82.825, in foam W_0t to 66.735, in C15_0t foam). At the same time, these foams contained more red (a) and yellow (b). The L range was from 71.400 (W_48h) to 62.625 (CU5_48h) for foams aged in the dryer within 48 hours. At the same time, the content of red and blue color increased in them. Foams conditioned in the air conditioner (series 1t) resulted in the reduction of the L factor (50.78–57.285) and in the increase in parameter a in the range from 13.68 to 21.635 in relation to a parameter of the 0t series (from −3.625 to 3.420). The ∆E parameter of 48 h thermostated foams was from 68.138 to 77.132 and conditioned foams (1t series) was from 59.998 to 62.444 in relation to the value of ∆E of 0t series (from 72.772 to 87.461).

3.4. Accelerated Aging Tests

The literature [14] states that aging of elastic porous materials does not lead to dimensional changes (Δl). RPU/PIR foams tested here by thermostating at 120 °C in dryer with forced circulation during 48 hours caused slight changes of Δl, ΔV, and Δm (Table 5). Standards in civil engineering allow for changes of 3% (for ΔV) and 1% (for Δl) [39]. Measurements of linear dimensions, volume, and mass were also made for foams degraded in the climatic chamber for one week (series 1t). Measurements of the linear dimension, volume and mass do not indicate changes for the 1t series in relation to the 0t series foams and were within the measurement error of ± 0.001%). The addition of cinnamon extract and the presence or absence of flame retardant in foams did not affect the Δl, ΔV, and Δm values of obtained foams.

3.5. Compressive Strength
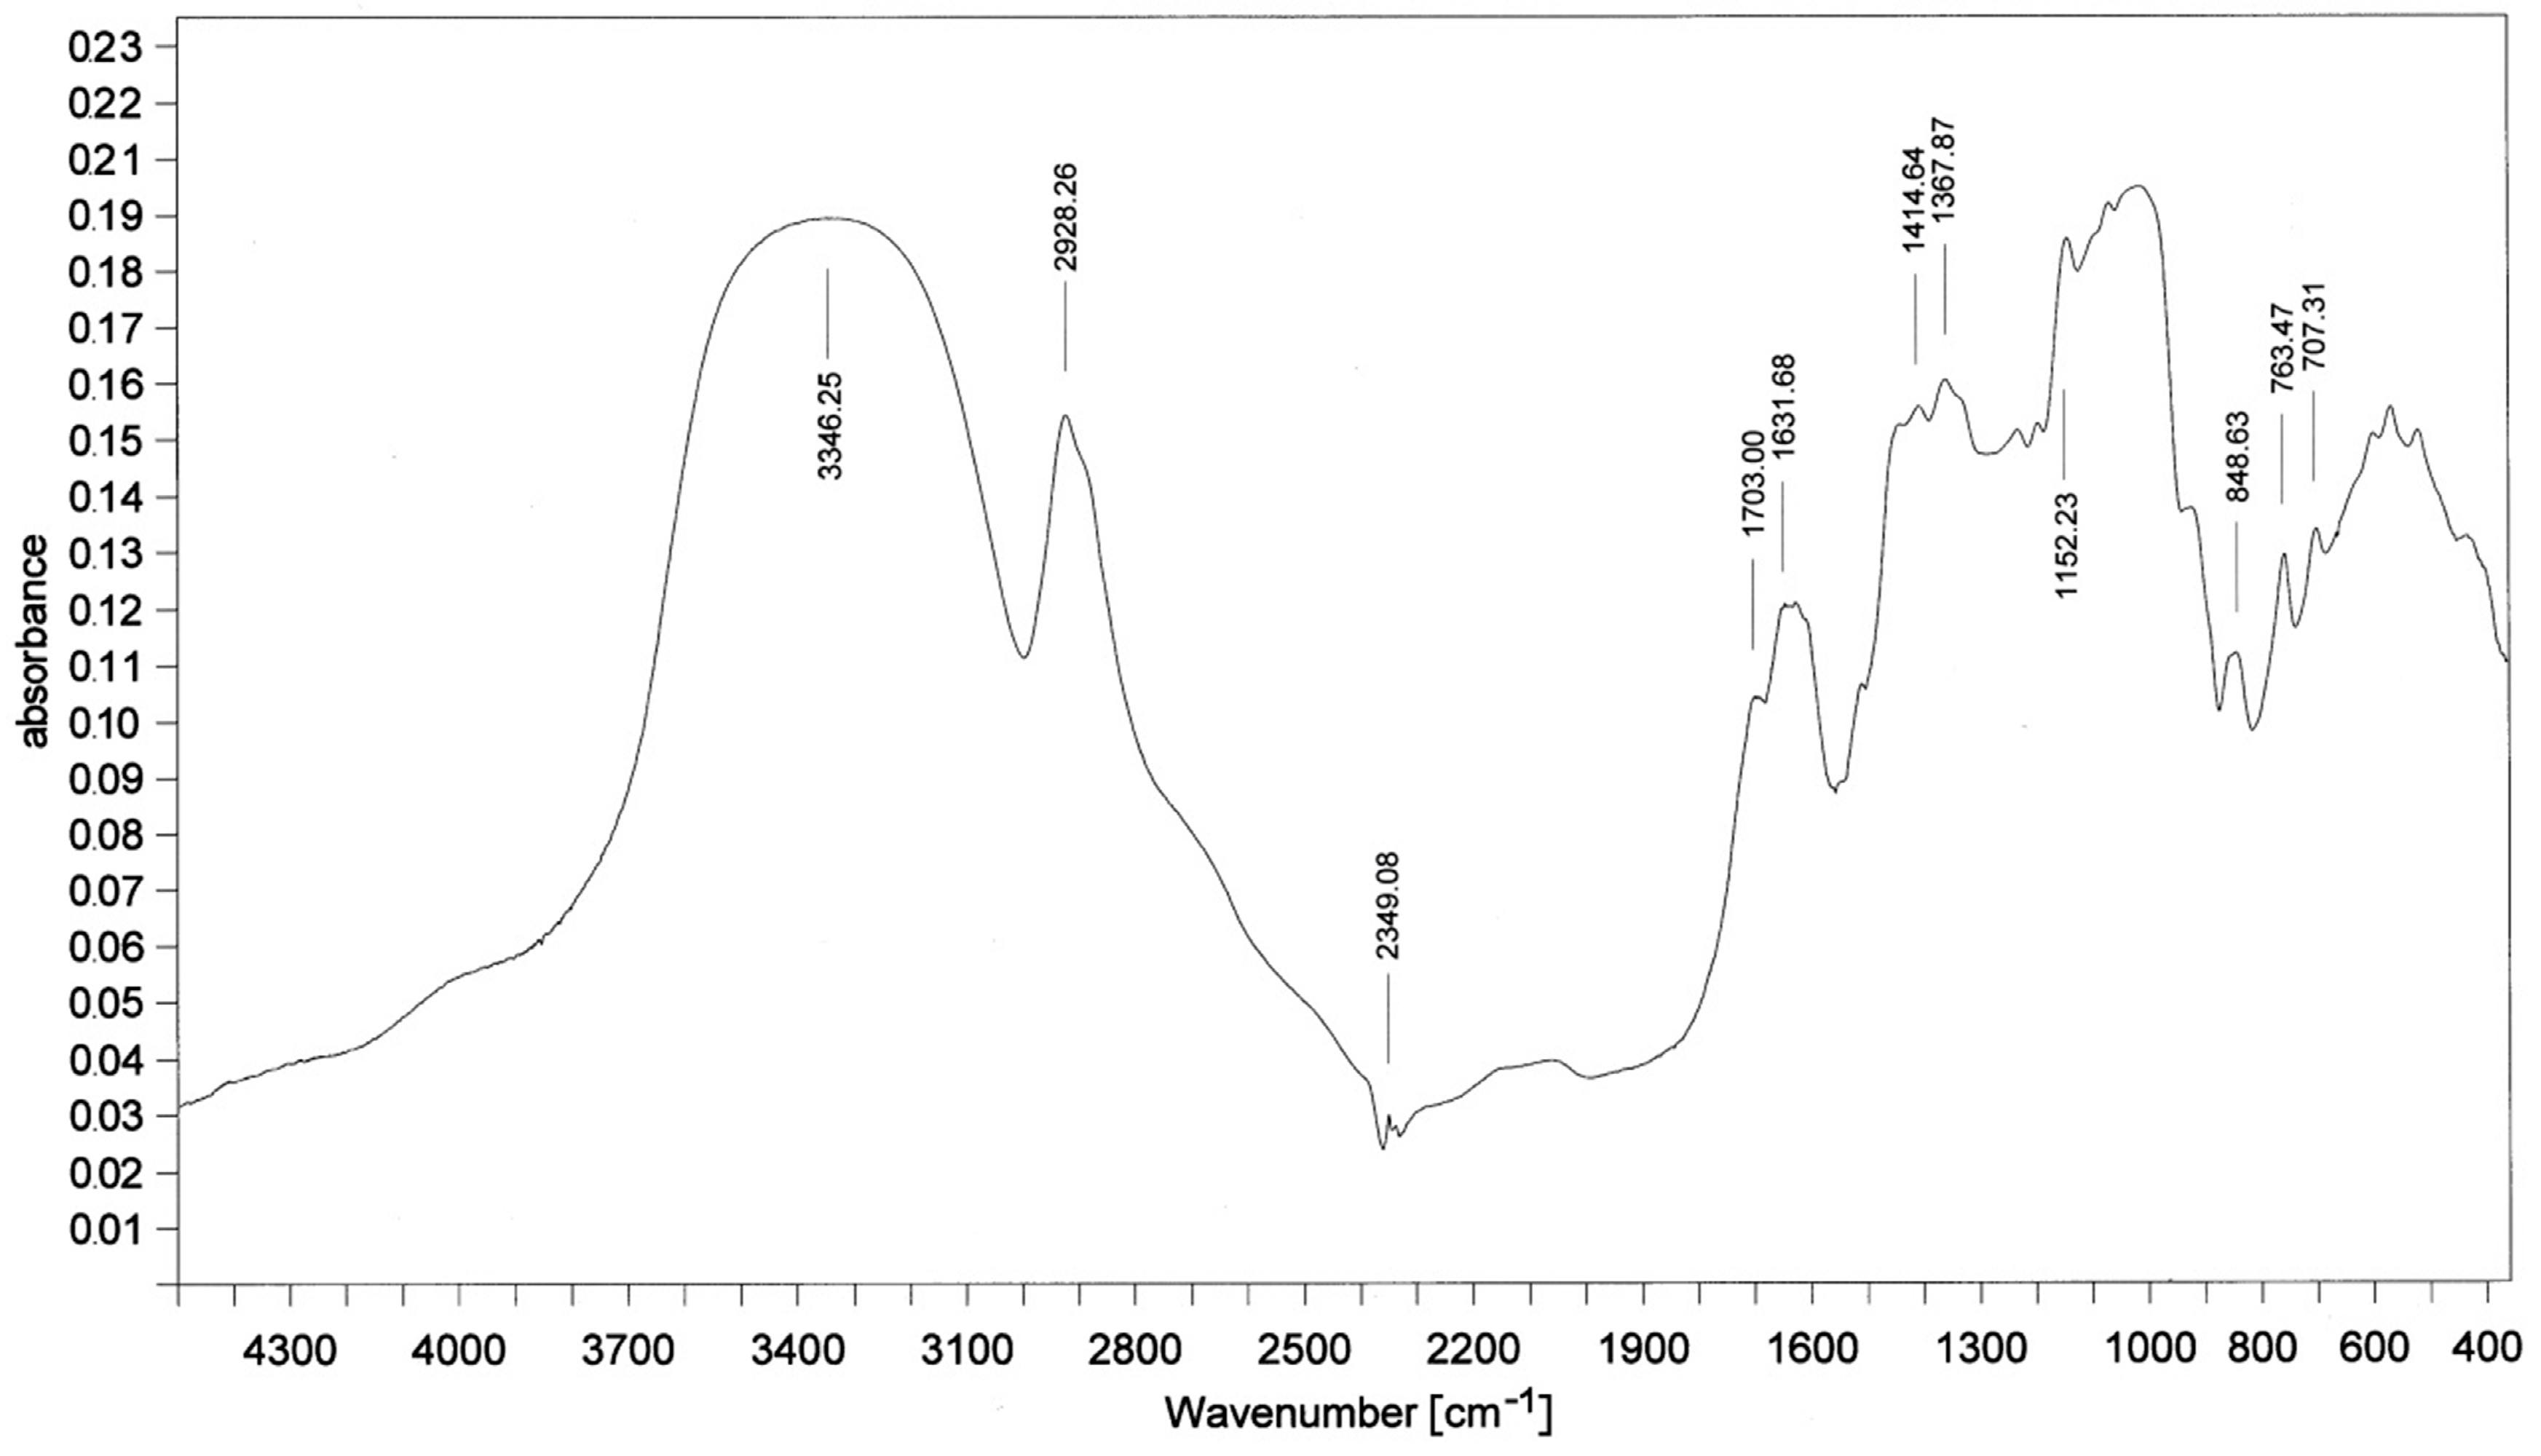
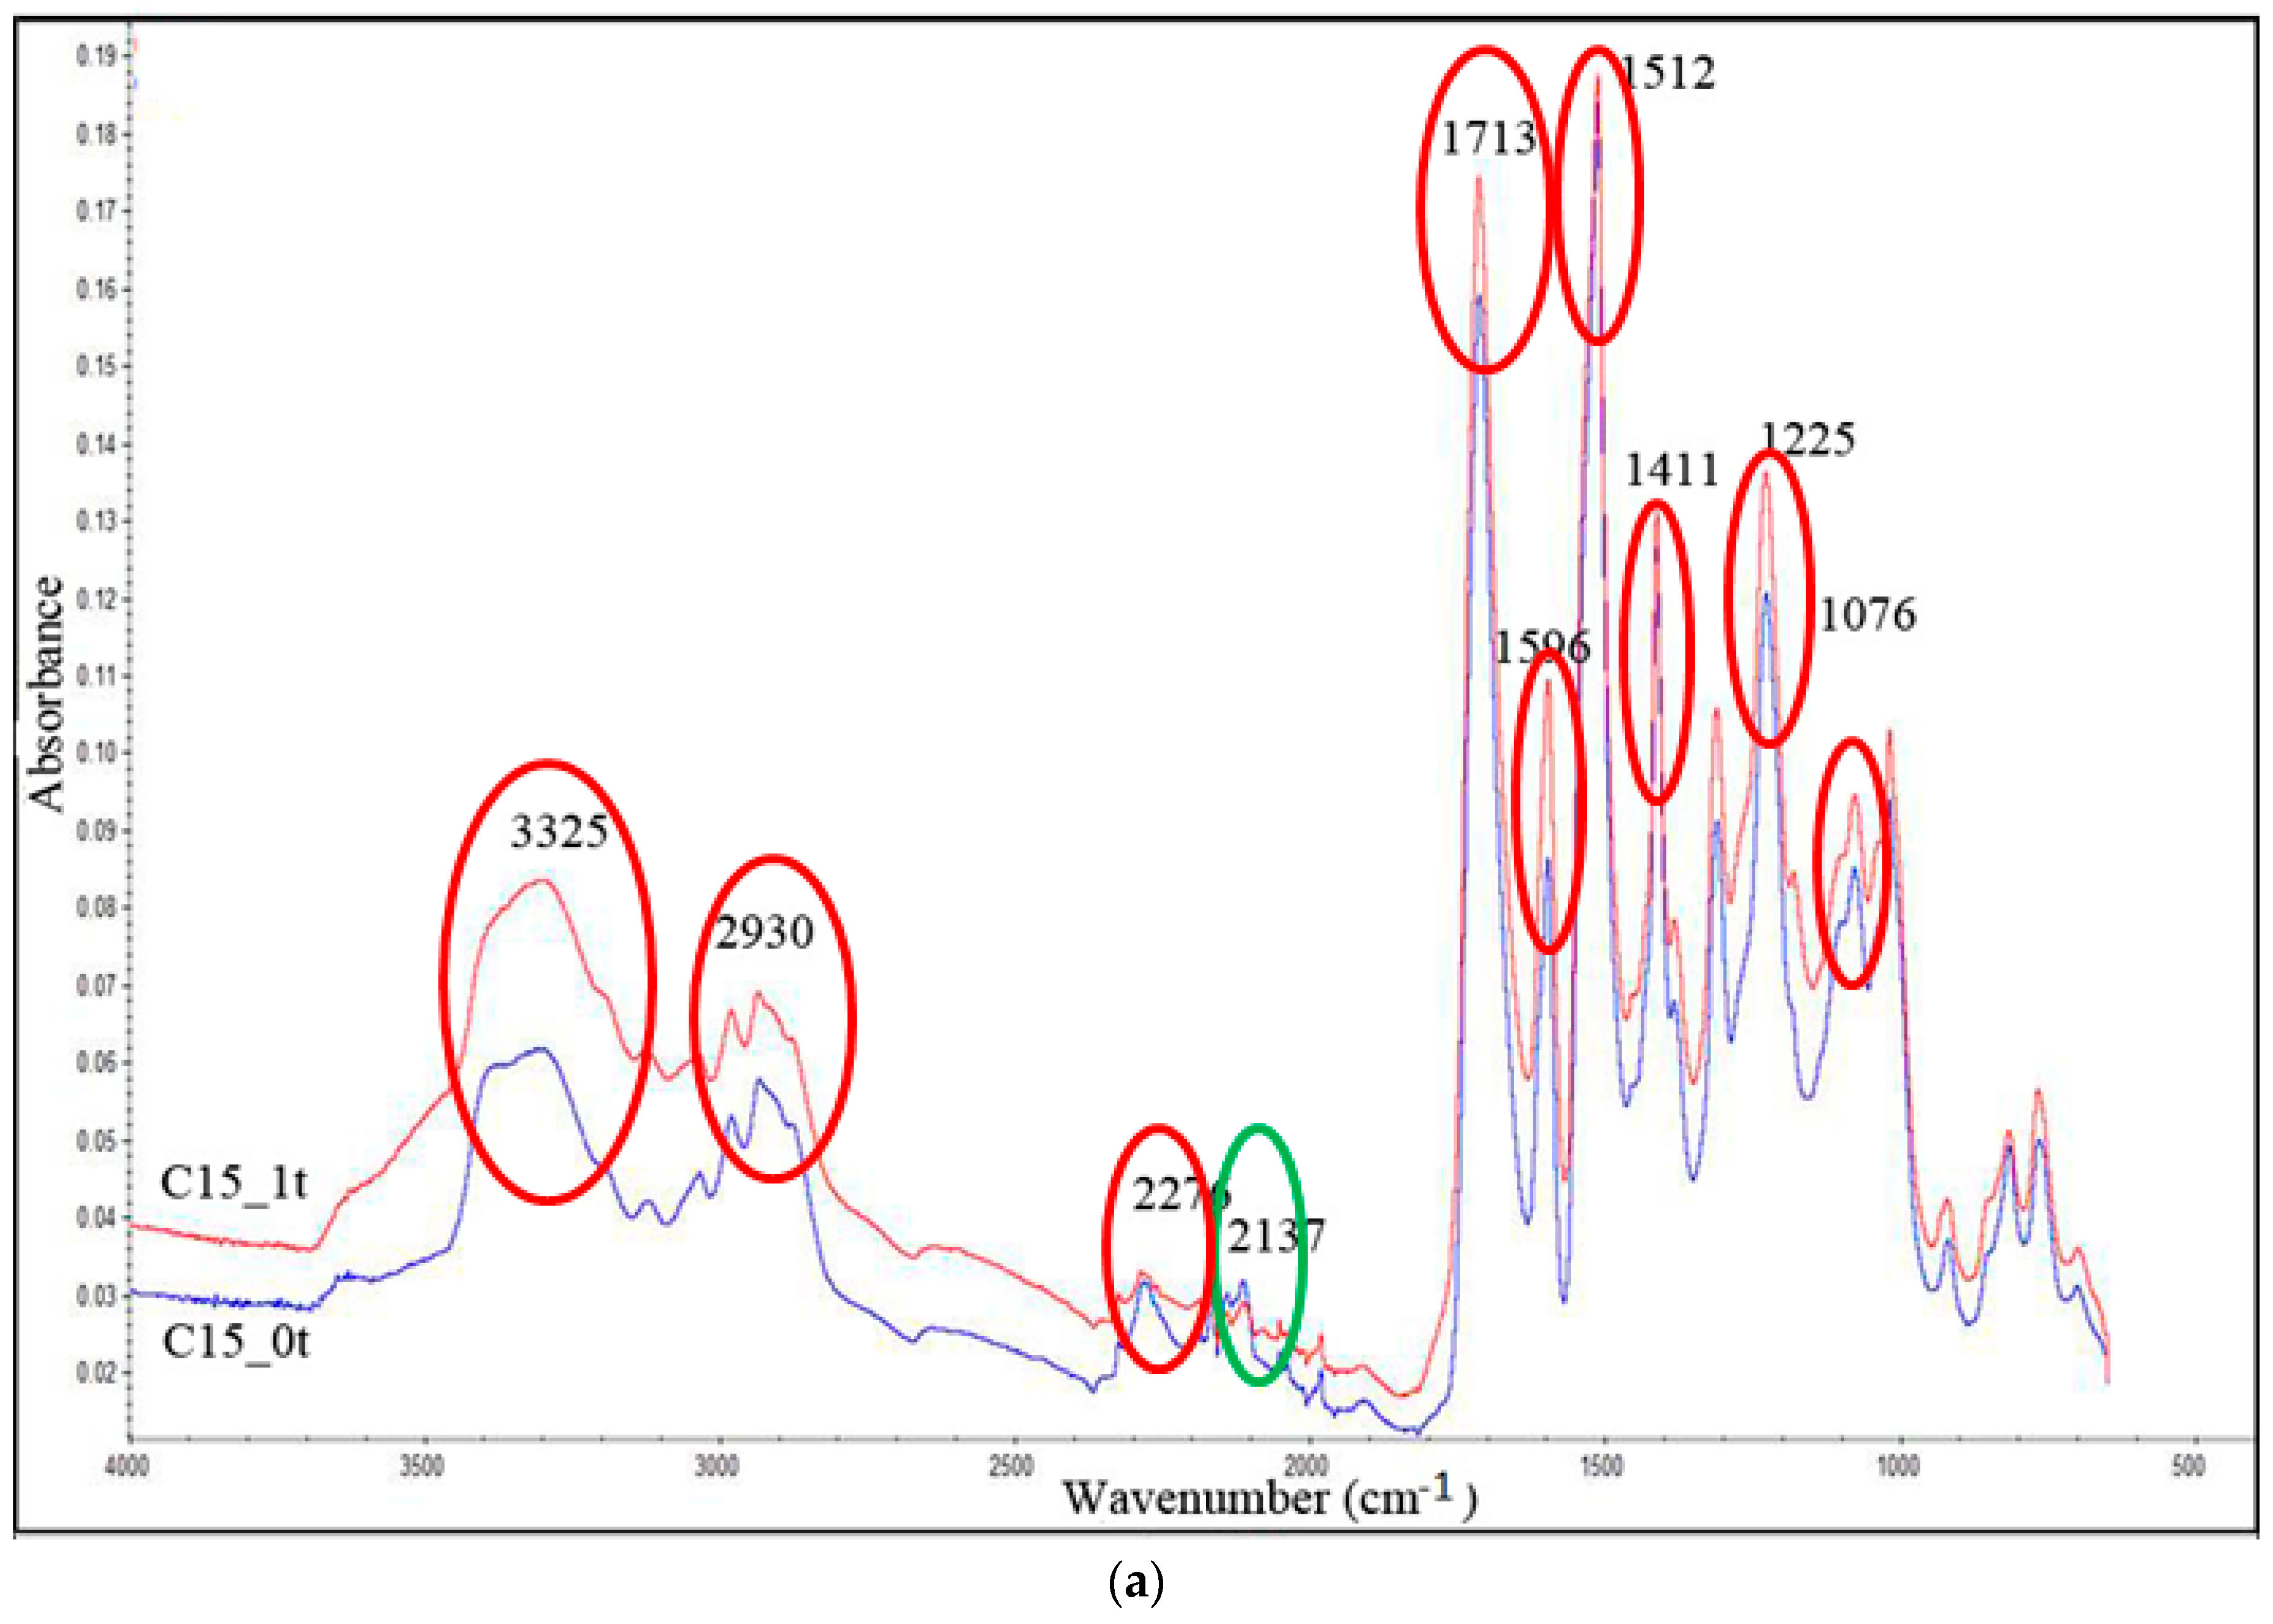
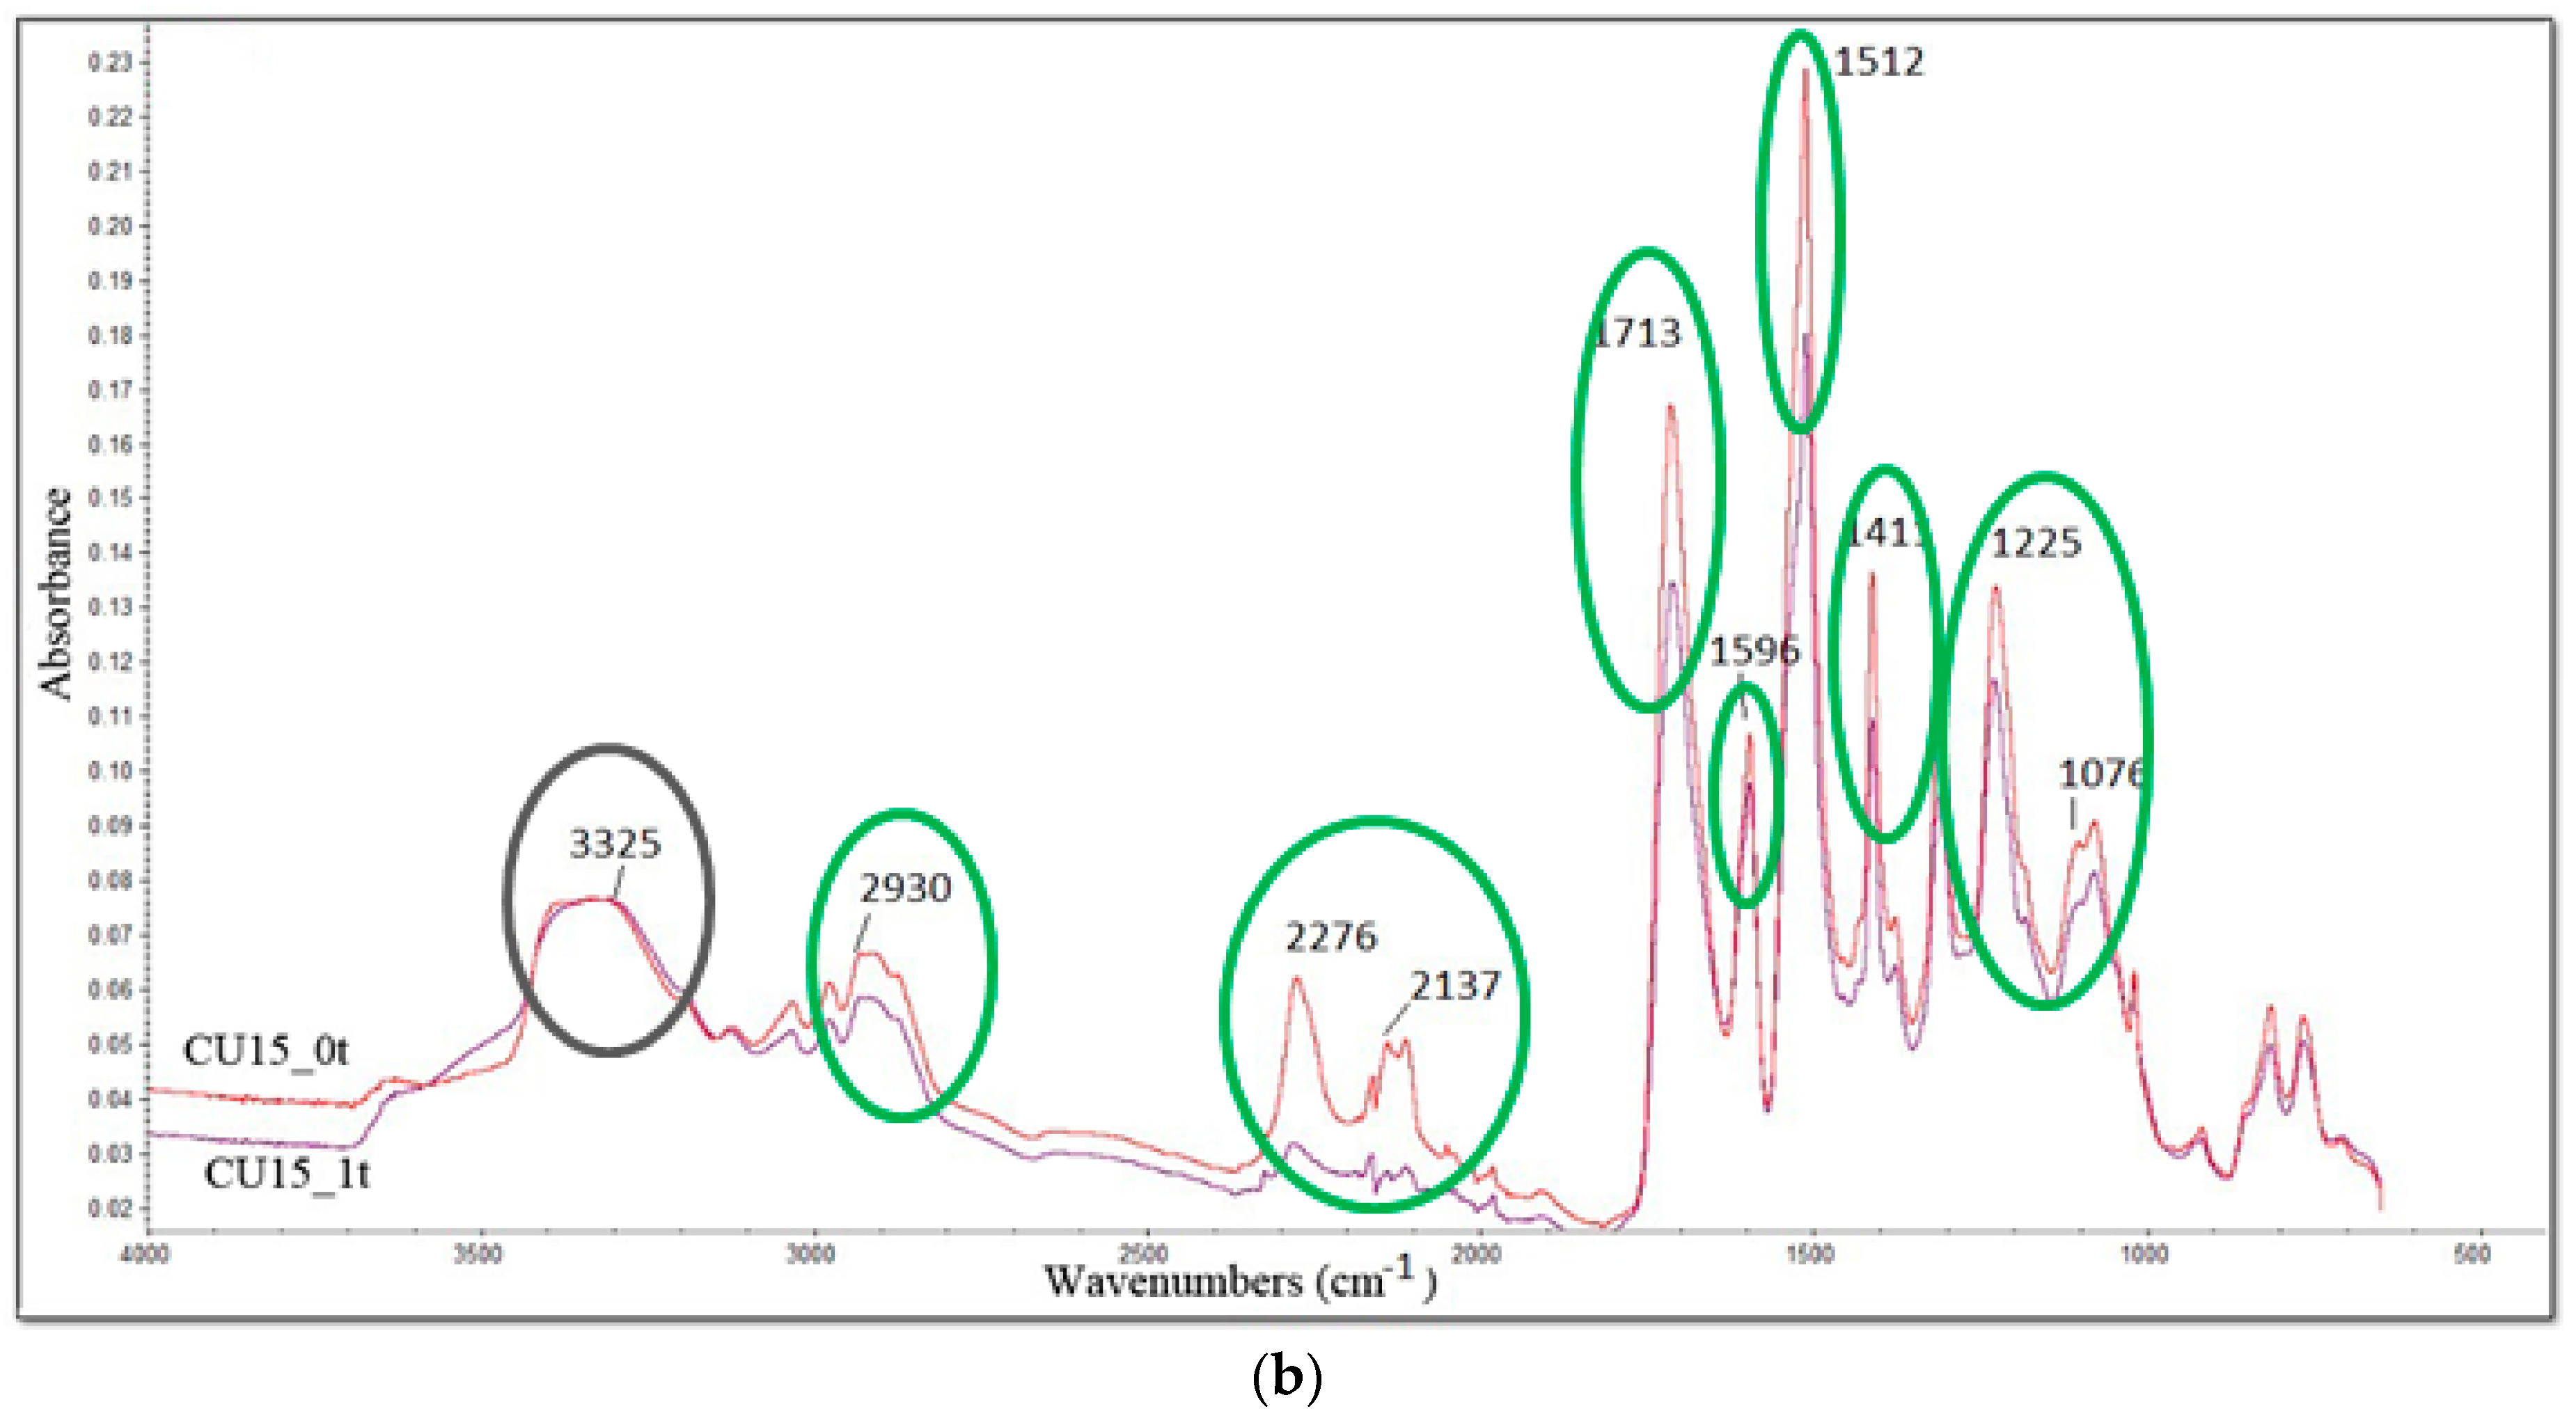
The literature [15,35] states that the assessment of the results of aging tests can be made by specifying the compressive strength ratio (CV) in relation to the aging. CV in aging was calculated as a ratio of compressive strength of 0t and 1t foams (Table 6). The choice of this property for the assessment of aging was made due to its importance in the application of PUFs in civil engineering. A significant decreasing in compressive strength was observed for aged reference foams (W_1t and WU_1t) in relation to the compressive strength of non-aged foams (W_0t and WU_0t). Therefore, these foams had the lowest CV. Only the addition of cinnamon extract increased the value of the CV. This could be related to the cross-linking formation in the foam structure due to the polyphenols present in the cinnamon composition. However, more cinnamon-based filler content in the foam (both for the series with flame retardant C and for the series without flame retardant CU) decreased this coefficient by about 10%.
The CV ratio exceeded 100% for CU series foams. This meant that the strength of the aged (CU_1t) foams increased in relation to the strength of non-aged foams (CU_0t). In the course of photodegradation (apart from the destruction processes), there were also crosslinking and oxidizing. FTIR studies were shown that the –CH bonds were destroyed (Figure 3). Free radicals could be formed in the CU series, which were not blocked due to the lack of flame retardant (Antiblaze TMCP) as a radical inactivator. The structure could probably was crosslinked. It led to a reinforcement of the foam structure, thus increasing compressive strength [3].

3.6. FTIR Analysis

Susceptibility to degradation depends on the presence of specific chemical groups in the molecule. The easily hydrolysable ester, amide, and urea groups accelerate the polymer decomposition [39,40]. Since photodegradation of polymeric materials takes place most intensively in the surface layer, up to approx. 10 μm [41], the surface of degraded foams was scraped (1t series) and FTIR spectra of 1t foams were compared with the 0t series spectra (not subjected to degradation). On the basis of the FTIR analysis (Figure 4a,b), the following groups (Table 7) can be distinguished in the construction of all foams: N–H, CH, –N=C=O, –N=C=N, C=O in urethane, isocyanurate, –C=N in the trimer, and C–O. The polyurethane-polyisocyanurate structure of the obtained foams has been confirmed [1,5,8].
The FTIR spectra (Figure 4a) of the foams with a maximum cinnamon extract content (15 wt%) and with flame retardant content, before degradation (C15_0t) and after degradation (C15_1t) where compared. The FTIR spectra of the foam with flame retardant (C15_0t series) subjected to degradation (C15_1t) showed that after degradation the intensity of the bands associated with the bonds (red lines) increases: N–H (3325 cm−1), CH (2930 cm−1), –N=C=O (2276 cm−1), –C=O (1713 cm−1), –NH (1596 cm−1), –N–H (1512 cm−1), isocyanurate ring (1411 cm−1), –C=N in the trimer (1225 cm−1), –C–OH (1076 cm−1). The bond associated with the –N=C=N– (2137 cm−1, green line) decreased.
The figure (Figure 4b) compares the foams with a maximum cinnamon extract content (15% wt.), without flame retardant before degradation (CU15_0t) and after degradation (CU15_1t). The spectra of FTIR foams without flame retardant (CU_0t series) subjected to degradation (CU_1t) showed that after degradation the intensity of bands related to bonds: CH (2930 cm−1), –N=C=O (2276 cm−1), –N=C=N– (2137 cm−1), –C=O (1713 cm−1), –NH (1596 cm−1), –NH (1512 cm−1), isocyanuric (1411 cm−1), –C=N in the trimer (1225 cm−1) and –C–OH (1076 cm−1) decreases after degradation (green line). Only the band associated with the –OH (3325 cm−1) groups did not change (grey line).
Antioxidant properties of flavonoids were determined by the presence of hydroxyl groups in both rings, the isomeria of their location, and the presence of a double bond and a carbonyl group in the heterocyclic ring [42]. Bands whose intensity increased were prone to degradation.

3.7. Density (d), Water Absorption (WA), Absorbability (A), Softening Point (SP), Brittleness (B), and Content of Closed Cells (CC)

The apparent density of the foam affects its mechanical properties. The main advantage of PU materials, which are used in civil engineering, is their low density (and also good durability) [3]. The decrease in foam density is also economically advantageous. The results of research on foams modified by cinnamon extract (Table 8) showed that the apparent density of C_0t foams decreased from 39.67 kg/m3 (W_0t) to 33.97 kg/m3 (C15_0t). For a series of foams without commercial flame retardant –FR (CU_0t), density slightly decreased from 30.94 kg/m3 (CU5_0t) to 29.43 kg/m3 (CU15_0t). The density of the reference foam WU_0t was 49.6 kg/m3. The reason for the decrease in foam density was most probably the incorporation of cinnamon compounds (e.g., flavonoids, chlorogenic acids, phenol acids and others) into the structure [42,43,44]. They have contributed to the opening of foam cells and thus the decrease of density, which resulted in a decrease in brittleness (Table 8) and compressive strength (Table 6). FR was embedded in the structure of the C foam series and thereby reduced their brittleness compared to the brittleness of the CU foam series.to the foam causes a decrease in the softening point of modified foams by 18 °C in the C_0t series and 32 °C in the CU t series. The amount of cinnamon extract in the C_0t series foams practically did not affect the brittleness of foams, whereas for the CU_0t foams series, the CU_0t foam brittleness increase was observed in relation to the WU_0t foam, but its decrease with the increase of cinnamon-based filler content in the foam was observed; see Table 8. The reason for the CU_0t brittleness increase (in relation to for the CU_0t series) was lack of flame retardant in foams.
There are many factors that determine the type of insulation and its thickness. For the insulation to be fully effective, it should meet at least the basic requirements, which include low absorbability and low water absorption from the environment [36]. Reduction of this parameters is very beneficial when these materials are using as thermal insulation. A lack of ability for water to accumulate in foams prevents a multiplication of mold and other microorganisms in the rooms where they are used [7,8,37].
In the investigated foams, an increase of water absorption (WA), absorbability (A) was observed with an increasing content of cinnamon extract in foams (Table 8). The increase in WA and W is due to the hydrophilic nature of the filler (cinnamon), which contains, among others, polyphenols (chlorogenic acid, flavonoids, and phenol acids); see Table 1. These compounds have hydrophilic –OH and –COOH groups. The presence of these groups was confirmed by the FTIR analysis (Figure 3). This analysis revealed the presence of a wide –OH band in the wave region of about 3346 cm−1) and –COOH bonds (about 1077 cm−1 and 2928 cm−1). The unidentified residue was most likely cellulose with –OH groups. The increase in A and WA was also caused by the opening of cells after the addition of cinnamon extract to the foams; see Table 8. Increase in absorbability (A) and water absorption (WA), was also observed for foams modified with ground coffee [45]. Opening of the cells was confirmed by the SEM method (Figure 5c,f). The increase in brittleness (B) in CU_0t foams (about 42%–45%) was caused by the lack of flame retardant. Antiblaze was embedded between the walls of the C_0t series foams and stiffened the structure by gluing it together. Its absence caused a decrease in the stiffening of the foam structure and thus increased brittleness.
The addition of cinnamon clearly affects the opening of the foam cells. This causes an increase in absorptivity (A). Both closed-cell and open-cell foams show suitability in insulation [25,36]. If the increase in the volume of bubbles (and reducing the thickness of their walls) is not strictly synchronized with the increase in the viscosity of the mixture, the gas escapes to the outside. The opening of cells during the synthesis was probably influenced by the elongation of free rise time and string gel time (Table 3). The CO2 formed in the cells caused the cell to break before it gelled. The opening of the foam cells was influenced by an increase in the heat transfer coefficient λ, which for all foams ranged from 0.0353 W/(m∙K) to 0.0356 W/(m∙K). For standard foams W_0t and WU_0t was 0.026 W/(m∙K). Open cell foam has lower strength than closed cell [36]; see Table 6.

3.8. Flame Properties

Foam flammability research showed synergy between Antiblaze TCMP and cinnamon extract. When conducting flammability tests on foams without flame retardants and with cinnamon-based filler (CU_0t series), was observed the increase of limited oxygen index (LOI) compared to the reference foam WU_0t (Table 9). LOI was increased from 18.7% (WU_0t) to 21% (CU15_0t). In foams without flame retardant, but with cinnamon extract, there were any changes in the LOI of the C_0t series (with cinnamon extract) to the W_0t foam and it was about 24% for the C_0t series and the W_0t foam. A two-fold increase in combustion residues (CR) from 37.72% (WU_0t) to 64.98% (CU5_0t) was observed in a series of non-flame-retarding foams (WU_0t, CU_0t). Combustion residue foams with cinnamon-based filler and flame retardant (series C_0t) increased by about 10% compared to the foam without biofiller (W_0t). For a series that did not contain a flame retardant (CU_0t), the CR value increased by approximately 30% in relation to the retention of the reference foam WU_0t. Between the reference foams W_0t and WU_0t, a 40% increase in retention for the W_0t foam (containing Antiblaze TMCP) was observed in relation to the retention of the WU_0t foam. The decrease in flammability was probably influenced by the composition of cinnamon (Table 1) and in particular the content of heavy metals (in ppm). In horizontal tests all foams were classified as self-extinguishing.

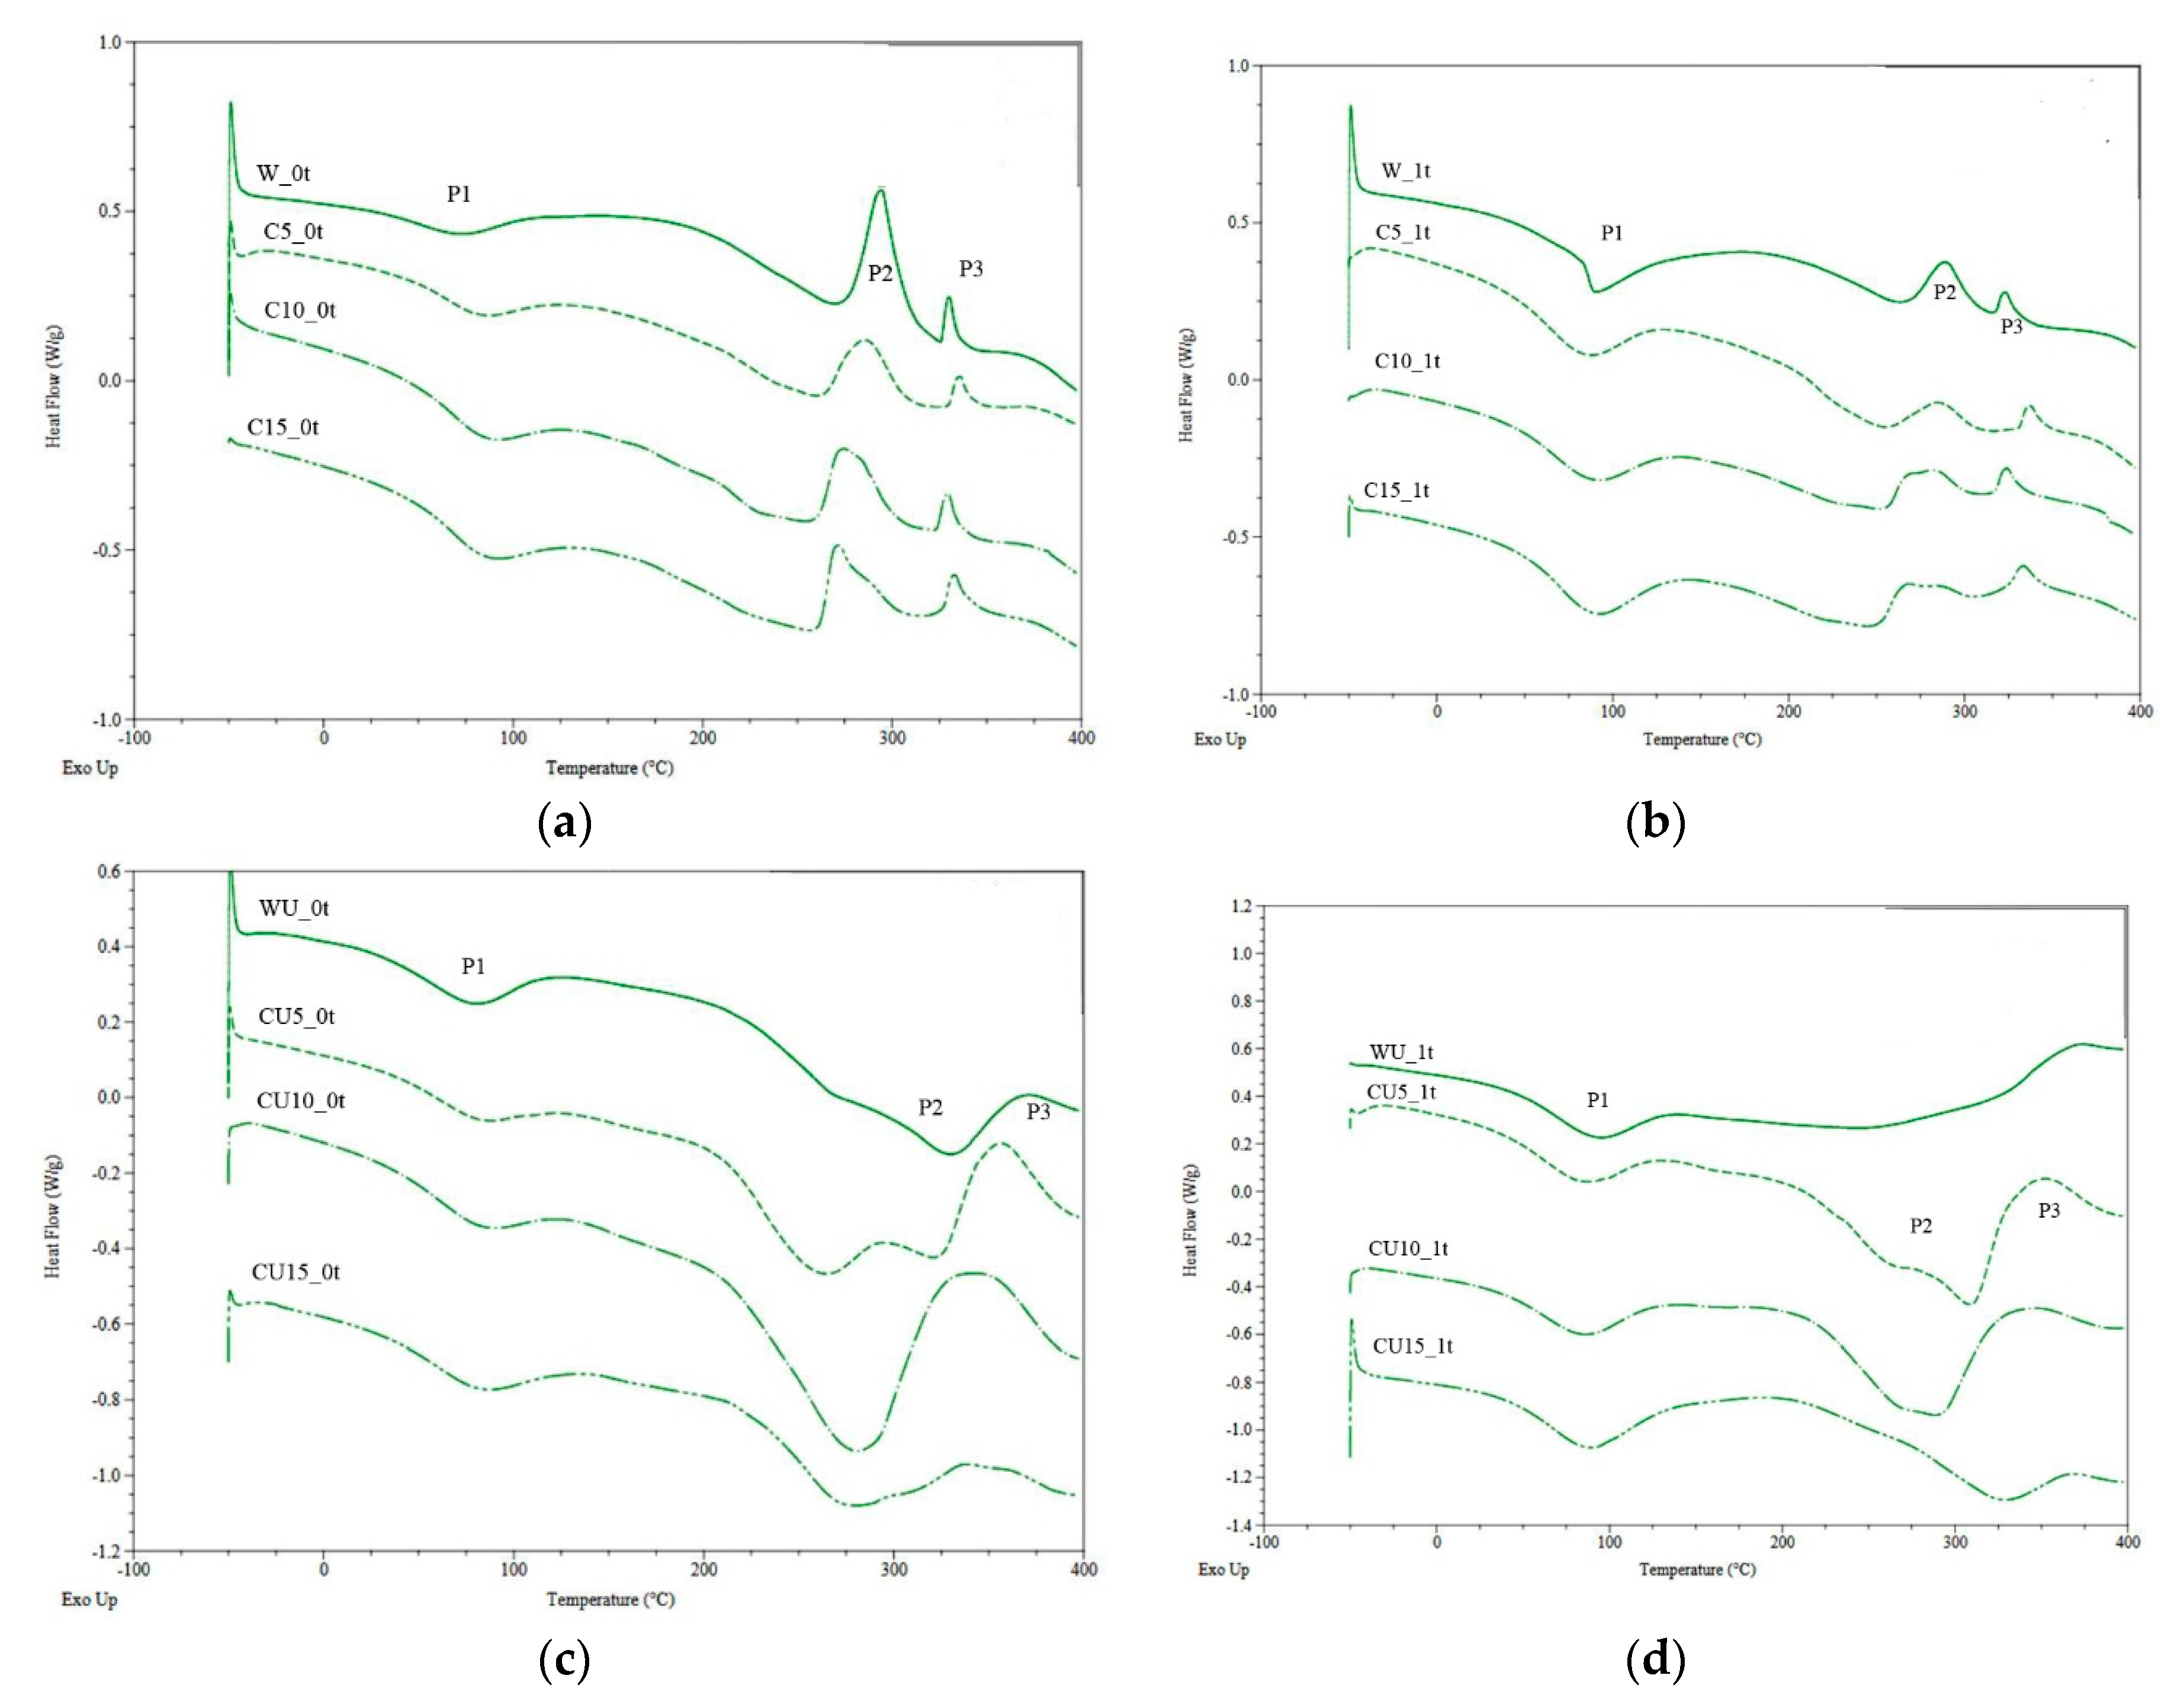
3.9. Differential Scanning Calorimetry

The DSC curves recorded effects, such as: the temperature of the beginning of the thermal effect (Toneset), the temperature of the end of the thermal effect (Tk), the temperature of the extreme point (Tmax), and enthalpy (H) [46].
The DSC graph of cinnamon-filled foams (series C_0t) containing a flame retardant in the composition has one endothermic peak P1 and two and exothermic peaks P2 and P3 (Figure 6a,b). The absence of flame retardant in foams (series CU_0t) results in a change in the course of the DSC curves (Figure 6c,d). We could observe two endothermic peaks P1 and P2 and one exothermic P3 in the figure.
From the graphs (Figure 6), it can be observed that the increasing amount of cinnamon extract (from 5% by weight to 15% by weight) increases the enthalpy H1 in the first endothermic peak (Figure 6a) from 26.47 J/g (C5_0t) to 36.53 J/g (C15_0t); see Table 10. Enthalpy H1 was associated with the evaporation of water from foams. Its increase was caused by the increasing content of the biofiller in the foams. H1 for the foam without cinnamon extract (W_0t) was 25.75 J/g. The maximum temperature (Tmax in P1) also increased from 71.8 J/g (W_0t) to 85.6 J/g (C15_0t). There was a reduction in the intensity (size) of the first exothermic peak (P2) associated with the decomposition of urethane bonds and ether bonds from polyol at Tmax2 around 295 °C (for W_0t foam) and its goes towards a lower temperature, i.e., 270 °C for C15_0t foam). The Tmax3 of the second exothermic peak (P3) was practically unchanged. The curves of CU_1t foams series (Figure 4b) degraded one week were similar to C_0t series. However, the H2 and H3 enthalpy values or P2 and P3 peaks were smaller.
Subjecting the foams (CU_1t series) to a 1-week degradation was shown of the Tmax peaks going towards higher temperatures, e.g., for P1 peak from 81.2 °C (CU15_0t) to 91.0 °C (CU15_1t), for P2 peak with 282.3 °C (CU15_0t) up to 325.2 °C (CU15_1t) in Table 11.
Degradation of the reference foam WU_0t (without cinnamon extract, without flame retardant) resulted in the disappearance of the endothermic peak of the WU_1t foam (Figure 6c,d). In the CU_1t foam series (Figure 5d), pronounced endothermic peaks were observed at temperatures above 300 °C for CU5_1t, CU10_1t, CU15_1t foams. Any endothermic peak was not observed for WU_1t, at approximately 300 °C. The disappearance of the first exothermic P2 peak was also observed in the temperature range from 265 °C to 300 °C (occurring in the C_0t and C_1t series containing the flame retardants; Figure 6a,b) relative to the series without flame retardant (CU_0t and CU_1t, Figure 6c,d). The second exothermic peak P3, was preserved.
The changes in the peaks observed in Figure 6c,d could indicate the breakdown of urethane bonds (with dissociation temperature of 200 °C) and ether (with dissociation temperature of 260 °C) [47,48,49,50]. The presence of the P3 peak on the DSC curve suggested the lack of climatic influence on the PUR/PIR foam degradation (with dissociation temperature of 350 °C) in CU_1 series, what could be observed on FTIR of CU_1t series of foams; see Figure 4b.

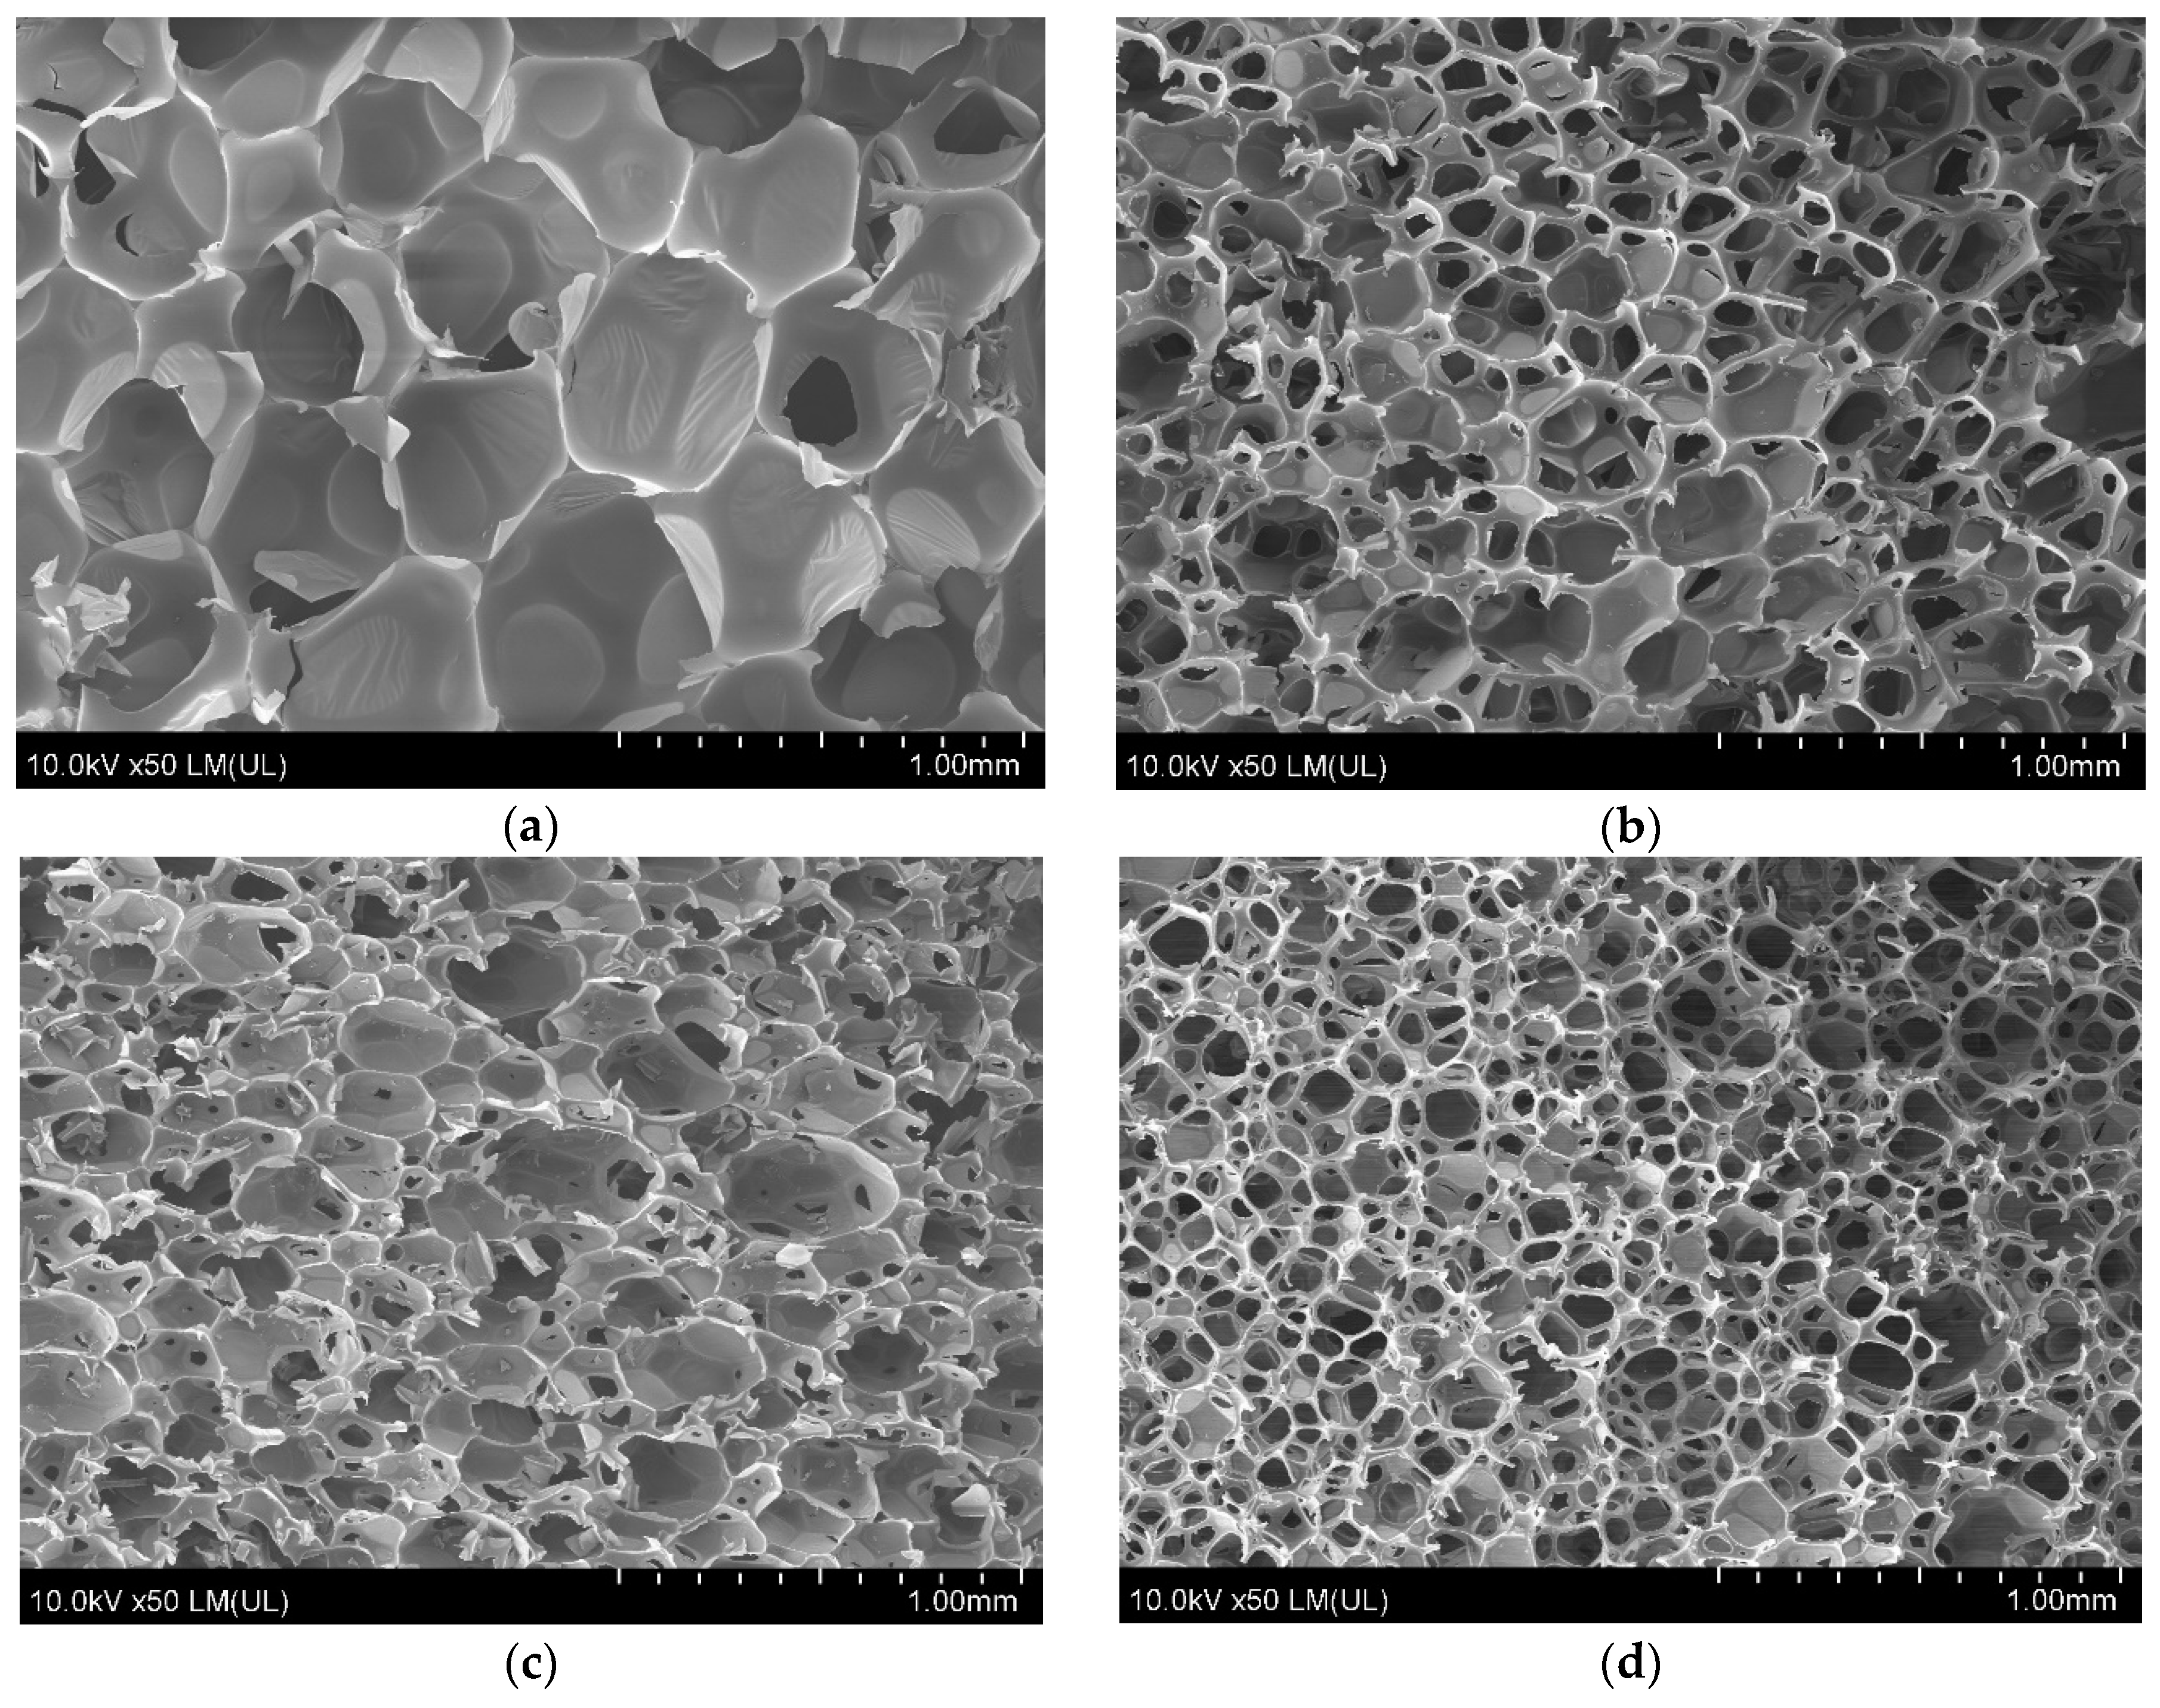
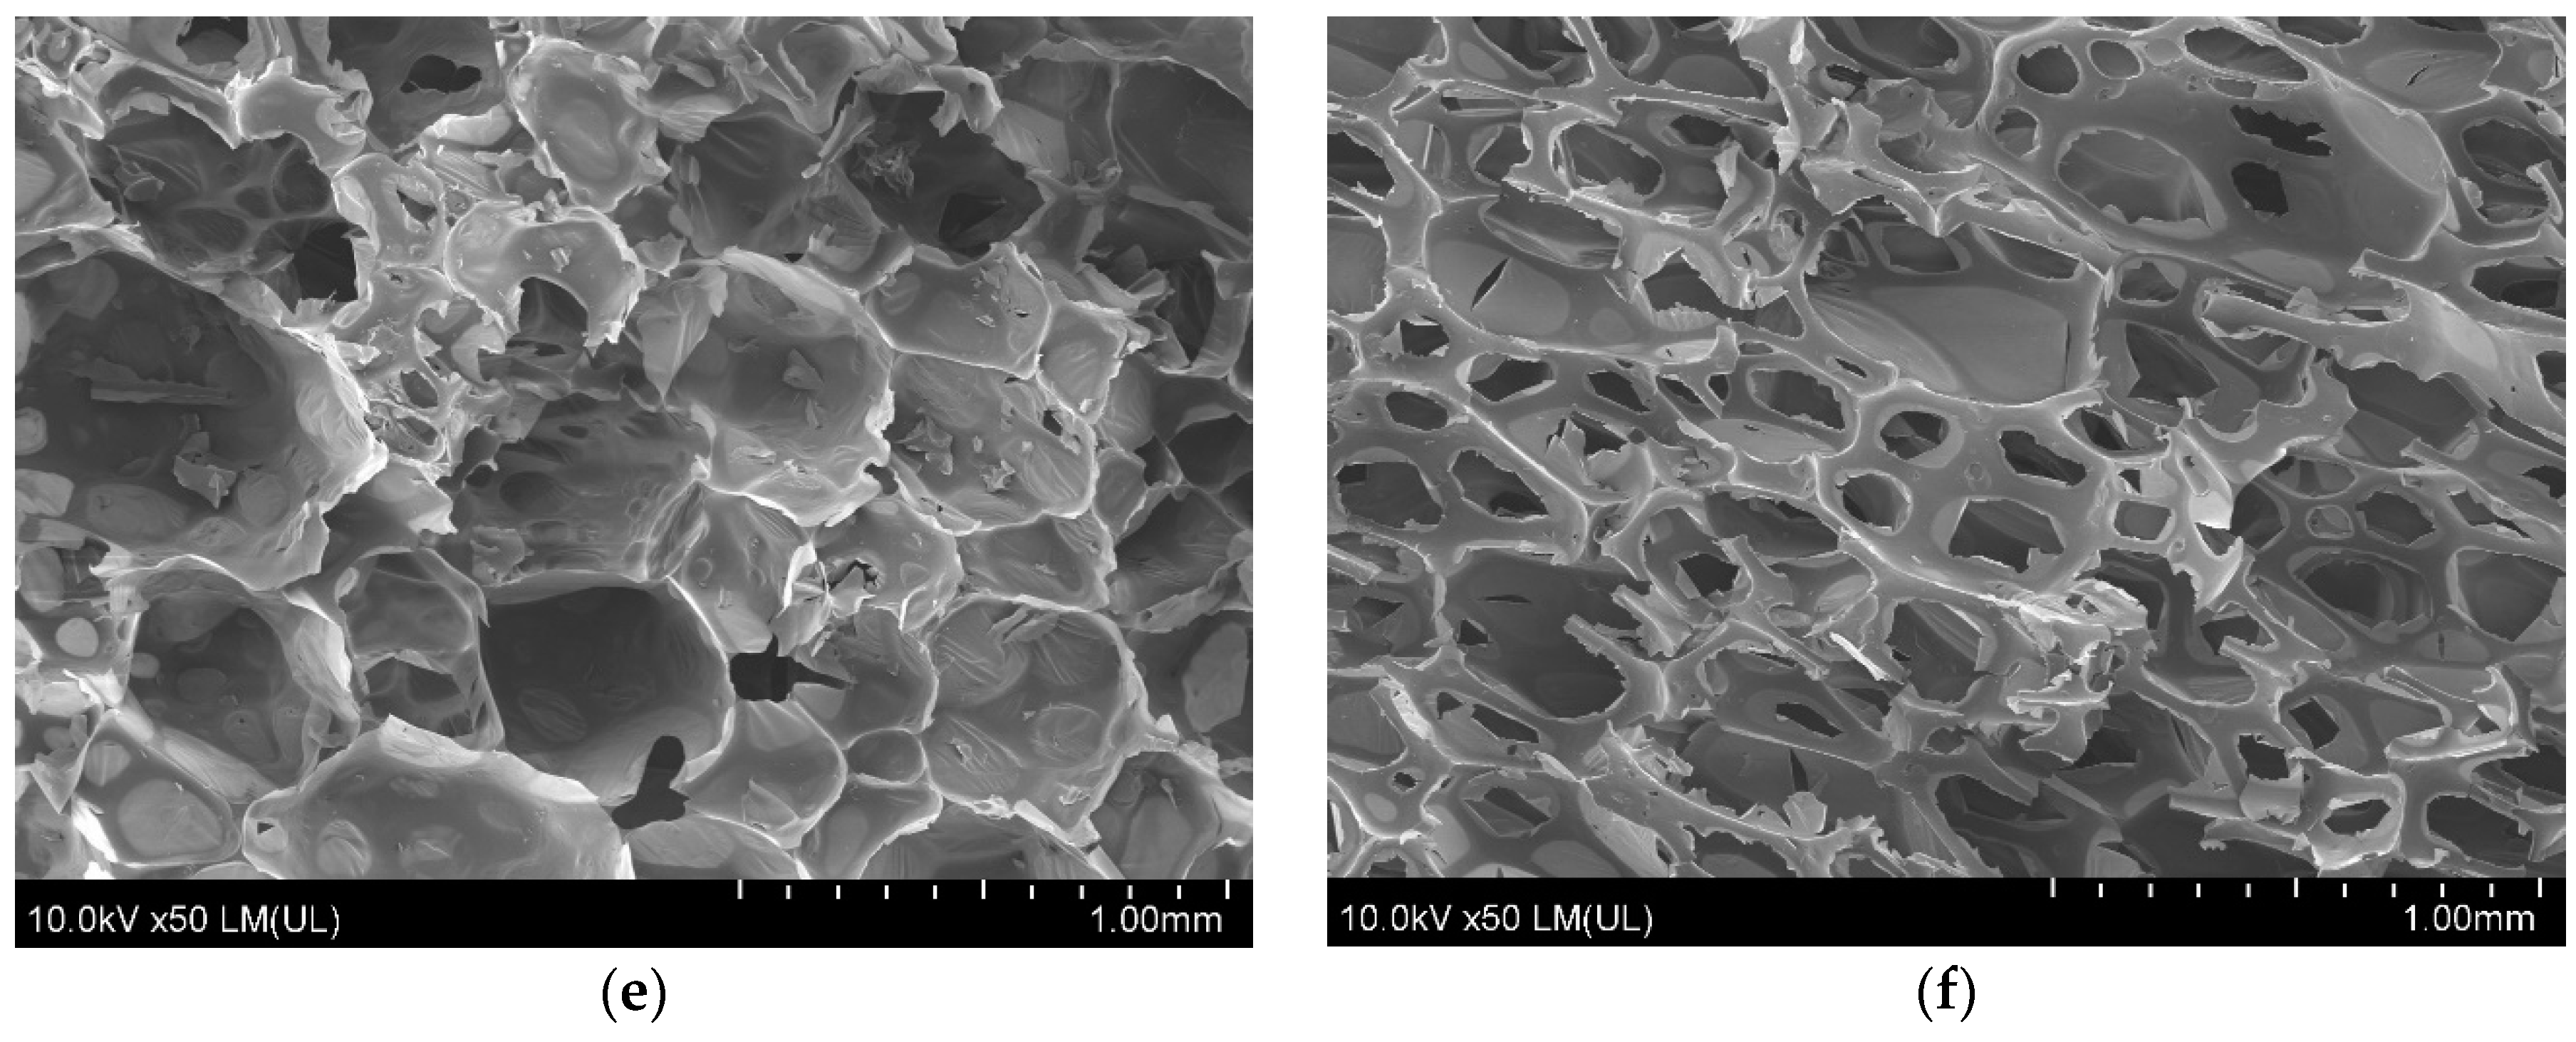
3.10. RPU/PIR Foam Structure

Foam structure was analyzed by using SEM. The density of foams affected on the thickness of the cell walls (and thus the strength of the foams) [50,51]. The structure of foams with cells smaller than 0.25 mm in diameter is referred to as small cells [42]. Cells with a diameter above 0.5 mm are referred to as large. The small-cell structure gives porous materials more favorable mechanical strength. In flexible foams, a decrease in the diameter of the foam cells was observed after the addition of flame retardant halogen-free organophosphorus compound (Fyrol PNX) [52].
The addition of cinnamon extract caused a slight decrease in density of these foams (Table 8). This could affect the opening of modified foam cells. A specialized program for measuring cells in the SEM method allowed the measurement of foam cell width and length. Based on the width and height of the cells, the anisotropy coefficient was calculated according to Equation (13).
A n i s o t r o p y   c o e f f i c i e n t = h e i g h t   c e l l s w i d t h   c e l l s
The anisotropy factor > 1 means the elongation of cells in the vertical direction. The highest strength parameters are characterized by foams with anisotropy coefficient equal to 1 (not elongated neither vertically nor horizontally) [27]. The anisotropy of analyzed foams was about 1.
The cell walls were destroyed during conditioning (Figure 5b,d,f) (under given conditions) and additional holes were formed. In the SEM study, these additional holes were interpreted and measured by the program as cells (and not as holes created as a result of wall destruction). On a given surface (in this case 1 mm2) additional holes were interpreted as a smaller cells (not as a real cells). In fact, the results in Table 12 relate to measurements of holes created after destruction and not measurements of real cells. Measurements proved that foams conditioning (series 1t) were destroyed (the thinnest fragments of the walls were broken); see Figure 5b,d,f).
Based on results in Table 12, it was read that cinnamon extract increased the destruction of foams. It was evidenced by the increased number of holes per 1 mm2 of surface. The number of holes (“cells”) of conditioned foams of C series (containing flame retardant) increased according to increasing content of cinnamon extract in foams (Table 12) from 3.8 (W_1t) to 19.69 cell/mm2 (W15_1t).
Considering foams without flame retardant (CU series), content of cells per mm2 decreased twice after condition. It means that not only walls of foam were destructed, but even ribs were cracked and, thus, cells were opened. Number of holes (cells) per 1 mm2 decreased from about 3.5 cell/mm2 (CU5_1t and CU15_1t) to about 1.5 cell/mm2 (WU5_1t and WU15_1t).

4. Conclusions

Two series of foams with cinnamon extract were obtained: one with flame retardant (C_0t) and the other without flame retardant (CU_0t). The results of this research showed an improvement of some properties of foams with biofiller. The measurement of the color indicates an increase in the red color of foams subjected to conditioning (accelerated degradation conditions) and an increase in the color of blue in thermostated foams (for 48 hours in an exhaust dryer). In cinnamon-modified RPU/PIR foams with and without flame retardants was observed decrease in compressive strength from 251.63 kPa (W_0t foam) to 147.29 kPa (C15_0t foam) and from 361.39 kPa (WU_0t) to 91.93 kPa (CU15_0t). The observed decrease of brittleness was from 13% to 11% (in C series) and an increase from 16% to 45% in CU series of foams. In addition, increasing amount of cinnamon extract in the C series (from 5% to 15%) increased the H1 enthalpy at a temperature of about 80 °C–95 °C (from 25.75 J/g, W0t to 36.53 J/g, C15_0t, and to 54.94 J/g, CU15_0t). The oxygen index was between 18.5% and 20.2% (C series) and between 23.7% and 24.7% (CU series). The combustion residue (CR) after the burning of foams containing cinnamon extract and flame retardant (series C_0t) increased by about 10% in relation to the foam without biofiller (W_0t). For a series without flame retardant (CU_0t), the CR increased by about 30% in relation to the CR of the reference foam WU_0t. The difference in CR between reference foams W_0t and WU_0t was about 40%. W_0t foam, containing Antiblaze TMCP, had a CR of 83.44 and WU_0t was 37.72%. The addition of cinnamon extract contributed to increasing the foams’ CR to 91.68% for C15_0t and to 63.33% for CU15_0t. Cinnamon-based filler showed synergism with Antiblaze TMCP in reducing flammability. Foams containing flame retardant and cinnamon extract (C_0t series) were characterized by the highest combustion residue. Conditioning caused decrease in compressive strength for C_1t series of foam by about 20 kPa (in comparison to the C_0t series). Destruction of characteristic bonds (e.g., cracking urethane bond) occurred was a result of a combined effect of temperature, humidity, and UV radiation in the conditioner.

Author Contributions

Conceptualization: J.L; methodology: J.L., M.I., and K.M.; software: J.L.; validation: J.L.; formal analysis: J.L. and M.B.; investigation, J.L.; data curation: J.L.; writing—original draft preparation: J.L.; visualization: J.L.; supervision: J.P.-S. and B.C.

Funding

An article fined in fifty percent of the grant National Science Center (NCN) no. 2015/17/DST8/02618 (K. Moraczewski).

Conflicts of Interest

The authors declare no conflict of interest.

References

  1. Czupryński, B. Issues in Chemistry and Technology of Polyurethanes; WN AB: Bydgoszcz, Poland, 2004. [Google Scholar]
  2. Żabski, L. PIR foams—A new type of insulation: Rigid polyurethane foam. Mater. Bud. 2005, 1, 46–47. [Google Scholar]
  3. Żuchowska, D. Construction Polymers; WNT: Warsaw, Poland, 2000. [Google Scholar]
  4. Randall, D.; Lee, S. (Eds.) The Polyurethanes Book; Wiley LTD.: New York, NY, USA, 2002. [Google Scholar]
  5. Prociak, A.; Pielichowski, J. Characteristics of rigid polyurethane boilings in the aspect of new porophors application. Czas. Tech. 1998, R95, 26–52. [Google Scholar]
  6. Polyurethane Foam Composition. Available online: https://patents.google.com/patent/US6894083B2/en (accessed on 26 June 2019).
  7. Paciorek-Sadowska, J.; Borowicz, M.; Czupryński, B.; Tomaszewska, E.; Liszkowska, J. Oenothera biennis seed oil as an alternative raw material for production of bio-polyol for rigid polyurethane-polyisocyanurate foams. Ind. Crop. Prod. 2018, 126, 208–217. [Google Scholar] [CrossRef]
  8. Paciorek-Sadowska, J.; Borowicz, M.; Czupryński, B.; Isbrandt, M. Effect of Evening Primrose Oil-Based Polyol on the Properties of Rigid Polyurethane–Polyisocyanurate Foams for Thermal Insulation. Polymers 2018, 10, 1334. [Google Scholar] [CrossRef] [PubMed]
  9. Liszkowska, J.; Czupryński, B.; Paciorek-Sadowska, J.; Moraczewski, K. The effect of UV radiation on the properties of PUR-PIR foam. Adv. Polym. Technol. 2015, 36, 21631–21639. [Google Scholar] [CrossRef]
  10. Agrawal, A.; Kaura, R.; Walia, R.S. PU foam derived from renewable sources: Perspective on properties enhancement: An overview. Eur. Polym. J. 2017, 95, 255–274. [Google Scholar] [CrossRef]
  11. Soares, B.; Gama, N.; Freire, C.S.R.; Timmons, A.B.; Brandão, I.S.; Neto, C.P.; Ferreira, A. Spent coffee grounds as a renewable source for ecopolyols production. J. Chem. Technol. Biotechnol. 2015, 90, 1480–1488. [Google Scholar] [CrossRef]
  12. Levchik, S.V.; Weil, E.D. Thermal decomposition, combustion and fire-retardancy of polyurethanes-a review of the recent literature. Polym. Int. 2004, 53, 1585–1610. [Google Scholar] [CrossRef]
  13. Gębura, A.; Kowalska, D.; Tokarski, T. Research on Accelerated Aging of Electric Wires. Available online: http://www.academia.edu/17704721/Badania_przyśpieszonego_starzenia_przewodów_elektrycznych (accessed on 1 December 2018).
  14. Kolbiński, K.; Słowikowski, J. Materials Electricial; WNT: Warszawa, Poland, 1988. [Google Scholar]
  15. Broniewski, T.; Kapko, J.; Płaczek, W.; Thomalla, J. Test Methods and Evaluation of Plastic Properties; WNT: Warsaw, Poland, 2000. [Google Scholar]
  16. Szumniak, J.; Smoczyński, Z.; Szcześniak, K. Armament and Military Equipment Polymer Composite Ageing; Zeszyty Naukowe WSOWL: Wrocław, Poland, 2011; Volume 1, pp. 270–285. [Google Scholar]
  17. Prociak, A.; Rokicki, G.; Ryszkowska, J. Polyurethane Materials; WN PWN: Warsaw, Poland, 2014. [Google Scholar]
  18. Bajda, M.; Pogoda, M. Study of the effect of conveyor belt accelerated heat aging on its strength. Transport 2016, 1, 16–22. [Google Scholar]
  19. Liszkowska, J. Citric acid used in the production of polyols for rigid PUR-PIR foams. Polym. Bull. 2017, 74, 283–305. [Google Scholar] [CrossRef]
  20. Rytlewski, P.; Malinowski, R.; Moraczewski, K.; Żenkiewicz, M. Influence of some crosslinking agents on thermal and mechanical properties of electron beam irradiated polylactide. Radiat. Phys. Chem. 2010, 79, 1052–1057. [Google Scholar] [CrossRef]
  21. Gramza, A.; Korczak, J.; Amarowicz, R. Tea polyphenols—Their antioxidant properties and biological activity. Pol. J. Food Nutr. Sci. A Rev. 2005, 55, 219–235. [Google Scholar]
  22. Lee, L.W.; Cheong, M.W.; Curran, F.; Bin, Y.; Shao, Q.L. Coffee fermentation and flavor—An intricate and delicate relationship. Food Chem. 2015, 185, 182–191. [Google Scholar] [CrossRef] [PubMed]
  23. Kudła, S. Technological aspects of phenolic antioxidants interactions with dicumyl peroxide in the processes of polyolefins’ crosslinking. Polimery 2005, 50, 43–47. [Google Scholar] [CrossRef]
  24. Półka, M. Analysis of the toxicity of thermal decomposition and combustion products obtained from selected epoxy materials. Res. Dev. 2010, 19, 73–78. [Google Scholar]
  25. Richard, C.; Thompson, R.C.; Moore, C.J.; Frederick, S.; vom Saal, F.S.; Swan, S.H. Plastics, the environment and human health: current consensus and future trends. Philos. Trans. R Soc. Lond. B Biol. Sci. 2009, 364, 2153–2166. [Google Scholar]
  26. Liszkowska, J.; Czupryński, B.; Paciorek-Sadowska, J.; Michałowski, S. Thermal and flammable properties of rigid PUR–PIR foams obtained by using new compounds based on 2-hydroxypropane-1.2.3-tricarboxylic acid. J. Cell. Plast. 2016, 52, 321–341. [Google Scholar] [CrossRef]
  27. Liszkowska, J. Properties of Rigid PUR-PIR Foams Obtained with the Condensation of Citric Acid with Diols and Selected Glycolysates; WU UKW: Bydgoszcz, Poland, 2016. [Google Scholar]
  28. Technical Card of Cinnamon; Agrema Sp. z o.o: Wrocław, Poland.
  29. Wirpsza, Z. Poliuretanes. Chemistry, Technology, Application; WNT: Warsaw, Poland, 1991. [Google Scholar]
  30. Liszkowska, J.; Czupryński, B.; Paciorek-Sadowska, J. Thermal properties of polyurethane-polyisocyanurate (PUR-PIR) foams modified with tris(5-hydroxypentyl)-2-hydroxypropane-1,2,3-tricarboxylate. J. Adv. Chem. Eng. 2016, 6, 148–154. [Google Scholar] [CrossRef]
  31. Czupryński, B.; Liszkowska, J.; Paciorek-Sadowska, J. Modification of rigid polyurethane-polyisocyanurate foam selected powder fillers. Polimery 2008, 3, 48–52. [Google Scholar]
  32. Mańczak, K. Experiment Planning Technique; WNT: Warszawa, Poland, 1976. [Google Scholar]
  33. ASTM Standard D7487–13e1. Standard Practice for Polyurethane Raw Materials: Polyurethane Foam Cup Test; ASTM International: West Conshohocken, PA, USA, 2016. [Google Scholar] [CrossRef]
  34. Operating Instructions for the Climate Chamber Model CCK-40/300 NG, Es-tor.
  35. Szczepaniak, W. Instrumental Methods in Chemical Analysis; PWN: Warsaw, Poland, 2011. [Google Scholar]
  36. Prociak, A. High-Tech Insulation Polyurethane Materials; WU PK: Cracow, Poland, 2008. [Google Scholar]
  37. Paciorek-Sadowska, J.; Borowicz, M.; Czupryński, B.; Liszkowska, J.; Tomaszewska, E. Application of halloysite as filler in the production of rigid PUR-PIR foams. Polimery 2018, 63, 185–190. [Google Scholar] [CrossRef]
  38. Gama, N.V.; Silva, R.; Mohseni, F.; Davarpanah, A.; Amaral, V.S.; Ferreira, A.; Barros-Timmons, A. Enhancement of physical and reaction to fire properties of crude glicerol polyurethane foams filled with expanded graphite. Polym. Test. 2018, 69, 199–207. [Google Scholar] [CrossRef]
  39. Paciorek-Sadowska, J.; Borowicz, M.; Czupryński, B.; Liszkowska, J. Composites of rigid polyurethane-polyisocyanurate foams with oak bark. Polimery 2017, 62, 666–672. [Google Scholar] [CrossRef]
  40. Rojek, M. Methodology of Diagnostic Tests of Layered Composite Materials with a Polymer Matrix (in Polish). Open Access Libr. 2011, 2, 11–31. [Google Scholar]
  41. Pączkowski, J. Photochemistry of Polymers. Theory and Applications; WU UMK: Toruń, Poland, 2003. [Google Scholar]
  42. Czaplińska, M.; Czepas, J.; Gwoździński, K. Structure, antioxidant and anti-cancer properties flavonoid bike. Adv. Biochem. 2012, 58, 235–244. [Google Scholar]
  43. Yi-Fang, C. (Ed.) Coffee: Emerging Health Effects and Disease Prevention; John Wiley & Sons, Inc.: New York, NY, USA; Blackwell Publishing Ltd.: Oxford, UK, 2012. [Google Scholar]
  44. Gawlik-Dziki, U. Phenolacids as bioactive food ingredients. Food Sci. Technol. Qual. 2004, 4, 29–40. [Google Scholar]
  45. Liszkowska, J. The effect of ground coffee on the mechanical and application properties of rigid polyurethane-polyisocyanurate foams. Polimery 2018, 63, 305–310. [Google Scholar] [CrossRef]
  46. Liszkowska, J.; Paciorek-Sadowska, J.; Czupryński, B. Temperature stability and thermal properties of polyurethane-polyisocyanurate foams obtained using products of citric acid condensation. Polimery 2018, 63, 503–514. [Google Scholar] [CrossRef]
  47. Czupryński, B.; Paciorek-Sadowska, J.; Liszkowska, J. Heat and thermal reistance of rigid polyurethane-polyisocyanurate foams with addition of polyethylene, polypropylene and foamed polystyrene recyclates. Inżynieria I Apar. Chem. 2008, 4, 15–16. [Google Scholar]
  48. Paciorek-Sadowska, J. Research on the Influence of Boric Acid and N, N–(dihydroxymethyl) urea Derivatives on the Properties of Rigid Polyurethane-Polyisocyanurate Foams; WU UKW: Bydgoszcz, Poland, 2011. (In Polish) [Google Scholar]
  49. Dick, C.; Dominges-Rosado, E.; Eling, B.; Liggat, J.J.; Lindsay, C.I.; Martin, S.C.; Mohammed, M.H.; Seeley, G.; Snape, C.E. The flammability the flammability of urethane-modified polyisocyanurates and its relationship to thermal degradation chemistry. Polymer 2001, 42, 913–923. [Google Scholar] [CrossRef]
  50. Janik, H. Progress in the studies of the supermolecular structure of segmented polyurethanes. Polimery 2010, 55, 421–430. [Google Scholar] [CrossRef]
  51. Thirumal, M.; Khastgir, D.; Singha, N.K.; Manjunath, B.S.; Naik, Y.P. Water blown rigid polyurethane foam. J. Appl. Polym. Sci. 2008, 8, 1810–1817. [Google Scholar] [CrossRef]
  52. Piszczyk, Ł.; Hejna, A.; Formela, K.; Danowska, M.; Strankowski, M. Morphology, mechanical and thermal properties of flexible polyurethane foams modified. Polimery 2014, 59, 783–791. [Google Scholar] [CrossRef]
Figure 1. FTIR analysis of cinnamon extract.
Applsci 09 02663 g001
Figure 2. Photography of foam series: (a) C_0t and CU_0t not degraded; and (b) C_48h and CU_48h aged in a hot air dryer (48 h, 120 °C).
Applsci 09 02663 g002
Figure 3. Foams of series 1t, degraded in the climatic chamber (one week).
Applsci 09 02663 g003
Figure 4. FTIR of: (a) C15_0t and C15_1t; and (b) CU15_0t and CU15_1t.
Applsci 09 02663 g004aApplsci 09 02663 g004b
Figure 5. SEM micrographs of foams: (a) W_0t, (b) W_1t; (c) C15_0t; (d) C15_1t; (e) CU15_0t; and (f) CU15_1t.
Applsci 09 02663 g005aApplsci 09 02663 g005b
Figure 6. DSC curves of foams modified by cinnamon extract: (a) C_0t series; (b) series C_1t; (c) series CU_0t; and (d) series CU_1t.
Applsci 09 02663 g006
Table 1. Cinnamon extract composition.
CompoundContent
(a) polyphenols
Chlorogenic acidtogether
5%
Flavonoids
Phenol acids
heavy metals
lead0.49 ppm
(b) cadmium0.15 ppm
arsenic0.81 ppm
mercury0.09 ppm
chromium1.06 ppm
chloride0.51 ppm
sulphate3.00 ppm
(c) carrier of the active substance (cellulose)about 94.9%
Table 2. Formulation of RPU/PIR foams.
FoamGround Cinnamon Extract
(g)
Antiblaze TCMP
(g)
W_0t0.054.0
WU_0t0.00.0
C5_0t15.954.0
C10_0t31.854.0
C15_0t47.654.0
CU5_0t15.90.0
CU10_0t31.80.0
CU15_0t47.60.0
Table 3. Processing times of RPU/PIR foams (0t series).
FoamCream Time (s)Free Rise Time (s)String Gel Time (s)Tack Free Time (s)Tmax (°C)
W_0t8342321126
WU_0t8342321125
C5_0t10462824151
C10_0t10483025146
C15_0t10543026148
CU5_0t9362524144
CU10_0t9402625144
CU15_0t10443327142
Table 4. Foam color measurement results.
FoamLab∆E
W_0t82.8−2.628.087.5
C5_0t85.10.514.986.4
C15_0t76.63.415.878.3
WU_0t81.8−3.627.086.2
CU10_0t71.02.715.972.8
W_48h71.48.427.977.1
C5_48h70.76.827.376.1
WU_48h58.715.835.170.2
CU5_48h62.65.923.167.0
CU15_48h65.25.619.168.1
W_1t56.418.217.361.8
C5_1t57.317.416.160.1
C15_1t50.821.629.262.4
WU1_t56.316.021.362.3
CU5_1t53.416.721.760.0
CU15_1t57.113.718.161.4
Table 5. Results of foam aging measurement in an air dryer (120 °C, 48 h).
Foam∆l (%)∆V (%)∆m (%)
W+0.39 ± 0.00−1.07 ± 0.012.27 ± 0.01
C5+0.00 ± 0.00−1.37 ± 0.012.09 ± 0.01
C10+0.80 ± 0.00−1.94 ± 0.012.35 ± 0.01
C15+0.99 ± 0.00−2.07 ± 0.012.91 ± 0.01
WU+0.21 ± 0.00−1.89 ± 0.012.40 ± 0.01
CU5+0.50 ± 0.00−2.28 ± 0.012.31 ± 0.01
CU10+0.95 ± 0.00−2.41 ± 0.011.70 ± 0.01
CU15+0.85 ± 0.00−2.85 ± 0.011.42 ± 0.01
Table 6. Compressive strength (CS) and compressive strength ratio (CV): CS_0t—measured before condition; CS_1t—measured after one-week condition.
FoamCS_0t
(kPa)
CS_1t
(kPa)
CV
(%)
W251.6 ± 6140.5 ± 474.7 ± 2
WU361.4 ± 9256.2 ± 670.9 ± 2
C5212.7 ± 6200.1 ± 594.1 ± 2
C10160.4 ± 4143.9 ± 489.7 ± 2
C15147.3 ± 3126.6 ± 486.0 ± 2
CU5121.4 ± 3151.1 ± 4124.4 ± 3
CU10109.4 ± 2132.8 ± 4121.4 ± 3
CU1591.9 ± 2109.6 ± 3119.2 ± 3
Table 7. Results of the FTIR analysis.
Band, cm−1Bond
3325N–H
2930C-H
2276–N=C=O
2137–N=C=N–
1713–C=O in urethane bond
1596N–H
1512N–H
1411Isocyanurate ring
1225C=N in trimer
1076C–O
Table 8. Absorbability (A), water absorption (WA), softening point (SP), brittleness (B), apparent density (d), and content of closed cells (CC).
FoamA (%)WA (%)SP (°C)B (%)d (kg/m3)CC (%)
W12.33 ± 0.375.15 ± 0.05184 ± 513.27 ± 0.0139.67 ± 0.0383.2 ± 0.2
C513.41 ± 0.405.67 ± 0.06189 ± 614.34 ± 0.0139.60 ± 0.0374.3 ± 0.2
C1022.34 ± 0.676.14 ± 0.06181 ± 513.04 ± 0.0135.72 ± 0.0239.1 ± 0.1
C1536.05 ± 1.089.64 ± 0.10166 ± 511.93 ± 0.0133.97 ± 0.025.7 ± 0.0
WU8.14 ± 0.043.12 ± 0.01204 ± 616.42 ± 0.0149.60 ± 0.0389.5 ± 0.3
CU523.22 ± 0.693.78 ± 0.01185 ± 645.60 ± 0.3130.94 ± 0.0217.4 ± 0.5
CU1018.04 ± 0.544.02 ± 0.01179 ± 644.22 ± 0.3129.19 ± 0.0223.4 ± 0.7
CU1517.14 ± 0.514.99 ± 0.02172 ± 642.13 ± 0.2929.43 ± 0.0228.1 ± 0.8
Table 9. Flame properties of foams: combustion residue (CR); limited oxygen index (LOI); and horizontal test (HT).
FoamCR (%)LOI (%vol. of O2)HT
W83.4 ± 1.624.7 ± 0.2self-extinguishing
C591.2 ± 1.824.4 ± 0.2
C1091.6 ± 1.824.6 ± 0.2
C1591.7 ± 1.823.7 ± 0.2
WU37.7 ± 0.818.5 ± 0.1
CU5650 ± 0.921.0 ± 0.2
CU1063.3 ± 0.920.3 ± 0.1
CU1563.3 ± 0.920.2 ± 0.1
Table 10. Values of thermal transformations of foams series C (with flame retardant) using the DSC. 0t—foams before degradation, 1t—foams after 1-week degradation.
Foam Peak P1Peak P2Peak P3
Tonset,
(°C)
Tmax1
(°C)
Tk1
(°C)
H1
(J/g)
Tonset2
(°C)
Tmax2
(°C)
Tk2
(°C)
H2
(J/g)
Tonset3
(°C)
Tmax3
(°C)
Tk3
(°C)
H3
(J/g)
W_0t21.771.8146.625.8278.6294.8325.344.9326.3330.4347.35.1
C5_0t44.682.3131.426.5266.0285.9316.628.0330.2335.9351.64.6
C10_0t46.786.4139.433.4261.9274.5319.135.6324.0329.8352.76.1
C15_0t46.785.6140.836.5262.6271.0314.430.8327.1333.2357.78.9
W_1t54.791.3179.841.8271.5289.0314.419.0318.2323.6342.24.7
C5_1t39.793.9133.947.5259.7285.3313.013.8331.2337.5358.85.2
C10_1t40.194.0140.050.0249.7271.2310.415.5329.6334.1342.57.1
C15_1t47.494.4142.253.0244.8267.3305.817.8323.0333.4363.211.1
Table 11. Values of thermal transformations of foams series CU (without flame retardant) by using the DSC. 0t—foams before degradation, 1t—foams after one week degradation.
Foam Peak P1Peak P2Peak P3
Tonset1
(°C)
Tmax1
(°C)
Tk1
(°C)
H1
(J/g)
Tonset2
(°C)
Tmax2
(°C)
Tk2
(°C)
H2
(J/g)
Tonset3
(°C)
Tmax3
(°C)
Tk3
(°C)
H3
(J/g)
WU_0t s 29.678.1129.633.1227.8325.6354.076.6354.0374.7391.65.71
CU1_0t47.681.2121.814.2213.5261.3322.093.7327.9356.7392.337.1
CU5_0t37.182.5129.627.4219.3279.6315.3136.7315.3348.7394.246.1
CU15_0t35.684.1138.055.0221.3282.3320.0116.0307.1336.2395.110.1
WU_1t54.791.1179.841.6271.5289.0314.419.0318.2323.6342.24.4
CU1_1t37.882.8136.149.6221.3308.1326.9147.6326.9352.0391.636.8
CU5_1t35.684.1141.454.9218.6287.3320.0146.0320.0346.3386.220.6
CU15_1t38.391.0150.982.9279.9325.2355.849.2354.7368.7390.54.0
Table 12. Results of SEM micrograph analysis.
Foam SymbolCell/Hole Height (µm)Cell/Hole Width (µm)Anisotropy CoefficientCell/Hole Surface Area (mm2)Content of Cell/Hole per Area Unit (cell/mm2)
W_0t606.6 ± 2540.7 ± 21.12 ± 0.000.258 ± 0.0013.88 ± 0.01
C5_0t399.0 ± 1326.4 ± 11.22 ± 0.000.102 ± 0.0019.80 ± 0.01
C15_0t325.3 ± 1322.4 ± 11.01 ± 0.000.084 ± 0.00111.92 ± 0.03
W_1t367.7 ± 1340.9 ± 11.08 ± 0.000.098 ± 0.00110.20 ± 0.03
C5_1t359.7 ± 2348.1 ± 11.05 ± 0.000.085 ± 0.00111.77 ± 0.03
C15_1t260.4 ± 2249.0 ± 21.04 ± 0.000.051 ± 0.00119.69 ± 0.04
CU5_0t598.4 ± 2613.0 ± 20.98 ± 0.000.288 ± 0.0013.47 ± 0.01
CU15_0t563.8 ± 2558.2 ± 20.97 ± 0.000.255 ± 0.0013.52 ± 0.01
CU5_1t981.1 ± 2978.2 ± 21.00 ± 0.000.754 ± 0.0011.33 ± 0.00
CU15_1t980.3 ± 2916.4 ± 21.06 ± 0.000.705 ± 0.0011.42 ± 0.00

