1. Introduction
Globally, recent years have witnessed a dramatic increase in the occurrence of emergencies. Emergency situations are often created by natural and man-made disasters, such as the September 11 terrorist attack in New York in 2001, the Indian Ocean tsunami in 2004, the Wenchuan earthquake in 2008, and Hurricane Irma in 2017, all of which caused huge losses of life and property. During a major emergency, an attempt is made to rapidly evacuate a large number of people from the affected area to safer locations. However, the capacity of the evacuation roads may be too small to support the exploding volume of traffic. Strategies for increasing the road capacity in such situations are thus critical. Contraflow, or reversed lanes, in which the traffic flow in some or all of the inbound lanes is reversed, has been widely adopted in emergency response plans to increase the capacity of outbound roads and the overall evacuation speed. According to the Federal Emergency Management Agency [
1], reversing one lane of a four-lane dual highway increases the evacuation road capacity by approximately 30%, while Wolshon [
2] observed a 67% increase when all the inbound lanes were reversed.
Because contraflow is an important emergency response traffic strategy in many countries, several studies have been conducted on different contraflow strategies and their effectiveness. Wolshon [
2] proposed three types of contraflow schemes, namely, reversing one/some inbound lanes, reversing all inbound lanes, and using the outbound left shoulder as an additional lane with reversed inbound lanes. Yu [
3] found that the termination points of contraflow sections usually were characterized by merging conflicts and traffic congestion, therefore proposing to maintain a substantial number of exits along the contraflow section to increase the overall evacuation efficiency. Chiu et al. [
4] developed a large-scale regional dynamic traffic simulation and assignment model of the contraflow strategy by DynusT, and they demonstrated that the performance of the contraflow strategy could be enhanced when used in conjunction with the phased evacuation strategy, enabling a reduction of nearly 30% in evacuee travel time. Theodoulou et al. [
5] modified the design of the contraflow entry-points and exit-points in New Orleans by adding transition sections to avoid congestion. Lim et al. [
6] used CORSIM (Corridor Simulation) models to identify the key factors of a contraflow design and recommended the location of a merge zone after a freeway exit instead of before it, and the application of channelization or separation devices to enhance the flow quality near the termination of a merge zone. It has also been suggested that in countries and regions with low levels of private car ownership, buses and coaches provided by the government and organizations should be used as the main transportation medium for human evacuation during an emergency [
7]. Hence, to achieve high-efficiency bus and coach shuttling between gathering points and diving points, Ren et al. [
8] proposed the implementation of bus-only lanes. These previous studies considered different approaches for improving the efficiency of contraflow lanes under different conditions of emergency evacuation. The proposed methods involved changing road structures at a fundamental level or controlling vehicle movement at a subsidiary level. For further evaluation of the contraflow strategy at a meso-microscopic level, it is necessary to analyze and compare the traffic flow characteristics of contraflow and regular lanes.
Despite the long history of contraflow strategy studies, they have been seldom implemented in real emergency evacuations. Incidentally, it is difficult to use the commonly employed methods to duplicate the traffic conditions of a real contraflow lane during an emergency. Traditionally, researchers collect traffic data at peak points of non-emergency implementations of the contraflow strategy, such as during special events, based on which they attempt to assess the effects of using the contraflow strategy for emergency evacuation [
9,
10]. The results of such studies have shown that the adoption of an empirical observation enhanced the benefits of this approach. However, this was overly dependent on the prevalence of the appropriate situations, with respect to factors such as traffic volume, traffic composition, road structure, and the length of the contraflow lanes. Different algorithms and simulation methods have been used to evaluate the effects of different contraflow schemes to attempt to develop an optimal scheme. Software packages like DynusT [
5], DYNASMART (Dynamic Network Assignment-Simulation Model for Advanced Roadway Telematics) [
11], and CORSIM [
4] were developed for the estimation of traffic volume and travelling time under different contraflow schemes. Heuristic [
12], genetic [
13], greedy [
14], and Tabu search [
15] algorithms have also been used to search for the best contraflow schemes. Through the modelling and simulations performed with the aid of such algorithms, major breakthroughs have been achieved in the use of traffic contraflow for mass evacuation. Nevertheless, this research method requires a large amount of real data for parameter adjustment and to prove the reliability and feasibility of the employed models.
Despite the effectiveness of the contraflow strategy for managing a substantial increase in traffic volume during emergency evacuation, several problems still arise from its implementation [
16]. The most serious of the problems is travel delay, which is mainly caused by “fixed bottlenecks” at the entries and exits of the contraflow lanes. The bottlenecks are usually too narrow for vehicles to quickly pass through, resulting in decreases in the traffic flow speed, typically of 15–25 km/h [
5]. The diversion flow at the entries and merge flow at the exits also impact the evacuation efficiency. There is also the problem of “moving bottlenecks,” which are traffic buildups caused by slow-moving large or heavily loaded vehicles such as trucks and coaches. Many researchers have investigated the reduction of “fixed bottlenecks” through the optimization of the design of the entries and exits of contraflow lanes. However, to the best of our knowledge, few studies have considered the travel delay due to “moving bottlenecks” in contraflow lanes. Because the effects of moving bottlenecks are closely related to the ratio of heavy vehicles, previous researchers have eliminated or neglected their impact by forbidding trucks and coaches or setting a constant ratio of trucks and coaches [
17]. For example, some studies assumed that the percentage of heavy vehicles was 15%, which is twice the 7–8% indicated in the 2001 Federal Highway Administration (FHWA) Highway Statistics Annual Report [
3,
5,
16]. Some researchers also assumed that the evacuation traffic was composed of 98% passenger vehicles and 2% heavy vehicles, based on the fact that most evacuees prefer using their own vehicles to escape from hazardous areas [
18]. In reality, during mass evacuation, the ratio of trucks and coaches may be relatively high and may also vary among different regions. Further research is thus required to explore the effect of “moving bottlenecks” on traffic flow when using the contraflow strategy, with respect to the heavy vehicle ratio.
In the present study, traffic data were collected during peak traffic hours on the Xihan Highway under contraflow and regular traffic conditions. The data were used for a microscopic investigation of the traffic characteristics of the contraflow and normal traffic lanes. Trucks were not allowed to enter the test section during the observation periods, and thus only traffic data for passenger cars and coaches was obtained. The effects of the moving bottlenecks caused by the coaches under contraflow strategy were examined. The empirical observations were used to build a Vissim simulation model for further investigation of the effects of moving bottlenecks caused by trucks under contraflow strategy. The results of the simulations were used to develop four different contraflow traffic schemes.
The rest of this paper is organized as follows: The field experiments performed on the Xihan Highway are briefly described in
Section 2. In
Section 3, the road capacity and flow speed characteristics of the contraflow and normal traffic lanes during the implementation of the contraflow strategy are analyzed. The effects of moving bottlenecks caused by coaches and trucks along the contraflow lanes are discussed in
Section 4, and alternative contraflow traffic schemes are proposed to improve the evacuation efficiency. Finally,
Section 5 summarizes the achievements of the present study and briefly presents the scope for further study.
2. Data Collection
To obtain a better understanding of how the contraflow strategy affects evacuation traffic on highways and explore alternative methods tailored to the specific traffic conditions, both field experiments and traffic simulations were performed in this study. There were three reasons for performing the field highway contraflow experiments. First, the highway contraflow strategy has rarely been employed during emergency evacuations in the past, and the data from real contraflow traffic are presently unavailable. In the rare cases when a highway contraflow strategy was used, either the amount of traffic was small, the length of the contraflow segment was very limited, or the contraflow duration was short. This resulted in the failure of the experiments to reflect the true situation of highway emergency evacuation. Conversely, the conditions of the present field experiments on the Xihan Highway were similar to those during real emergency evacuations. Second, most previous studies on the contraflow strategy focused on the selection of the contraflow route and the estimation of the travel time on a macroscopic level, with only a few examining the traffic characteristics in the contraflow segments on a microscopic level. Third, although the concept of the contraflow strategy is easy to understand, its practical arrangement and management is challenging. Many of the associated problems can only be properly encountered in the field.
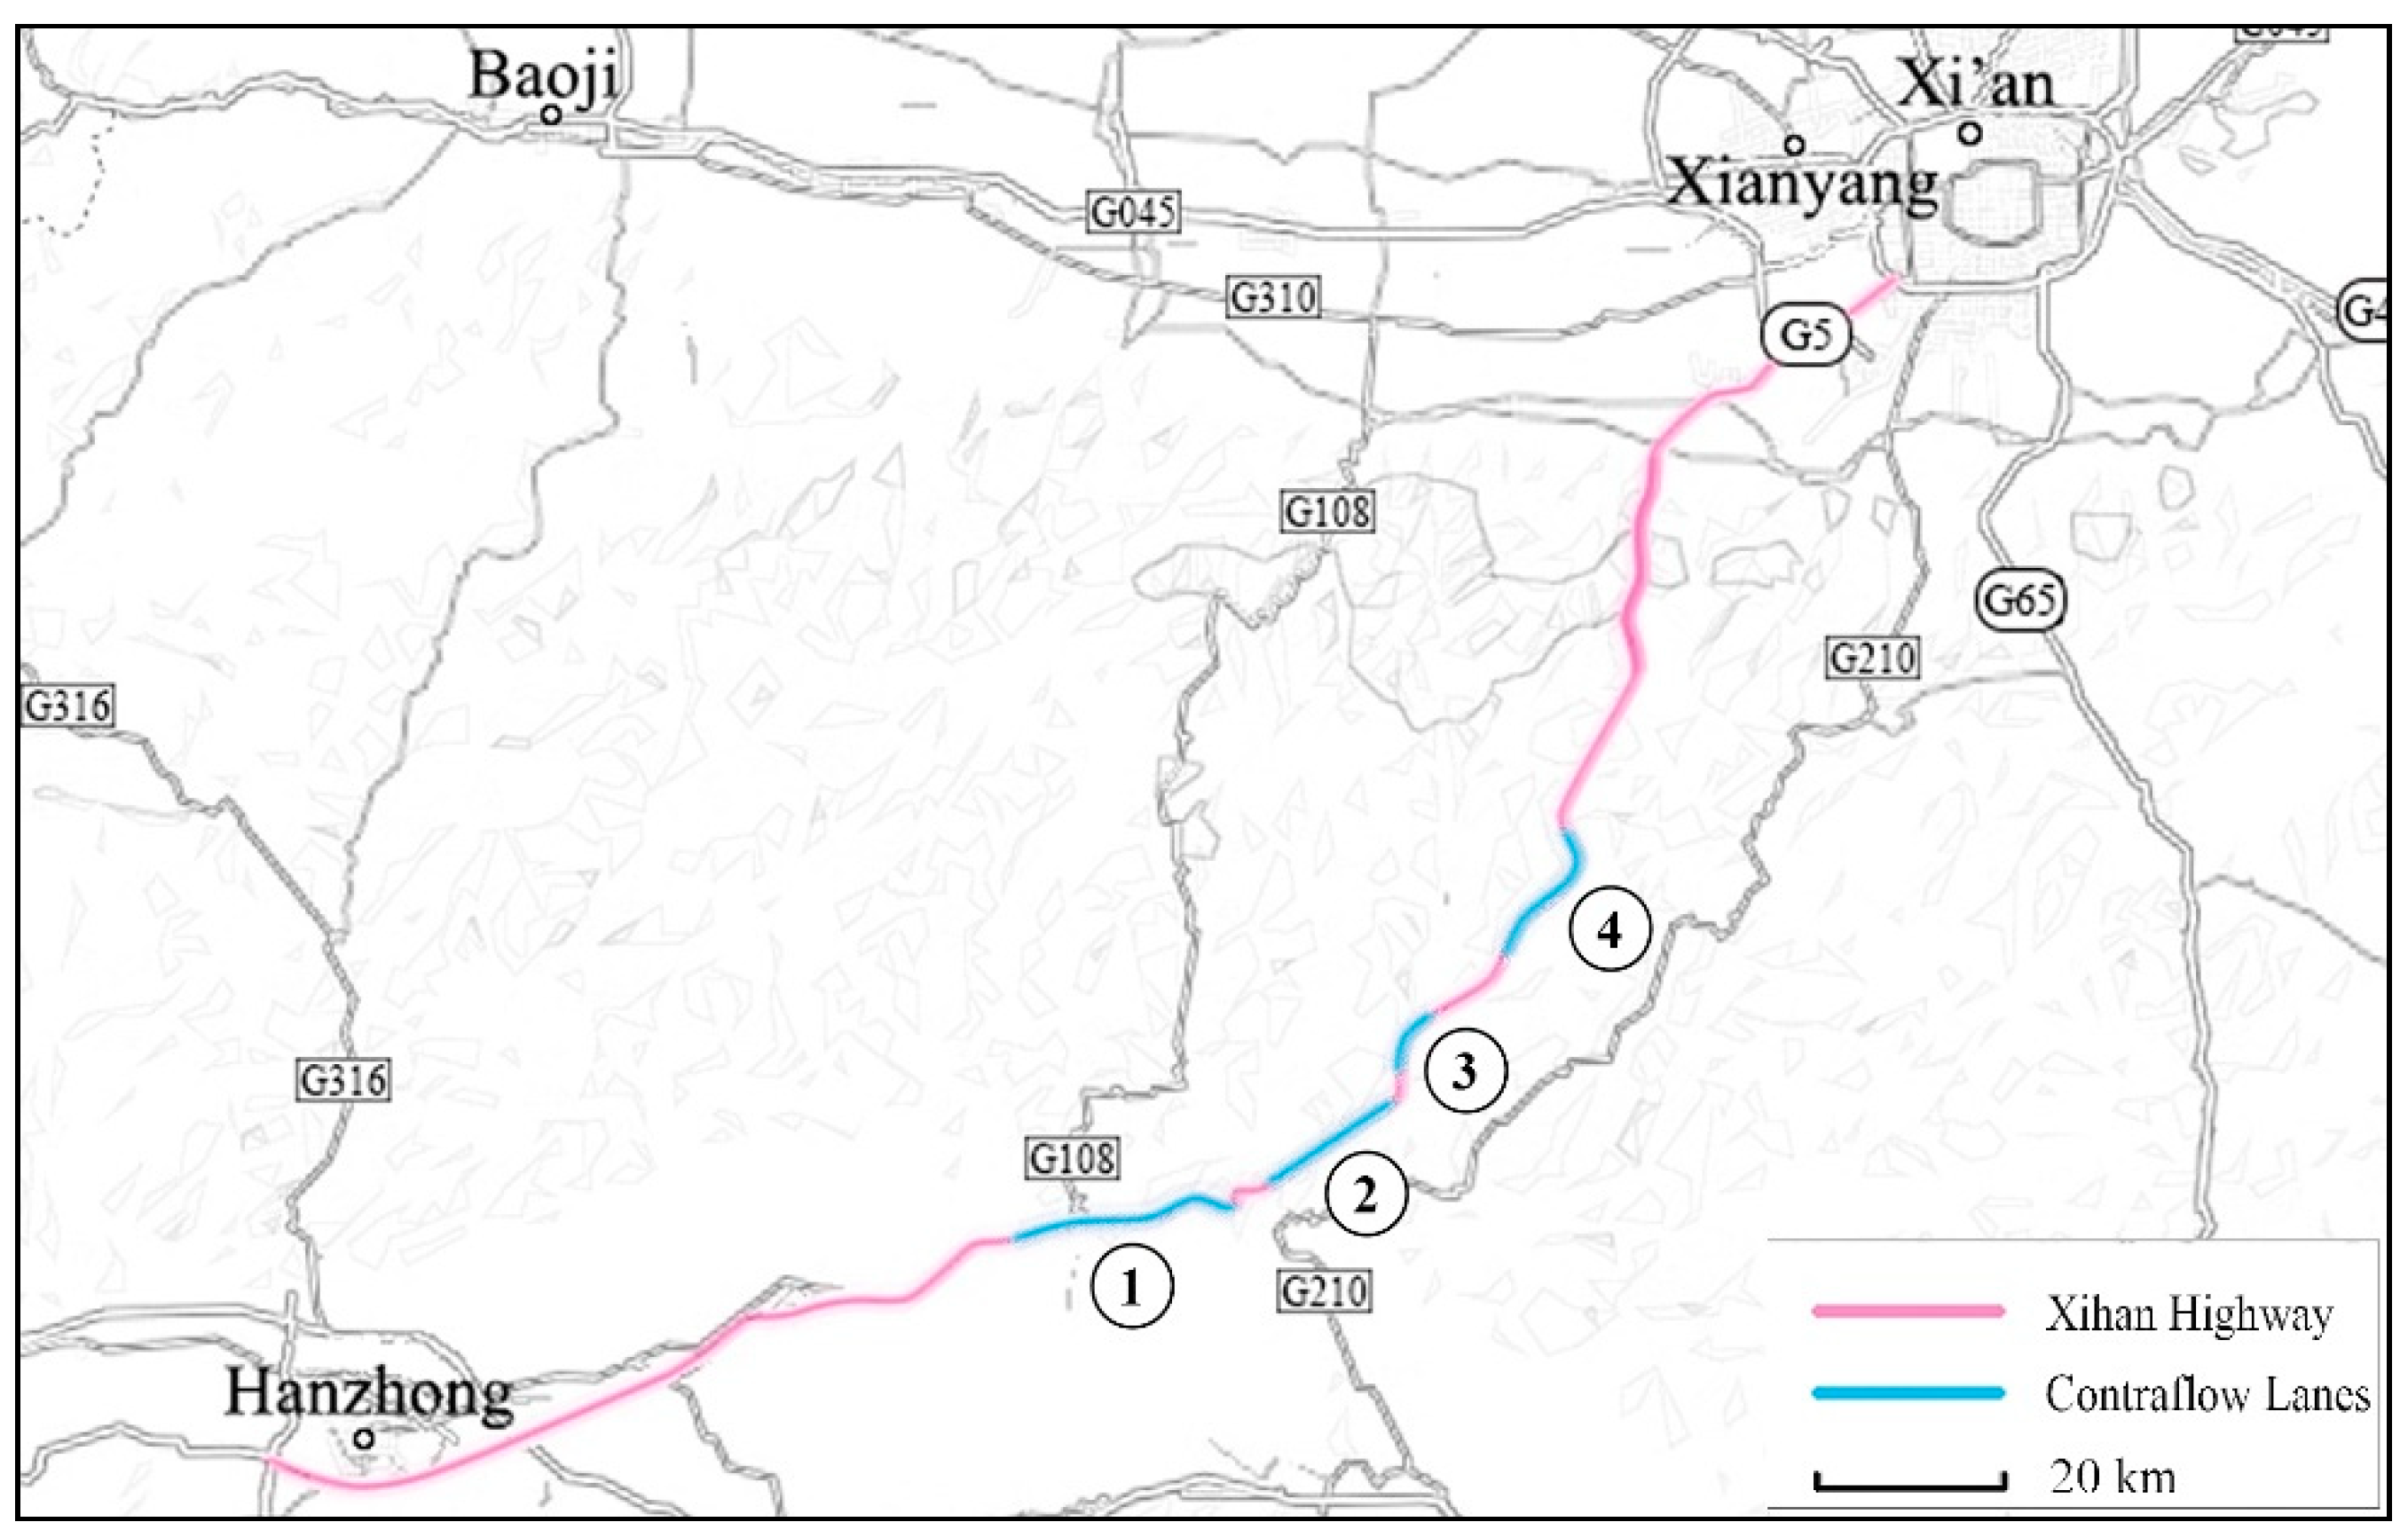
The Xihan Highway connects Xi’an and Hanzhong, extending approximately 259 km and incorporating 43 junctions. It is a dual four-lane highway, with each lane measuring 3.5 m in width. To improve the road pavement condition of the highway, the Department of Transportation of Shaanxi Province conducted pavement maintenance works along the entire stretch between 20 July and 31 August during 2017. The activities included pothole patching, minor reshaping, minor sealing, and crack filling. During the time of the project, trucks were forbidden from the highway and traffic contraflow was implemented along several segments of the highway. In
Figure 1, the Xihan Highway is marked in red, with the contraflow sections highlighted in blue.
The effect of the contraflow strategy was analyzed based on data collected at the section between K1244+700 and K1258+000 along the Xihan Highway (a section about 13.3 km long). Specifically, the contraflow section had its start and end points at K1422+700 and K1258+000, respectively (number 1 contraflow section in
Figure 1). The geometric design of this road section was appropriate so that the effect of the road alignment on vehicle speed could be ignored. The speed limit within the road section during normal times is 80 km/h.
During the experiment, a laser-based AxleLight vehicle classifier system (AVCS) was installed at 25 different observation points beside the road to collect traffic flow data from each contraflow and normal traffic lane, including the vehicle speed, travel direction, vehicle type, wheelbase, and headway. Additional observation points were set at the entry and exit of the contraflow section. The traffic flow data obtained by the AVCS were automatically and continuously stored and could not be lost, even when the system was switched off. The compactness of the AVCSs enabled their easy setup, simple operation, and concealment behind the highway side barriers. They generally facilitated the acquisition of large amounts of real traffic data under contraflow and regular conditions.
As a major link between two famous tourist cities, Xi’an and Hanzhong, the Xihan Highway is always busy, especially so during the travel seasons. In this study, the contraflow conditions during peak periods of the highway were observed to examine the effectiveness of the contraflow strategy for mass evacuations during serious emergencies. However, because the traffic data acquired from the observed contraflow sections were obtained during basically normal days, the influence of mental stress and mood disorders on driving behavior, which occur during real emergencies, could not be accurately reflected. Thus, there are potential differences between the contraflow traffic characteristics observed during the present study and those of actual emergency situations.
The normal traffic characteristics of the Xihan Highway at peak periods without the contraflow strategy were also observed to contrast them with those under contraflow conditions. It is noteworthy that the normal traffic observed in this study was also with trucks forbidden from the highway. In addition, no road accidents occurred on the highway during the observation period.
3. Analysis of Traffic Characteristics
The data for the normal and contraflow lanes collected from each observation point consisted of 5-min aggregated data of the traffic flow and speed. To understand the characteristics of mass evacuation traffic, the data for saturated and unsaturated traffic conditions collected in the present study were analyzed with respect to the road capacity, traffic flow, and relationship between the traffic density and flow speed.
3.1. Road Capacity
The quantity of the collected data was very large.
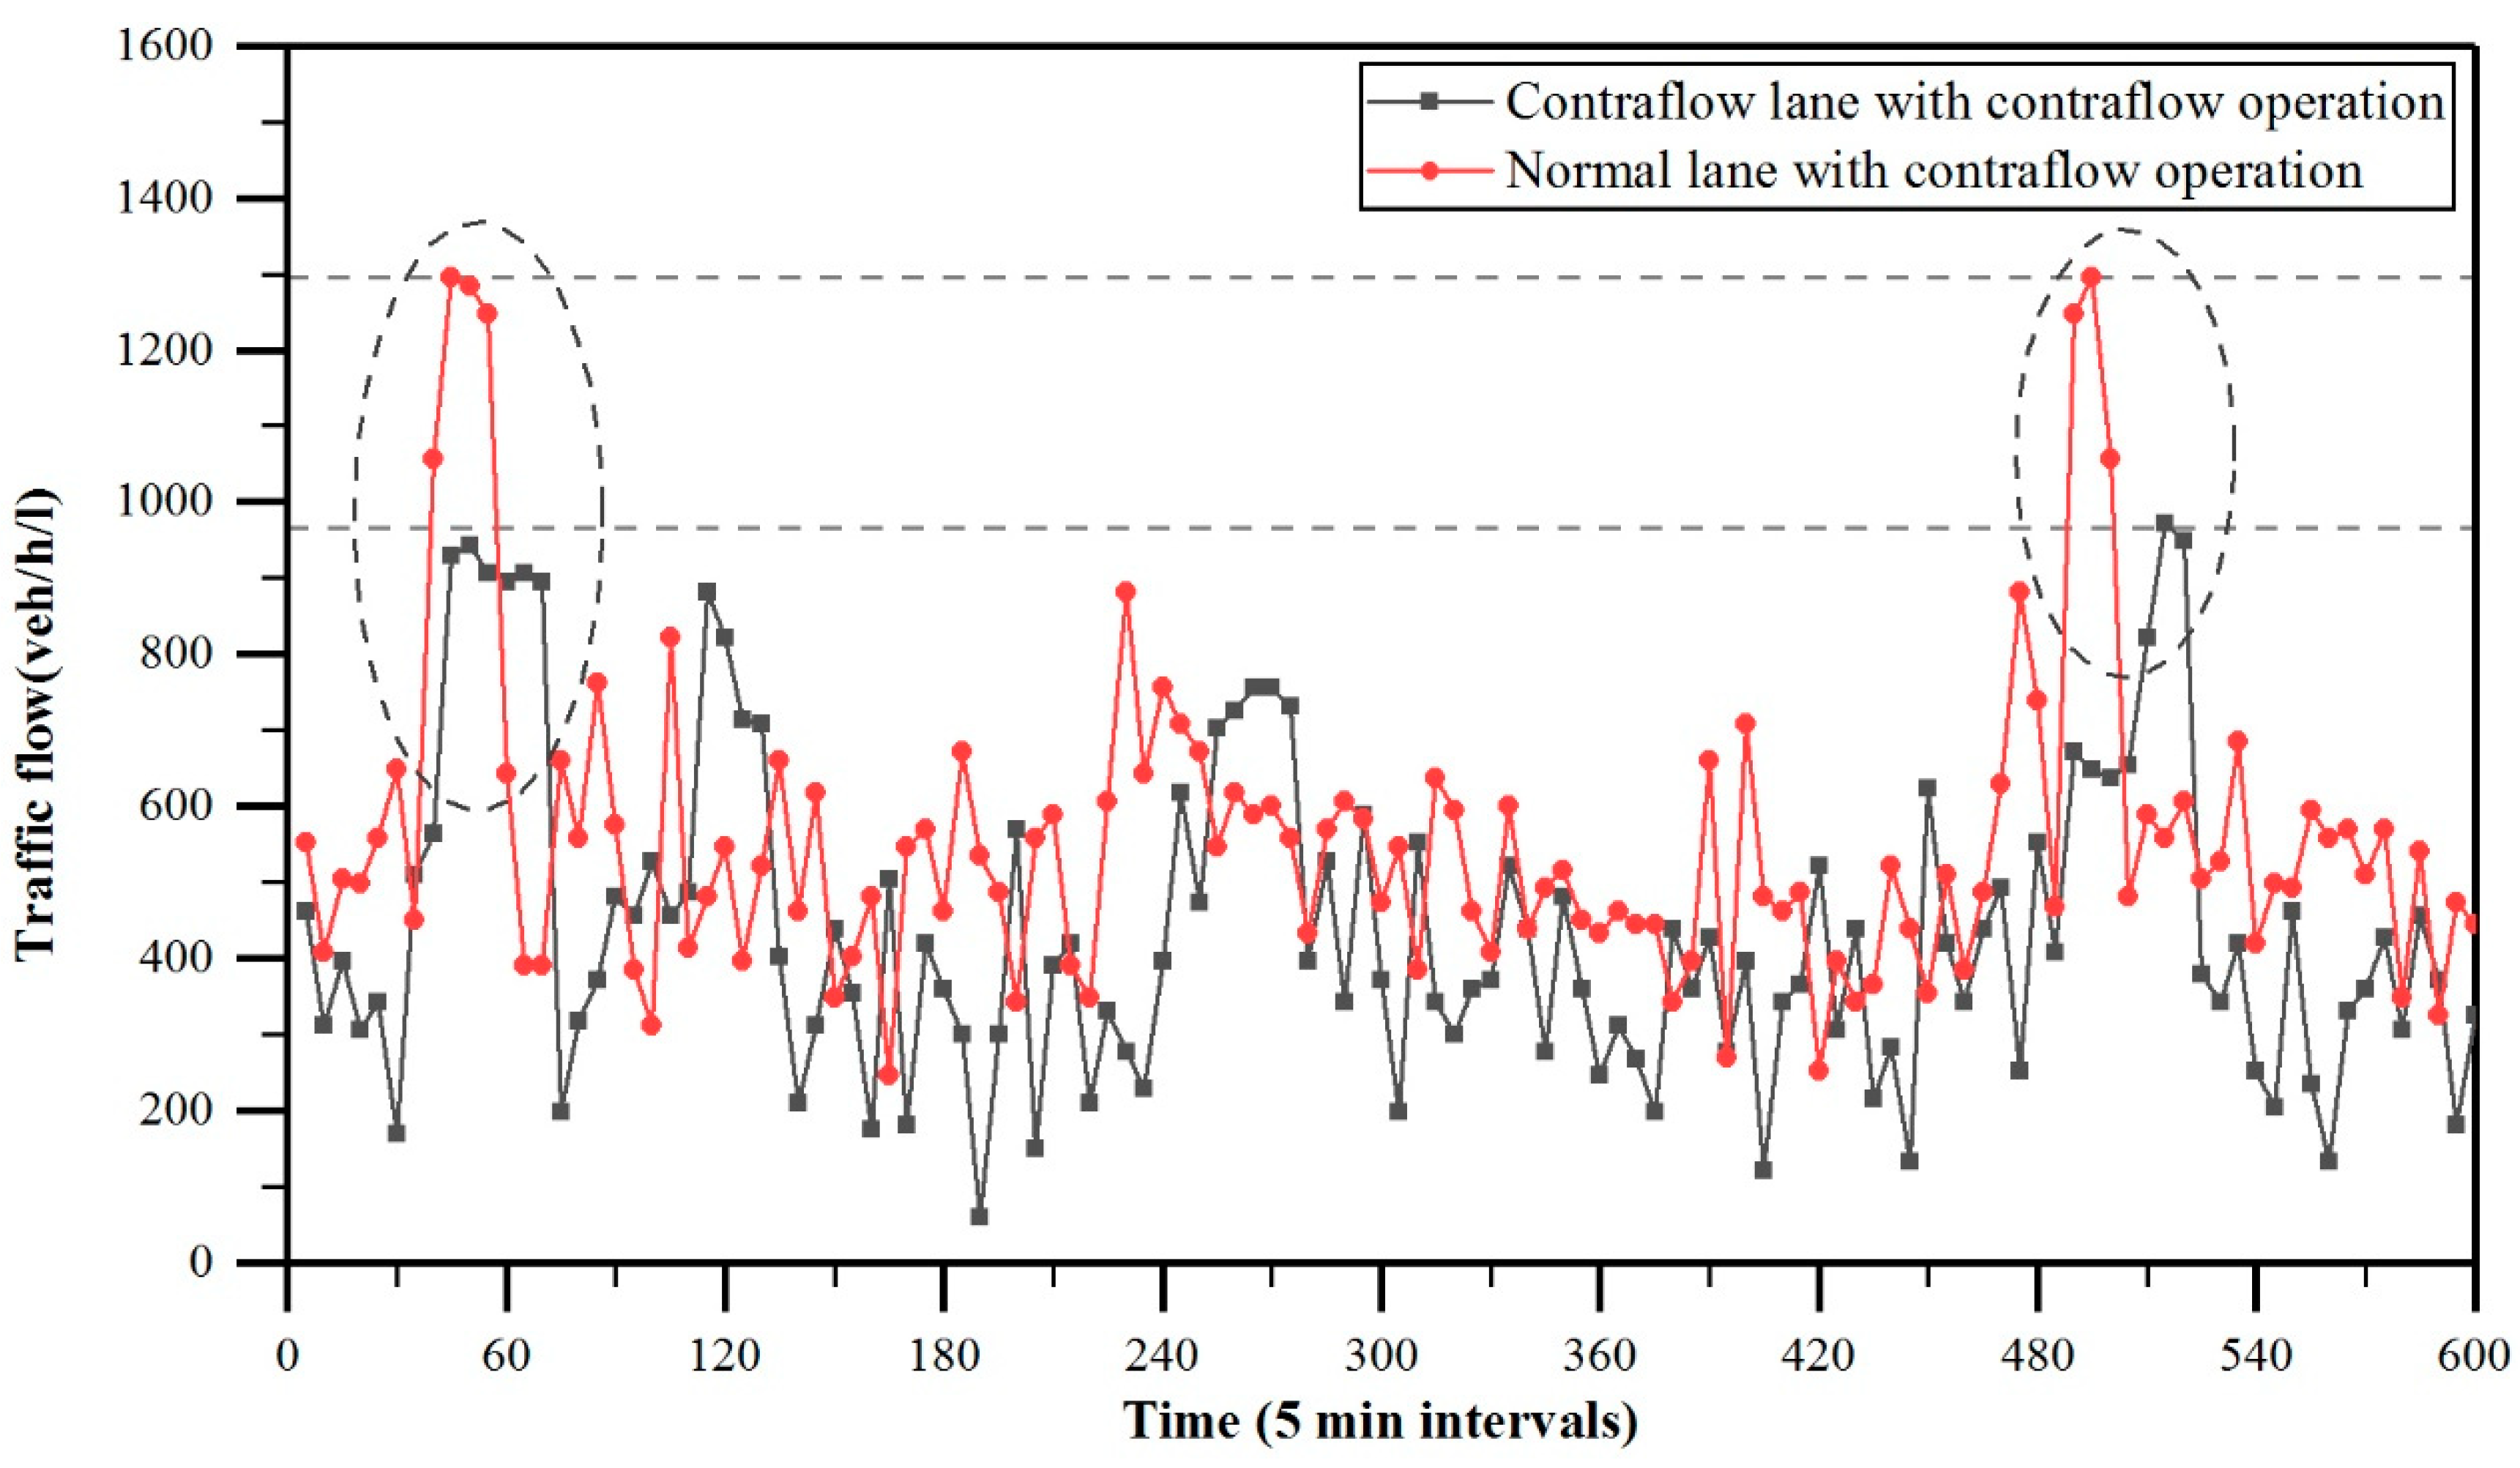
Figure 2 only shows an example for a 5 h period, which is approximately representative of the characteristics of the traffic during the entire study. As can be seen from the figure, the traffic volumes on the contraflow and normal lanes seldom reached the capacity of the road. This enabled the detailed analysis of both free and saturated flow states. The maximum traffic volumes on the contraflow and normal lanes are indicated by the dashed lines in
Figure 2.
The traffic capacities of the normal and contraflow lanes were 1296 and 927 veh/h/L, respectively. In other words, for the four-lane dual carriageway, the outbound road capacity was increased by nearly 36% by reversing one of the inbound lanes. This shows that full capacity cannot be achieved on a reversed lane when using the contraflow strategy, agreeing with the findings of previous studies. The Federal Highway Administration (FHWA) [
1] found that reversing one and two lanes increased the outbound capacity by 30% and 67%, respectively, while Collins [
9] reported 31% and 83%, respectively. There are a number of possible reasons for these observations. First, the fixed bottlenecks at the entry and exit points of the contraflow lanes significantly limit their traffic capacity. In the present study, drivers were observed to decrease their speed by 25–35 km/h to enter and exit the contraflow lanes, as summarized in
Table 1. Second, drivers were unfamiliar with the reversed direction in which they drove on the contraflow lanes and tended to be more careful and cautious to observe the road conditions and signs. Moreover, the inbound and outbound lanes in the contraflow section were only separated by traffic cones, with the vehicles moving in the opposite direction affecting the drivers.
As shown in
Figure 2, before the maximum level was attained, the traffic volume of the normal lane was higher than that of the contraflow lane, specifically by more than 23.34%. This suggests that most drivers preferred to use the normal lanes rather than the contraflow lane, possibly because the former were more familiar and safer. However, there was a dynamic balance between the normal and contraflow lanes when the traffic volume approached the road capacity. Because most drivers chose the normal lanes, the traffic density of the normal lanes steadily increased at a faster rate than that of the contraflow lane. Eventually, as the normal lanes saturated, drivers began to opt for the contraflow lane for faster movement. The traffic density of the contraflow lane thus began to increase at a faster rate until it exceeded that of the normal lanes, and drivers eventually began to once again prefer the normal lanes. This cycle was continuously repeated. This dynamic variation in the traffic density under the contraflow strategy can be observed from
Figure 2, where the dashed circles highlight how the traffic peak of the contraflow lane trails that of the normal lanes.
3.2. Flow Speed
The traffic flow speeds with and without the implementation of a contraflow strategy were compared to better examine the effect of the contraflow strategy on the traffic characteristics. Statistical analysis showed that, for the same traffic volume, the flow speed under regular conditions was significantly lower than that under the contraflow strategy. This can be explained by the fact that the added contraflow lane bore a substantial amount of the traffic pressure and directly improved the outbound road capacity.
As indicated in
Table 1, for a given traffic volume of 2500 veh/L, the normal lanes under regular conditions were almost saturated, whereas they still performed well when the contraflow strategy was employed. With increasing traffic volume, the speed difference between the two conditions gradually decreased as the lanes approached their maximum capacities. The comparison of the average speeds of 38.06 and 37.44 km/h of the normal lanes under regular conditions for traffic volumes of 2500 and 3500 veh/h, respectively, with the average speed of 39.20 km/h under contraflow conditions demonstrates this point. In addition, the flow speed of the contraflow lane was lower than that of the normal lanes under contraflow conditions, specifically by 8–13 km/h. Through independent sample
t-tests of vehicle speed under different traffic volumes under contraflow conditions, a significant difference was found to exist between the vehicle speeds on the normal and contraflow lanes (
p < 0.05).
Furthermore, the speed variations of the different lanes under regular and contraflow conditions were analyzed to investigate traffic safety. It is generally accepted that the occurrence of road accidents such as front-to-rear collisions and sideswiping are related to traffic speed variation, with a larger speed variation increasing the probability of such accidents. In
Table 1, the speed variation of the contraflow lane is always higher, which may be attributed to driver unfamiliarity and anxiety due to the reversal of the typical driving direction. In addition, the speed variation was observed to generally decrease with increasing traffic volume. The speed variation on each lane is also associated with road safety. It is usually easier for drivers to be distracted and decide to change lanes when the traffic on their current lane is moving much slower than that on another lane. Overall, a larger traffic volume decreases the driving speed on a lane but increases the safety level.
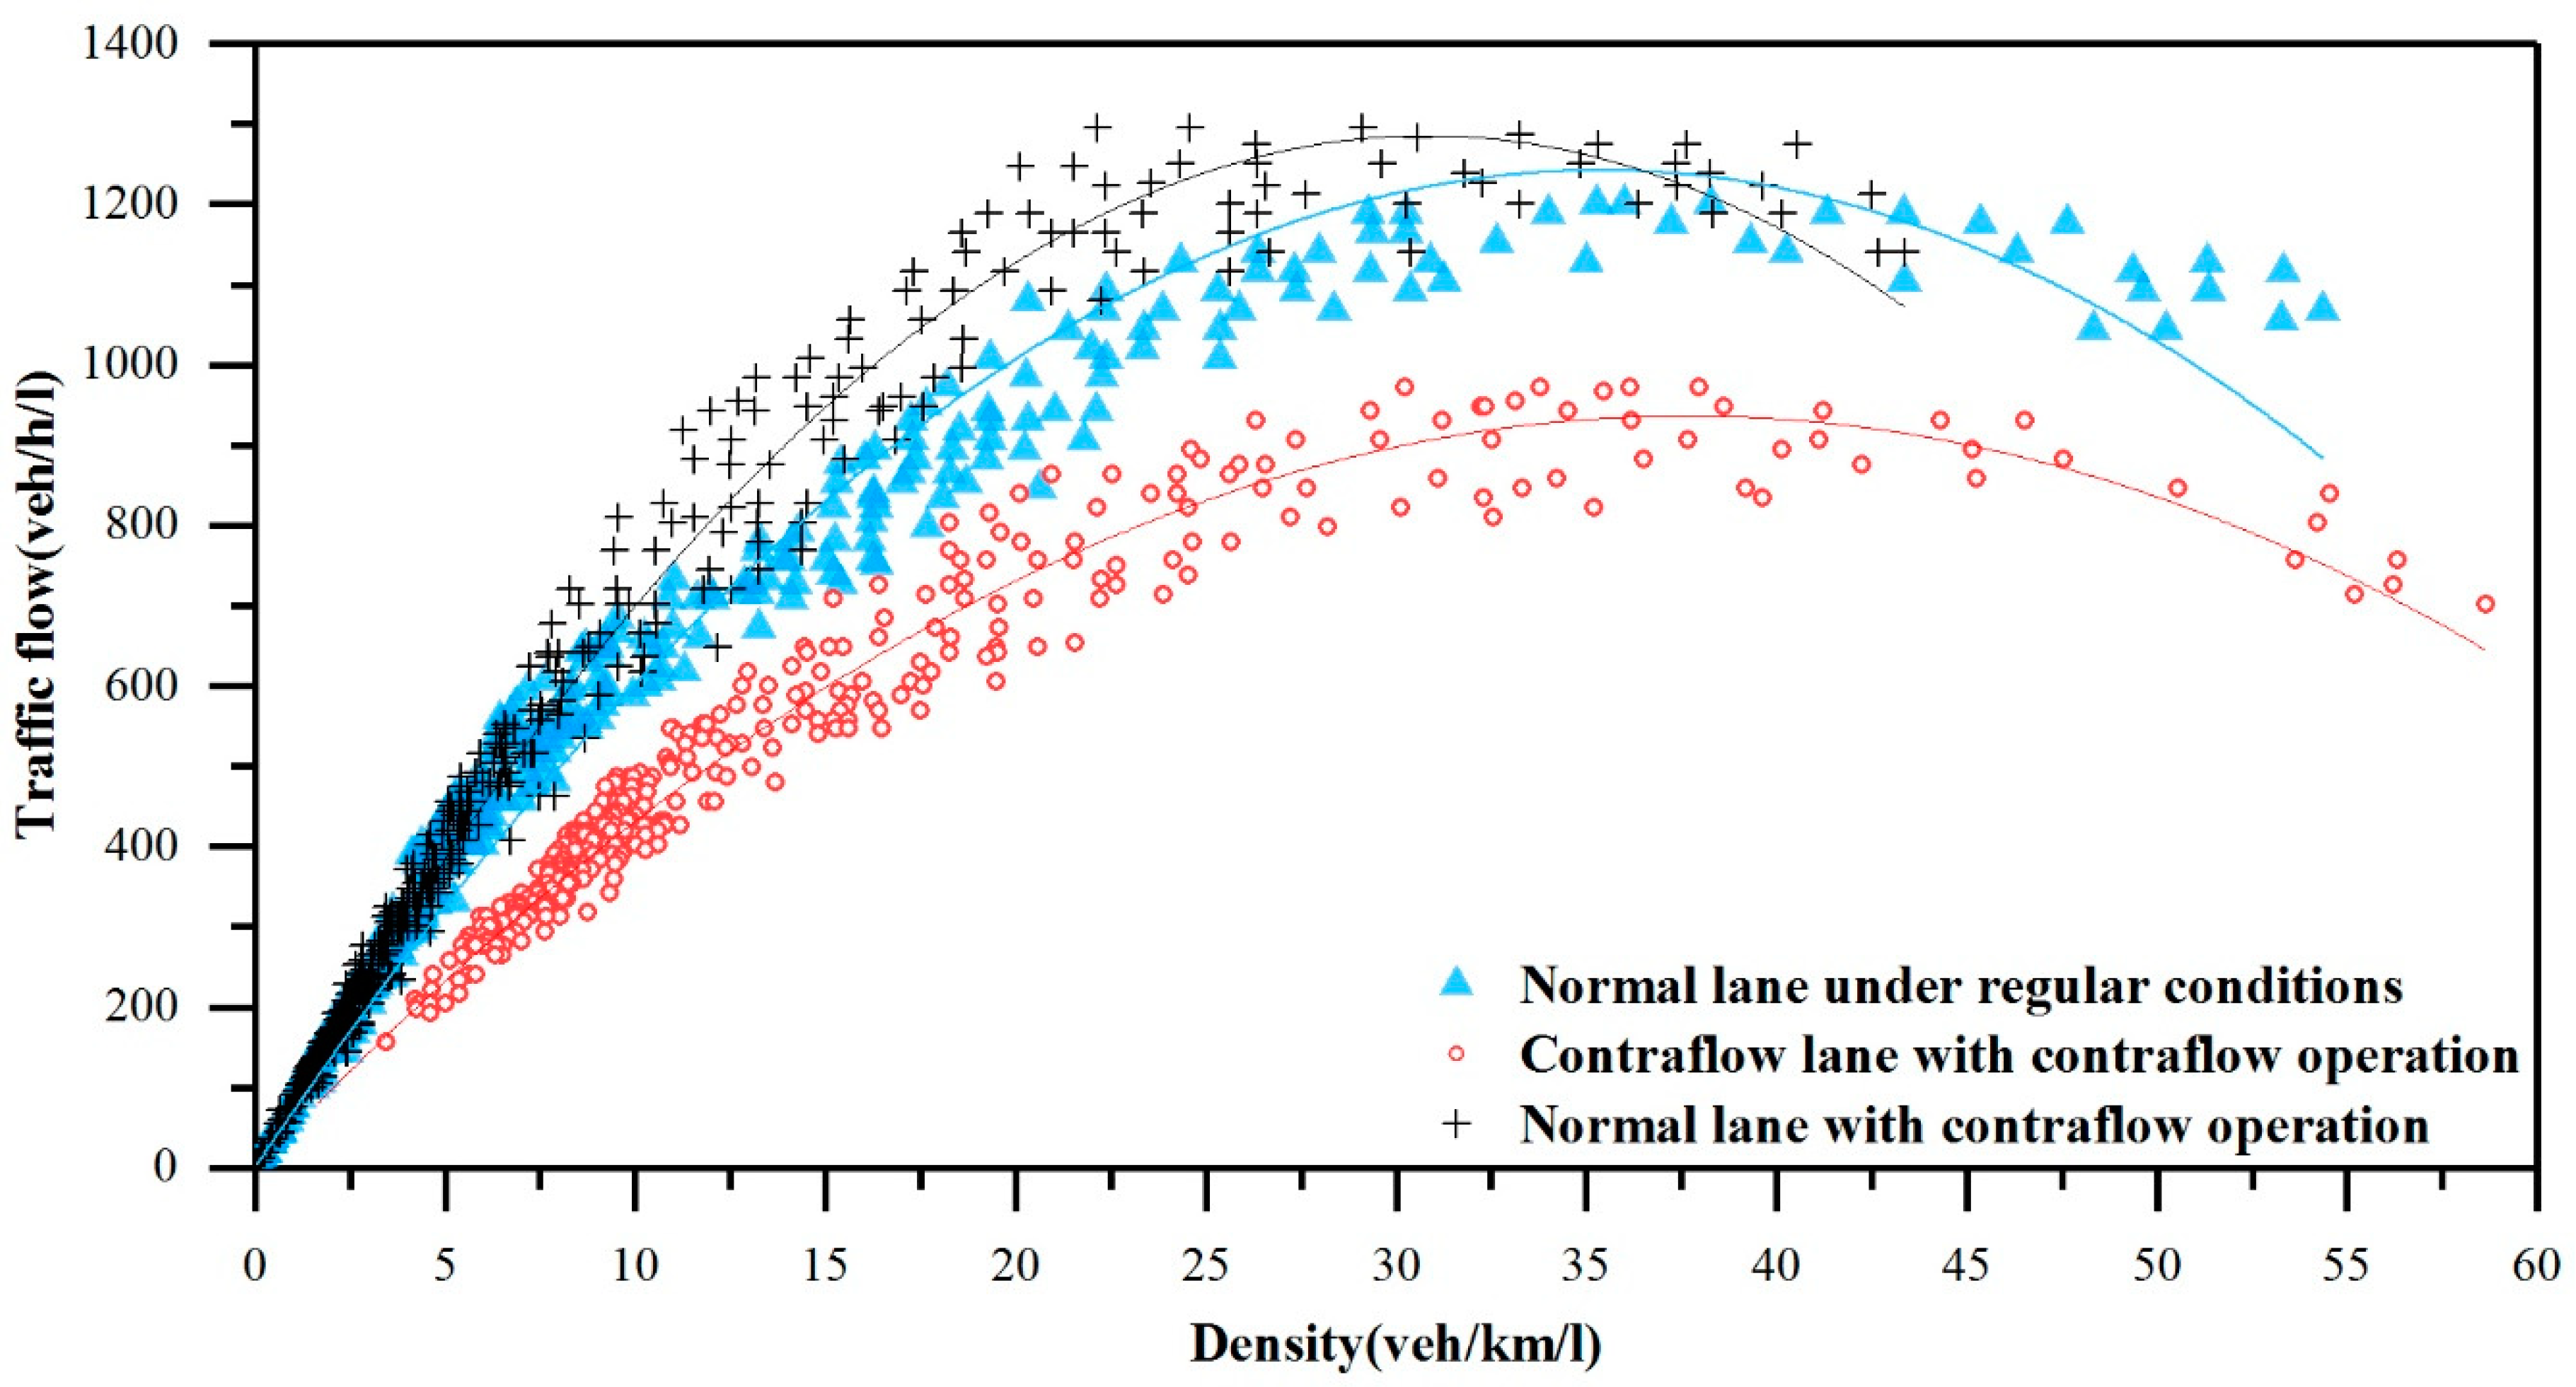
Figure 3 shows the traffic density data collected from the normal and contraflow lanes with and without the implementation of the contraflow strategy. The chart reveals a slight difference between the traffic densities of the normal lanes with and without contraflow. With increasing traffic flow, the density of the normal lanes was a little higher than that of the contraflow lane, which can be attributed to the haste of the drivers to get to their destinations. However, the difference between the flow densities of the normal and contraflow lanes was significant. The traffic flow of the normal lanes reached its maximum when the density was approximately 30 veh/km/L, while that of the contraflow lane was 40 veh/km/L. The reason for this may be the same as a previous observation, that the drivers on the contraflow lane were affected by those driving in the opposite direction, who were separated from them by only traffic cones, and in addition the unfamiliarity of driving in the reverse direction.
Since the overall capacity of the road sections without contraflow (the red segments in
Figure 1) were lower than that of the sections with contraflow, bottlenecks were created along the entire road. As also mentioned above, the “fixed bottlenecks” at the entries and exits of the contraflow lanes affected the capacity and speed of these lanes. The main reason for this was that the entries and exits of the contraflow lanes were usually across the highway median and were narrow, especially so for large vehicles. Most of the drivers entering a contraflow lane had to decelerate to a low speed and carefully navigate from the normal lane to the contraflow lane. This, as well as the merging flows with traffic in the normal lanes at the exits from the contraflow lanes, was a source of bottlenecks. Before arriving at the entry of a contraflow lane, a driver had to decide whether to enter the contraflow lane. This amounted to an internal interference and altered the driving behavior of the drivers. Furthermore, at the exit of a contraflow lane, a driver had to observe vehicles in the normal lane and look for an opening to merge, with the delay creating a local congestion, the magnitude of which increases with an increasing length of delay.
The fundamental solutions to reducing the fixed bottlenecks caused by the contraflow strategy are the adoption of moveable medians on the highway and completely removing them to make the contraflow lane more accessible, and in addition forbidding large vehicles from using the contraflow lane. In addition, traffic cones or other demarcation instruments can be used to separate vehicles in the left-most normal lane from those in the other normal lanes 150–200 m before the entry of the contraflow lane. Vehicles in the left-most lane could decide whether to turn left into the contraflow lane at an entry or continue straight along their normal lane, while vehicles on the other normal lanes can only continue on those lanes. This reduces diverging points and the associated bottlenecks from the other normal lanes, apart from the left-most one. A similar demarcation can be used on the normal lane about 150–200 m before the exit from a contraflow lane. This would keep the left-most normal lane empty at the exit and eliminate merging conflicts.
The part of the study discussed in this section considered the overall traffic capacity and speed to establish the characteristics of the entire flow of vehicles. However, it is noteworthy that the contraflow traffic on a four-lane dual highway is actually a single lane, which prevents overtaking. Considering that coaches typically move at a lower speed than those of passenger cars, they often cause the development of a long platoon of vehicles in their trail on a contraflow lane. This constitutes a “moving bottleneck.” The effect of this type of bottleneck was also examined in the present study, with the purpose of developing measures for enhancing the efficiency of the contraflow strategy for mass evacuation.
4. Effect of Moving Bottlenecks on the Contraflow Lane
During mass evacuation, the contraflow strategy is used to increase the outbound road capacity by reversing some or all of the inbound lanes. For a four-lane dual highway with only one lane reversed, the traffic efficiency is significantly decreased by the moving bottlenecks generated by slow-moving vehicles such as heavy trucks, coaches, and carefully driven passenger cars in the contraflow lane. To maintain the benefits of the contraflow lane, it is necessary to separate the slow-moving vehicles, or at least provide a means for the faster vehicles to overtake them. The effect of moving bottlenecks on a contraflow lane under different traffic conditions was examined in this study, as well as four possible methods for addressing the bottlenecks.
Most of the slow-moving vehicles on highways are trucks and coaches, which are larger and heavier than other vehicles. They were classified as slow-moving vehicles in this study, and passenger cars as fast-moving vehicles. The mixing rate of the slow-moving vehicles was obtained as their total number divided by the total number of all vehicles. During the field experiments, trucks were forbidden from driving on the Xihan Highway, and the collected data were thus for only coaches and passenger cars. Because the speed difference between coaches and passenger cars is usually lower than that between trucks and passenger cars, Vissim simulations were used to further consider trucks in the effect of moving bottlenecks in a contraflow lane.
4.1. Effect of Coach Moving Bottlenecks
Generally, car-following is defined as the state in which the time headway between adjacent vehicles is less than 4.8 s, while free driving is when it is greater than 4.8 s [
19]. Ohta [
20], Van et al. [
21], and Taieb-Maimon et al. [
22] reported that the time headway is roughly the same for different driving speeds. Puan et al. [
23] argued that vehicle drivers along a single lane do not have to worry about being overtaken, and some would thus follow the vehicle ahead at a relatively long distance, which is considered a “weak car-following state.” In addition, adjacent vehicles within a time headway of 5 s are regarded as forming a same-vehicle platoon. Therefore, in this study, vehicle platoons within a time headway of 5 s in the original traffic data were examined, and platoons containing more than three vehicles were selected. As mentioned before, trucks were forbidden from the Xihan Highway during the experiment, so the traffic flow was mainly composed of coaches and passenger cars. The selected platoons were divided into coach platoons and passenger car platoons.
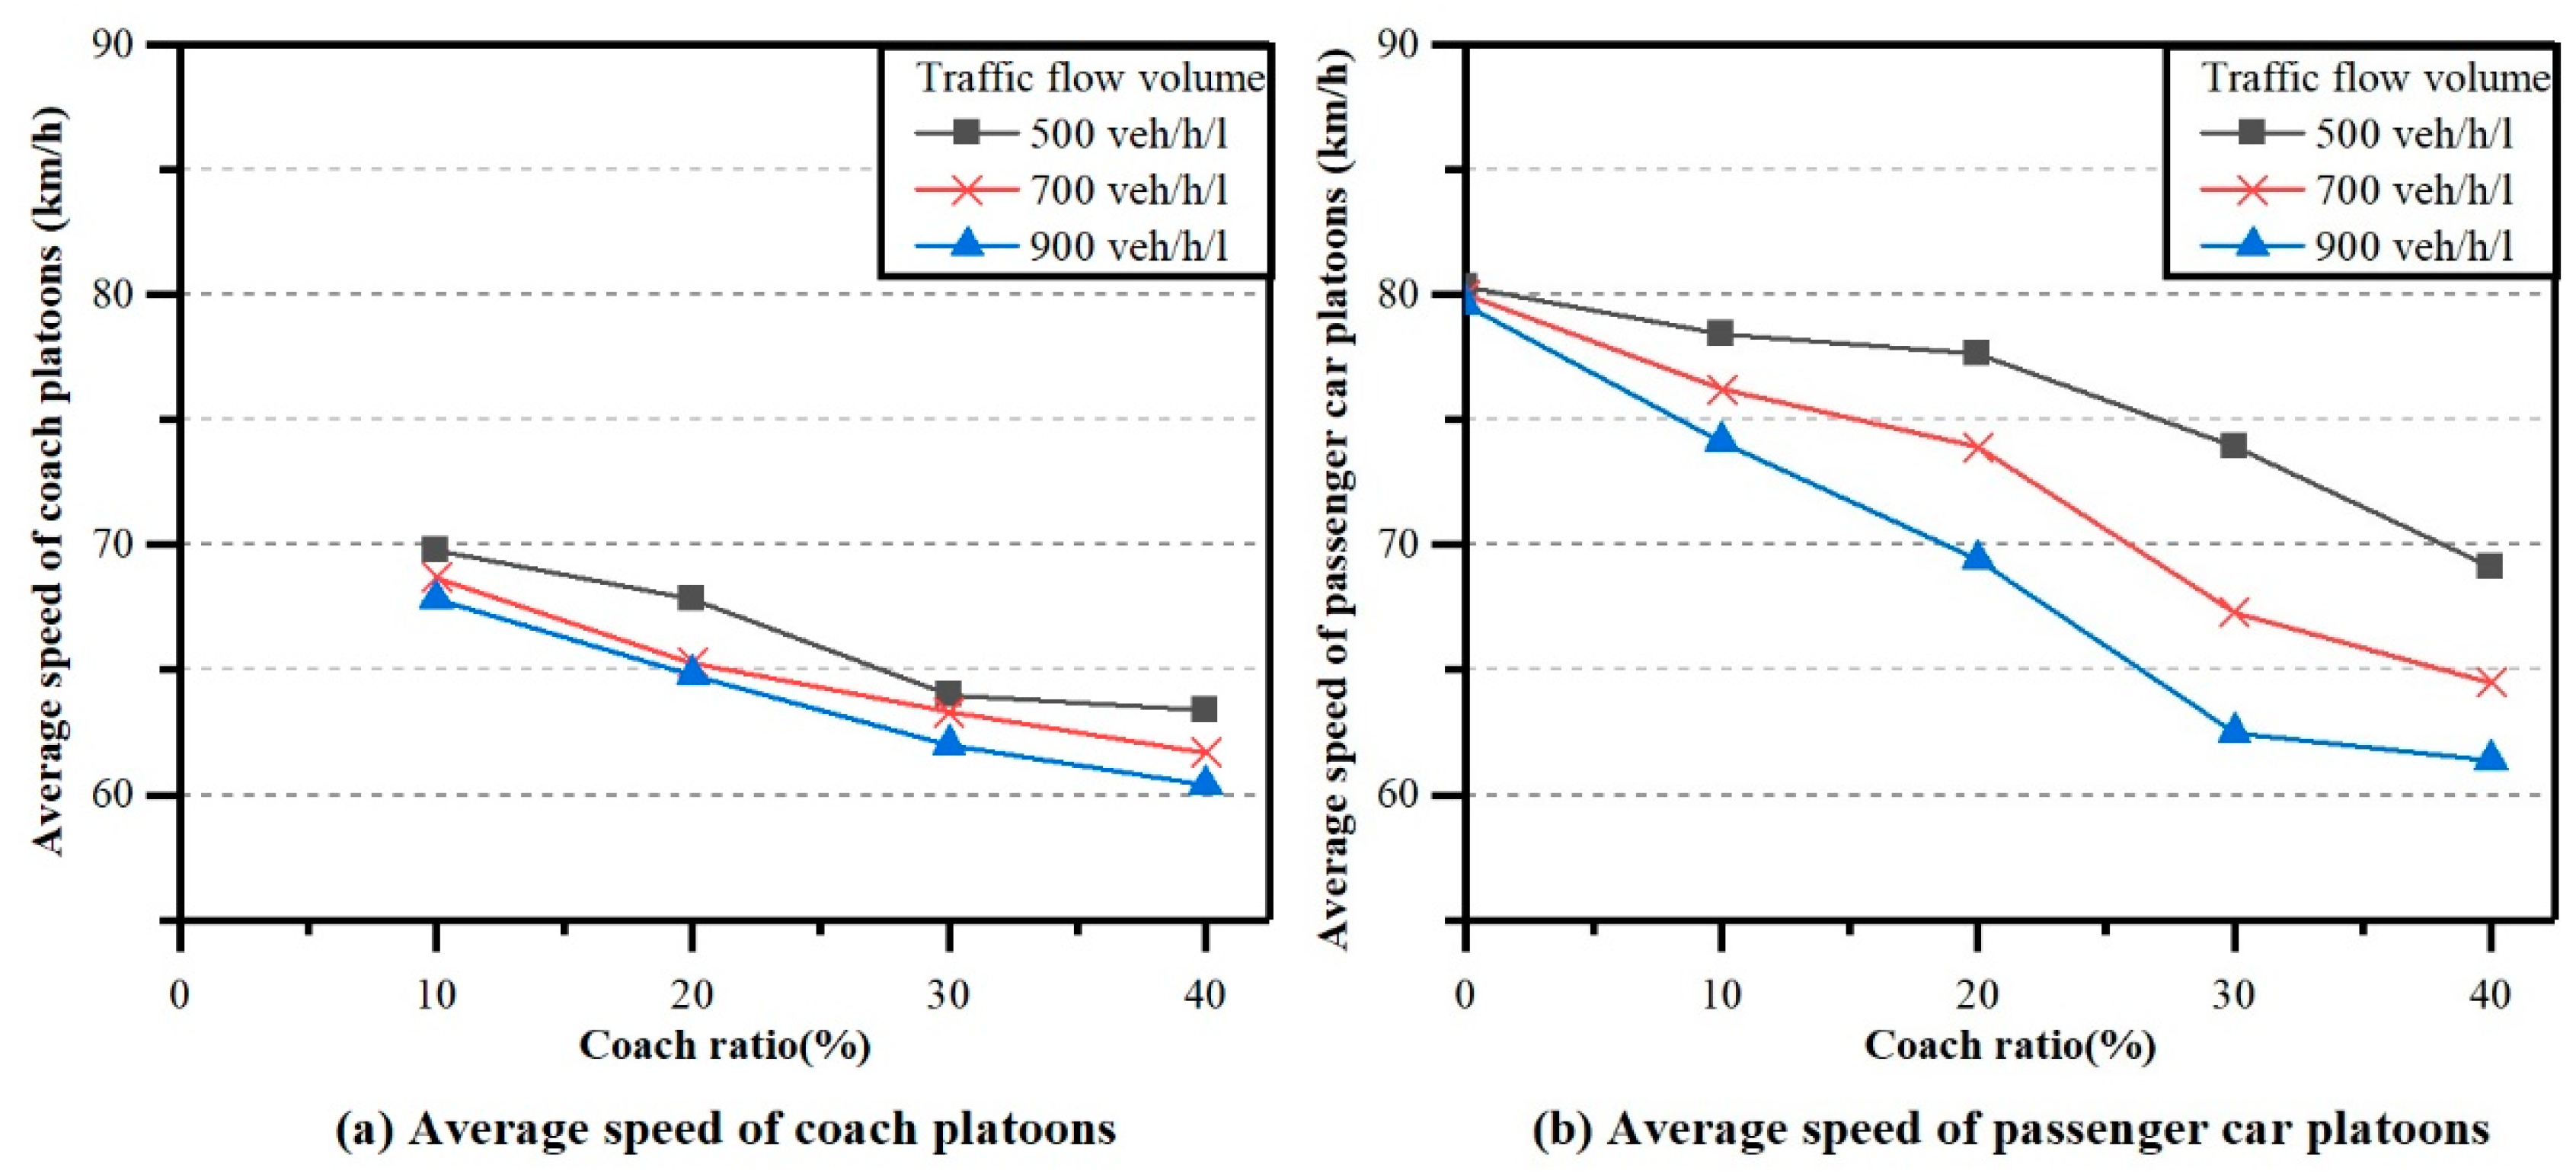
Figure 4 shows the average speed trends of the coach and passenger car platoons with respect to the traffic flow volume. It appeared that the speeds of both platoon types decreased with an increasing coach ratio, where the decrease was initially rapid and then becoming gentle. This is attributable to the significant negative effect of the moving bottlenecks on the speed of the entire traffic, which is reduced to the speed of the coaches. With an increasing coach ratio, the probability of vehicles being stuck in platoons increases, and the platoons are likely to be longer, resulting in drivers accelerating and braking more frequently. For coach platoons, the decreased speeds under traffic volumes of 500 and 700 veh/h/L were 11.23 and 18.20 km/h, respectively, indicating that the moving bottlenecks have a greater effect under a larger traffic volume. The speed change of the passenger car platoons also supported this deduction. Furthermore, the speed variation under 900 veh/h/L indicated that the effect was limited when the coach ratio and traffic volume were sufficiently large. This is possibly because, under such a condition, all the platoons are linked together end-to-end, resulting in a convergence effect. It can be inferred that a continuously increasing coach ratio for the same traffic volume causes the speed of the coach platoons to approach that of the passenger car platoons.
A comparison of the coach and passenger car platoons revealed that the speed of the former was usually 5–10 km/h lower than that of the latter. This is consistent with the comparative performances of coaches and passenger cars. However, because the dynamic performance and speed differences between trucks and passenger cars are much larger, it was necessary to further examine the effect of moving bottlenecks caused by trucks in a contraflow lane.
4.2. Effect of Truck Moving Bottlenecks
Vissim is a microscopic simulation tool developed from a substantial amount of real traffic data and is used for the estimation of traffic parameters such as vehicle speed, travel delay, and lane-changing times. Vissim simulations were used in this study to examine different scenarios to determine the effect of truck moving bottlenecks and examine the effectiveness of various traffic schemes.
4.2.1. Development and Calibration of the Vissim Model
To achieve realistic simulations and enable comparison, the Vissim model was developed using the results of the present Xihan Highway field experiments under regular and contraflow conditions. The road, vehicle, traffic input, driver models, and simulation cycles were developed, and the parameters of each model were reset and corrected.
Road model: The geographical map of the area of the experimental road was first imported into Vissim, and a dual four-lane highway with a contraflow lane was created. The width of each lane was 3.5 m and the length of the contraflow lane was 13.3 km.
Vehicle model: Based on the traffic data obtained from the field experiments, three passenger car models were built, measuring 4.0 × 2.0, 4.2 × 2.0, and 4.4 × 2.0 m, respectively. According to the 2-year statistics obtained by the highway toll station, two truck models were also built, and their technical parameters used in Vissim are listed in
Table 2.
Traffic input model: Different schemes were developed using five different truck ratios (0%, 10%, 20%, 30%, and 40%) and three traffic flow volumes (2000, 2500, and 3000 veh/h). It should be noted that the traffic flow volume was measured using the passenger car equivalence. The average speed with contraflow was considered as the effectiveness measure of the scheme.
Driver model: The expected speeds of the passenger cars and trucks were 50–80 and 40–70 km/h, respectively. The stopping distance (CC0), time headway (CC1), car-following variable (CC2), threshold distance of the car-following state (CC3), threshold distance of the positive/negative car-following state (CC4/CC5), and the number of observed vehicles were tested by sensitivity analysis of the traffic data obtained from the Vissim simulations. The results showed that only CC0, CC1, and CC2 impacted the Vissim simulations. The other parameters of the driver model were thus set to the system default values. To determine the optimal combination of CC0, CC1, and CC2, a multifactor orthogonal test was conducted to identify the factor level that produced the minimum difference between the Vissim simulations and the field experiments. Based on the result of the test, CC0, CC1, and CC2 were set to 1.5 m, 1.2 s/vehicle, and 4 m, respectively.
Simulation cycle: Four traffic scenarios with truck control and contraflow were examined to minimize the effect of truck moving bottlenecks. Each scenario, with its traffic flow volume, truck ratio, and traffic scheme was simulated five times and the observed parameters were averaged. In total, 300 simulations were conducted. Since the traffic flow required some time to stabilize after a simulation was commenced, only the simulation cycles between 600 and 4200 s were collected to ensure reliability.
The four considered truck control traffic schemes were as follows:
No Restriction (NR)
Trucks were allowed to drive on any lane, including the contraflow lane.
No Trucks (NT)
Trucks were forbidden from the highway.
No Trucks in the Contraflow Lane (NC)
Trucks were forbidden from crossing the median and entering the contraflow lane. This was because their size and weight made lane changing and passing through the median difficult. This scheme was aimed at saving travel time and increasing the overall traffic flow speed.
Truck Lane (TL)
The right-most normal lane was designated as the TL and used by only trucks, and trucks could only travel on this lane. This eliminated interweaving between passenger cars and trucks and significantly reduced the number of vehicle platoons.
The calibration of the Vissim simulation model was assessed by the Geoffrey E. Havers (GEH) statistic to compare the difference between the simulations and field experiments. The GEH statistic value for the calibration of simulation models should be <5 for at least 85% of the volume check points. Following is the employed formula, which is similar to that of a chi-squared test [
5]:
where
M is the traffic count volume obtained from the simulation model, and
C is the real-world traffic count volume.
All the GEH statistic values were determined to be less than 5, indicating that the simulation model satisfied the calibration requirements.
4.2.2. Vissim Simulation Results and Discussions
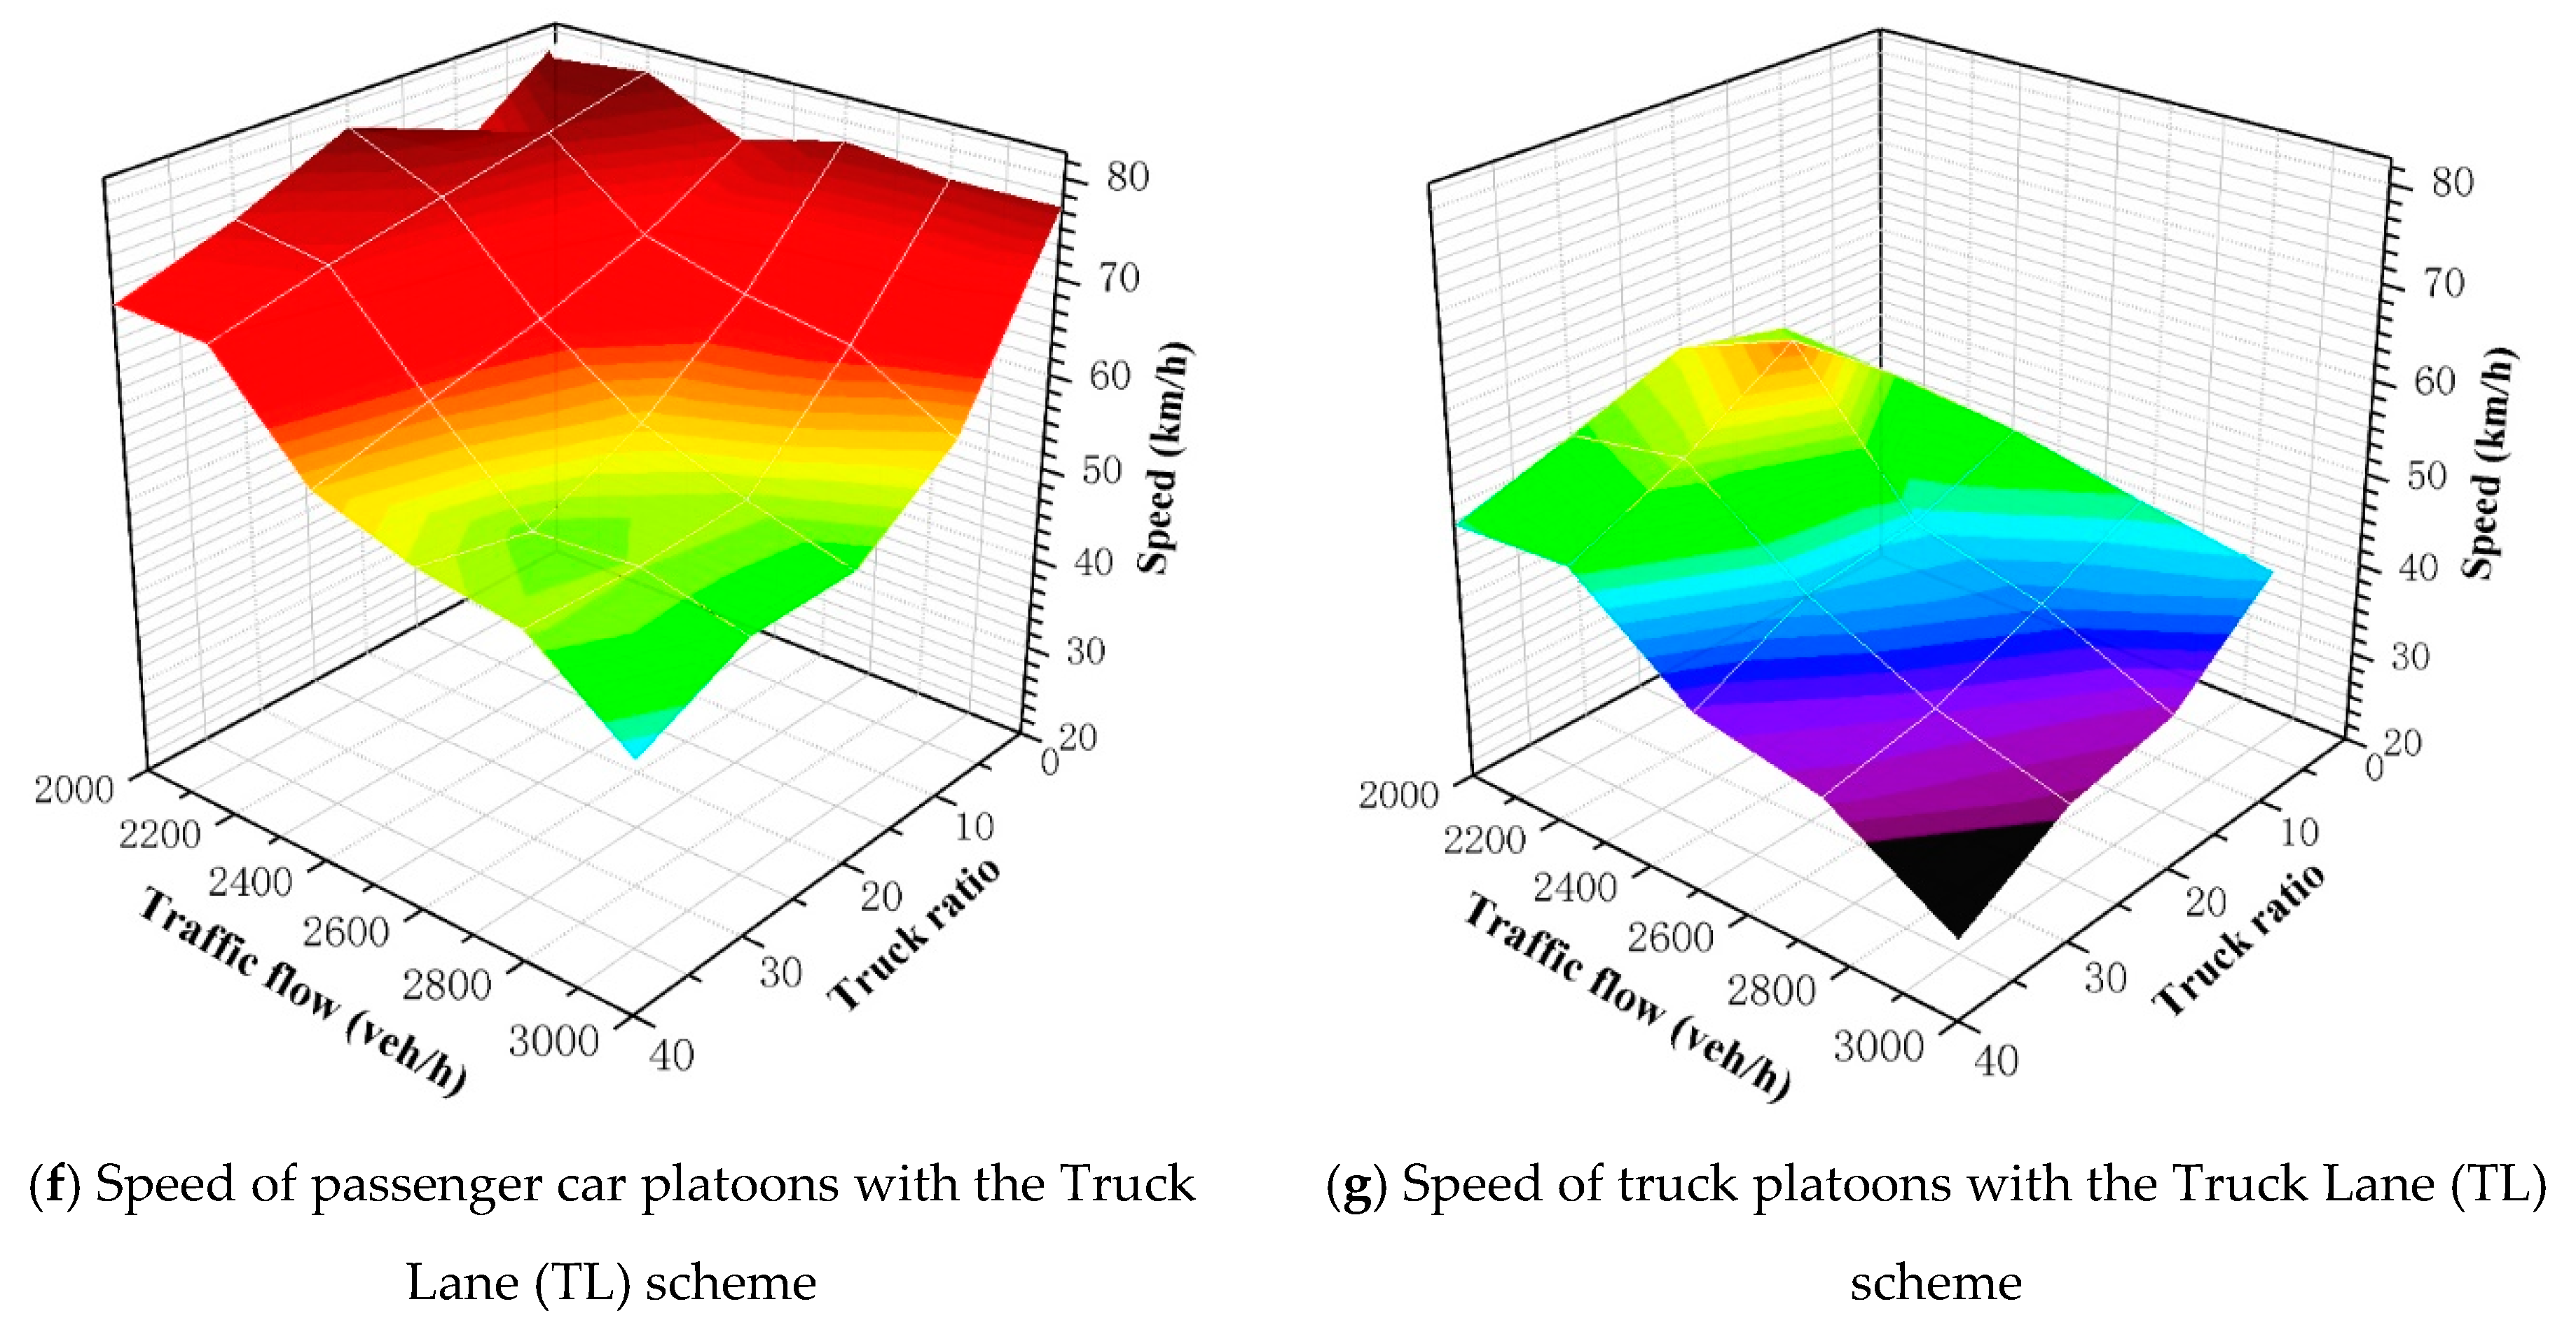
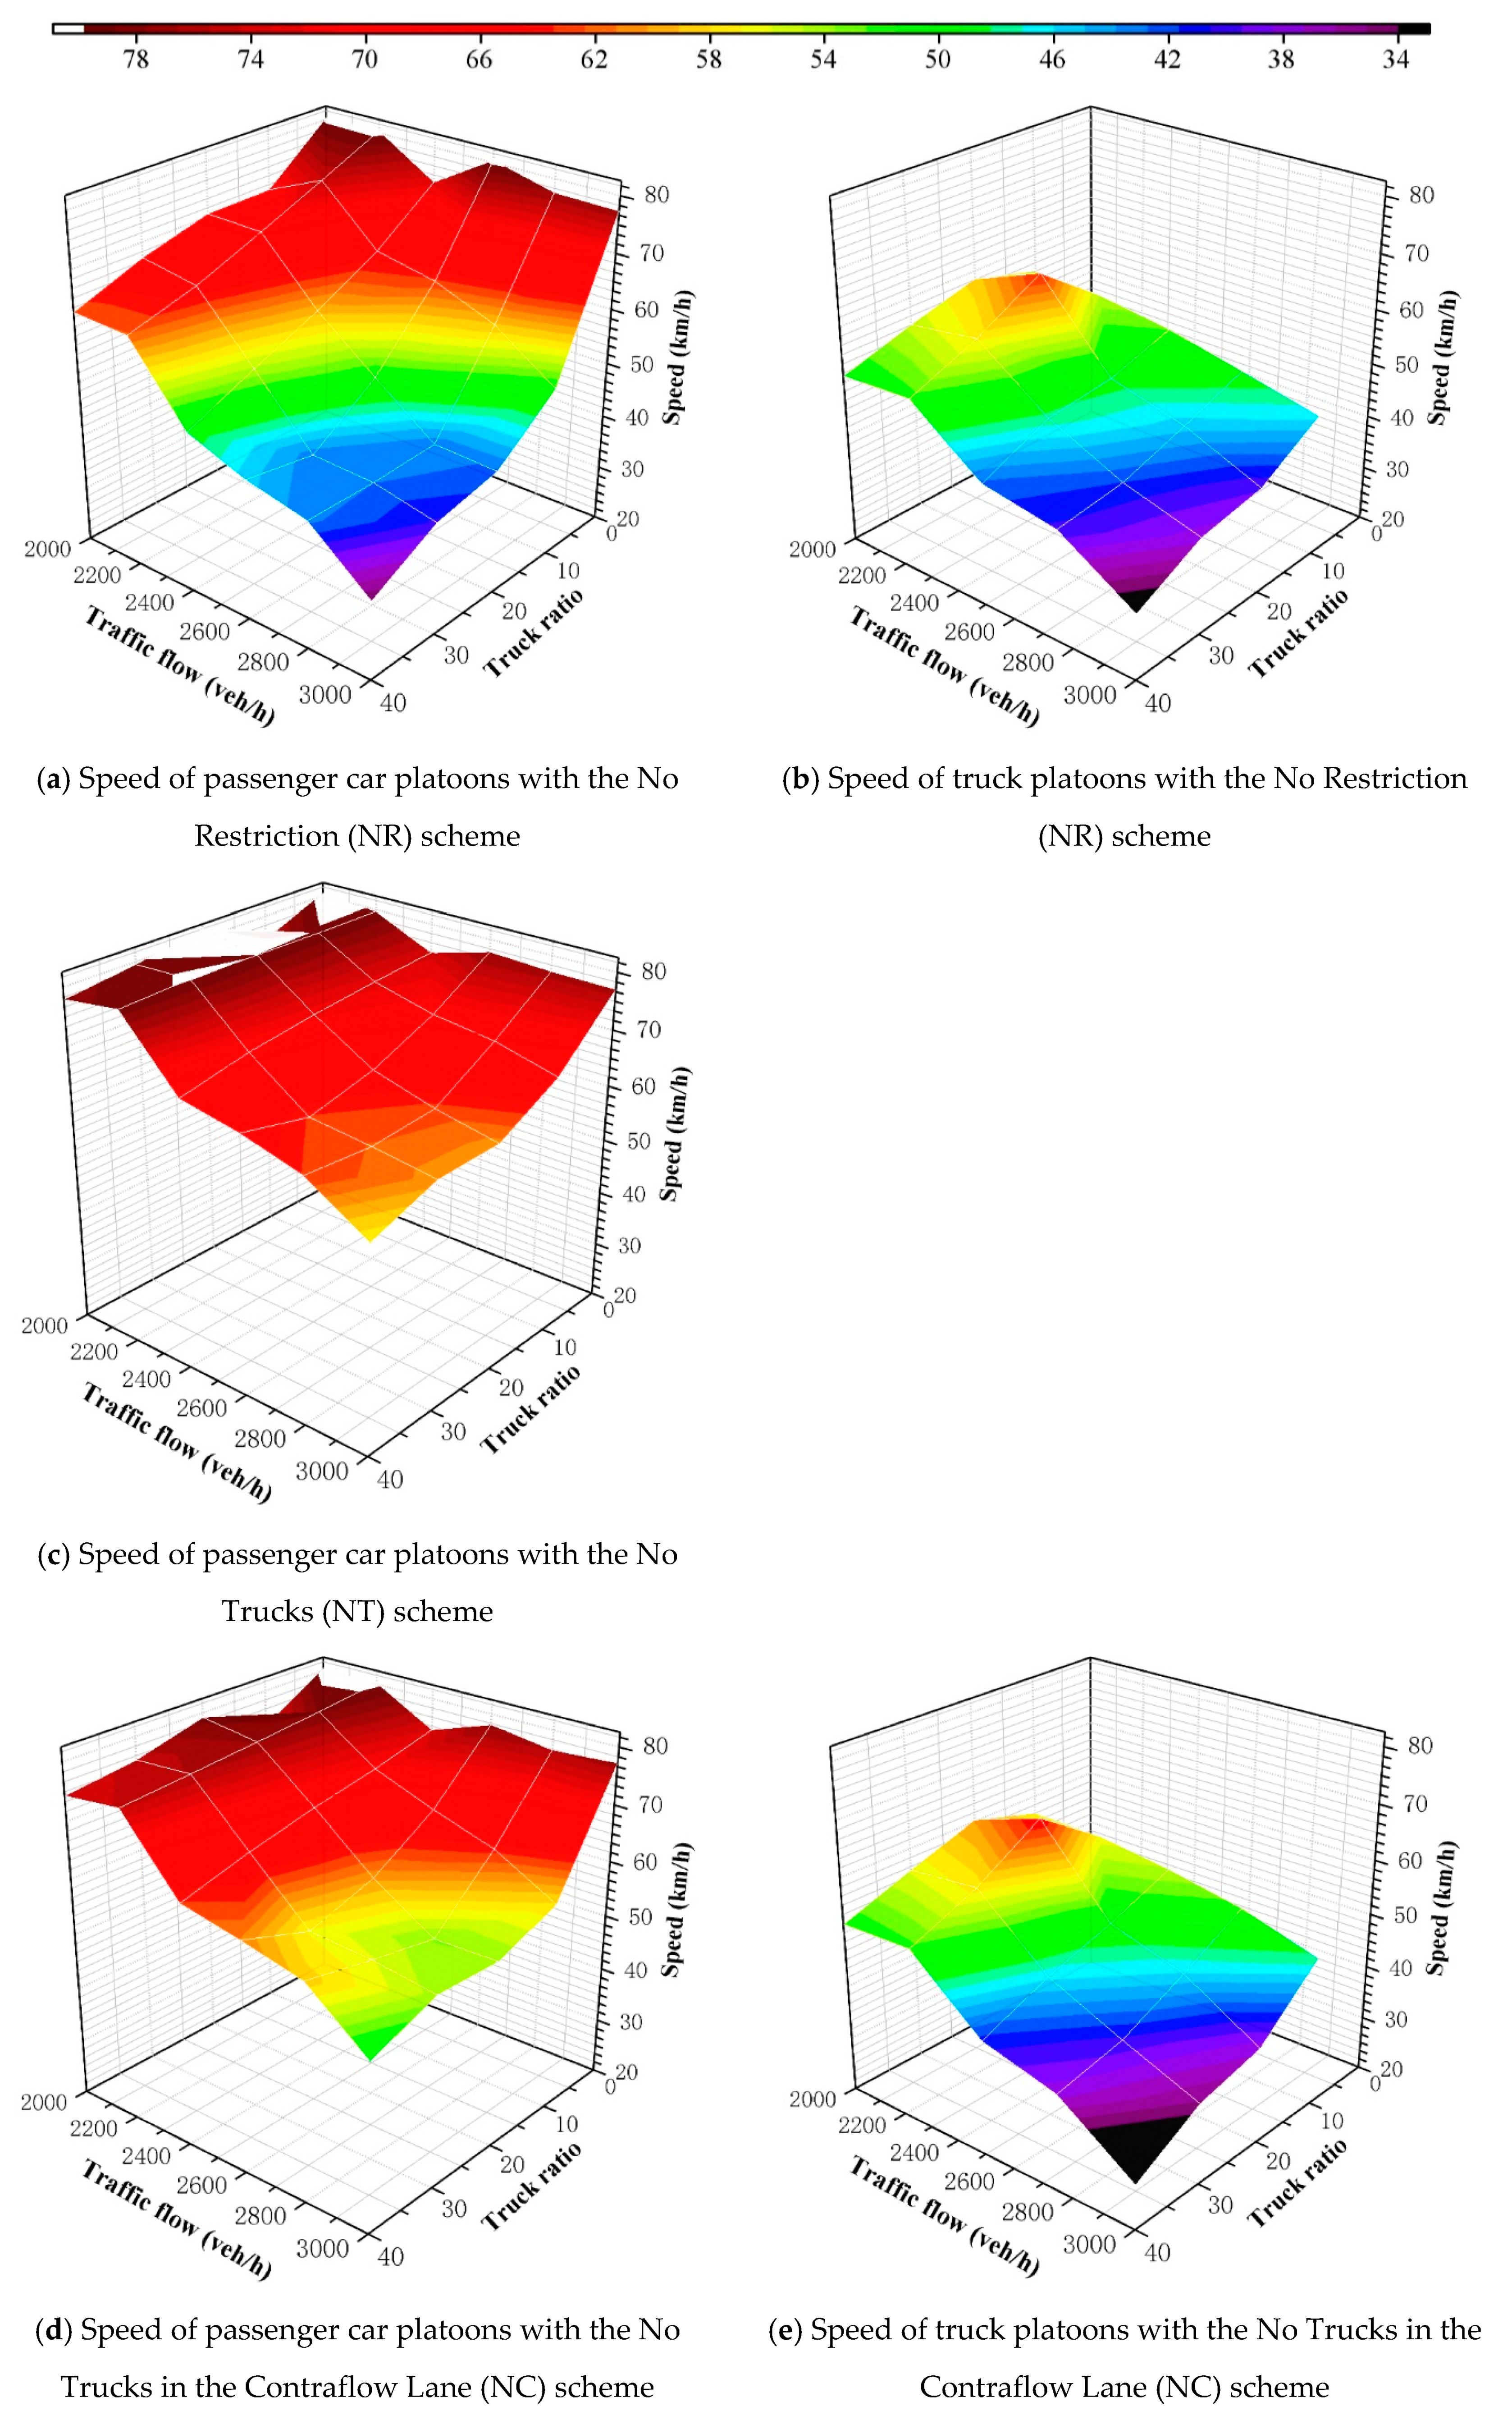
The determined average speeds of the passenger car and truck platoons in each scenario are summarized in
Figure 5. The truck ratio significantly impacted the effectiveness of the traffic flow, particularly for the passenger car platoons. With an increasing truck ratio and traffic volume, the average speed of the passenger car platoons reduced sharply to the average speed of the truck platoons. In the NR scenario, each 10% increase in the truck ratio decreased the average speed of the passenger car and truck platoons by 20–30 and 10–20 km/h, respectively. In other words, in the event of an emergency, a high truck ratio would substantially reduce the benefit of the contraflow strategy, posing a high risk to evacuees. Another possible reason for this was that the trucks needed to slow down to much slower speeds of 10–20 km/h to cross the highway median at the entry and exit from the contraflow lane. Moreover, faster vehicles in the normal lanes had opportunities to overtake slower vehicle platoons. However, when the road was saturated and the truck ratio was high, faster vehicles could not overtake slower ones, and this prevented their improvement to the traffic flow.
The NT, NC, and TL schemes were also found to improve the traffic under contraflow conditions, including a significant improvement of the passenger car platoon flow. However, they had little effect on the performance of the truck platoons, and even sometimes decreased their speed. Among the NT, NC, and TL schemes, the first maintained the fast movement of passenger cars. For example, for a traffic flow of 300 veh/h and truck ratio of 40%, the passenger car platoons could still maintain at least 60 km/h under the NT scheme. This also highlights the benefit of a contraflow lane for improving outbound road capacity when coaches and trucks are forbidden from it. The bottlenecks created by coaches and trucks are the reason why the benefit of using a highway contraflow strategy is often much less than expected in practice. Independent sample t-tests of the speeds of the passenger car platoons under different traffic volumes and truck ratios with contraflow revealed a significant difference between the passenger car platoon speeds for the NR and NT schemes for (1) a truck ratio of 20–40% and traffic volume of >2500 veh/h, and (2) a truck ratio of >40% (p < 0.05). Thus, when there is more than one evacuation route, a combination of contraflow with the NT scheme and the redirection of trucks to alternative routes is recommended for substantially higher traffic flow.
Furthermore, when the traffic flow and truck ratio were small, the NC scheme was found to have a better effect on the passenger car platoons when compared with the TL scheme. Otherwise, the TL scheme was better. The main difference between the NC and TL schemes was in the possibility of passenger cars to overtake slower vehicles on the normal lanes. Under the former, passenger cars and trucks could both drive in normal lanes, whereas the latter restricted them to the left and right lanes, respectively. For small traffic flows and truck ratios in the NC scheme, passenger cars could both use the contraflow lane and overtake slow vehicles on the normal lanes, whereas the TL scheme prevented overtaking and constrained passenger cars to car following, while also preventing full utilization of the road. With an increasing traffic volume and truck ratio, passenger cars in the NC scheme found it more difficult to overtake, resulting in reduced mixed-traffic flow. This is representative of when the TL scheme is more beneficial, with the lane separation of passenger cars and trucks allowing each to maintain relatively high speeds. In addition, the truck lane is more utilized by the increased number of trucks.
Because the speed limit of the present test highway is 80 km/h, the selected traffic scheme should allow passenger cars to reach at least 60 km/h as much as possible. In other words, the NR scheme should be adopted when the average speed of passenger car platoons is ≥60 km/h.
Table 3 summarizes the results of the Vissim simulations and the order of recommendation of the considered traffic schemes.
In the case of a dual highway with more than four lanes, overtaking sections could be set at regular intervals on the contraflow side to alleviate the problem of moving bottlenecks. There are, however, several factors that should be considered in using this method, such as the arrangement of the intervals, the length of the overtaking section, and the effectiveness of the method. The present study focused on a four-lane dual highway and the effectiveness of this method was not examined.
It is noteworthy that no road accident occurred during the present field experiments. In the use of the contraflow strategy, special measures are required to prevent secondary accidents and reduce the effect of a crash. It should first be noted that most accidents that occur during contraflow are relatively minor, such as fender benders, scrapes, and side mirror rips. These types of small accidents are usually easily handled and can be solved rapidly. Second, if a serious accident that cannot be handled within a short time occurs, a new fixed bottleneck would be generated. In addition to regular measures, the road shoulder could be considered for temporary use by other vehicles to pass through. In the normal lanes, traffic cones and temporary road signs could be used to quickly guide drivers through the right shoulder. On the contraflow side, the inbound traffic can be directed through the right shoulder, while the contraflow traffic could use a short distance of the inbound lane to go around the accident.
5. Conclusions
There has been a constant increase in the number of global disasters, together with the threat that they pose to life and property. The contraflow road traffic strategy is widely used to deal with the resultant emergencies and evacuate large numbers of people from affected areas. Most previous studies on the strategy have focused on route selection, evacuation time, and evacuation volume on a macroscopic level, with only a few considering the traffic characteristics and associated moving bottlenecks on a microscopic level. To address the gap in the literature and provide emergency decision makers with better theoretical and empirical support, field experiments and Vissim simulations of the contraflow strategy were conducted in the present study. Real traffic data were collected from the Xihan Highway and used to examine the traffic characteristics (road capacity and flow speed) under both contraflow and regular conditions. It was found that the road capacity of the normal lanes under contraflow conditions was similar to that under regular conditions. However, the road capacity of the contraflow lane was lower than that of the normal lanes. This was due to the creation of fixed bottlenecks at the narrow entry and exit across the median into the contraflow lane and uneasiness of the drivers due to the unfamiliar driving environment, including the reversed traffic signs along the road. The speed variations of normal and contraflow lanes with increasing traffic volume were studied. In addition, the effect of the fixed bottlenecks on the capacity and speed of the contraflow were also analyzed, and improvement measures were suggested.
To further assess the problems of the contraflow strategy, the effects of moving bottlenecks caused by coaches and trucks were examined. It was found that an increase in the coach ratio might decrease the effect of the contraflow lane, while an increase in traffic volume initially increased the moving bottleneck problem, which subsequently disappeared. Because the difference between the dynamic performances and speeds of trucks and passenger cars are much larger, the effect of the moving bottlenecks caused by trucks on the contraflow lane was further examined by Vissim simulations. Trucks were found to significantly reduce the average traffic flow speed. To address this issue, special additional schemes such as “No Trucks”, “No Trucks in the Contraflow Lane”, and “Truck Lane” were proposed. Among these, the “No Trucks” scheme was observed to be the most effective, enabling passenger cars to move at above 60 km/h when there are alterative truck routes. When the traffic flow and truck ratio are small, the “No Trucks in the Contraflow Lane”scheme increases the benefit of the contraflow strategy, whereas the “Truck Lane” scheme is better when the traffic flow and truck ratio are large. This was explained by the better road utilization enabled by the allowance for faster vehicles to overtake slower ones and the lane separation of different vehicle types.
The results of this study substantially contribute to the knowledge of highway traffic characteristics when using the contraflow strategy under both regular and emergency conditions. These findings can assist decision makers in evaluating the effectiveness of contraflow lanes for mass evacuation and provide a basis for optimizing the contraflow strategy using special schemes for reducing the negative impact of moving bottlenecks. However, considering that the field experiments and Vissim simulations did not consider driver behaviors under real emergency conditions, the results might represent an underestimation or overestimation within a certain range. It should also be noted that the Xihan Highway, on which the field experiments were conducted, has a speed limit of 80 km/h, which may have influenced the results, together with the specific conditions of the road. Further study is planned to consider the effect of setting overtaking sections for the contraflow traffic using sections of the inbound lanes on highways with more than two lanes in each direction. Attempts may also be made to consider the limitations on rational decision-making by drivers under serious emergency conditions.


