Featured Application
The potential applications of the developed materials are in the field of the protection of electronic devices from electromagnetic interferences. Moreover, the proven possibility to use additive manufacturing widely extends the complexity of the geometries.
Abstract
Acrylonitrile–butadiene–styrene (ABS) filled with 6 wt.% of multi-walled carbon nanotubes and graphene nanoplatelets was extruded in filaments and additively manufactured via fused deposition modeling (FDM). The electrical conductivity and electromagnetic interference shielding efficiency (EMI SE) in the frequency range between 8.2 and 12.4 GHz of the resulting 3D samples were assessed. For comparison purposes, compression molded samples of the same composition were investigated. Electrical conductivity of about 10−4 S·cm−1 and attenuations of the incident EM wave near 99.9% were achieved for the 3D components loaded with multi-walled carbon nanotubes, almost similar to the correspondent compression molded samples. Transmission electron microscopy (TEM) images of ABS composite filaments show that graphene nanoplatelets were oriented along the polymer flow whereas multi-walled carbon nanotubes were randomly distributed after the extrusion process. The electrical conductivity and electromagnetic interference (EMI) shielding properties of compression molded and FDM manufactured samples were compared and discussed in terms of type of fillers and processing parameters adopted in the FDM process, such as building directions and printing patterns. In view of the experimental findings, the role of the FDM processing parameters were found to play a major role in the development of components with enhanced EMI shielding efficiency.
1. Introduction
The term “electromagnetic interference” (EMI) refers to an unwanted disturbance occurring in electronic instruments and devices. Technological problems attributed to EMI date back to the 1930s [1], however, in the modern digital era, due to the extensive global development of novel electronic and telecommunications technologies, EMI has become a major concern [2]. In Europe, a directive destined to the electrical and electronic engineering industries regulating the electromagnetic compatibility (EMC) was released in 2014. The aim is to assure that electro-electronic apparatuses do not cause, or are not affected by EMI [3].
Consequently, there is the need to develop effective and practical EMI shielding materials specifically designed for such applications [4]. In recent years, considerable research efforts have been conducted for the development of novel electrically conductive polymer composites with enhanced EMI shielding efficiency. When compared to traditional metallic materials, polymer composites have the advantage of lightness, ease of processing/shaping, and of not suffering from corrosion processes. Various polymer composite formulations, i.e., different filler types and polymer matrixes, as well as mechanisms towards electromagnetic attenuation have been recently reviewed [5,6,7,8]. The most common processing routes for the development of electrically conductive polymer composites for EMI shielding applications are solvent casting [9,10,11,12] and melt-mixing followed by compression-molding [13,14,15,16]. Nevertheless, solvent casting remains limited to lab-scale. Moreover, it is sometimes difficult to shape polymer composites into complex forms via solvent casting or compression molding.
Recent advances in additive manufacturing (AM) technologies have opened new possibilities for rapid prototyping of electrically conductive polymer composites for EMI shielding [17]. The so-called fused deposition modeling appears as an emerging technology that is considered as one of the most common techniques for rapid prototyping of polymeric components. In fused deposition modeling (FDM), 3D manufactured components are grown layer-by-layer from polymeric filaments [18,19]. On the other hand, obtaining extruded filaments of electrically conductive polymer composites suitable for FDM is not a simple task. In fact, modifications of the rheological behavior due to the addition of fillers may complicate the extrusion process of the filaments and the subsequent FDM step [19]. Nevertheless, the successful preparation of electrically conductive filaments filled with carbon nanotubes (CNT) and their use for producing electrically conductive samples by FDM has been recently reported [20].
In this manuscript, acrylonitrile–butadiene–styrene copolymer filled with graphene nanoplatelets (GNP) or multi-walled CNT at a fixed weight fraction of 6 wt.% was extruded in filaments and rapid prototyped via fused deposition modeling. It is important to notice that the concentration of 6 wt.% was carefully chosen based on previous studies [20,21]. In fact, the comparison between graphene and carbon nanotube composites indicated that a filler content of 6 wt.% is a good compromise to maintain an acceptable processability and to obtain positive effects on the physical properties of acrylonitrile–butadiene–styrene (ABS) composites [21]; additionally, ABS/CNT at 6 wt.% of loading has been successfully used in FDM [20]. In this new research, the EMI shielding efficiency of 3D manufactured components of ABS/GNP and ABS/CNT was also compared to that of compression-molded samples. Moreover, the role of the FDM printing patterns on the electrical and EMI shielding properties was also investigated.
2. Materials and Methods
2.1. Materials
The matrix was an acrylonitrile–butadiene–styrene copolymer (ABS, trade name Sinkral®F322) from Versalis S.p.A (Mantova, Italy) with a density of 1.04 /g/cm3.
The following nanofillers were selected:
- Multi-walled carbon nanotubes (MWCNT, NanocylTM NC7000, Belgium) with surface area of 250 to 300 m2·g−1; density of 2.15 ± 0.03 g·cm−3; carbon purity of 90%; average diameter and length of 9.5 nm and 1.5 μm, respectively;
- graphene nanoplatelets (xGnP, type M-5, East Lansing, MI, USA) with surface area of 120 to 150 m2·g−1; density of 2.06 ± 0.03 g·cm−3]; carbon purity of 99.5%; average particle diameter of 5 μm and particle thickness of 6 to 8 nm [20,22].
2.2. Preparation of the Polymer Composites
Figure 1 details the various experimental procedures for sample fabrication, starting from melt compounding of ABS and carbonaceous fillers followed by compression molding, filament extrusion and FDM prototyping. The various testing techniques used in the work are indicated in Figure 1.
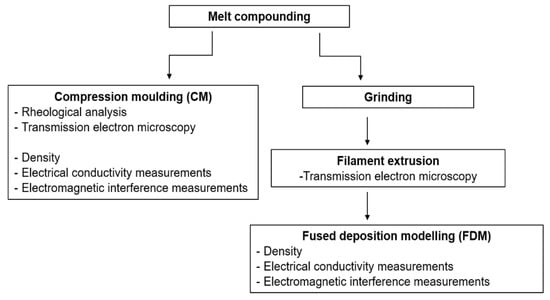
Figure 1.
Figure 1. Scheme of the manufacturing processes and characterization tests.
2.2.1. Compounding
A fixed weight fraction of 6 wt.% of MWCNT and xGnP was melt compounded with ABS using an internal mixer (Thermo Scientific HaakeTM, PolylabTM Rheomix). The temperature in the mixing chamber was 190 °C, the rotor speed was 90 rpm and the mixing time was 15 min. For a comparison, the ABS matrix was processed under similar conditions. The polymer composites are hereafter labeled as follows: ABS for the neat polymer, ABS/GNP and ABS/CNT for the composites loaded with xGnP and MWCNT, respectively. After compounding, the resulting materials were reduced to millimeter-sized particles (average particle size of 2.1 ± 0.6 mm were obtained with D10 = 1.5 mm and D90 = 2.9 mm) using a low-speed granulator (Piovan, model: RN 166) for either compression-molding or extrusion processes.
2.2.2. Filament Extrusion
Extruded filaments with a diameter of 1.75 ± 0.10 mm were prepared using a Thermo Haake PTW16 intermeshing co-rotating twin-screw extruder (screw diameter = 16 mm; L/D ratio = 25; rod die diameter 1.80 mm, Thermo Electron, Karlsruhe, Germany). The processing temperature from feeding zone (zone 1) to the rod die (zone 5) was set respectively to 180, 205, 210, 215 and 220 °C, and the screw rotation speed was fixed at 5 rpm. The resulting filaments were used as feedstock materials for FDM.
2.2.3. Preparation of the Samples for electromagnetic interference shielding efficiency (EMI SE) Tests—Compression Molded
Compression molded (CM) specimens were prepared using a hot hydraulic press (Carver Laboratory) at 190 °C under a pressure of 3.9 MPa for 10 min and a cooling rate of 20 °C/min to obtain square plaques with dimensions 120 × 120 × 2.0 mm, which were later cut into specimens of 45 × 45 × 2 mm for testing.
2.2.4. Preparation of the 3D samples for EMI SE tests—FDM
3D manufactured specimens were obtained by a Sharebot Next Generation FDM machine (Sharebot NG, Nibionno, Italy). The open source software Slic3r was used to control and design the manufacturing process. 3D plaques with dimensions 45 × 45 × 2.0 mm were grown along three different directions: Horizontal alternate (H45), horizontal concentric (HC) and perpendicular concentric (PC), as schematized in Figure 2. The PC and HC components had their layers built along concentric lines from the outer to the inner direction, and all the layers were identically deposited on the top of the previous one. The H45 growing direction was built alternating the orientation of each layer resulting in a network structure. The 3D components were manufactured at nozzle temperature of 250 °C for ABS and ABS/GNP and 280 °C for ABS/CNT. In fact, due to high viscosity of ABS/CNT, composites were 3D-printed at 280 °C in order to guarantee a regular extrusion, and to avoid the clogging of the nozzle of the 3D printer machine as observed during processing at 250 and 260 °C.
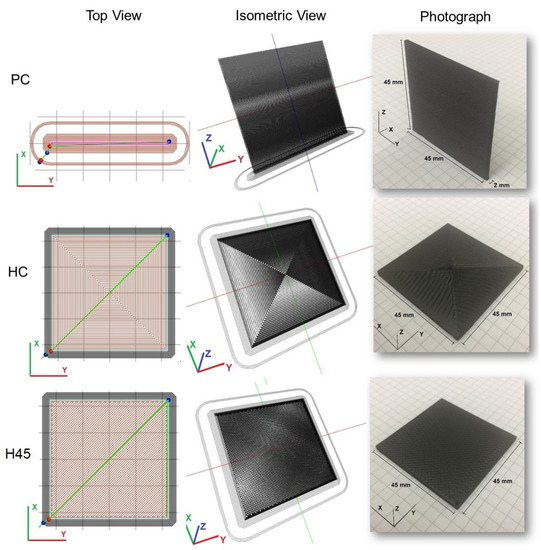
Figure 2.
Scheme of the fused deposition modeling (FDM) 3D manufactured samples for electromagnetic interference shielding efficiency (EMI SE) tests.
2.3. Testing
2.3.1. Rheological Analysis
Rheological properties of neat ABS and the nanocomposites were determined using an oscillatory rheometer, model Hybrid Discovery HR1 from TA Instrument Inc., with parallel plate geometry (25 mm). The analysis was performed at the temperatures of 250 and 280 °C in a frequency range of 0.1–100 Hz, in the linear viscoelastic regime under a 0.1% applied deformation.
2.3.2. Transmission Electron Microscopy
The microstructure of nanocomposites from compression molding (CM) and extruded filaments was observed by transmission electron microscopy (TEM), using a Philips® EM 400 T (Philips, Amsterdam, The Netherlands) transmission electron microscope. Ultrathin specimens of CM and filaments, having a trapezoidal shape with dimensions of about 200 × 150 μm, and were cut using a Leica EM UC7 ultramicrotome equipped with a diamond knife. The filament specimens were cut into thin slices perpendicular and parallel to the flow direction (see Figure 3). The thin specimens were deposited on a copper grid mesh covered by amorphous holey carbon film.
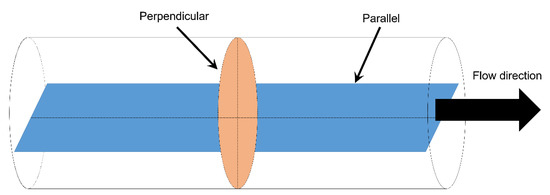
Figure 3.
Schematic of the perpendicular and parallel section in a filament for transmission electron microscopy (TEM) observation.
2.3.3. Electrical Conductivity Measurements
The electrical conductivity in the direct current (d.c.) of the investigated samples was assessed via a two-contacts method using a Metrohm-Autolab potentiostat, model PGSTAT302N operated in galvanostatic mode and a Keithley 6517A electrometer connected to Keithley 8009 test fixture (Keithley Instruments). Measurements were conducted at room temperature (23 ± 1 °C) and the electrical conductivity values represent an average of at least five repetitions.
2.3.4. Electromagnetic Interference and Dielectric Constant Measurements
EMI shielding efficiency of resulting polymer composites was tested in the frequency between 8.2 and 12.4 GHz using an Agilent Technology PNA series network analyzer (N5230C Agilent PNA-L, Agilent, Santa Clara, CA, USA) with a rectangular waveguide with cross-section of 23 × 10 mm. An incident EM wave within the specific frequency range was applied and both the transmitted and reflected waves were collected. The instrumentation measures the magnitude and phase of the scattering parameters (S-parameters) of the sample upon the incident wave whose power is denoted as Pi. The power of the transmitted and reflected waves are denoted as Pt and Pr, respectively. The attenuation of incident EM waves is expressed in decibels (dB) and it can be expressed as given in Equation (1).
The reflected and transmitted waves through the shielding material can be mathematically represented by the complex S-parameters named S11, S22, S12 and S21 which are correlated to the reflectance and the transmittance, respectively, according to Equations (2) and (3):
The absorbance (A), reflectivity (R), and transmittance (T) are correlated as in Equation (4):
Considering the propagation of an electromagnetic wave through an electrically conductive specimen, the tested specimen can either absorb (SEA) or reflect (SER) the incident electromagnetic waves. This can be estimated according to Equations (5) and (6).
The overall EMI SE is thus given by both SER and SEA as follows.
The dielectric constant and the loss factor of the samples were also determined using the Agilent 85071 software (Agilent, Santa Clara, USA). The software uses the Nicolson–Ross–Weir (NRW) algorithm and the S-parameters to calculate these values.
Measurements were conducted at 23 ± 1 °C, the reported spectra are representative of three replicated acquisitions for each specimen. The thickness of all the specimens was 2.0 mm.
3. Results and Discussion
3.1. Rheological Behavior
Rheology tests can provide useful information on the processability of the polymer and nanocomposites in the molten state. The complex viscosity at two different temperatures obtained from oscillatory rheometer is reported in Figure 4. At both 250 and 280 °C, ABS exhibited a pseudo-Newtonian behavior with a viscosity plateau at low frequency. The presence of nanofillers increased the viscosity in the low frequency region for both temperatures. A significant increase in viscosity was observed by the addition of carbon nanotubes. ABS/GNP nanocomposite showed a viscosity smaller than that of neat ABS at high frequencies for 250 °C. This behavior could be explained by the fact that the particle-particle interaction was not pronounced, and viscosity of ABS/GNP nanocomposites was decreased by a lubricating effect played by graphene nanoplatelets [23]. Similar behavior was also observed in a prior study on ABS composites containing carbon black (1–3 wt.%) or carbon nanotubes (up to 1 wt.%) [17]. Additionally, details about the melt flow index values of ABS, ABS/GNP and ABS/CNT at the same temperature were reported in our previous paper [21].
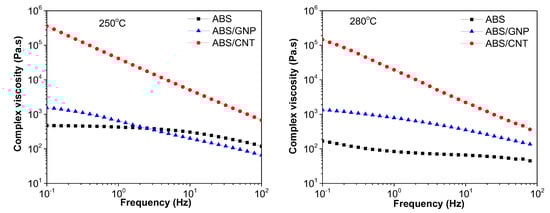
Figure 4.
Complex viscosity as a function of frequency at temperature of 250 and 280 °C; Acrylonitrile–butadiene–styrene; ABS/graphene nanoplatelets (GNP); ABS/carbon nanotubes (CNT)
The effect of graphene and carbon nanotubes on the storage modulus and loss modulus vs. frequency of the ABS can be observed in Figure 5. Both storage and loss of moduli increased significantly with graphene and carbon nanotubes at low frequencies. The dependence of storage modulus on frequency (slope of G’ vs. frequency at low frequencies) decreased with respect to the viscosity of materials for both temperatures. For instance, the slope of neat ABS and its nanocomposite decreased, respectively. The storage modulus of ABS/CNT nanocomposite was almost independent of frequency. This pseudo-solid-like behavior is attributed to the formation of a space-filling interconnected network of nanofillers [23].
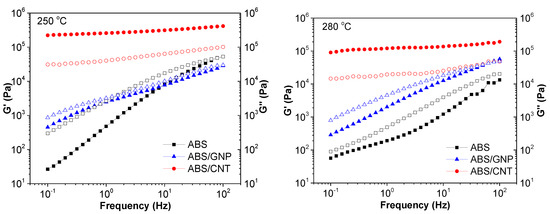
Figure 5.
Storage modulus (full symbols) and loss modulus (open symbols) of ABS, ABS/GNP and ABS/CNT nanocomposites at 250 and 280 °C.
A typical response for a polymer melt is that elastic behavior (storage modulus) dominates at high frequencies while viscous behavior (loss modulus) dominates at low frequencies. The cross-over point between storage and loss modulus can be defined depending on the molecular weight and molecular weight distribution of some linear polymers. Our result showed that neat ABS seemed to have a cross-over point at a frequency of about 100 Hz at 250 °C and at higher frequencies for 280 °C. ABS/GNP nanocomposite was likely to have cross-over point at frequencies of 100 Hz for both temperatures. No cross-over point for ABS/CNT suggested the presence of a rheological percolated network, and the effect of increasing temperature significantly reduced the storage modulus and loss modulus of the nanocomposite.
Analogous Cole-Cole plots are used to describe the viscoelastic properties of materials with a relaxation time distribution such as heterogeneous polymeric systems [24,25]. The real and imaginary components of viscoelastic properties are presented. In this study, we used Cole-Cole plots to investigate temperature-induced changes in the microstructure of nanocomposites and the results are reported in Figure 6 at two different temperatures (e.g., 250 and 280 °C) which were the two selected temperatures for the 3D printing process. It can be clearly observed that at 250 °C, the neat ABS presents a single relaxation arc. Due to a relatively higher amount of nanofillers, the linear region was evident for ABS/GNP and ABS/CNT nanocomposites. This suggests a restraint of long-range motion of polymer chains. In addition, our results do not show a significant effect of temperature in Cole-Cole plots.
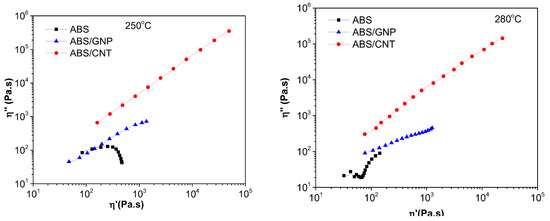
Figure 6.
Cole-Cole plots of imaginary viscosity (η’’) versus real viscosity (η’) of ABS, ABS/GNP and ABS/CNT nanocomposites at 250 and 280 °C.
From the data of the complex viscosity at different temperatures and frequencies, an activation energy (Eact) for the viscous flow of the investigated samples can be evaluated by using an Arrhenius type equation (Equation (6)), as previously reported [26,27].
where η0 is a pre-exponential factor, T is the absolute temperature for the rheological test and R is the universal gas constant of 8.314 J/molK. The value of intercept η0 formally represents complex viscosity at infinite temperature.
Table 1 reports the values of Eact for neat ABS and its nanocomposites at different frequencies. The average activation energy for the viscous flow of neat ABS was found to be 107 kJ/mol. With the addition of nanofillers, the decrease of the activation energy suggests that both the investigated carbonaceous nanofillers favor the flow of polymer chains in a pseudo-Newtonian zone. In the presence of graphene, due to the possible lubricating effect of this lamellar filler, a minimum of the activation energy can be observed. Moreover, lower wettability with the polymer matrix and more particle-particle interactions may occur [25]. It is also interesting to note that the activation energy evaluated in the melt flow process follows an opposite trend with 87, 94, and 117 kJ/mol, for ABS, ABS/GNP and ABS/CNT, respectively as shown in our previous paper [21]. In this latter case, the difference could be attributed to the higher shear rate with respect to the rheological plate-plate experiments, and to the consequent pseudoplastic behavior of polymer melt during extrusion where both GNP and CNT played the direct role of effectively reduction the viscosity in the molten flow. It is also interesting to underline that the data in Table 1 show the tendency of ABS to decrease the activation energy at higher frequencies, in contrast to ABS/GNP and ABS/CNT.

Table 1.
Activation energy (Eact) in kJ/mol at various frequencies at temperature 250 and 280 °C.
3.2. Transmission Electron Microscopy
Transmission electron microscopy was used to evaluate the quality of the dispersion and orientation of nanofillers in different types of processes (i.e., compression molding and extrusion). In Figure 7, TEM micrographs of compression molded samples are presented. An evident good dispersion of graphene and carbon nanotubes can be observed with no detectable aggregates. In addition, both graphene and carbon nanotubes seemed to be randomly oriented in the ABS matrix. In the ABS/GNP nanocomposite the presence of wrinkled graphene flakes can be observed, while in ABS/CNT the nanotubes entangled in interconnected structures can be detected.
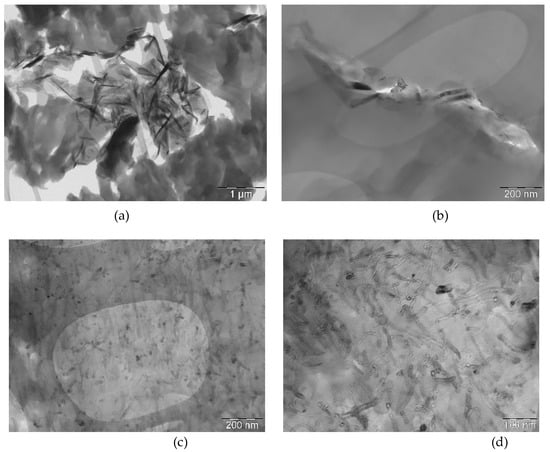
Figure 7.
TEM micrographs of compression molded (CM) nanocomposites: (a,b) ABS/GNP and (c,d) ABS/CNT.
The surface of nanocomposite filaments was investigated in two directions (i.e., perpendicular and parallel) to flow polymer direction in order to determine the orientation of nanofillers. Similar to the compression molding process, nanofillers without visible agglomerated structures were observed (see Figure 8 and Figure 9). Figure 8 presents the ABS/GNP nanocomposite filament, and graphene flakes were oriented along polymer flow in the extrusion direction.
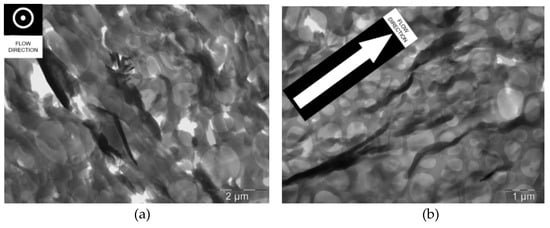
Figure 8.
TEM micrograph of ABS/GNP nanocomposite filament: (a) Perpendicular and (b) parallel.
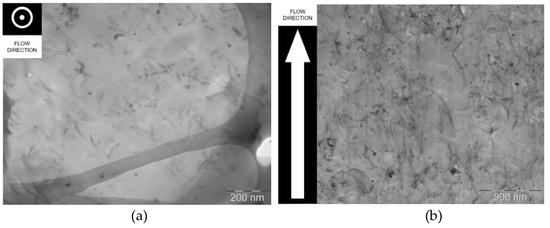
Figure 9.
TEM micrograph of ABS/CNT nanocomposite filament: (a) Perpendicular and (b) parallel.
On the other hand, nanotubes in the ABS matrix were randomly oriented from the extrusion process (see Figure 9b). Additional TEM images of the composites are given in the Supplementary Materials and they better illustrate the orientation and random distribution of the particles in the ABS/GNP and ABS/CNT composites, respectively (see Figure S1).
3.3. Electrical Conductivity
Table 2 summarizes the electrical conductivity and the apparent density of the compression molded (CM) and 3D manufactured (FDM) samples. The apparent density was estimated from direct measurement of weight square plaques and volume with size of 45 × 45 × 2 mm3.
Table 2.
Electrical conductivity and apparent density of ABS and its composites.
The presence of MWCNT considerably modified the electrical conductivity of the ABS/CNT composites. Electrical conductivities of about 10−3 S·cm−1 and 10−4 S·cm−1 were achieved for the polymer composites manufactured via compression molding and FDM, respectively. This observation suggests that the addition of 6 wt.% of MWCNT created an efficient conductive network across the ABS matrix offering sufficient mobility to the charge carriers. Differently, the same amount of graphene nanoplatelets did not modify the electrical conductivity of ABS matrix. Both ABS and ABS/GNP nanocomposites were non-conductive materials with electrical conductivity values in the range between 10−16 and 10−14 S·cm−1, independent of the fabrication route.
In the case of GNP-based nanocomposites, TEM images (see Figure 8) of extruded filaments indicate that graphene nanoplatelets were oriented along the polymer flow direction. The contacts created between graphene nanoplatelets were not enough to promote a percolative path in ABS/GNP composites resulting in a non-conductive composite. From Figure 9, it can be observed that MWCNTs were not oriented during the extrusion of the filaments. In fact, this filler remained well-distributed across the ABS matrix thus creating an efficient conductive percolated network for carrying charges across the material.
3.4. Electromagnetic Interference Shielding Efficiency
The graphs given in Figure 10 refer to the total electromagnetic interference shielding effectiveness of ABS and its composites prepared via compressed molding and FDM along the three different growing directions described in Figure 1.
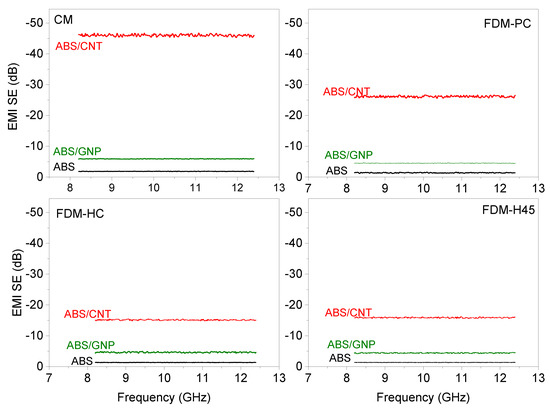
Figure 10.
Total EMI shielding effectiveness of ABS and composites: Compression molded (upper left graph), FDM-PC (upper right graph), FDM-HC (lower left graph) and FDM-H45 (lower right graph). The orientations PC, HC and H45 are described in Figure 2.
The total EMI SE is clearly a function of both the filler type as well as the fabrication route. The higher EMI SE was achieved by the ABS/CNT independent of the fabrication route. On the other hand, the highest EMI SE values were achieved for the samples manufactured via compression molding whereas 3D-printed parts attenuated the incident EM waves in the following order: FDM-PC > FDM-HC ≈ FDM-H45, independently from the composite formulation. For example, the total EMI SE of ABS/CNT composite processed via compression molding was around 45 dB, whereas the 3D-printed specimens of the same composite showed attenuation near 25 dB (PC direction) and 15 dB (HC and H45 direction). Differently, lower attenuations were observed for the ABS/GNP, approximately 5 dB, independently from the fabrication route. Considering that the EMI SE of electrically conductive polymer composites is improved from the increase in electrical conductivity [1,5,28], the higher values of EMI SE achieved for ABS/CNT composites with respect to other formulations are reasonable. Figure 11 compares the amount of the incident radiation attenuated by absorption and reflection by both ABS/GNP and ABS/CNT composites prepared by CM and FDM. The whole absorption and reflection spectra of tested samples are given in the Supplementary Materials (see Figures S2 and S3).
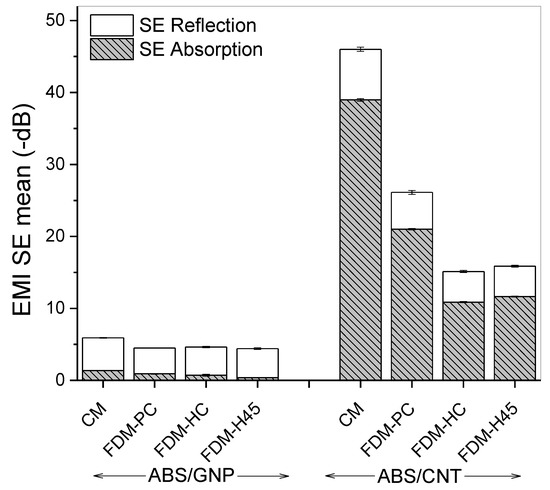
Figure 11.
Shielding effectiveness by absorption and reflection of ABS composites.
It is worthwhile to note that ABS/CNT attenuated the incident EM waves mostly by absorption (approximately by 80%). For ABS/GNP composites instead, despite the low total EMI SE, the incident EM was shielded by absorption and reflection mechanisms in similar amounts.
CM samples are assumed to have a negligible quantity of defects such as voids or holes, since the samples are well-compacted during the manufacturing process. In contrast, the deposition of layer-by-layer in FDM generates a microstructure with several material/air interfaces inside the 3D components. Moreover, in the case of 45 × 45 × 2 mm samples, less material was used to produce the specimens via FDM. In fact, compression molded specimens are denser, with an apparent density of 1.06 g/cm3 (Table 2). 3D-printed parts manufactured along H45 and HC directions had a density of approximately 0.95 g/cm3 whereas along the PC direction a density of 0.88 g/cm3 was measured. This indicates that, as expected, a higher porosity is generated by the FDM process. The different microstructure can therefore explain the lower EMI SE for components manufactured via FDM with respect to CM. The main differences between samples obtained by CM or FDM are represented by the distribution and dispersion of the fillers besides the fact that, due to their higher porosity, 3D-printed components offer less material to interact with the incident EM waves.
It is worthwhile noticing that 3D-printed ABS/CNT tested along the PC direction reached a total EMI SE near 25 dB representing an attenuation of the incident EM wave higher than 99.9% [8]. The magnitudes of the attenuation were approximately 20 dB lower than the respective CM sample (~ 45 dB) and 10 dB higher than the 3D manufactured samples along the HC and H45 directions (~ 15 dB). Interestingly, the lowest apparent density was measured for FDM-PC components and the electrical conductivities of ABS/CNT composites were just an order of magnitude different; near 10−3 S·cm−1 and 10−4 S·cm−1 for the ABS/CNT composites processed via CM and FDM, respectively. Table 3 presents a comparative overview on various polymer nanocomposites prepared for EMI SE investigations.
Table 3.
Comparative view of EMI SE of polymer nanocomposites investigated by various authors.
To better understand EMI shielding properties, Figure 12 and Figure 13 show the variation of the real (dielectric constant, ε′) and the imaginary (dielectric loss, ε″) parts of the complex dielectric function (or permittivity) for the investigated composites in the X-band microwave frequency range. The addition of 6 wt.% of MWCNT considerably modified the dielectric constant of ABS (Figure 11). In fact, an improved ε′ value was measured for the ABS/CNT and both CM and FDM-PC specimens exhibited, despite the frequency dependence, comparable ε′ behavior. The increase of ε′ is due to the presence of mobile charge carriers and related to the ability of the component in transport the charges from a point to another one across the component.
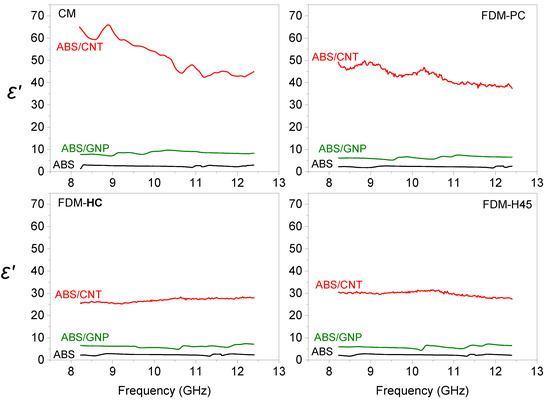
Figure 12.
Dielectric constant of ABS and its composites in the X-band frequency range; FDM-PC; FDM-HC; FDM-H45. The orientations PC, HC and H45 are described in Figure 2.

Figure 13.
Dielectric loss of ABS and its composites in the X-band frequency range.
As far as the dielectric loss (Figure 12) is concerned, ABS/CNT composites processed via compression molding exhibited the highest ε″ values over the X-band frequency range. The 3D-printed specimens showed improved dielectric loss values in this order: FDM-PC > FDM-H45 ≈ FDM-HC. The values of ε″ are related to the dissipation of the energy from the incident EM waves which are absorbed by the material and converted into heat [22]. Although not experimentally proven, the higher quantities of material/air interfaces created in the FDM-PC components could be the reason for their better ability of dissipating the energy from the incident EM waves. In fact, higher multiple internal interactions might have occurred, justifying the higher EMI shielding efficiencies for FDM-PC components even though they have a lower amount of material to interact with the EM radiation.
In summary, MWCNT is the most efficient carbon-based filler when an electrically conductive polymer composite with enhanced EMI shielding purposes is desired. In fact, low quantities of MWCNT are required to improve the mechanical, electrical and EMI properties of ABS based composites without compromising the rheological properties [17,18,19,20]. ABS polymer composites containing carbon black or xGnP could eventually reach total EMI SE higher than –20 dB corresponding to attenuations >99.9%, by simply increasing the content of these fillers. However, processing such formulations via FDM would be challenging due to changes on the rheological behavior. In addition, a recent study has shown the advantages of using carbon nanotubes over the traditional aluminum sheets in the development of polymer composites for EMI shielding purposes; energetic and economic savings are attributed to the polymer composites based on carbon nanotubes [36].
4. Conclusions
Multi-walled carbon nanotubes, and graphene nanoplatelets were added to an ABS polymer matrix at a fixed concentration of 6 wt.%. Extruded filaments of resulting polymer composites were obtained and used as feedstock for fused deposition modeling. 3D specimens were manufactured in different printing orientations. The electrical conductivity and the electromagnetic interference shielding efficiency of resulting 3D printed samples were assessed and compared with those of compressed molded specimens of the same composition. As expected, compression molded samples exhibited higher values, due to the continuity of material and the virtual absence of voids.
TEM images of the extruded filaments showed that graphene nanoplatelets, during the preparation of filaments, were oriented along the polymer flow direction, whereas multi-walled carbon nanotubes remained randomly dispersed in the polymer matrix. Polymer composites loaded with multi-walled carbon nanotubes showed higher electrical conductivity values and EMI shielding effectiveness.
The additive manufacturing method called fused deposition modeling has great potential for producing 3D printed components with high electromagnetic interference shielding efficiency. In fact, polymer composites based on ABS multi-walled carbon nanotube are able to attenuate 99.9% of the incident electromagnetic wave when 6 wt.% of MWCNT in the composite formulation are added.
Supplementary Materials
Supplementary materials can be found at http://www.mdpi.com/2076-3417/9/1/37/s1. Figure S1: TEM micrograph of filaments in parallel: ABS/GNP (a) and ABS/CNT (b) nanocomposites, Figure S2: EMI shielding by absorption of ABS and composites: compression moulded (upper left graph), FDM-PC (upper right graph), FDM-HC (lower left graph) and FDM-H45 (lower right graph), Figure S3: EMI shielding by reflection of ABS and composites: compression molded (upper left graph), FDM-PC (upper right graph), FDM-HC (lower left graph) and FDM-H45 (lower right graph).
Author Contributions
L.G.E., S.D., L.F. and A.P. conceived and designed the experiments; L.G.E., S.D., D.P.S., G.M.d.O.B. and B.G.S., performed the experiments; L.G.E., S.D., D.P.S., G.M.d.O.B., B.G.S., L.F., A.P. analyzed the data and wrote the paper.
Funding
This research was funded by the Brazilian research foundation CNPq “Conselho Nacional de Desenvolvimento Científico e Tecnológico”.
Acknowledgments
Authors are thankful to Versalis S.p.A. (Mantova, Italy) for donating ABS pellets for this work. Authors also wish to thank Sharebot S.r.l. (Nibionno, LC, Italy) for providing the prototype of the HT Ne×t Generation desktop 3D-printer. One author (S.D.) gratefully acknowledges financial support from AREAS+ EU Project of Erasmus Mundus Action 2 Programme.
Conflicts of Interest
The authors declare no conflict of interest.
References
- Tong, X.C. Advanced Materials for Electromagnetic Interference Shielding, 1st ed.; CRC Press: Boca Raton, FL, USA, 2009. [Google Scholar]
- Jda Silva, P.S.; Soares, B.G.; Livi, S.; Barra, G.M.O. Phosphonium—Based ionic liquid as dispersing agent for MWCNT in melt-mixing polystyrene blends: Rheology, electrical properties and EMI shielding effectiveness. Mater. Chem. Phys. 2017, 189, 162–168. [Google Scholar] [CrossRef]
- European Parliament, European Council, Directive 2014/30/EU: Electromagnetic Compatibility (Recast), 29.3. 2014, pp. 79–106. Available online: http://eur-lex.europa.eu/legal-content/ES/TXT/?uri=CELEX:32014L0030 (accessed on 20 December 2018).
- Chung, D.D.L. Carbon materials for structural self-sensing, electromagnetic shielding and thermal interfacing. Carbon 2012, 50, 3342–3353. [Google Scholar] [CrossRef]
- Thomassin, J.M.; Jérôme, C.; Pardoen, T.; Bailly, C.; Huynen, I.; Detrembleur, C. Polymer/carbon based composites as electromagnetic interference (EMI) shielding materials. Mater. Sci. Eng. R Rep. 2013, 74, 211–232. [Google Scholar] [CrossRef]
- Pawar, S.P.; Biswas, S.; Kar, G.P.; Bose, S. High frequency millimetre wave absorbers derived from polymeric nanocomposites. Polymer 2015, 84, 398–419. [Google Scholar] [CrossRef]
- Pang, H.; Xu, L.; Yan, D.X.; Li, Z.M. Conductive polymer composites with segregated structures. Prog. Polym. Sci. 2014, 39, 1908–1933. [Google Scholar] [CrossRef]
- Al-Saleh, M.H.; Sundararaj, U. A review of vapor grown carbon nanofiber/polymer conductive composites. Carbon 2009, 47, 2–22. [Google Scholar] [CrossRef]
- Kar, G.P.; Biswas, S.; Rohini, R.; Bose, S. Tailoring the dispersion of multiwall carbon nanotubes in co-continuous PVDF/ABS blends to design materials with enhanced electromagnetic interference shielding. J. Mater. Chem. A 2015, 3, 7974–7985. [Google Scholar] [CrossRef]
- Saini, P.; Choudhary, V.; Singh, B.P.; Mathur, R.B.; Dhawan, S.K. Enhanced microwave absorption behavior of polyaniline-CNT/polystyrene blend in 12.4–18.0 GHz range. Synth. Met. 2011, 161, 1522–1526. [Google Scholar] [CrossRef]
- Joseph, N.; Janardhanan, C.; Sebastian, M.T. Electromagnetic interference shielding properties of butyl rubber-single walled carbon nanotube composites. Compos. Sci. Technol. 2014, 101, 139–144. [Google Scholar] [CrossRef]
- Joseph, N.; Varghese, J.; Sebastian, M.T. Graphite reinforced polyvinylidene fluoride composites an efficient and sustainable solution for electromagnetic pollution. Compos. Part B Eng. 2017, 123, 271–278. [Google Scholar] [CrossRef]
- Li, L.; Li, S.; Shao, Y.; Dou, R.; Yin, B.; Yang, M. PVDF/PS/HDPE/MWCNTs/Fe3O4 nanocomposites: Effective and lightweight electromagnetic interference shielding material through the synergetic effect of MWCNTs and Fe3O4 nanoparticles. Curr. Appl. Phys. 2018, 18, 388–396. [Google Scholar] [CrossRef]
- Huang, C.Y.; Wu, C.C. The EMI shielding effectiveness of PC/ABS/nickel-coated-carbon-fibre composites. Eur. Polym. J. 2000, 36, 2729–2737. [Google Scholar] [CrossRef]
- Huang, C.-Y.; Pai, J.-F. Studies on processing parameters and thermal stability of ENCF/ABS composites for EMI shielding. J. Appl. Polym. Sci. 1997, 63, 115–123. [Google Scholar] [CrossRef]
- Rostami, A.; Masoomi, M.; Fayazi, M.J.; Vahdati, M. Role of multiwalled carbon nanotubes (MWCNTs) on rheological, thermal and electrical properties of PC/ABS blend. RSC Adv. 2015, 5, 32880–32890. [Google Scholar] [CrossRef]
- Schmitz, D.P.; Ecco, L.G.; Dul, S.; Pereira, E.C.L.; Soares, B.G.; Barra, G.M.O.; Pegoretti, A. Electromagnetic interference shielding effectiveness of ABS carbon-based composites manufactured via fused deposition modelling. Mater. Today Commun. 2018, 15. [Google Scholar] [CrossRef]
- Dorigato, A.; Moretti, V.; Dul, S.; Unterberger, S.H.; Pegoretti, A. Electrically conductive nanocomposites for fused deposition modelling. Synth. Met. 2017, 226, 7–14. [Google Scholar] [CrossRef]
- Dul, S.; Fambri, L.; Pegoretti, A. Fused deposition modelling with ABS-graphene nanocomposites. Compos. Part A Appl. Sci. Manuf. 2016, 85, 181–191. [Google Scholar] [CrossRef]
- Dul, S.; Pegoretti, A.; Fambri, L. Filaments Production and Fused Deposition Modelling of ABS/Carbon Nanotubes Composites. Nanomaterials 2018, 8, 49. [Google Scholar] [CrossRef]
- Dul, S.; Pegoretti, A.; Fambri, L. Effects of the Nanofillers on Physical Properties of Acrylonitrile-Butadiene-Styrene Nanocomposites: Comparison of Graphene Nanoplatelets and Multiwall Carbon Nanotubes. Nanomaterials 2018, 8, 674. [Google Scholar] [CrossRef] [PubMed]
- Kuester, S.; Demarquette, N.R.; Ferreira, J.C.; Soares, B.G.; Barra, G.M.O. Hybrid nanocomposites of thermoplastic elastomer and carbon nanoadditives for electromagnetic shielding. Eur. Polym. J. 2017, 88, 328–339. [Google Scholar] [CrossRef]
- Heuzey, A.G.M.; Ton-that, P.J.C.M. Morphological and rheological properties of PET/clay. Nanocomposites 2013, 59–74. [Google Scholar] [CrossRef]
- Wu, D.; Wu, L.; Sun, Y.; Zhang, M. Rheological Properties and Crystallization Behavior of Multi-Walled Carbon Nanotube/Poly(ε-caprolactone) Composites. J. Polym. Sci. Part B Polym. Phys. 2007, 3137–3147. [Google Scholar] [CrossRef]
- Abbasi, S.; Carreau, P.J.; Derdouri, A.; Moan, M. Rheological properties and percolation in suspensions of multiwalled carbon nanotubes in polycarbonate. Rheol. Acta 2009, 48, 943–959. [Google Scholar] [CrossRef]
- Fambri, L.; Bragagna, S.; Migliaresi, C. Biodegradable Fibers of Poly-l, dl-lactide 70/30 Produced by Melt Spinning. Macromol. Symp. 2006, 20–25. [Google Scholar] [CrossRef]
- MacDermott, C.P.; Shenoy, A.V. Selecting Thermoplastics for Engineering Applications; Second edition; Marcel Dekker, Inc.: New York, NY, USA, 1997. [Google Scholar]
- Yang, Y.; Gupta, M.C.; Dudley, K.L. Towards cost-efficient EMI shielding materials using carbon nanostructure-based nanocomposites. Nanotechnology 2007, 18, 345701. [Google Scholar] [CrossRef]
- Schmitz, D.P.; Silva, T.I.; Ramoa, S.D.A.S.; Barra, G.M.O.; Pegoretti, A.; Soares, B.G. Hybrid composites of ABS with carbonaceous fillers for electromagnetic shielding applications. J. Appl. Polym. Sci. 2018, 135. [Google Scholar] [CrossRef]
- Al-Saleh, M.H. Influence of conductive network structure on the EMI shielding and electrical percolation of carbon nanotube/polymer nanocomposites. Synth. Met. 2015, 205, 78–84. [Google Scholar] [CrossRef]
- Chizari, K.; Arjmand, M.; Liu, Z.; Sundararaj, U.; Therriault, D. Three-dimensional printing of highly conductive polymer nanocomposites for EMI shielding applications. Mater. Today Commun. 2017, 11, 112–118. [Google Scholar] [CrossRef]
- VSachdev, K.; Sharma, S.K.; Tomar, M.; Gupta, V.; Tandona, R.P. EMI shielding of MWCNT/ABS nanocomposites in contrast to graphite/ABS composites and MWCNT/PS nanocomposites. RSC Adv. 2016, 6, 45049–45058. [Google Scholar] [CrossRef]
- Jyoti, J.; Basu, S.; Pratap, B.; Dhakate, S.R. Superior mechanical and electrical properties of multiwall carbon nanotube reinforced acrylonitrile butadiene styrene high performance composites. Compos. Part B Eng. 2015, 83, 58–65. [Google Scholar] [CrossRef]
- King, J.A.; Pisani, W.A.; Klimek-mcdonald, D.R.; Perger, W.F.; Odegard, G.M. Shielding effectiveness of carbon-filled polycarbonate composites. J. Appl. Polym. Sci. 2015, 132. [Google Scholar] [CrossRef]
- Al-Saleh, M.H.; Saadeh, W.H.; Sundararaj, U. EMI shielding effectiveness of carbon based nanostructured polymeric materials: A comparative study. Carbon 2013, 60, 146–156. [Google Scholar] [CrossRef]
- Pourzahedi, L.; Zhai, P.; Isaacs, J.A.A.; Eckelman, M.J.J. Life cycle energy benefits of carbon nanotubes for electromagnetic interference (EMI) shielding applications. J. Clean. Prod. 2017, 142, 1971–1978. [Google Scholar] [CrossRef]
© 2018 by the authors. Licensee MDPI, Basel, Switzerland. This article is an open access article distributed under the terms and conditions of the Creative Commons Attribution (CC BY) license (http://creativecommons.org/licenses/by/4.0/).